Walter Energy — Merger or Acquisition (December 2010)
18 slides from Walter Energy's merger presentation, Dec 3, 2010
Slide 1: Creating The Leading Global, Publicly Traded, Pure-Play Metallurgical Coal Producer
Creating The Leading Global, Publicly Traded, “Pure-Play” Metallurgical Coal Producer December 3, 2010
Slide 2: Safe Harbor Statements
Safe Harbor Statements Except for historical information contained herein, the statements in this document are forward-looking and made pursuant to the safe harbor provisions of the Private Securities Litigation Reform Act of 1995 and may involve a number of risks and uncertainties. Forward-looking
Slide 3: Joe Leonard, Interim Chief Executive Officer, Walter Energy
Joe Leonard Interim Chief Executive Officer Walter Energy, Inc. 2
Slide 4: Combination Rationale
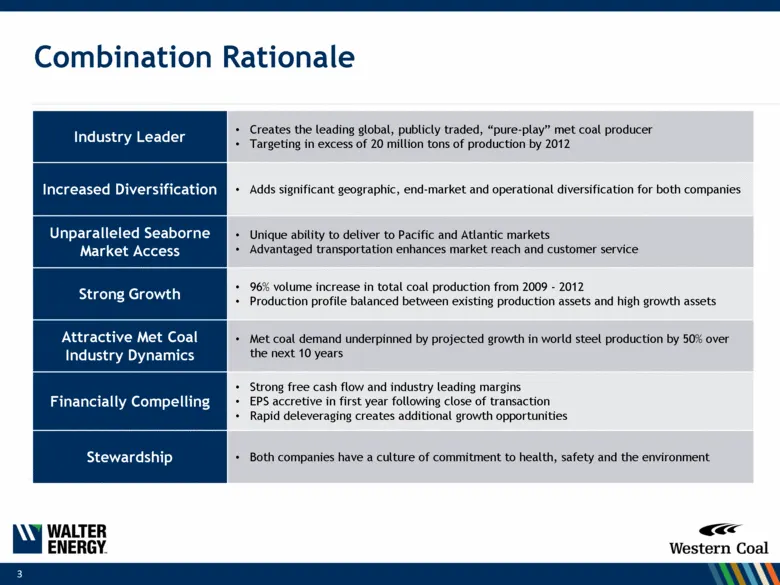
Combination Rationale Industry Leader Creates the leading global, publicly traded, “pure-play” met coal producer Targeting in excess of 20 million tons of production by 2012 Increased Diversification Adds significant geographic, end-market and operational diversification for both companies Unparalle
Slide 5: Transaction Structure
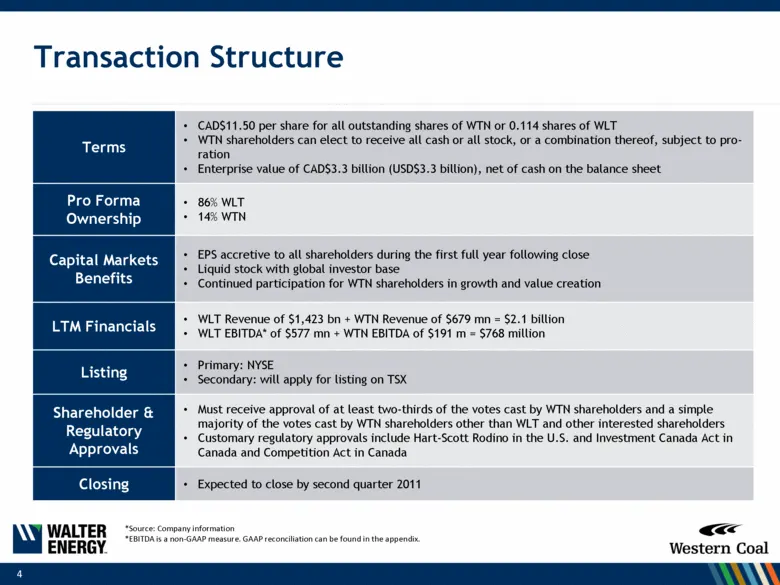
Transaction Structure Terms CAD$11.50 per share for all outstanding shares of WTN or 0.114 shares of WLT WTN shareholders can elect to receive all cash or all stock, or a combination thereof, subject to pro-ration Enterprise value of CAD$3.3 billion (USD$3.3 billion), net of cash on the balance shee
Slide 6: Walter and Western: An Ideal Partnership
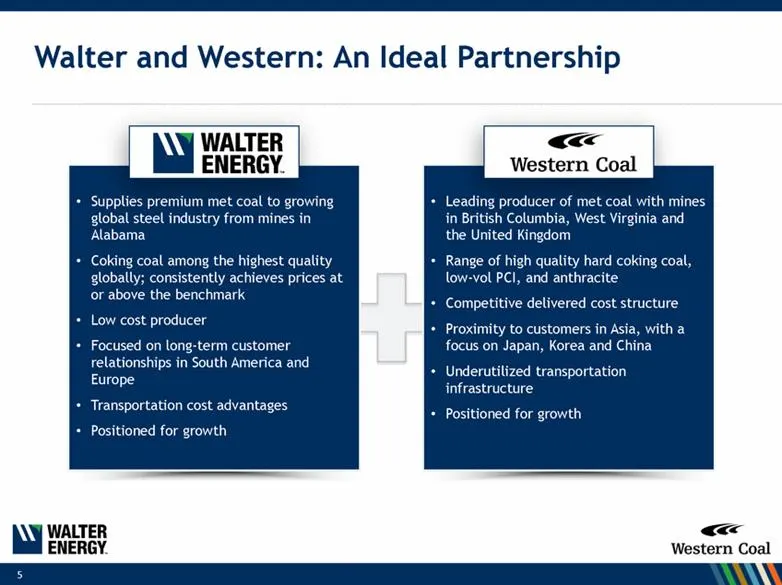
Walter and Western: An Ideal Partnership 5 Leading producer of met coal with mines in British Columbia, West Virginia and the United Kingdom Range of high quality hard coking coal, low-vol PCI, and anthracite Competitive delivered cost structure Proximity to customers in Asia, with a focus on Japan,
Slide 7: Increased Scale Creates A Global Leader
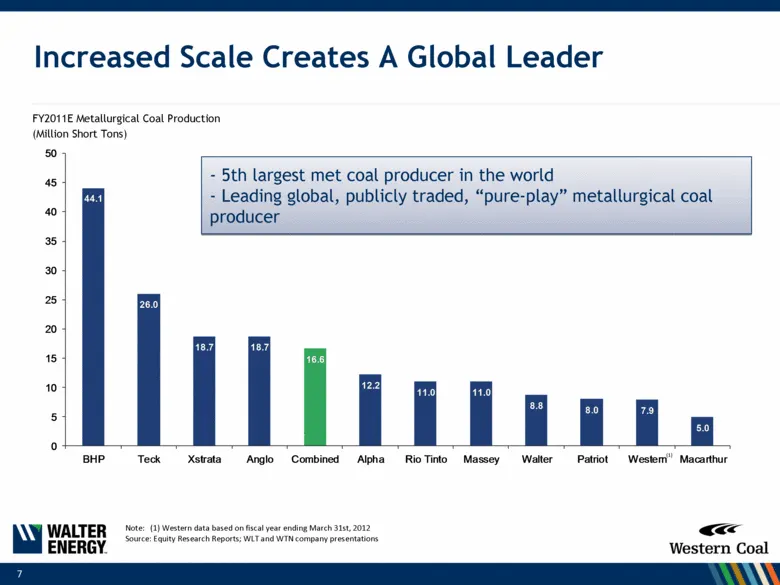
Increased Scale Creates A Global Leader 7 - 5th largest met coal producer in the world - Leading global, publicly traded, “pure-play” metallurgical coal producer FY2011E Metallurgical Coal Production (Million Short Tons) Note: (1) Western data based on fiscal year ending March 31st, 2012 Source: Equ
Slide 8: Keith Calder, President & CEO, Western Coal Corp.
8 Keith Calder President & Chief Executive Officer Western Coal Corp.
Slide 9: Asset & Geographic Diversification
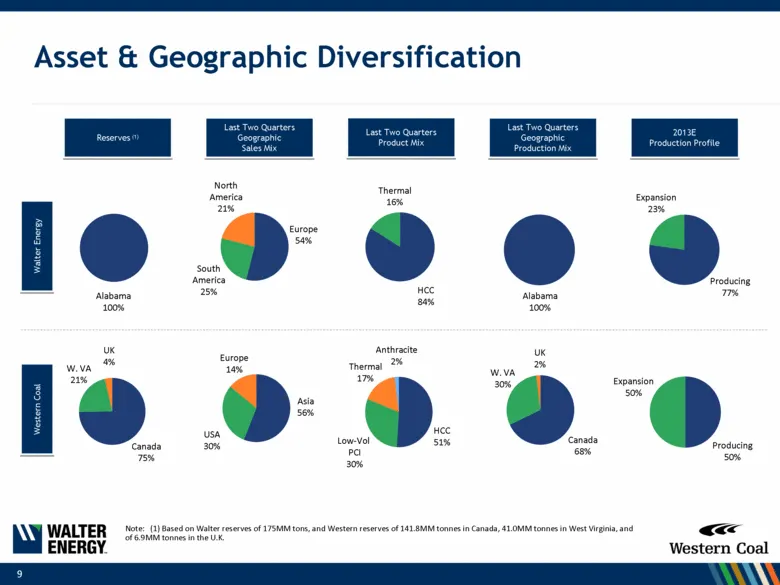
Asset & Geographic Diversification 9 Last Two Quarters Product Mix Last Two Quarters Geographic Sales Mix Reserves (1) Last Two Quarters Geographic Production Mix 2013E Production Profile Walter Energy Western Coal Alabama 100% North America 21% South America 25% Europe 54% Thermal 16% HCC 84% Alaba
Slide 10: Attractive Industry Dynamics
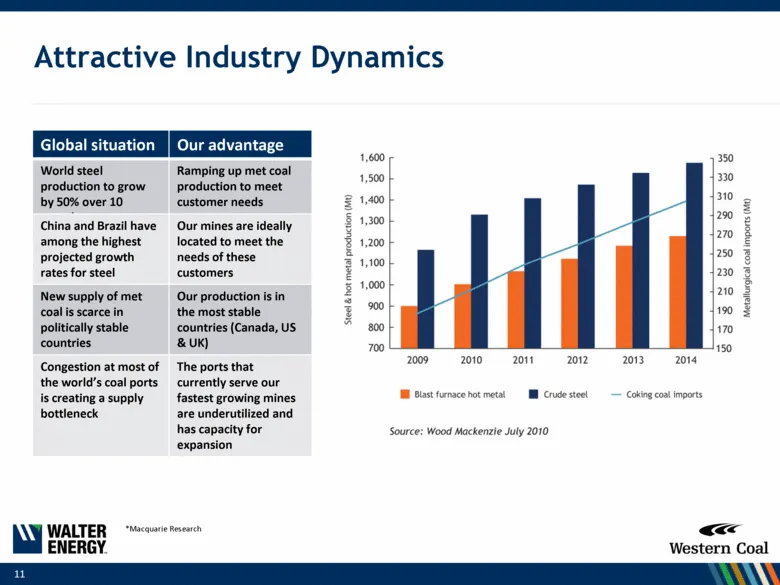
Attractive Industry Dynamics 11 Global situation Our advantage World steel production to grow by 50% over 10 years* Ramping up met coal production to meet customer needs China and Brazil have among the highest projected growth rates for steel Our mines are ideally located to meet the needs of these
Slide 11: Strong Growth Opportunities
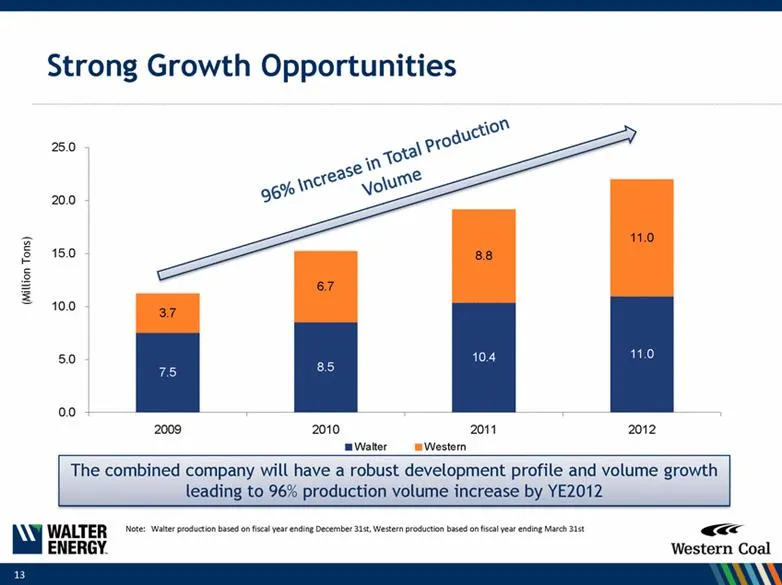
Strong Growth Opportunities The combined company will have a robust development profile and volume growth leading to 96% production volume increase by YE2012 96% Increase in Total Production Volume 13 (Million Tons) Note: Walter production based on fiscal year ending December 31st, Western productio
Slide 12: Joe Leonard, Interim Chief Executive Officer, Walter Energy
Joe Leonard Interim Chief Executive Officer Walter Energy, Inc. 14
Slide 13: Leading Financial Profile Among U.S. Peers
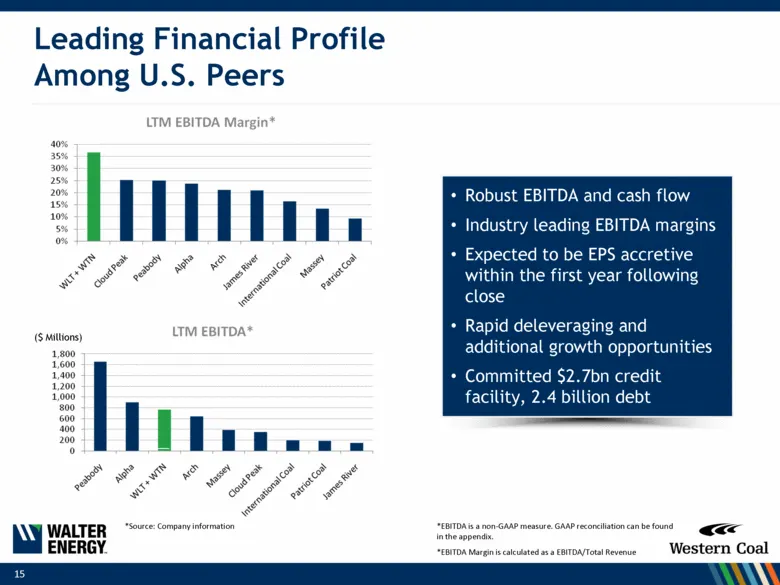
Leading Financial Profile Among U.S. Peers Robust EBITDA and cash flow Industry leading EBITDA margins Expected to be EPS accretive within the first year following close Rapid deleveraging and additional growth opportunities Committed $2.7bn credit facility, 2.4 billion debt *Source: Company informa
Slide 14: Financing Overview
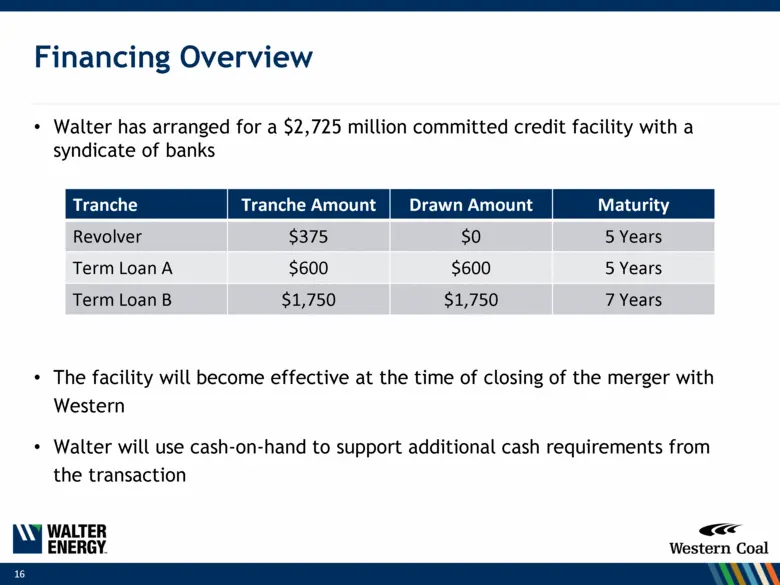
Financing Overview Walter has arranged for a $2,725 million committed credit facility with a syndicate of banks 16 Tranche Tranche Amount Drawn Amount Maturity Revolver $375 $0 5 Years Term Loan A $600 $600 5 Years Term Loan B $1,750 $1,750 7 Years The facility will become effective at the time of c
Slide 15: Right Transaction at the Right Time
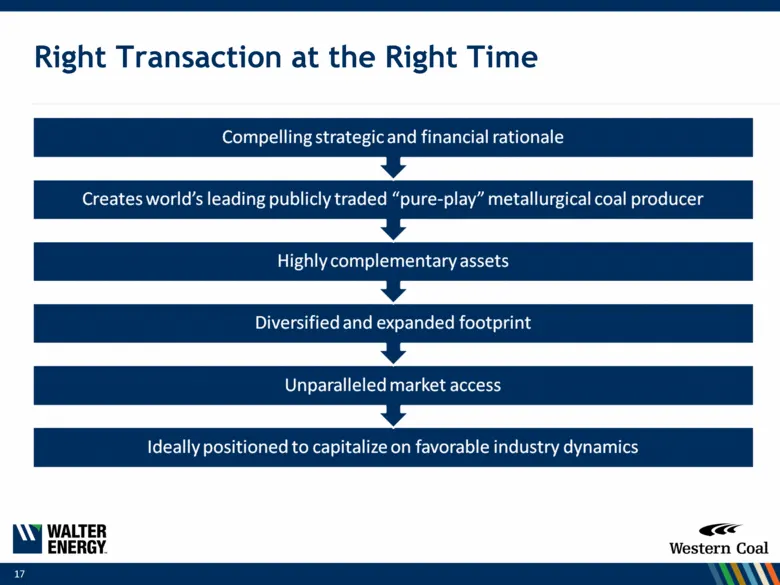
Right Transaction at the Right Time 17
Slide 16: Appendix
WALTER ac ENERGY. Western Coal APPENDIX
Slide 17: Walter Energy GAAP to Non-GAAP Reconciliation
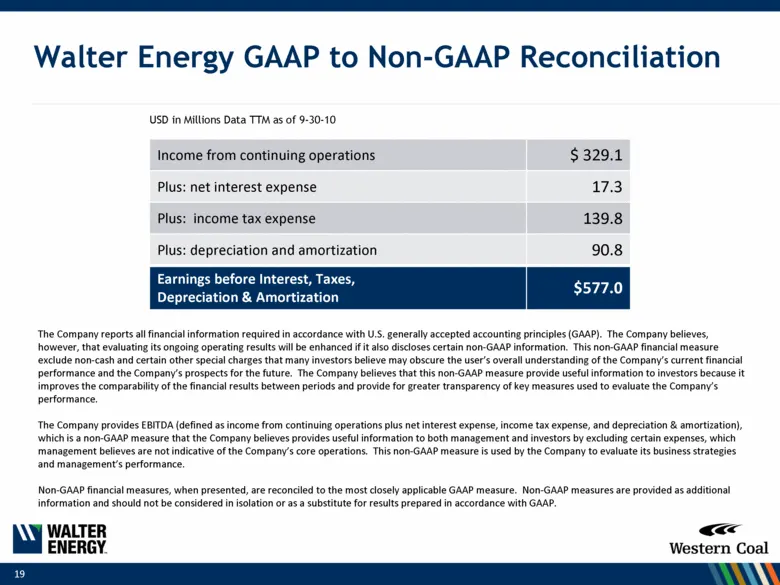
Walter Energy GAAP to Non-GAAP Reconciliation 19 Income from continuing operations $ 329.1 Plus: net interest expense 17.3 Plus: income tax expense 139.8 Plus: depreciation and amortization 90.8 Earnings before Interest, Taxes, Depreciation & Amortization $577.0 USD in Millions Data TTM as of 9-30-1
Slide 18: Creating The Leading Global, Publicly Traded, Pure-Play Metallurgical Coal Producer
Creating The Leading Global, Publicly Traded, “Pure-Play” Metallurgical Coal Producer December 3, 2010
Source: SEC EDGAR · 8-K filed Dec 3, 2010
More decks from Walter Energy Inc
 Debt Investor Presentation (July 2015)64 slides · Jul 15, 2015
 Clarkson Capital Markets Coal Roundtable (June 2014)25 slides · Jun 5, 2014
 Cowen and Company Global Metals, Mining and Materials Conference 201332 slides · Nov 12, 2013
 Proxy Contest (April 2013)37 slides · Apr 5, 2013
 Proxy Contest (March 2013)38 slides · Mar 26, 2013
 Proxy Contest (March 2013)27 slides · Mar 18, 2013