Lecroy — Investor Presentation (November 2010)
26 slides from Lecroy's investor presentation, Nov 9, 2010
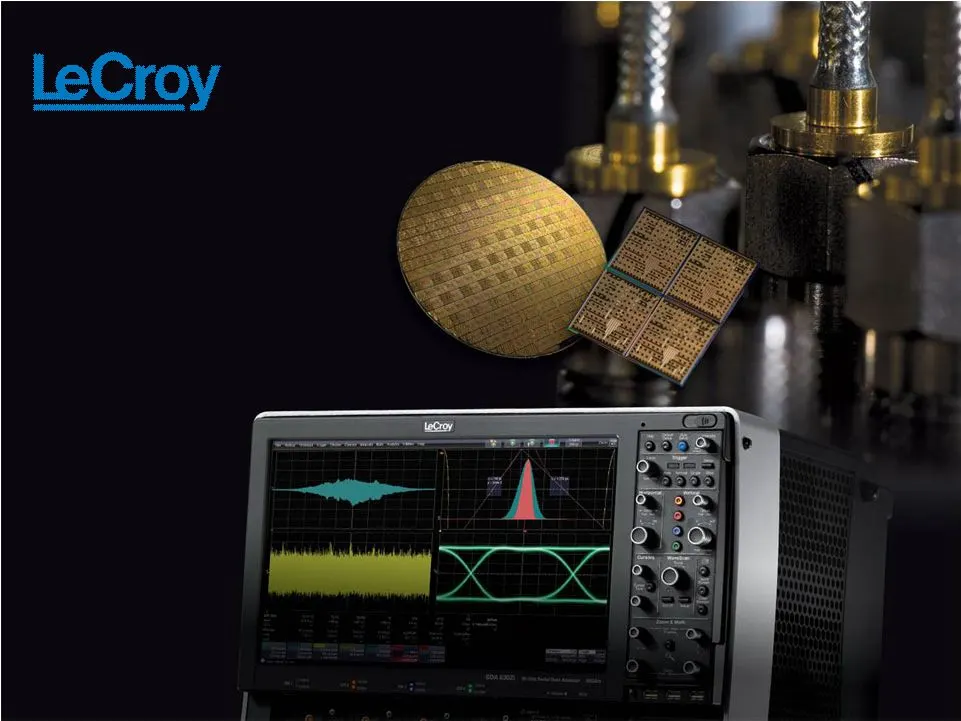
Slide 1: Company Overview
Company Overview Exhibit 99.1 Company Overview November 2010 November 2010

Slide 2: Safe Harbor Statement and Presentation of non-GAAP Financial Information
2 LeCroy Overview November 2010 2 Safe Safe Harbor Harbor Statement Statement and and Presentation Presentation o f o f non - GAAP non - GAAP Financial Financial Information Information The information in this presentation contains forward-looking statements, including those relating to plans and ex
Slide 3: LCRY Investor Highlights
LeCroy Overview November 2010 3 LCRY Investor Highlights LCRY Investor Highlights Accelerating Accelerating demand demand for for high-bandwidth high-bandwidth oscilloscopes oscilloscopes driven driven by by high-speed, next-generation data communication networks high-speed, next-generation data com
Slide 4: LeCroy Business Profile
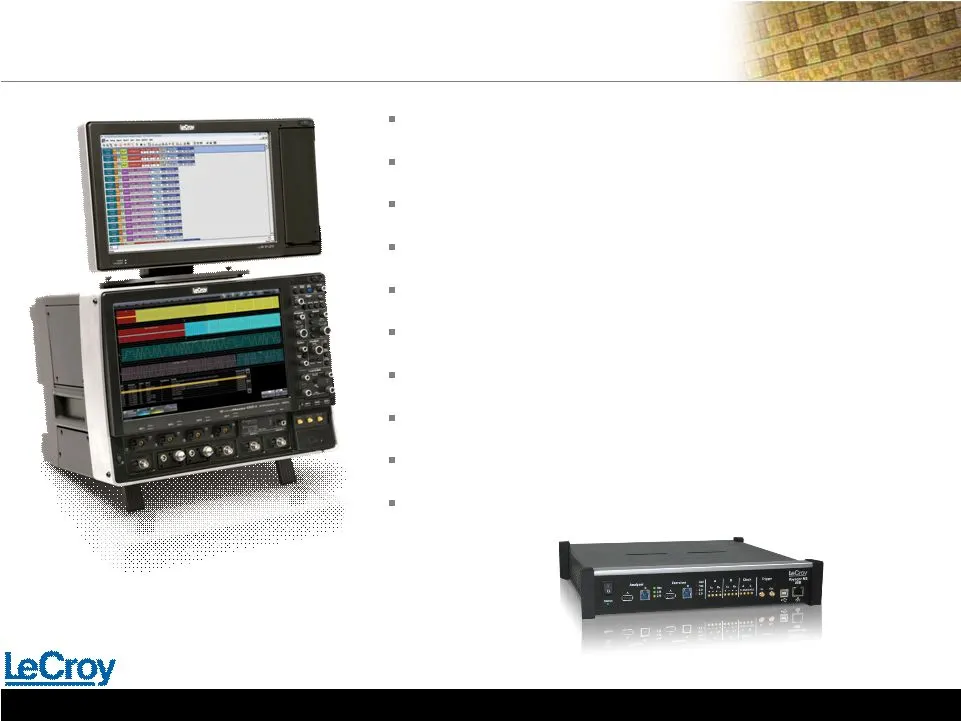
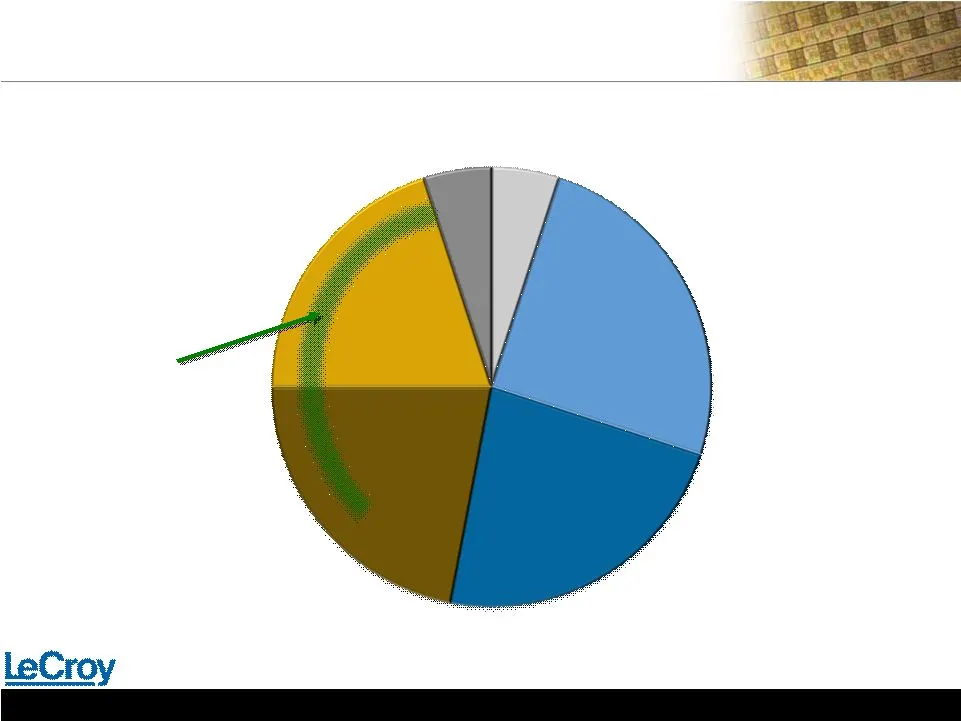
LeCroy Overview November 2010 4 LeCroy LeCroy Business Profile Business Profile Digital Oscilloscopes Digital Oscilloscopes Protocol Analyzers Protocol Analyzers $156M Annual Sales (run - rate Sep 2010) Digital Oscilloscopes (~80% of Sales) Protocol Analyzers (~20% of Sales) ~425 Employees (~$370K S
Slide 5: Oscilloscopes and Protocol Analyzers: Engineer's Window into the Circuit
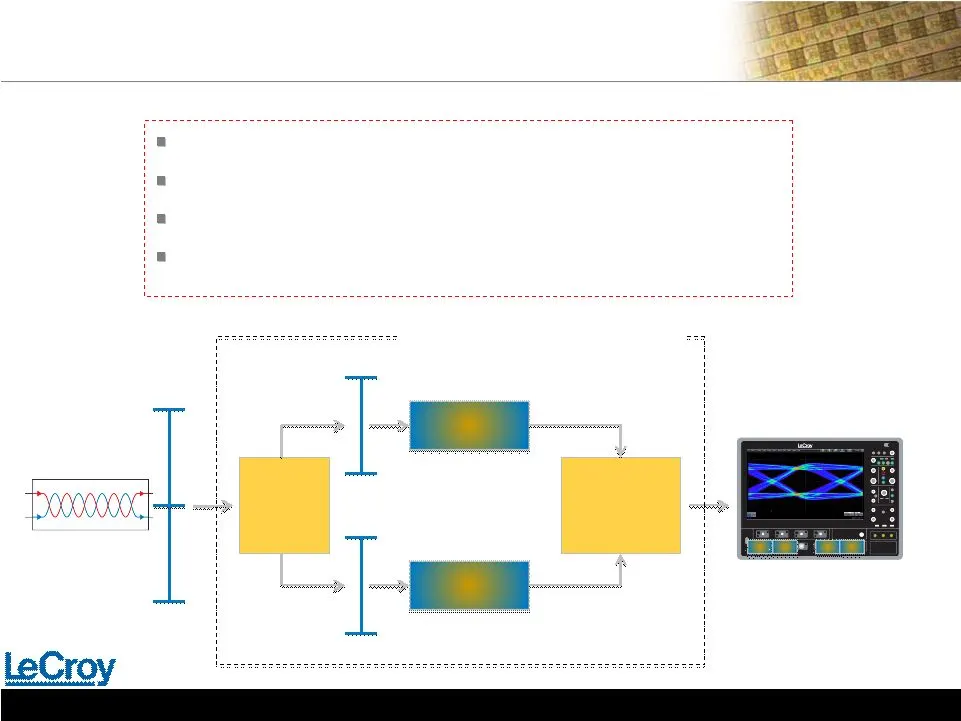
LeCroy Overview November 2010 5 LeCroy Customers: Electronic Design Engineers Oscilloscopes and Protocol Analyzers: Engineer’s “Window” into the Circuit Connects to an electronic circuit via an electrical “probe” or cable Designers can visually observe how electronic signals change as a function of
Slide 6: High-Speed Data Transport Drives Our Business
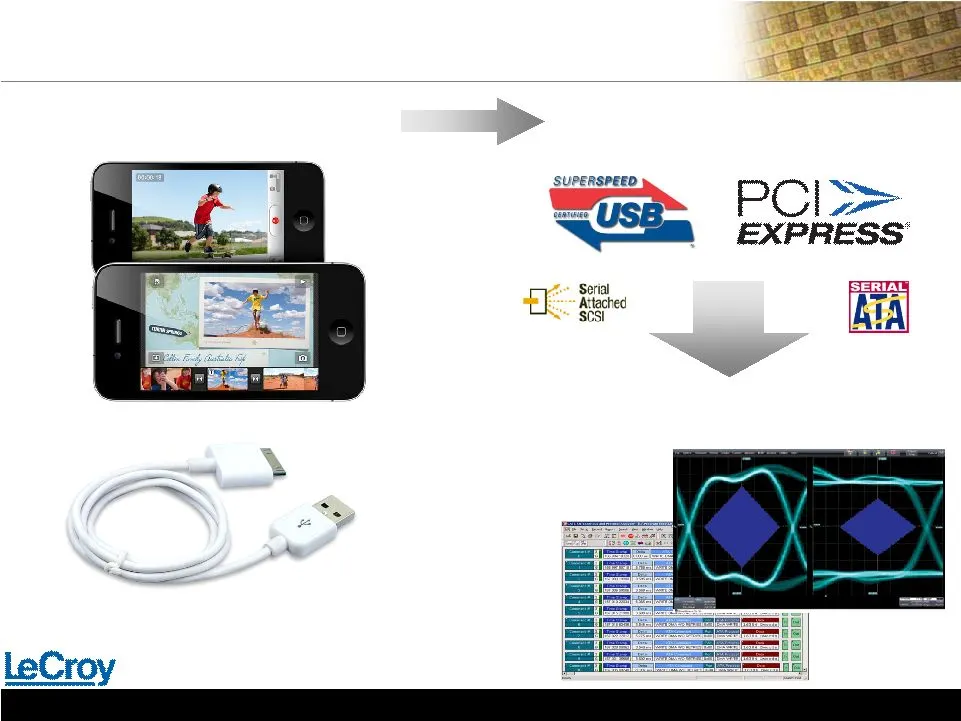
LeCroy Overview November 2010 6 High-Speed Data Transport Drives Our Business High-Speed Data Transport Drives Our Business Digital Media Explosion Digital Media Explosion Serial Data Standards Serial Data Standards Complex Electrical Signals: Complex Electrical Signals: “ Signal Integrity ” Complex
Slide 7: Trends Driving Data Communications
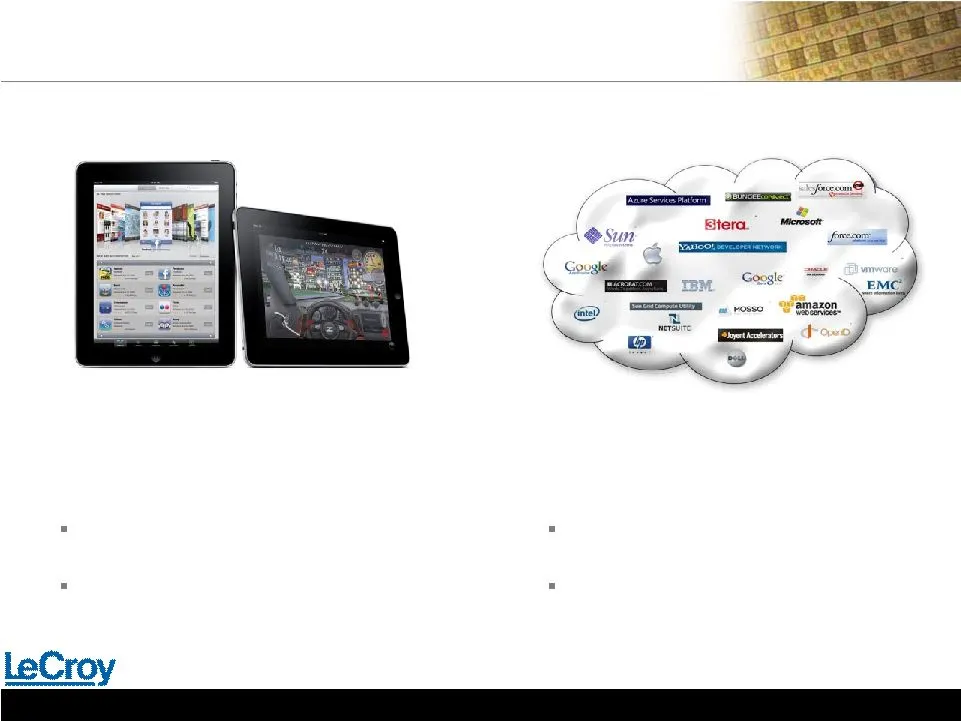
LeCroy Overview November 2010 7 Trends Driving Data Communications Trends Driving Data Communications Exponentially Increasing Design Challenges Exponentially Increasing Design Challenges Cloud Computing Cloud Computing Mobile Devices Mobile Devices Designers can buy OTS IP to provide high speed dat
Slide 8
Slide 9: LeCroy Builds its Reputation at the High End
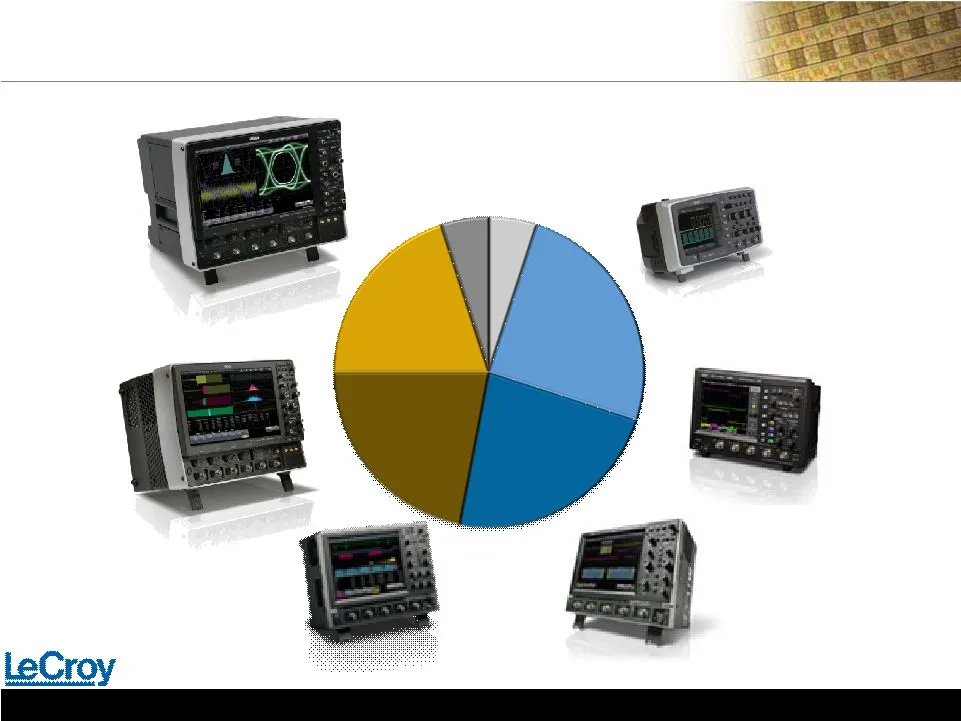
LeCroy Overview November 2010 9 LeCroy Builds its Reputation at the High End LeCroy Builds its Reputation at the High End Drive Profit in the Midrange, Build User Base at Low End Drive Profit in the Midrange, Build User Base at Low End High End High End Bench Bench Lab Lab Economy Economy $2K $2K $5
Slide 10: LeCroy is the Performance Leader with the Highest Bandwidth Oscilloscopes
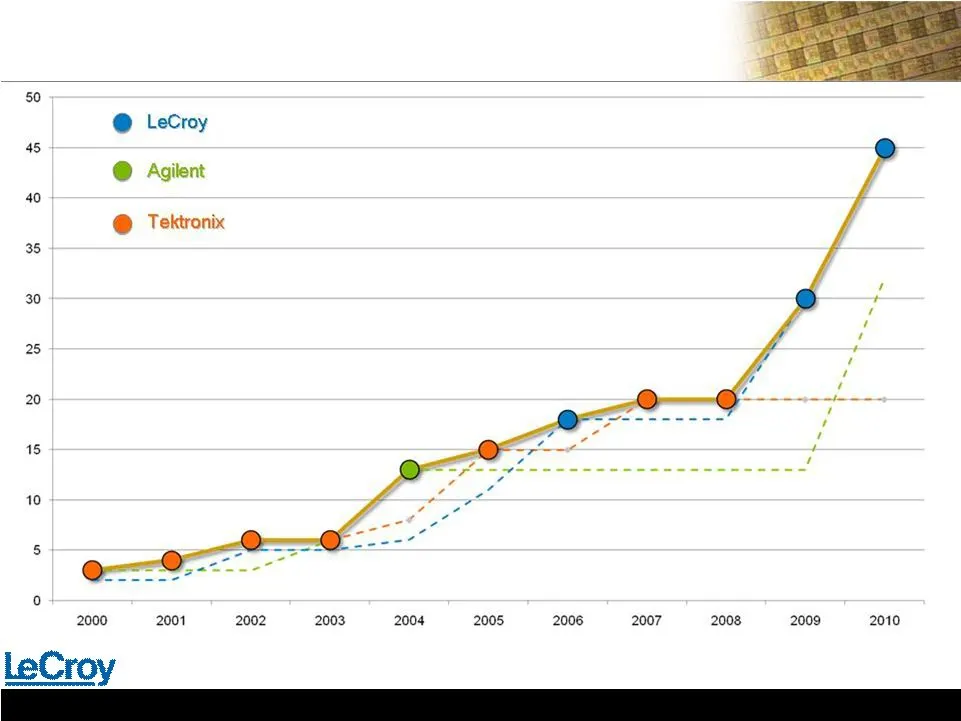
LeCroy Overview November 2010 10 LeCroy LeCroy is the Performance Leader with the is the Performance Leader with the Highest Bandwidth Oscilloscopes Highest Bandwidth Oscilloscopes
Slide 11
Slide 12
Slide 13
Slide 14: Innovative Industry-Leading Products
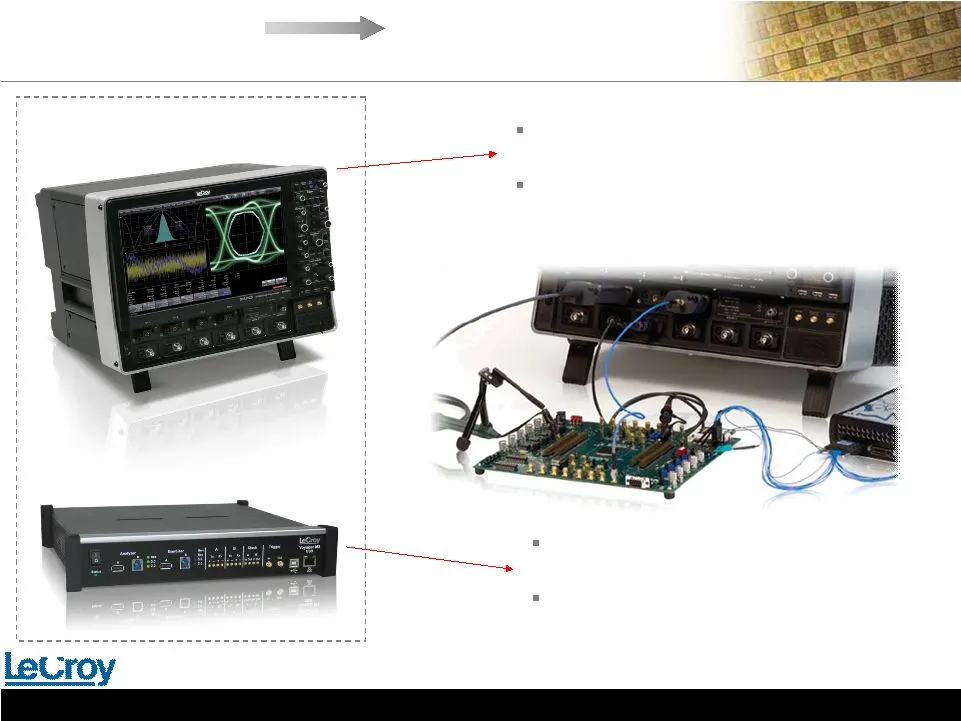
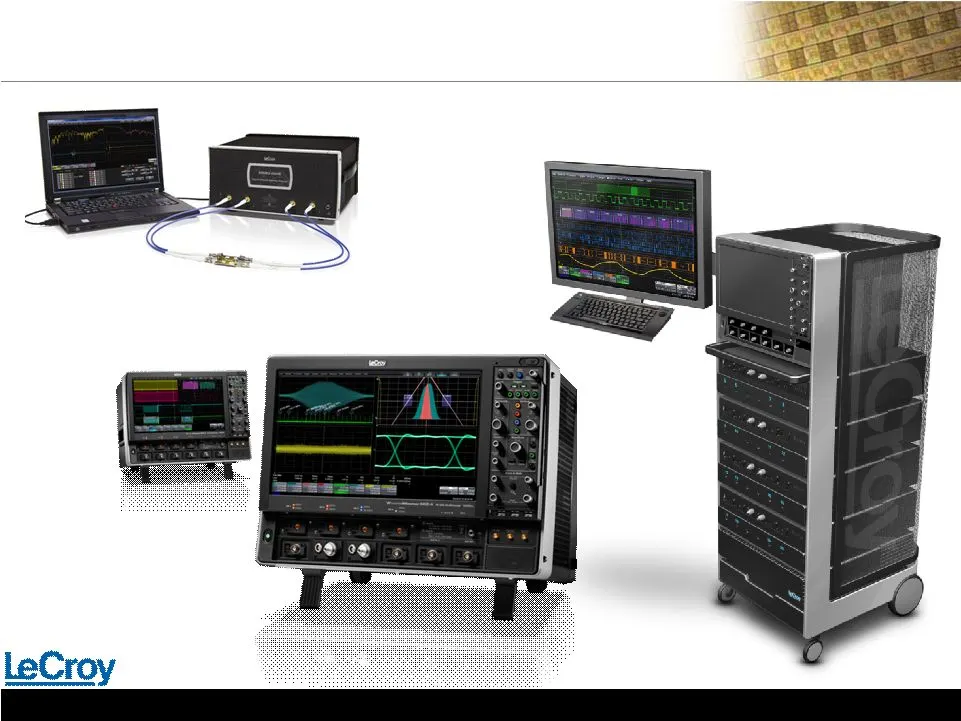
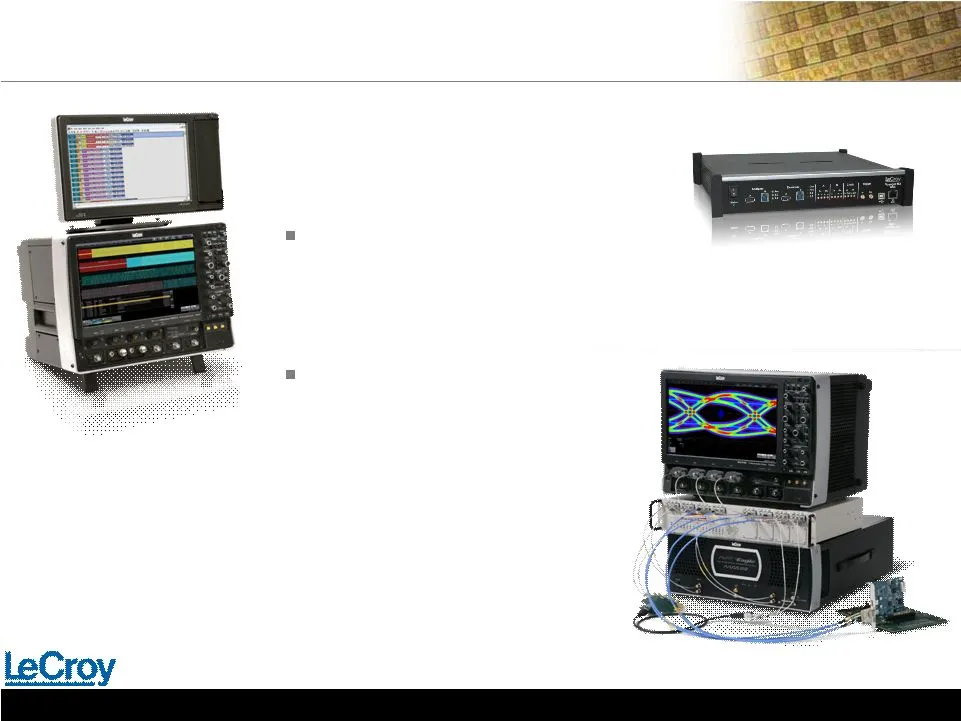
LeCroy Overview November 2010 12 Innovative Industry-Leading Products Innovative Industry-Leading Products New Models Launched October 1, 2010 New Models Launched October 1, 2010 SPARQ SPARQ Network Analyzer Solution Network Analyzer Solution LabMaster LabMaster Modular Multi-Channel System WaveMast
Slide 15: Market Share Leader in Serial Data Protocol Analyzers
LeCroy Overview November 2010 13 Market Share Leader in Serial Data Protocol Analyzers Market Share Leader in Serial Data Protocol Analyzers Leading Edge Involvement with new protocols: Keeps us ahead in oscilloscopes Superior Profitability significant contribution to ongoing cash generation
Slide 16: Diverse Blue Chip Customer Base
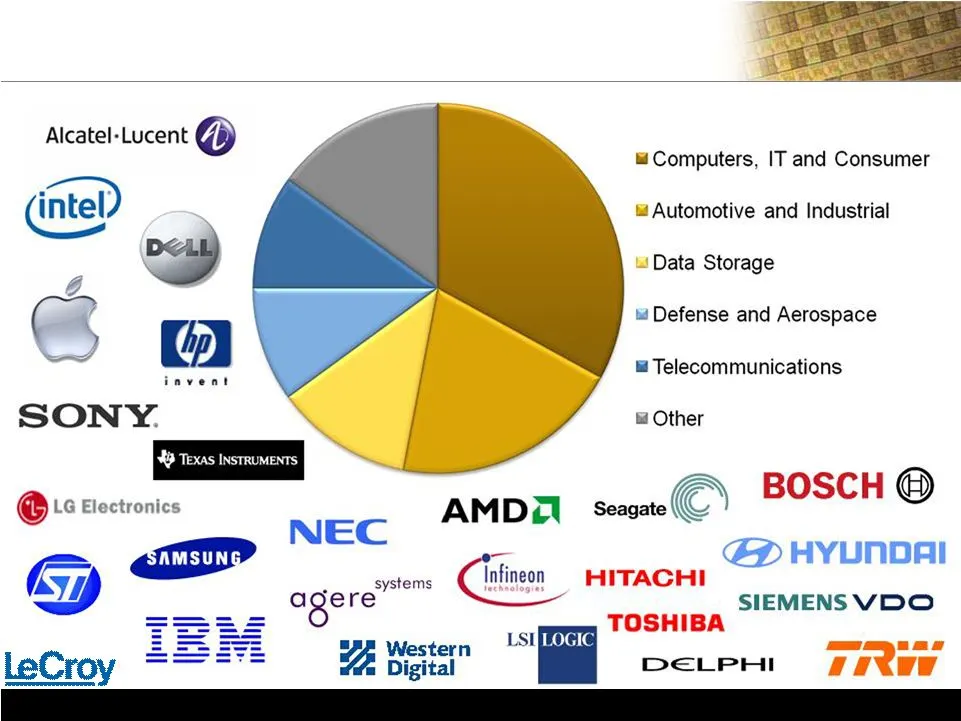
LeCroy Overview November 2010 14 Diverse Blue Chip Customer Base Diverse Blue Chip Customer Base No Customer or Distributor greater than 3% of Sales No Customer or Distributor greater than 3% of Sales
Slide 17: Seasoned Direct & Indirect Sales Channels
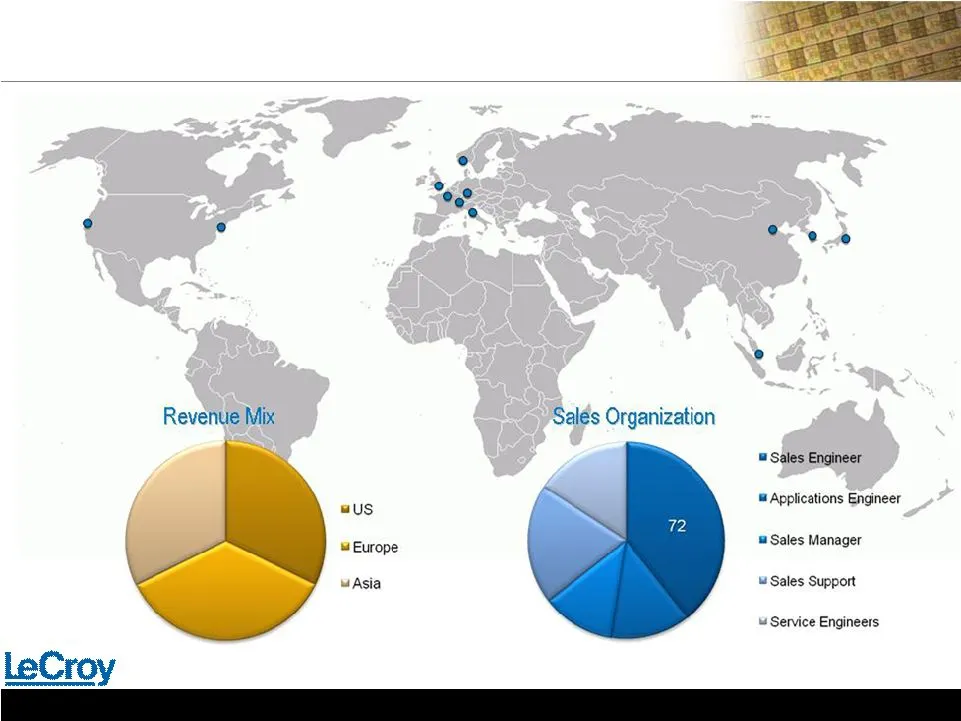
LeCroy Overview November 2010 15 Seasoned Direct & Indirect Sales Channels Seasoned Direct & Indirect Sales Channels
Slide 18: Total Revenue: 40% growth to $39.1M: Sep 2010
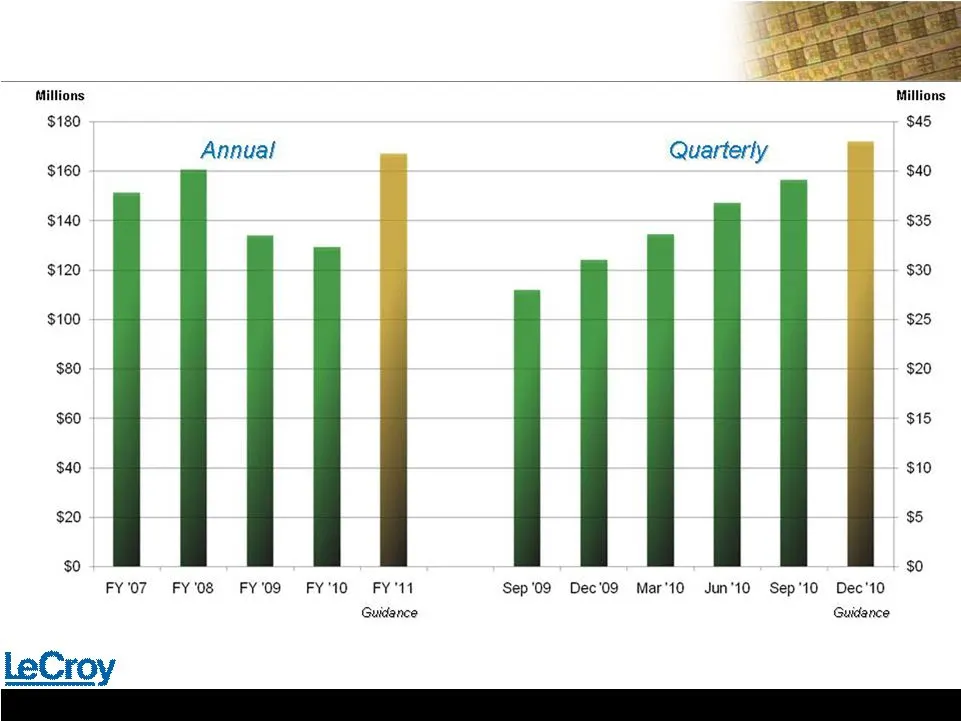
LeCroy Overview November 2010 16 Total Revenue: 40% growth to $39.1M: Sep 2010 Total Revenue: 40% growth to $39.1M: Sep 2010
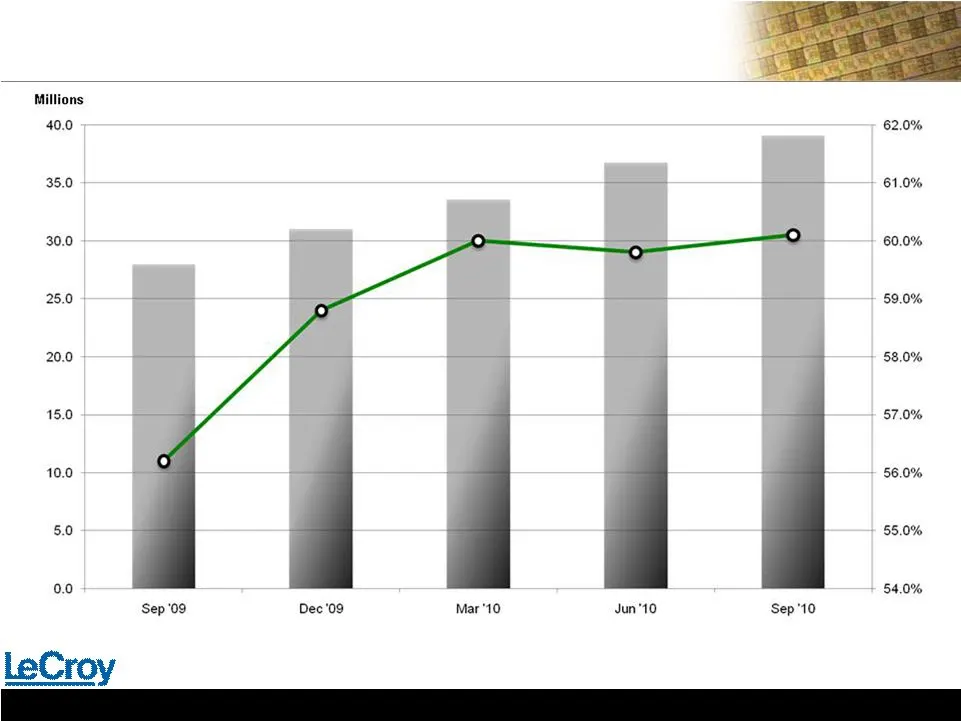
Slide 19: Quarterly Revenue and Gross Margins
LeCroy Overview November 2010 17 Quarterly Revenue and Gross Margins Quarterly Revenue and Gross Margins * Non-GAAP
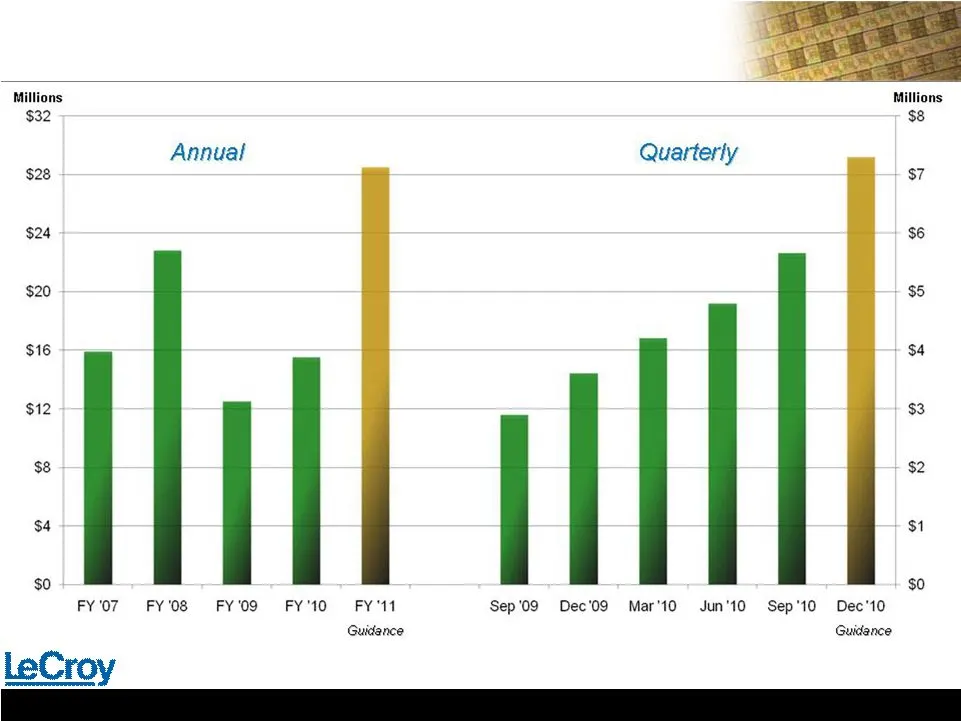
Slide 20: Operating Leverage Drives EBITDA Expansion
LeCroy Overview November 2010 18 Operating Leverage Drives EBITDA Expansion Operating Leverage Drives EBITDA Expansion * Non-GAAP
Slide 21: Target Business Model
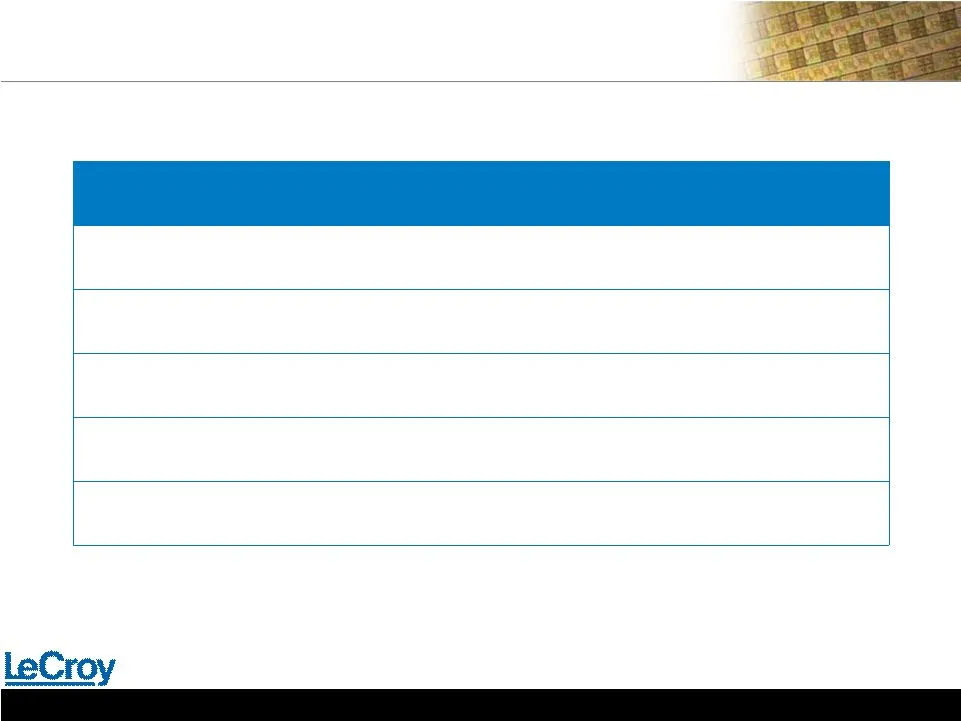
Sep '09 Dec '09 Mar '10 Jun '10 Sep '10 Target LeCroy Overview November 2010 19 Target Business Model Target Business Model Accelerating Sales, Continuously Improving Operating Margins Accelerating Sales, Continuously Improving Operating Margins Guidance Guidance Non-GAAP Dec '10-G Sales Sales 28.0

Slide 22: Equity Offering Summary: Nov 3, 2010
LeCroy Overview November 2010 20 Equity Offering Summary: Nov 3, 2010 Equity Offering Summary: Nov 3, 2010 Issuer: Symbol: Use of Proceeds: Security Type: Pricing Date: Offering Price: Offering Price: Offering Size: Offering Size: Net Proceeds (approx): Net Proceeds (approx): Shares Outstanding (app
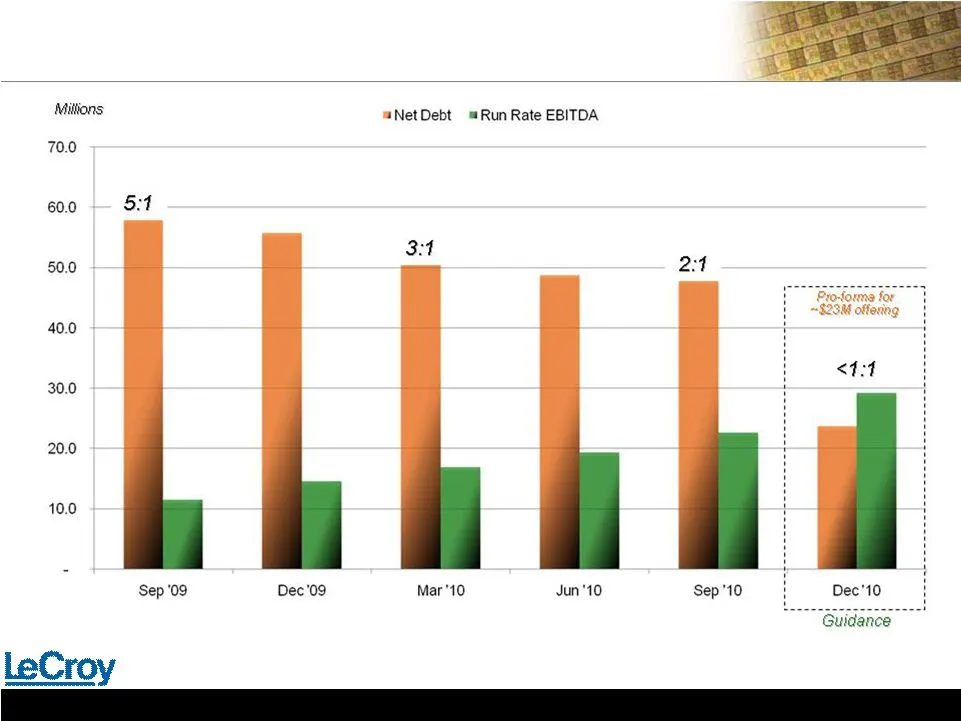
Slide 23: Equity Offering Dramatically Improves Balance Sheet
LeCroy Overview November 2010 21 Equity Offering Dramatically Improves Balance Sheet Equity Offering Dramatically Improves Balance Sheet * Non-GAAP
Slide 24: LCRY Investor Highlights
LeCroy Overview November 2010 22 LCRY Investor Highlights LCRY Investor Highlights Accelerating Accelerating demand demand for for high-bandwidth high-bandwidth oscilloscopes oscilloscopes driven driven by by high-speed, next-generation data communication networks high-speed, next-generation data co

Slide 25: Non-GAAP Reconciliation
23 23 LeCroy Overview November 2010 Non-GAAP Reconciliation Non-GAAP Reconciliation Gross Profit Operating Income and EBITDA ($ in thousands) Oct 3, Jan 2, Apr 3, July 3, Oct 20, 2009 2010 2010 2010 2010 (14 weeks) (13 weeks) (13 weeks) (13 weeks) (13 weeks) GAAP gross profit, as reported 15,667 $ 1
Slide 26: November 2010
Investor Presentation Investor Presentation November 2010 November 2010
Source: SEC EDGAR · 8-K filed Nov 9, 2010