Cohu, Inc. · NASDAQ:COHU
Cohu — Investor Presentation
20 slides from Cohu's investor presentation

Slide 1: Cohu Investor Presentation
COHU INVESTOR PRESENTATION © Cohu, Inc. All rights reserved. Page 1
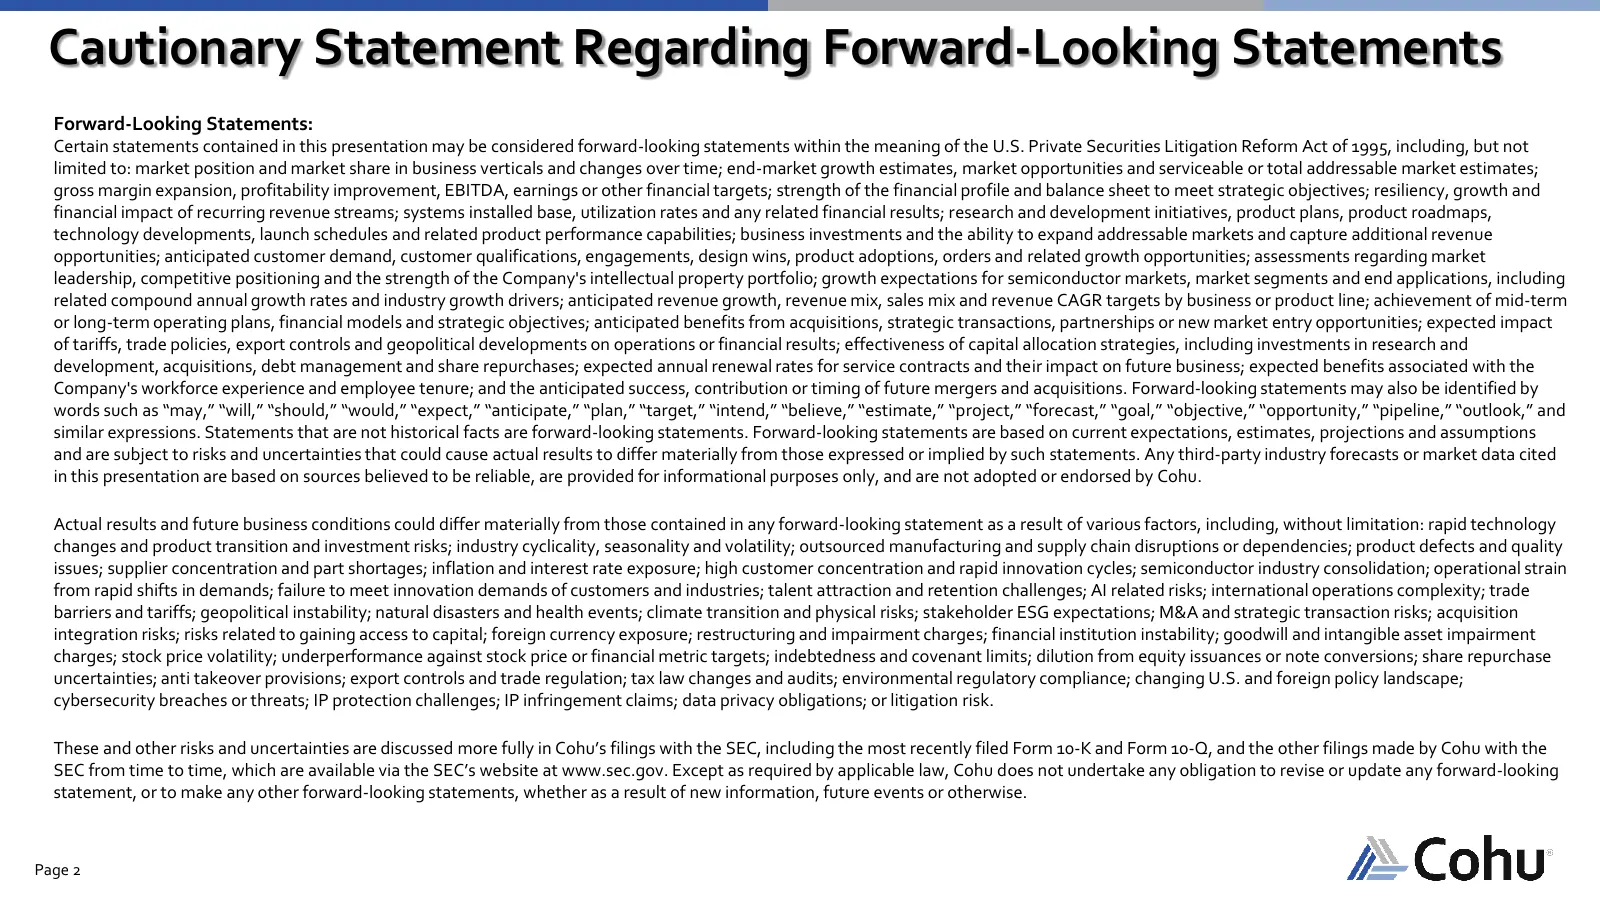
Slide 2: Cautionary Statement Regarding Forward-Looking Statements
Cautionary Statement Regarding Forward-Looking Statements Forward-Looking Statements: Certain statements contained in this presentation may be considered forward-looking statements within the meaning of the U.S. Private Securities Litigation Reform Act of 1995, including, but not limited to: market
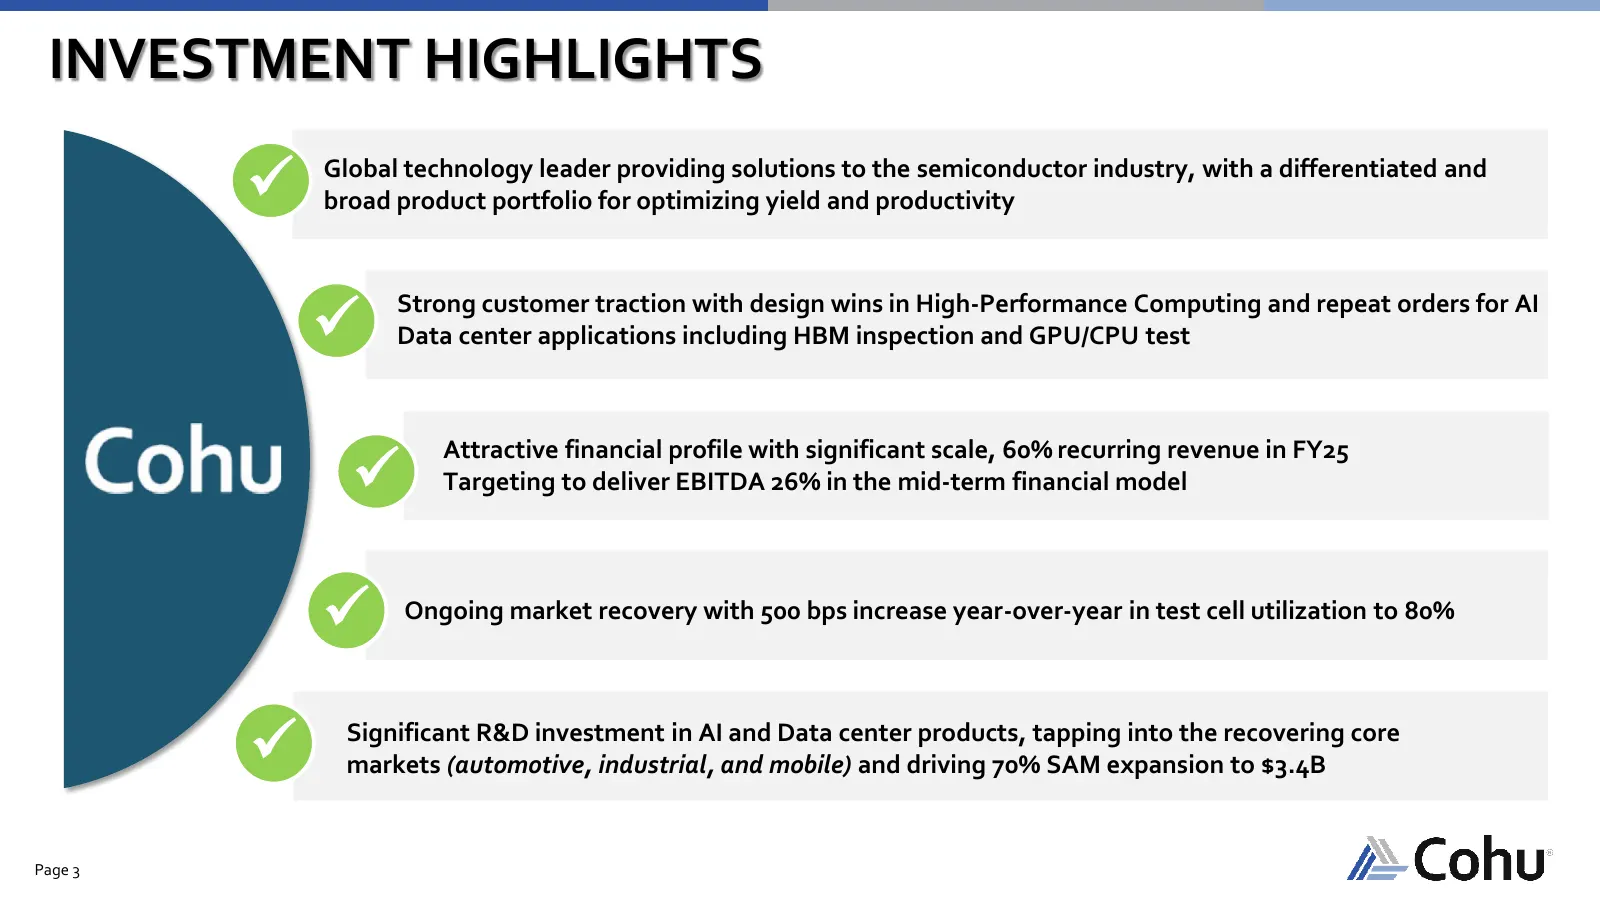
Slide 3: Investment Highlights
INVESTMENT HIGHLIGHTS ✓ Global technology leader providing solutions to the semiconductor industry, with a differentiated and broad product portfolio for optimizing yield and productivity ✓ Strong customer traction with design wins in High-Performance Computing and repeat orders for AI Data center a
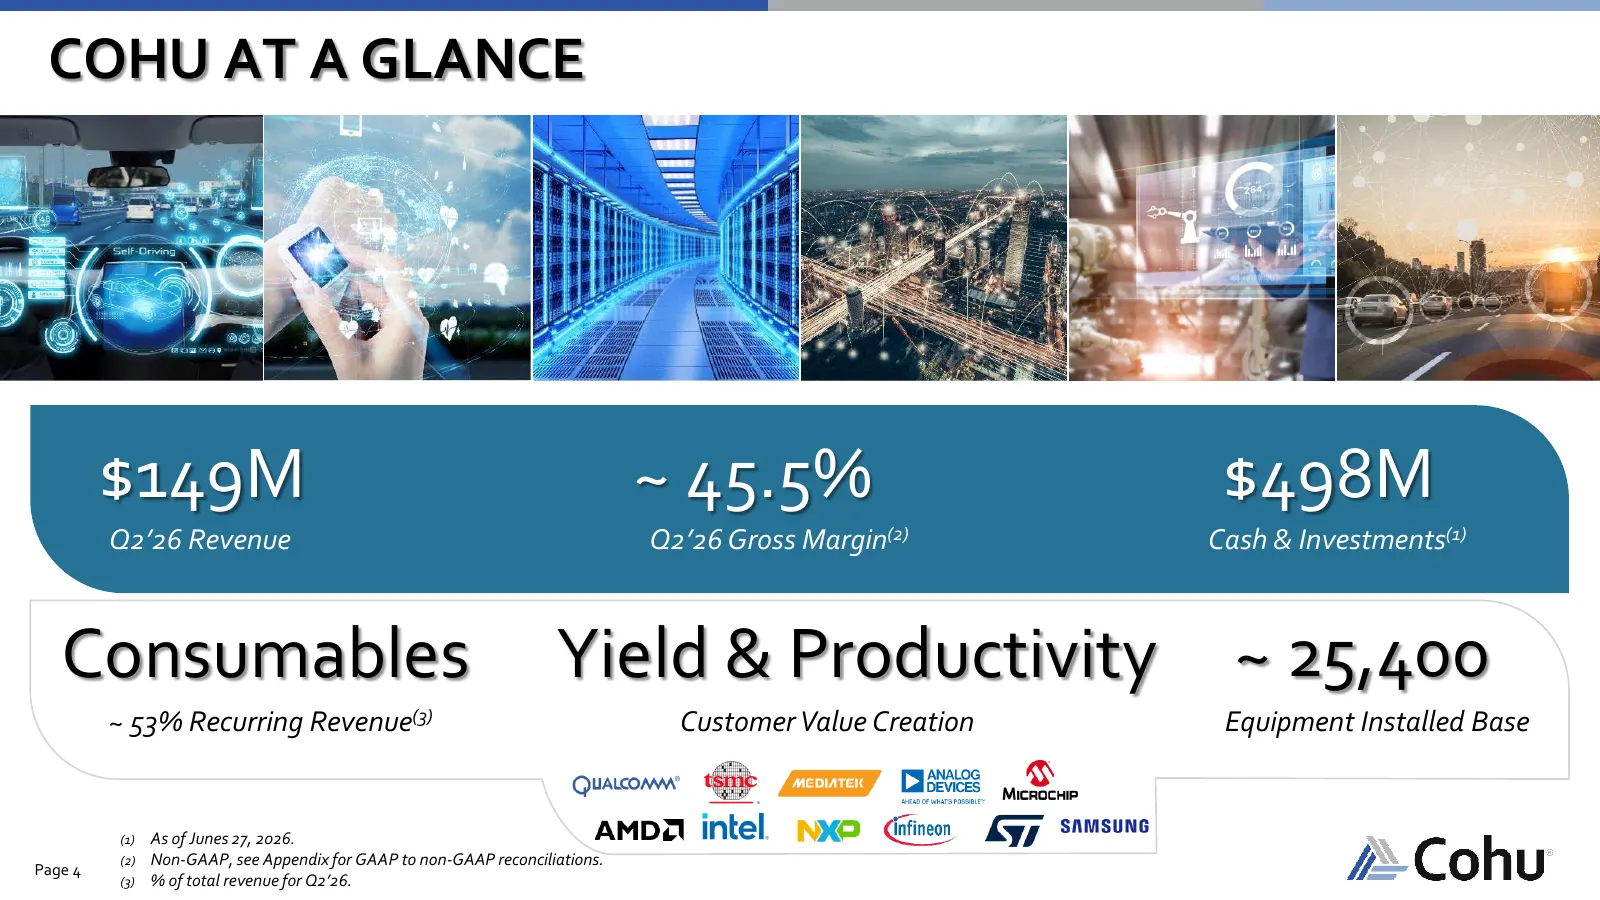
Slide 4: Cohu at a Glance
COHU AT A GLANCE $149M ~ 45.5% $498M Q2’26 Revenue Q2’26 Gross Margin(2) Cash & Investments(1) Consumables Yield & Productivity ~ 25,400 ~ 53% Recurring Revenue(3) Customer Value Creation Equipment Installed Base (1) As of Junes 27, 2026. (2) Non-GAAP, see Appendix for GAAP to non-GAAP reconciliatio
Slide 5: A Leader in Semiconductor Test & Inspection
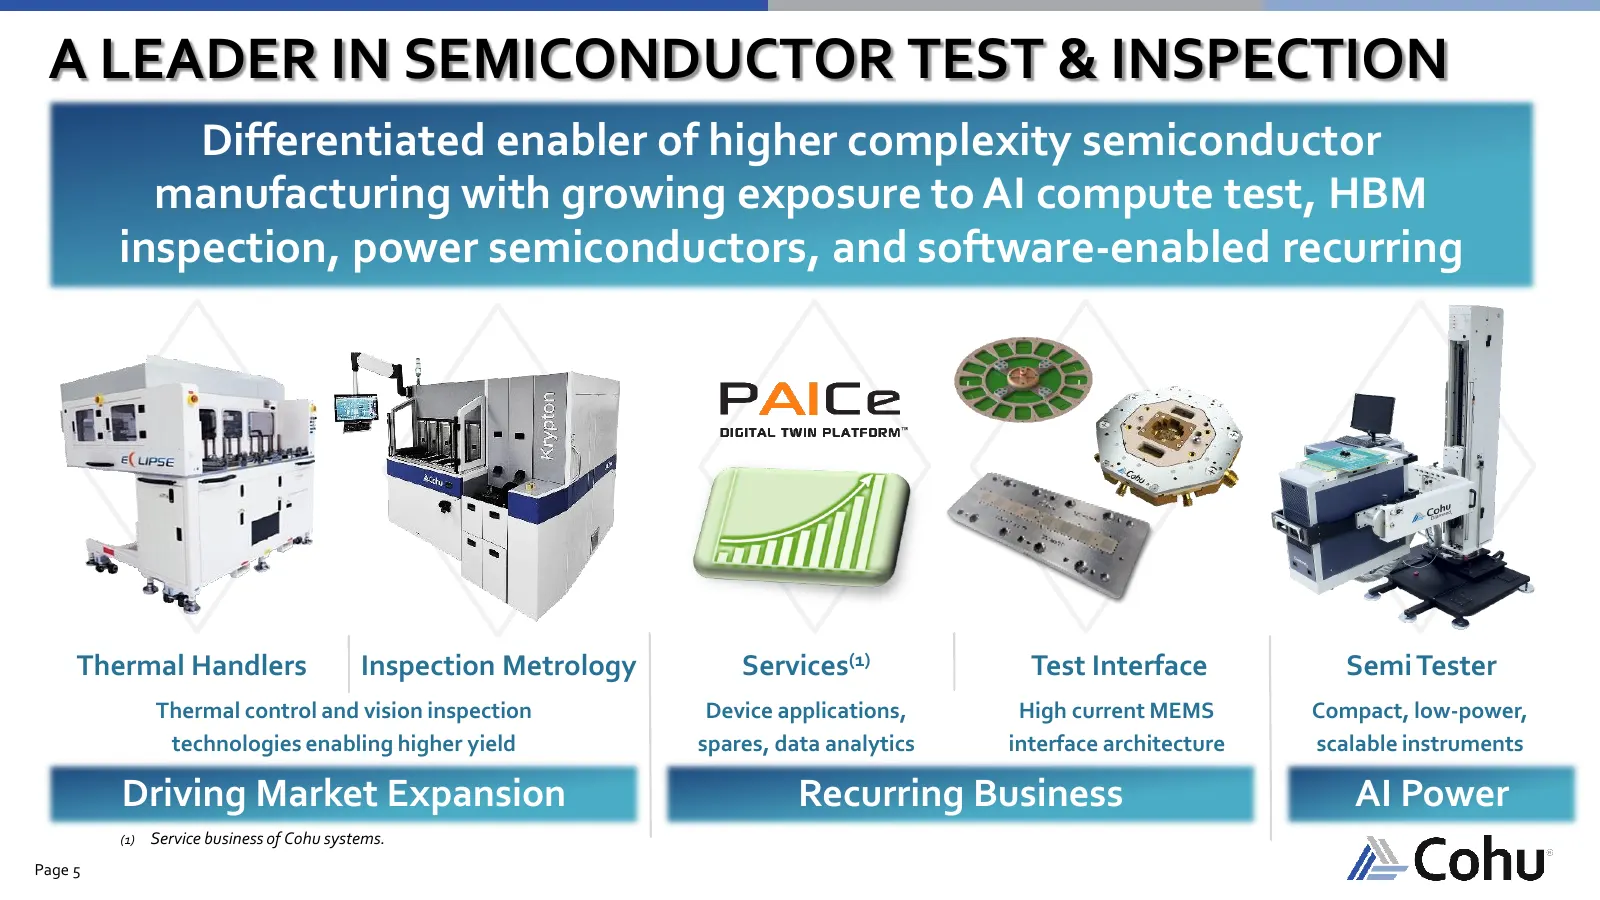
A LEADER IN SEMICONDUCTOR TEST & INSPECTION Differentiated enabler of higher complexity semiconductor manufacturing with growing exposure to AI compute test, HBM inspection, power semiconductors, and software-enabled recurring Thermal Handlers Inspection Metrology Services(1) Test Interface Semi Tes
Slide 6: Delivering Higher Yield & Productivity
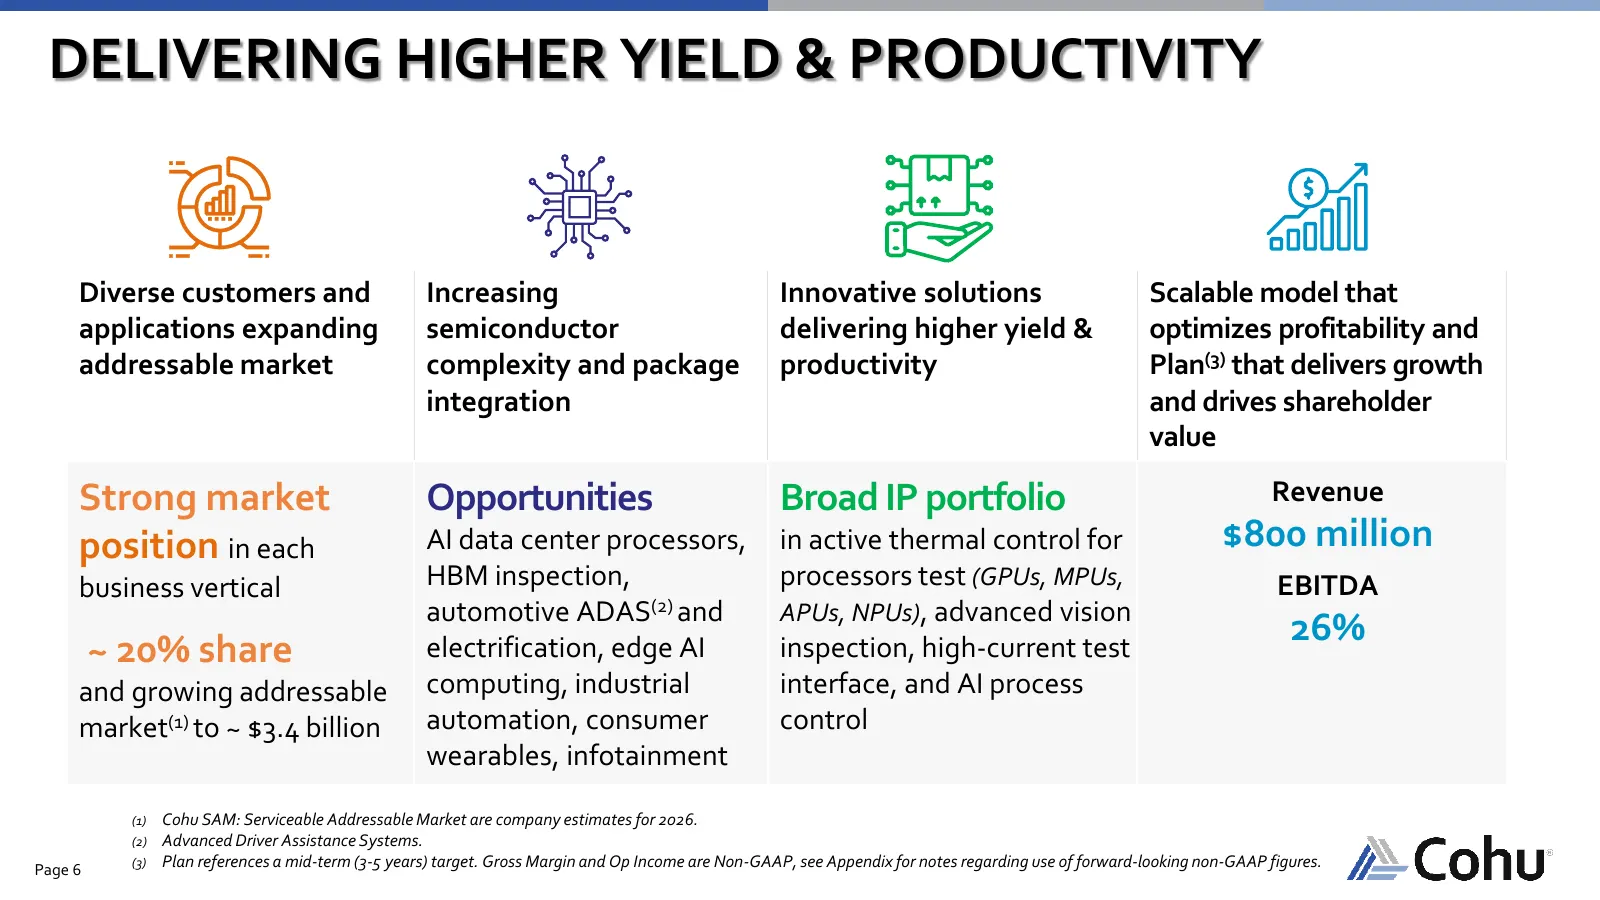
DELIVERING HIGHER YIELD & PRODUCTIVITY Diverse customers and Increasing Innovative solutions Scalable model that applications expanding semiconductor delivering higher yield & optimizes profitability and addressable market complexity and package productivity Plan(3) that delivers growth integration

Slide 7: Strategy – Opening the Market Aperture
STRATEGY – OPENING THE MARKET APERTURE Page 7
Slide 8: ~$850M High-Performance Computing Pipeline
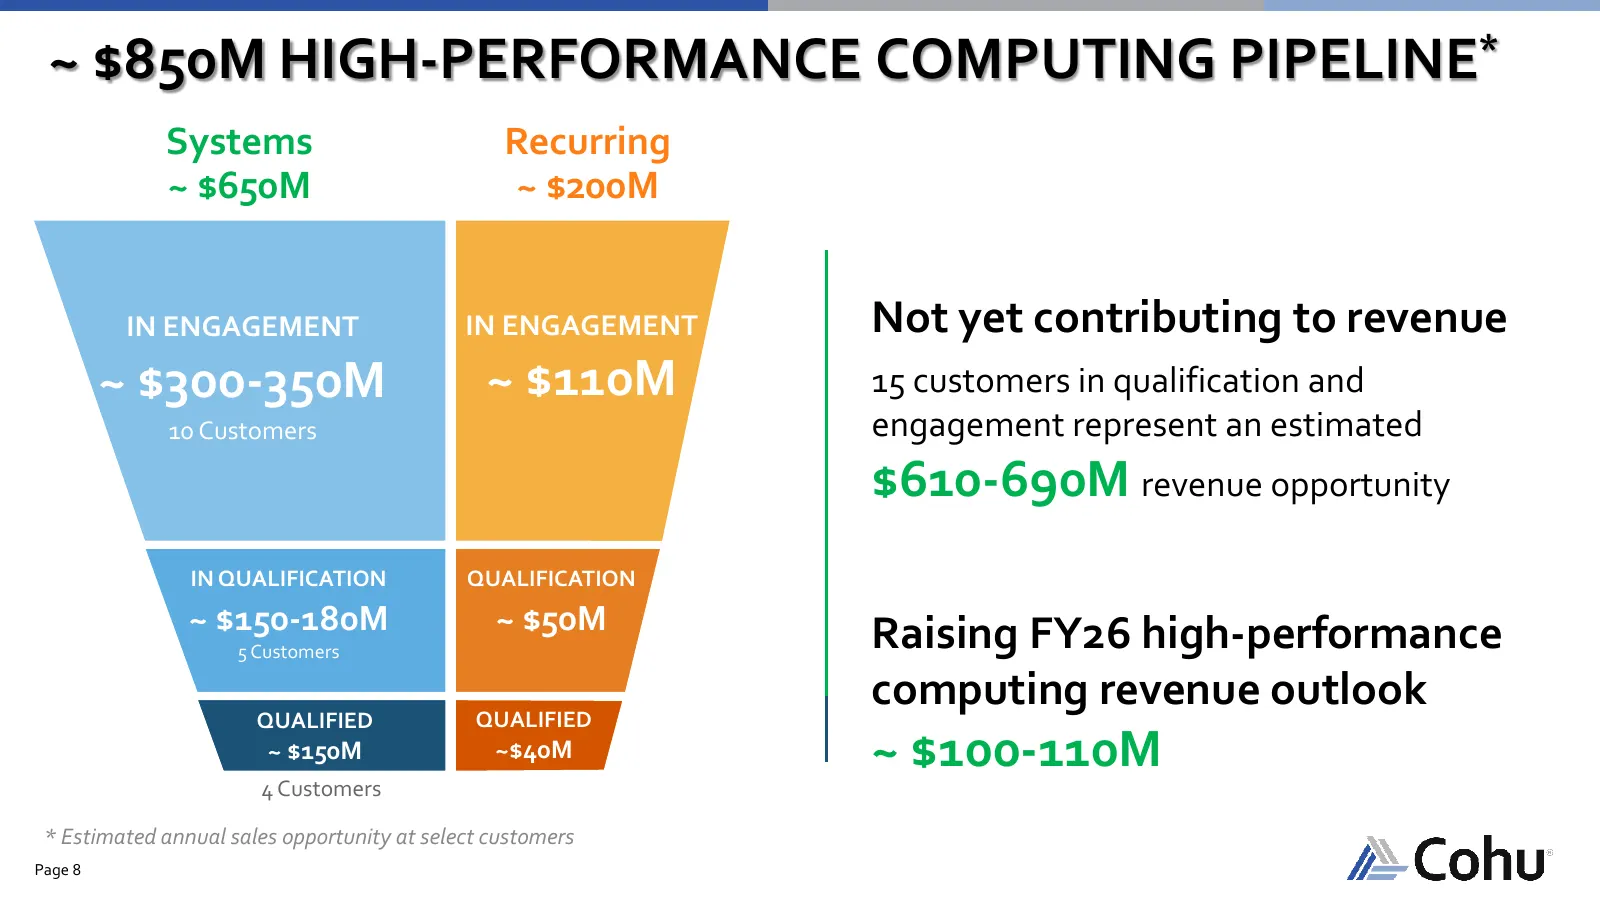
~ $850M HIGH-PERFORMANCE COMPUTING PIPELINE* Systems Recurring ~ $650M ~ $200M IN ENGAGEMENT IN ENGAGEMENT Not yet contributing to revenue ~ $300-350M ~ $110M 15 customers in qualification and 10 Customers engagement represent an estimated $610-690M revenue opportunity IN QUALIFICATION QUALIFICATION
Slide 9: Expanding in High-Performance Computing
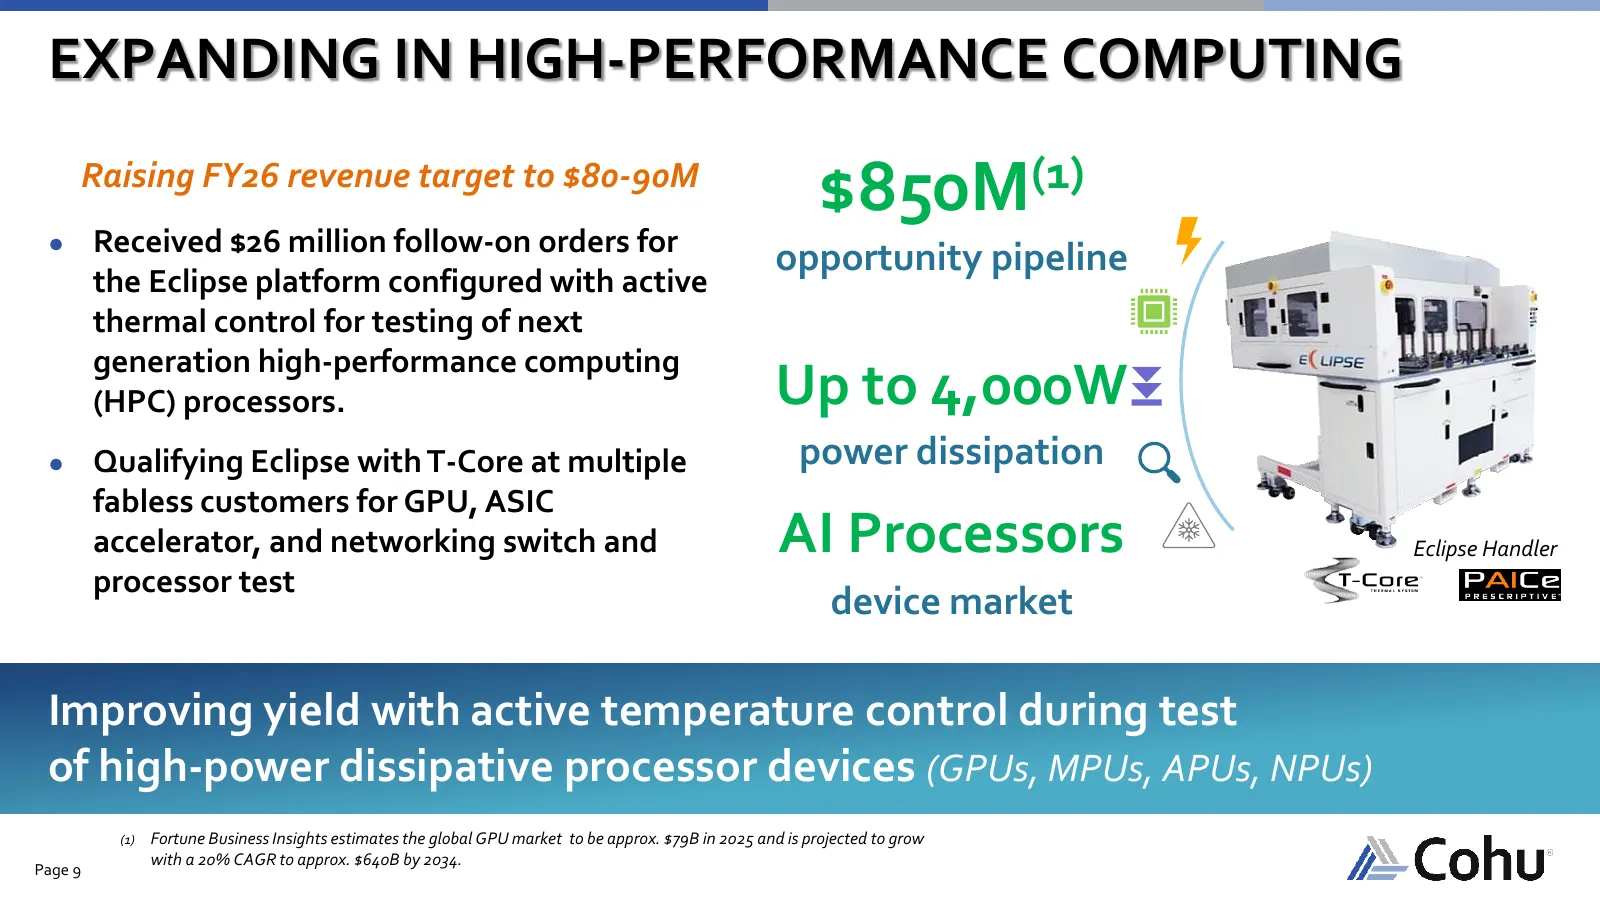
EXPANDING IN HIGH-PERFORMANCE COMPUTING Raising FY26 revenue target to $80-90M $850M(1) ● Received $26 million follow-on orders for opportunity pipeline the Eclipse platform configured with active thermal control for testing of next generation high-performance computing (HPC) processors. Up to 4,000
Slide 10: Supplying to World-Leading HBM Manufacturer
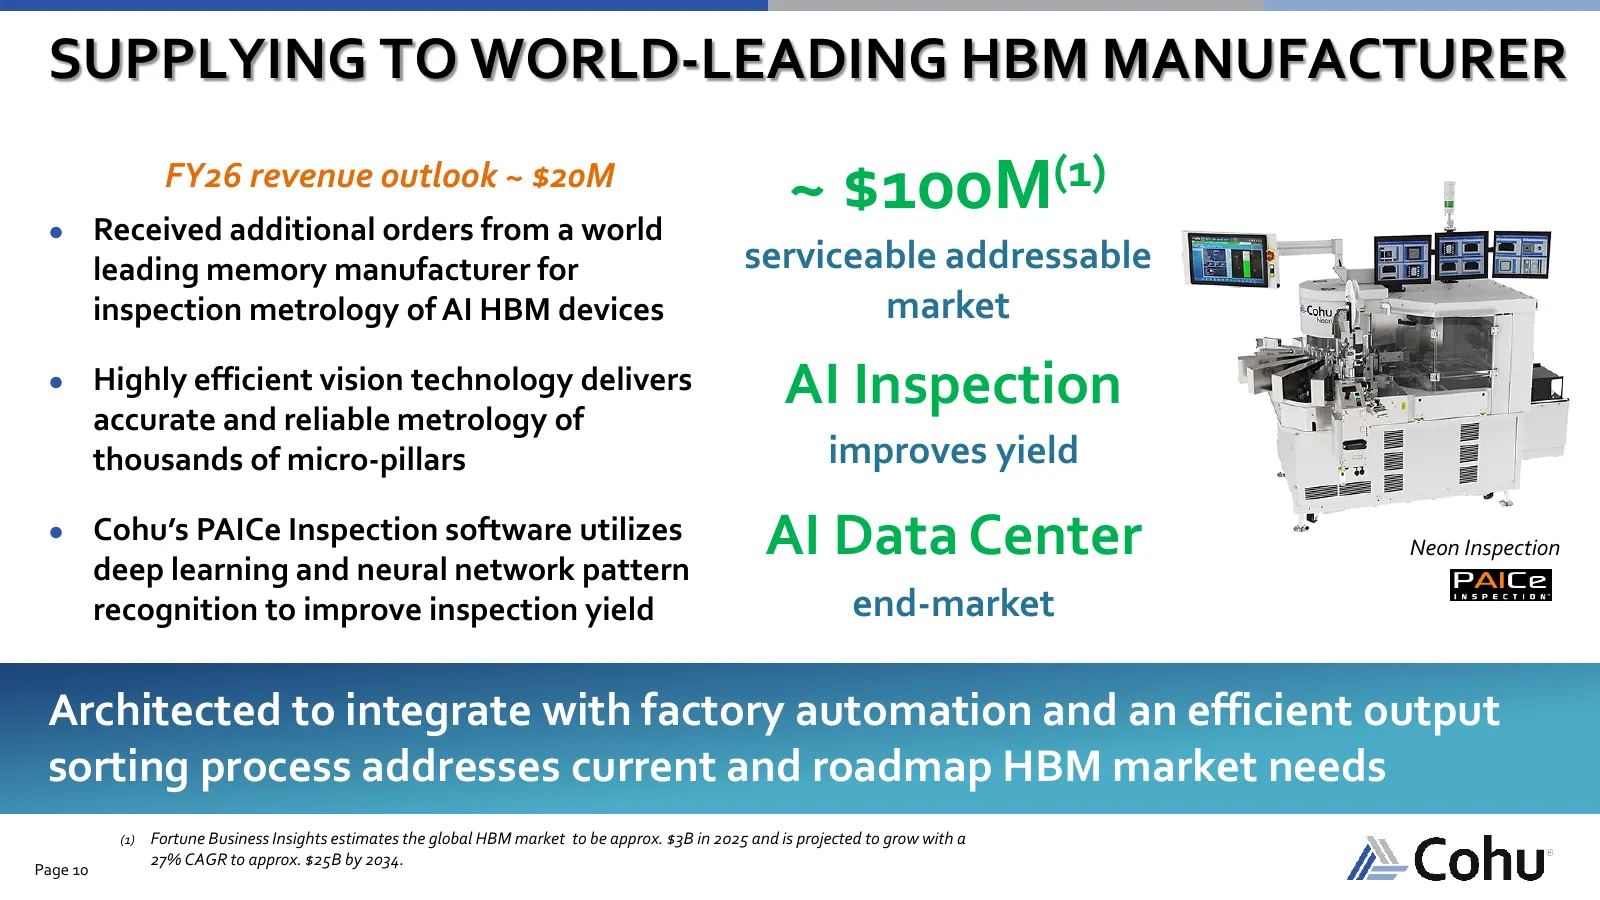
SUPPLYING TO WORLD-LEADING HBM MANUFACTURER FY26 revenue outlook ~ $20M ~ $100M (1) ● Received additional orders from a world leading memory manufacturer for serviceable addressable inspection metrology of AI HBM devices market ● Highly efficient vision technology delivers accurate and reliable metr
Slide 11: Increasing Software Analytics
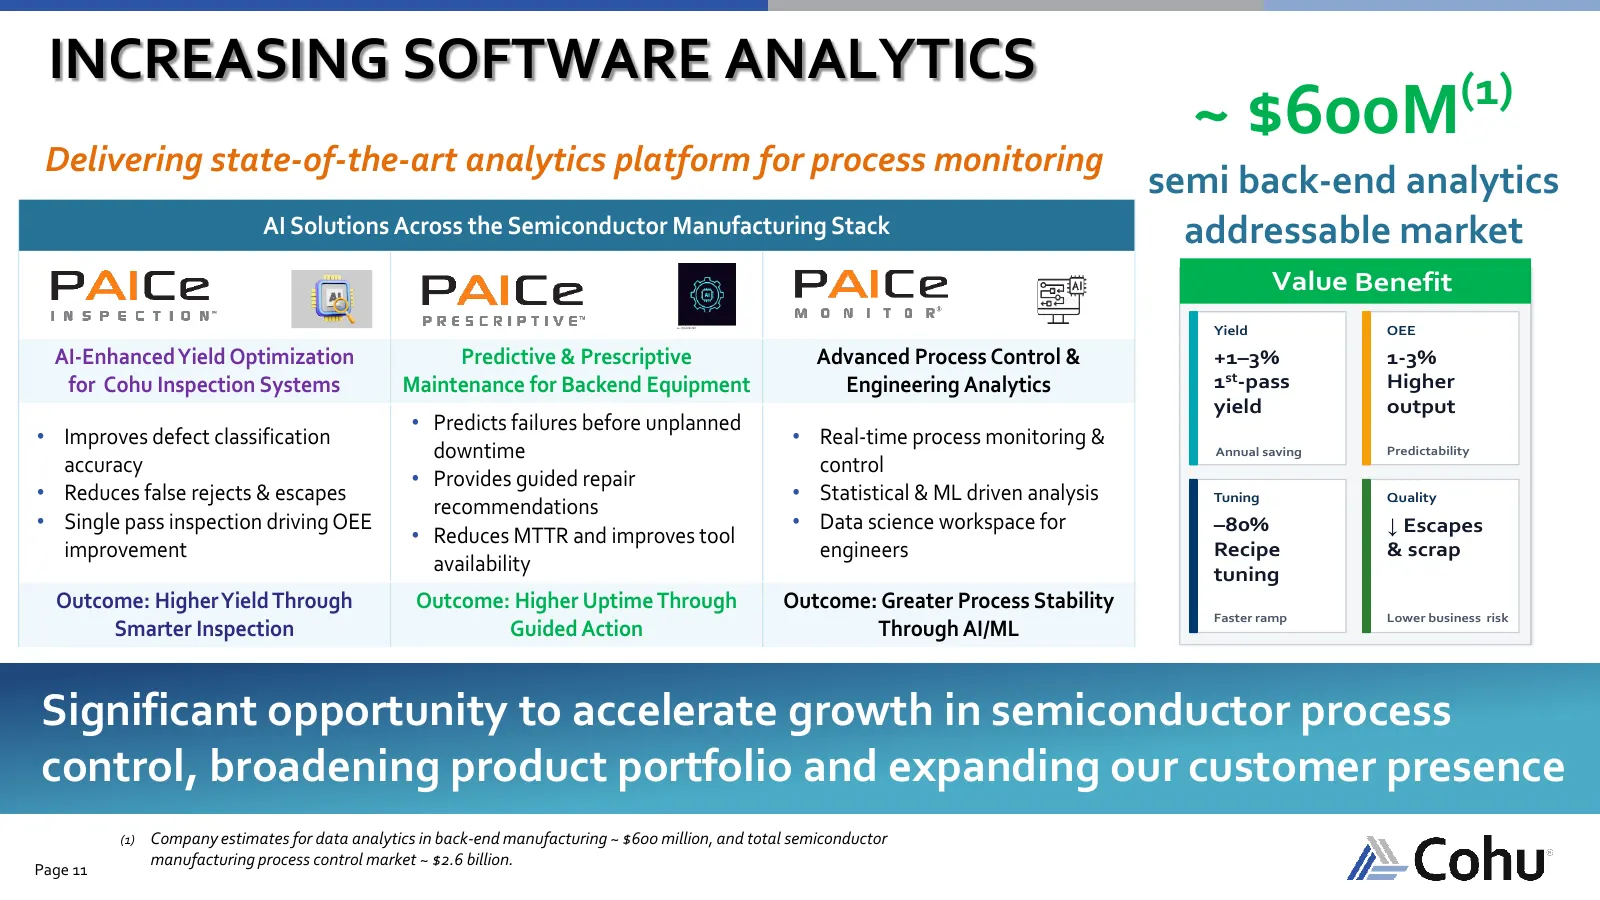
INCREASING SOFTWARE ANALYTICS (1) ~ $600M Delivering state-of-the-art analytics platform for process monitoring semi back-end analytics AI Solutions Across the Semiconductor Manufacturing Stack addressable market Value Benefit Yield OEE AI-Enhanced Yield Optimization Predictive & Prescriptive Advanc
Slide 12: Growing AI Datacenter Power Management
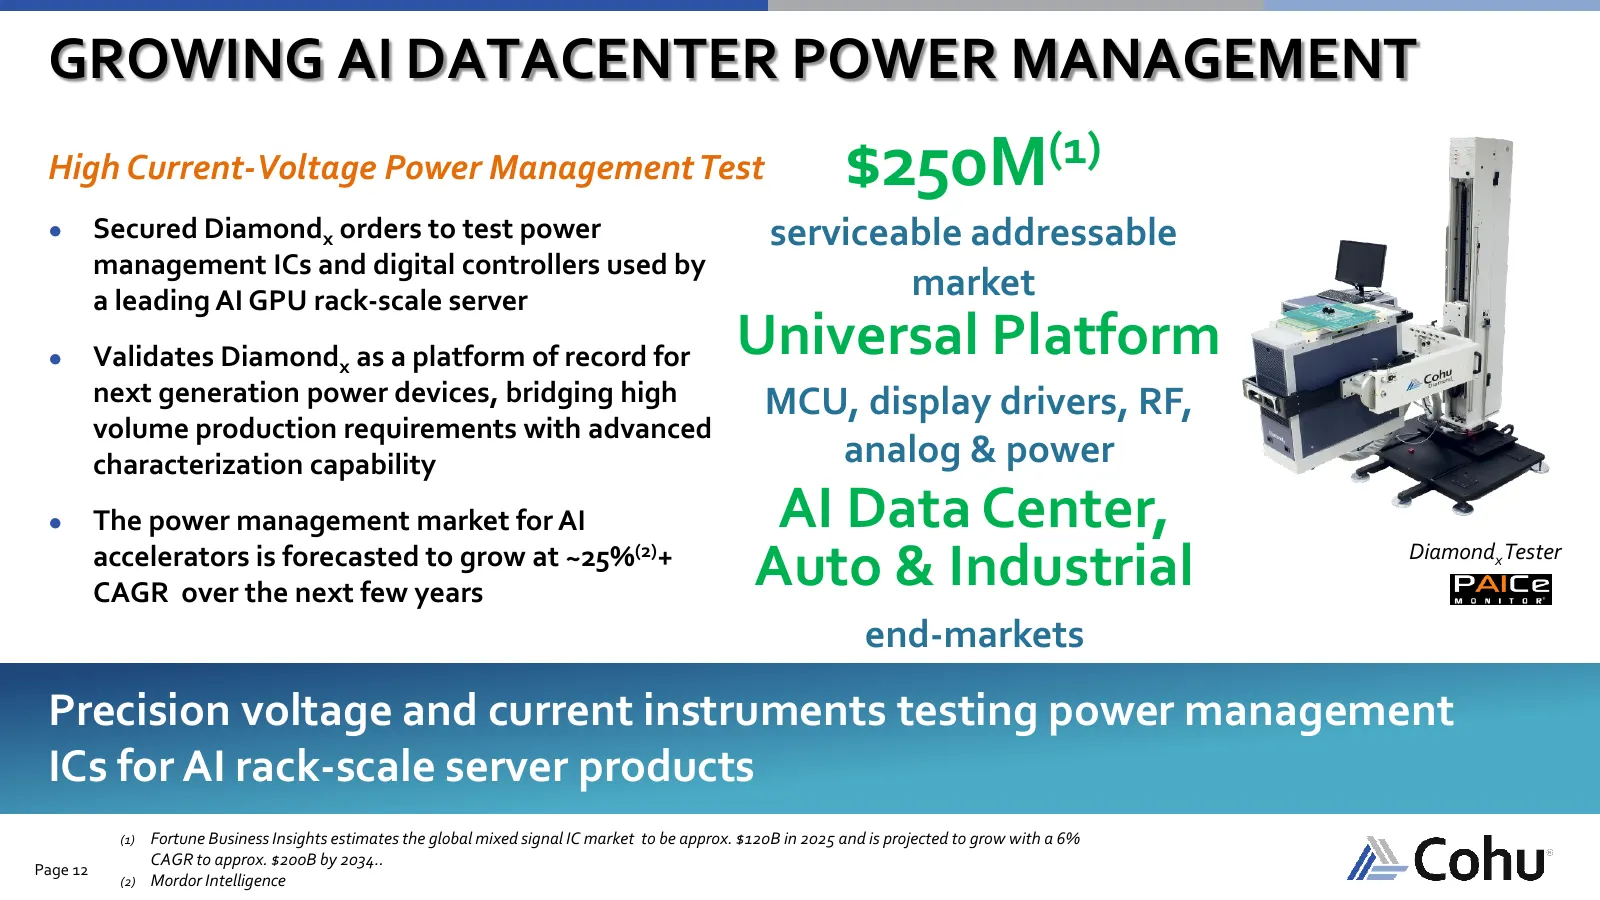
GROWING AI DATACENTER POWER MANAGEMENT High Current-Voltage Power Management Test $250M(1) ● Secured Diamondx orders to test power serviceable addressable management ICs and digital controllers used by a leading AI GPU rack-scale server market ● Validates Diamondx as a platform of record for Univers
Slide 13: Profitability and Shareholder Value
PROFITABILITY AND SHAREHOLDER VALUE Page 13
Slide 14: Track Record of Margin Expansion
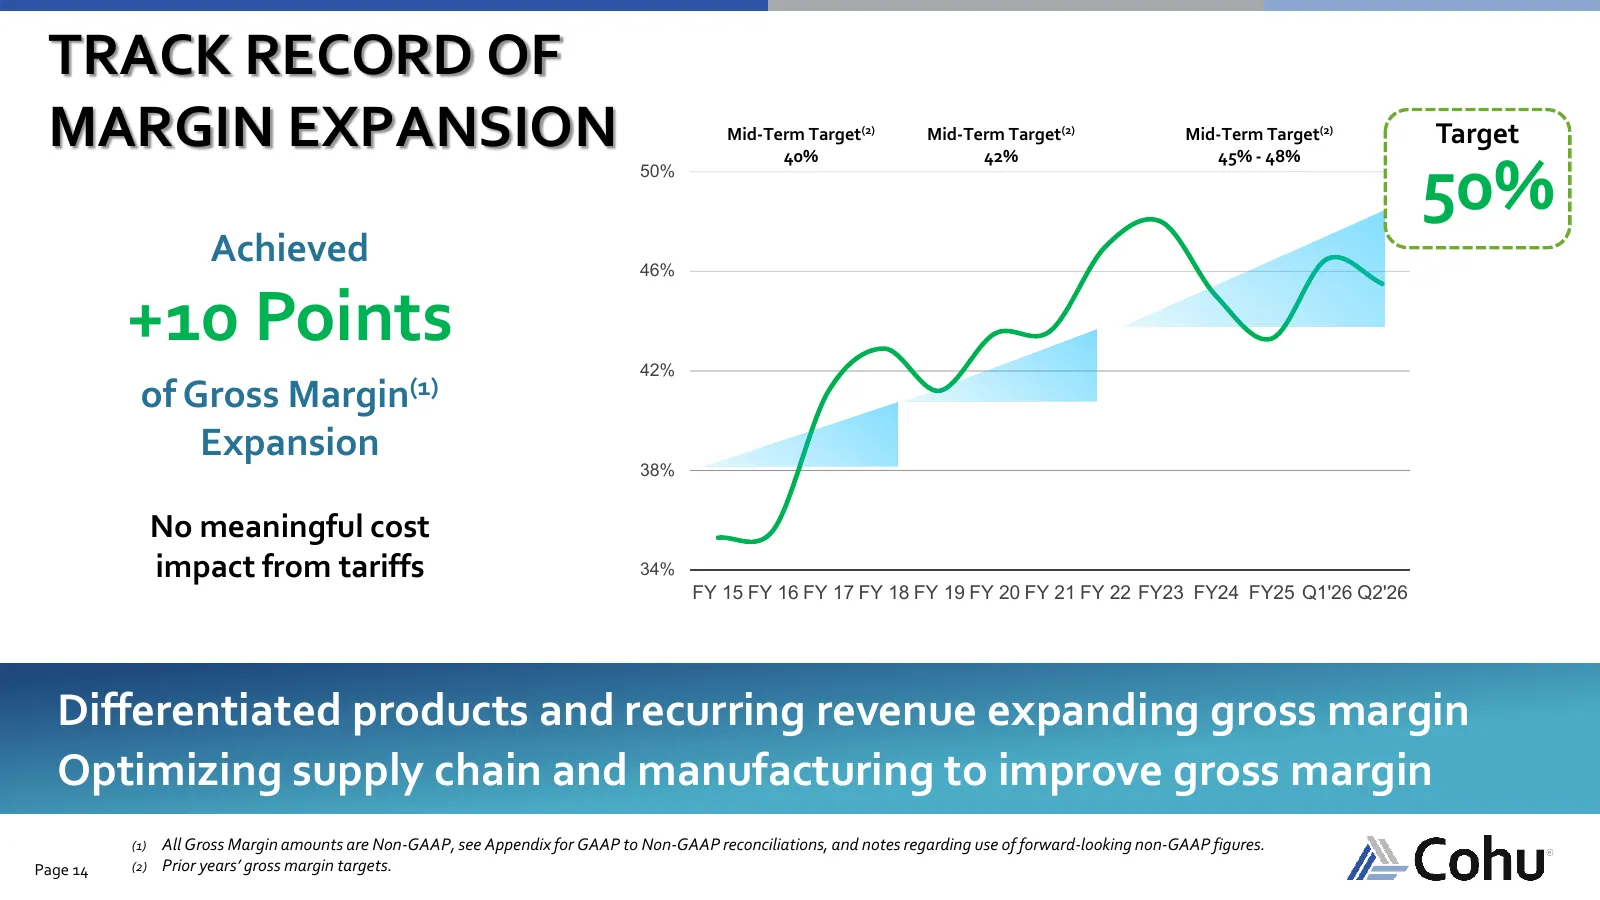
TRACK RECORD OF MARGIN EXPANSION Mid-Term Target(2) 40% Mid-Term Target(2) 42% Mid-Term Target(2) 45% - 48% Target 50% 50% Achieved 46% +10 Points 42% of Gross Margin(1) Expansion 38% No meaningful cost impact from tariffs 34% FY 15 FY 16 FY 17 FY 18 FY 19 FY 20 FY 21 FY 22 FY23 FY24 FY25 Q1'26 Q2'2
Slide 15: Resilient Recurring Business Model
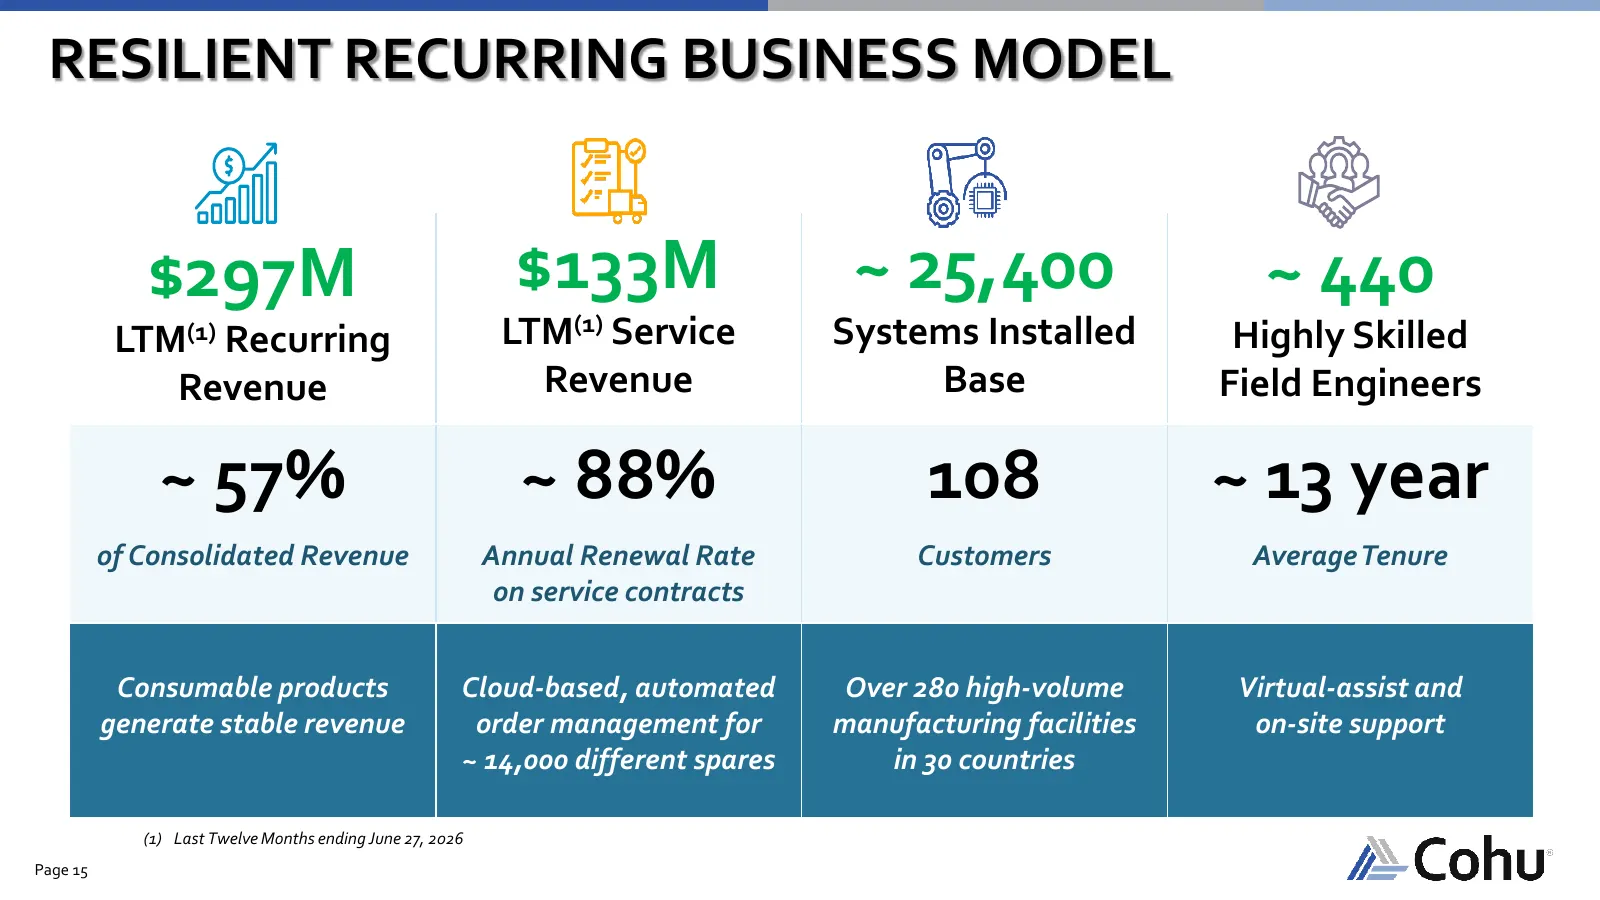
RESILIENT RECURRING BUSINESS MODEL $297M $133M ~ 25,400 ~ 440 LTM(1) Recurring LTM(1) Service Systems Installed Highly Skilled Revenue Revenue Base Field Engineers ~ 57% ~ 88% 108 ~ 13 year of Consolidated Revenue Annual Renewal Rate Customers Average Tenure on service contracts Consumable products
Slide 16: Mid-Term Financial Model
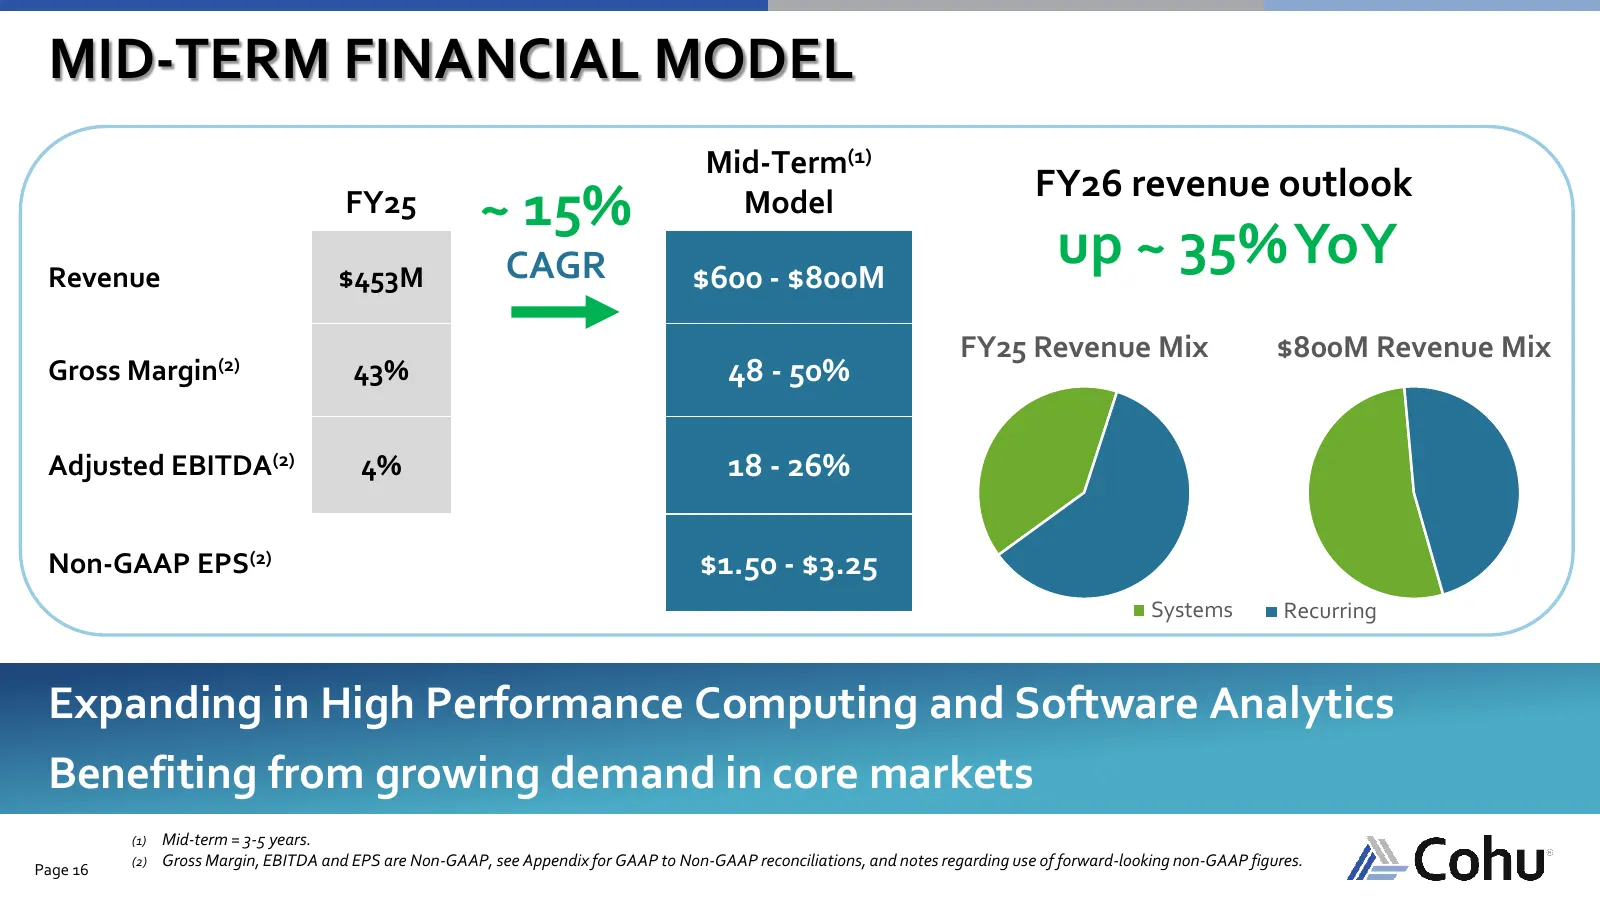
MID-TERM FINANCIAL MODEL Mid-Term(1) FY26 revenue outlook FY25 ~ 15% Model Revenue $453M CAGR $600 - $800M up ~ 35% YoY FY25 Revenue Mix $800M Revenue Mix Gross Margin(2) 43% 48 - 50% Adjusted EBITDA(2) 4% 18 - 26% Non-GAAP EPS(2) $1.50 - $3.25 Systems Recurring Expanding in High Performance Computi
Slide 17: Effective Capital Allocation Strategy
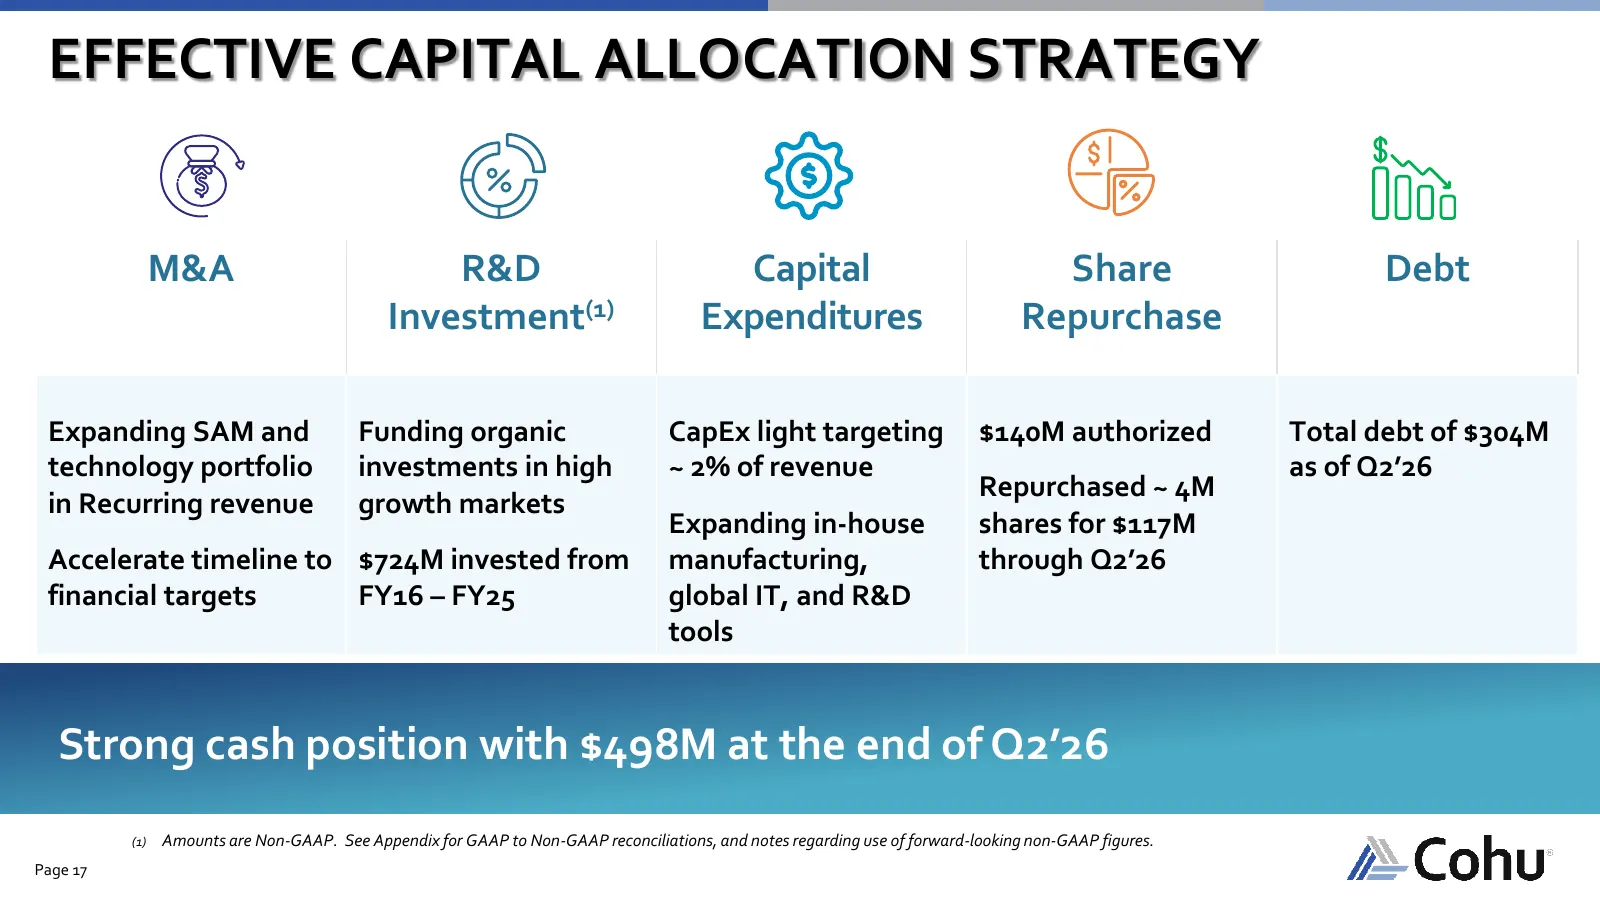
EFFECTIVE CAPITAL ALLOCATION STRATEGY M&A R&D Capital Share Debt Investment(1) Expenditures Repurchase Expanding SAM and Funding organic CapEx light targeting $140M authorized Total debt of $304M technology portfolio investments in high ~ 2% of revenue as of Q2’26 Repurchased ~ 4M in Recurring reven
Slide 18: We deliver leading-edge solutions to enable a smarter, safer, and more connected future
We deliver leading-edge solutions to enable a smarter, safer, and more connected future. Page 18
Slide 19: Appendix
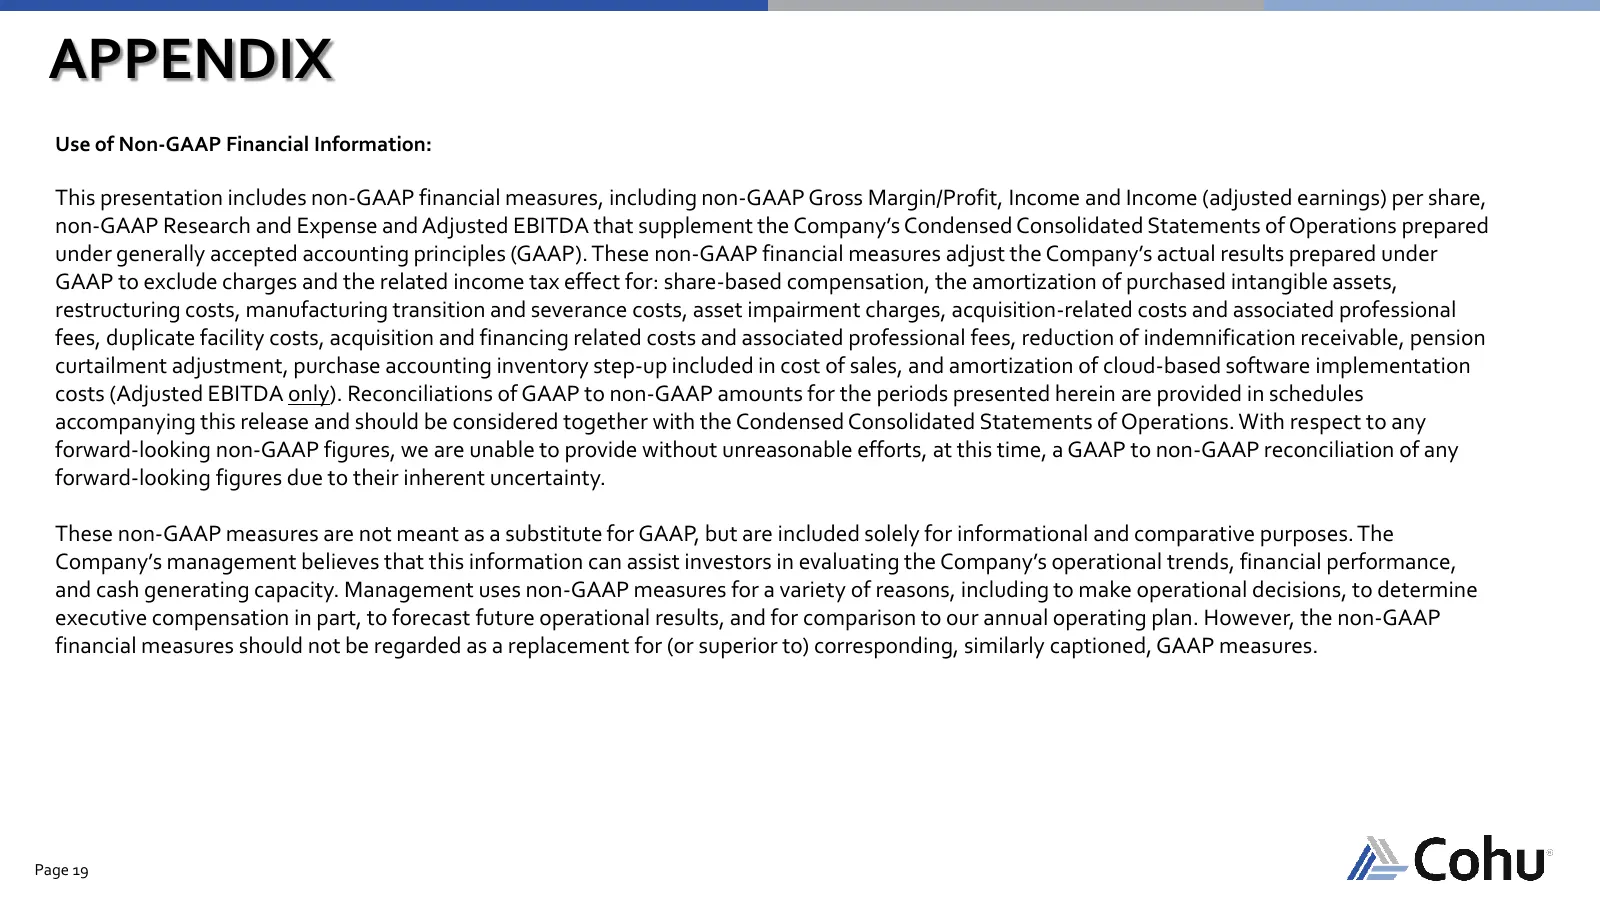
APPENDIX Use of Non-GAAP Financial Information: This presentation includes non-GAAP financial measures, including non-GAAP Gross Margin/Profit, Income and Income (adjusted earnings) per share, non-GAAP Research and Expense and Adjusted EBITDA that supplement the Company’s Condensed Consolidated Stat
Slide 20: GAAP to Non-GAAP Reconciliation
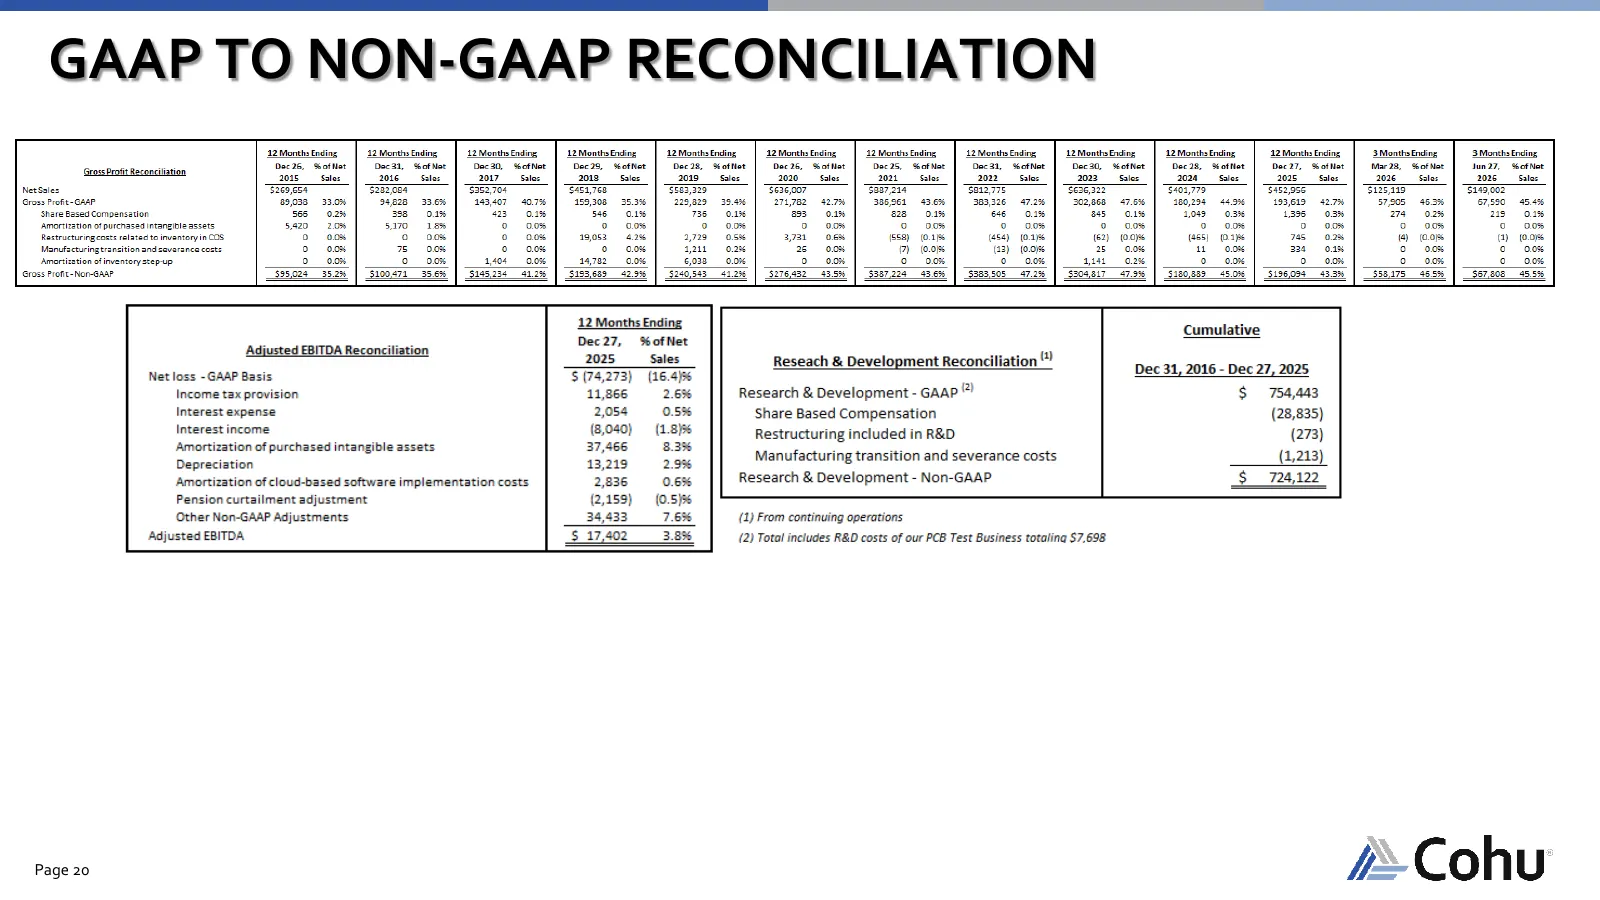
GAAP TO NON-GAAP RECONCILIATION Page 20
Source: company website