FBL Financial — NYSSA Insurance Industry Conference 2011
32 slides from FBL Financial's conference presentation, Feb 3, 2011
Slide 1: FBL Financial Group, Inc. - NYSSA Insurance Industry Conference
ii FBL Financial Group, Inc. p Farm Bureau Financial Services ¢ EquiTrust Financial Services NYSSA INSURANCE INDUSTRY CONFERENCE February 7, 2011 James P. Brannen, CFO Richard J. Kypta, EVP - Farm Bureau Life
Slide 2: Safe Harbor Statement and Non-GAAP Measures
Safe Harbor Statement and Non-GAAP Measures Safe Harbor Statement under The Private Securities Litigation Reform Act of 1995 Certain statements in this presentation concerning FBL Financial Group's prospects for the future are forward-looking statements intended to qualify for the "safe harbor" from
Slide 3: Business Strategy / Financial Overview
= Business Strategy = Financial Overview EFBL 3 haat Gro fe
Slide 4: Company Overview
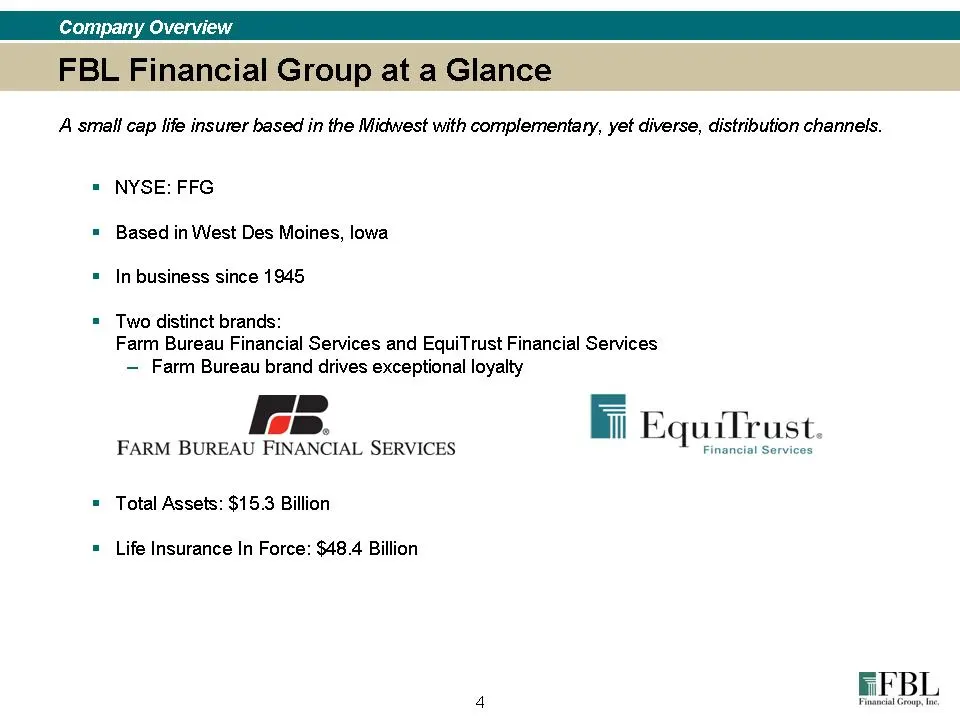
Company Overview A smail cap life insurer based in the Midwest with complementary, yet diverse, distribution channels. = NYSE: FFG = Based in West Des Moines, lowa = In business since 1945 = Two distinct brands: Farm Bureau Financial Services and EquiTrust Financial Services — Farm Bureau brand driv
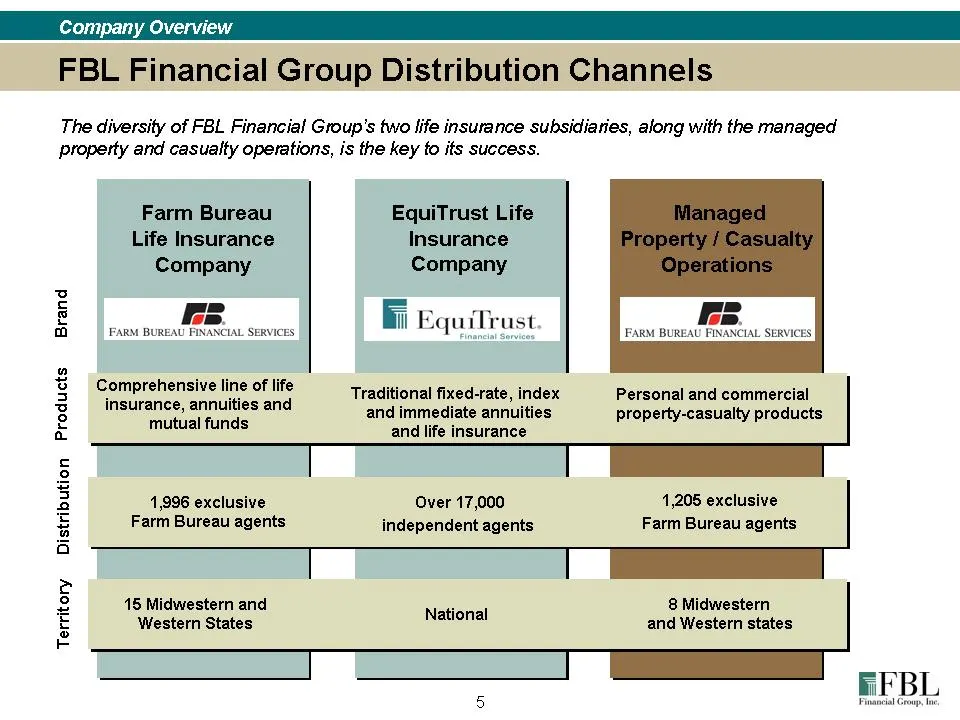
Slide 5: FBL Financial Group Distribution Channels
Company Overview FBL Financial Group Distribution Channels The diversity of FBL Financial Group's two life insurance subsidiaries, along with the managed property and casualty operations, is the key fo its success. Brand Territory Distribution Products Farm Bureau Life Insurance Company FARM BUREAU
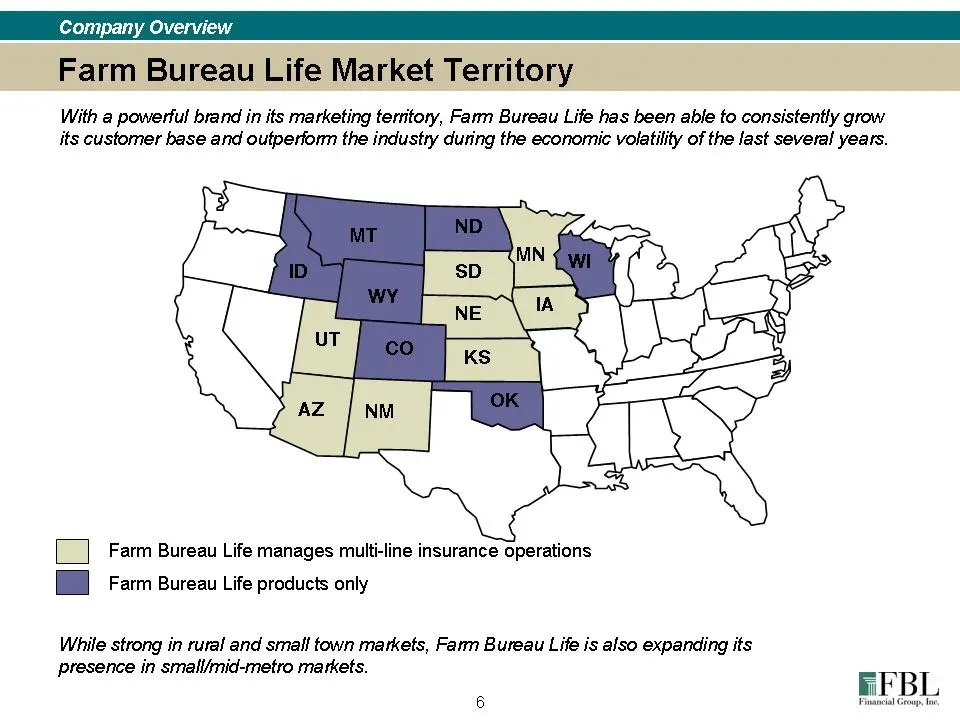
Slide 6: Company Overview: Farm Bureau Life
Company Overview With a powerful brand in its marketing territory, Farm Bureau Life has been able to consistently grow its customer base and outperform the industry during the economic volatility of the last several years. Farm Bureau Life manages multi-line insurance operations Hi Farm Bureau Life
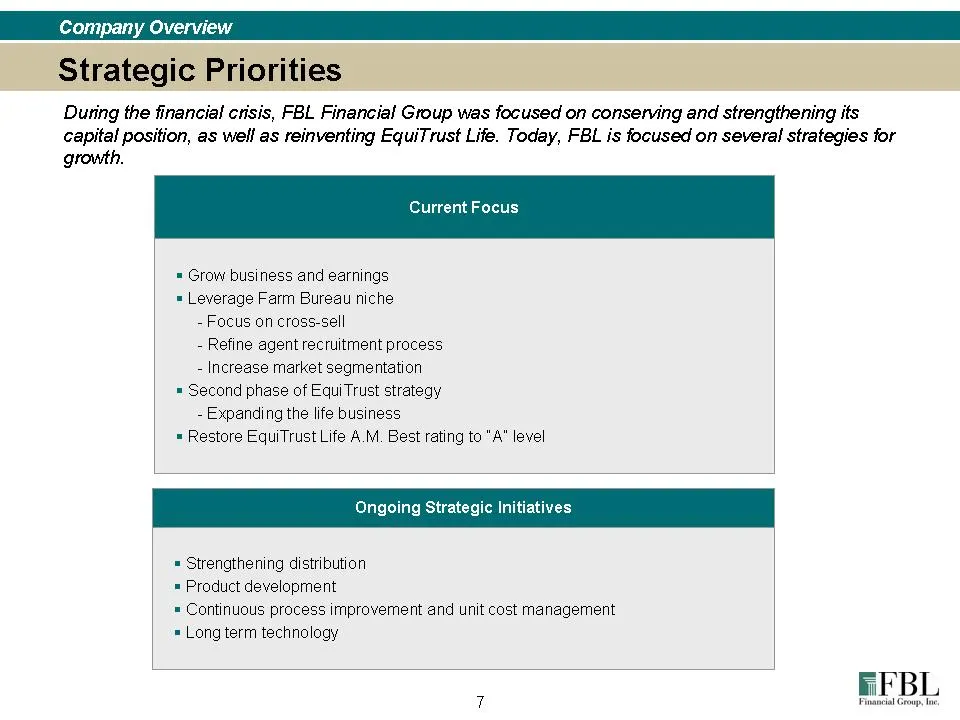
Slide 7: Company Overview: Strategic Initiatives
Company Overview During the financial crisis, FBL Financial Group was focused on conserving and strengthening its capital position, as well as reinventing EquiTrust Life. Today, FBL is focused on several strategies for growth. = Grow business and earnings = Leverage Farm Bureau niche - Focus on cros
Slide 8: Company Overview
= Company Overview = Financial Overview EFBL 8 haat Gro fe
Slide 9: Business Strategy: Farm Bureau Niche
Business Strategy The foundation of FBL Financial Group is its niche Farm Bureau marketplace. « Farm Bureau is the largest farm and ranch organization in the U.S. = 6.3 million member families in the U.S. « Farm Bureau Life has use of Farm Bureau name and logo =: « Niche provides: — Enhanced prestig
Slide 10: Farm Bureau Life: Superior Persistency & Cross Sell
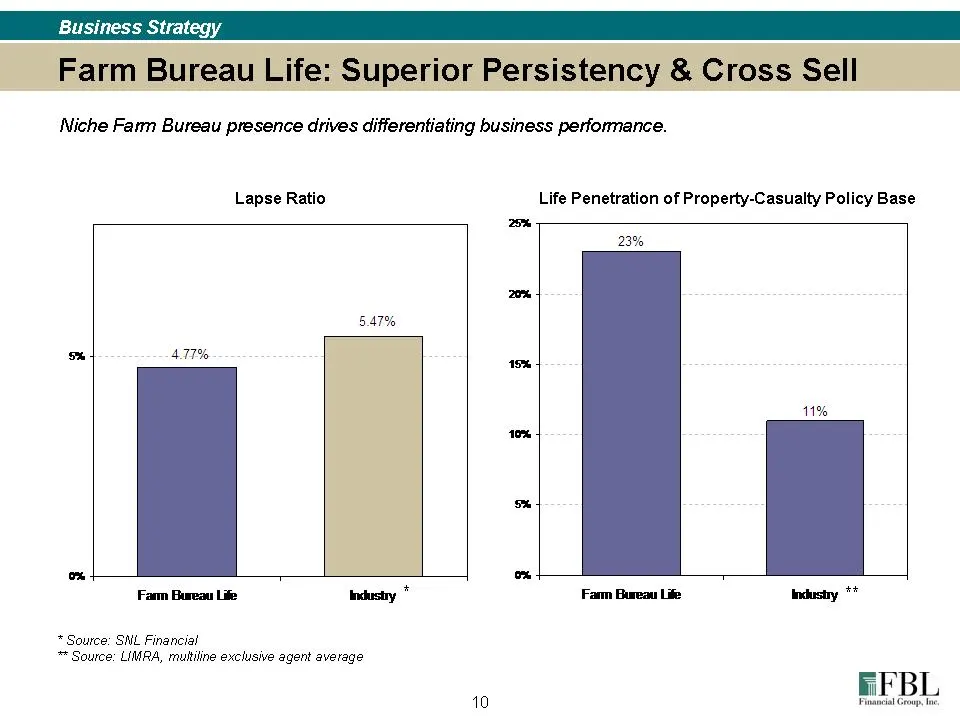
Business Strategy Farm Bureau Life: Superior Persistency & Cross Sell Niche Farm Bureau presence drives differentiating business performance. Lapse Ratio Life Penetration of Property-Casualty Policy Base 23% 5.47% co 477% ™ 11% Farm Bureau Life Industry Farm Bureau Life Industry ** * Source: SNL Fin
Slide 11: Farm Bureau Life Product Offerings
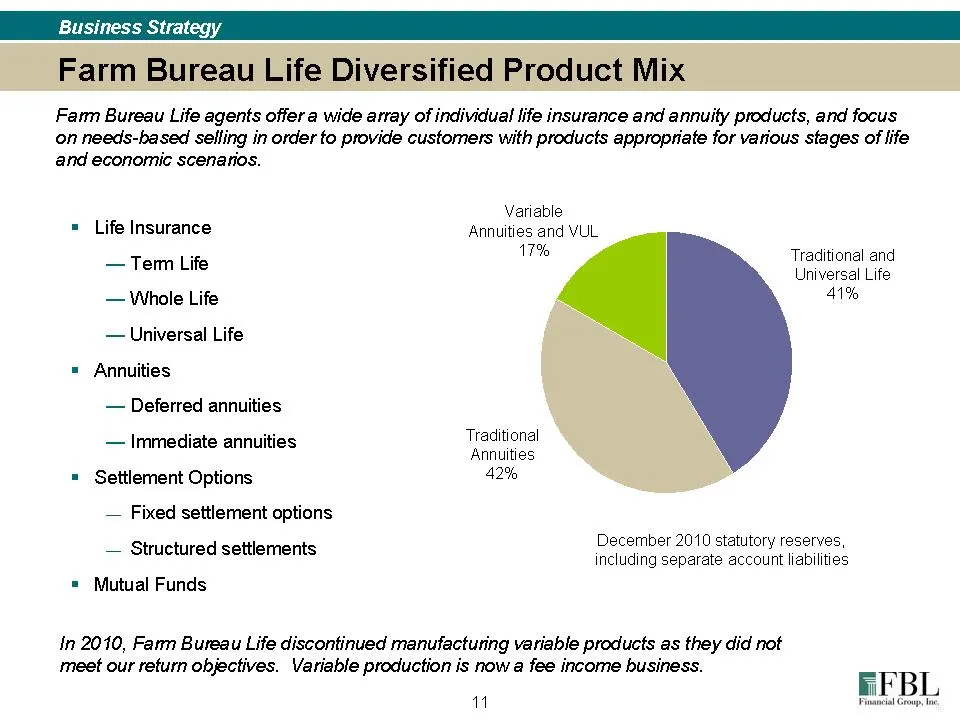
Business Strategy Farm Bureau Life agents offer a wide array of individual life insurance and annuity products, and focus on needs-based selfing in order to provide customers with products appropriate for various stages of life and economic scenarios. Life Insurance — Tem Life — Whole Life — Univers
Slide 12: Farm Bureau Life Collected Premiums
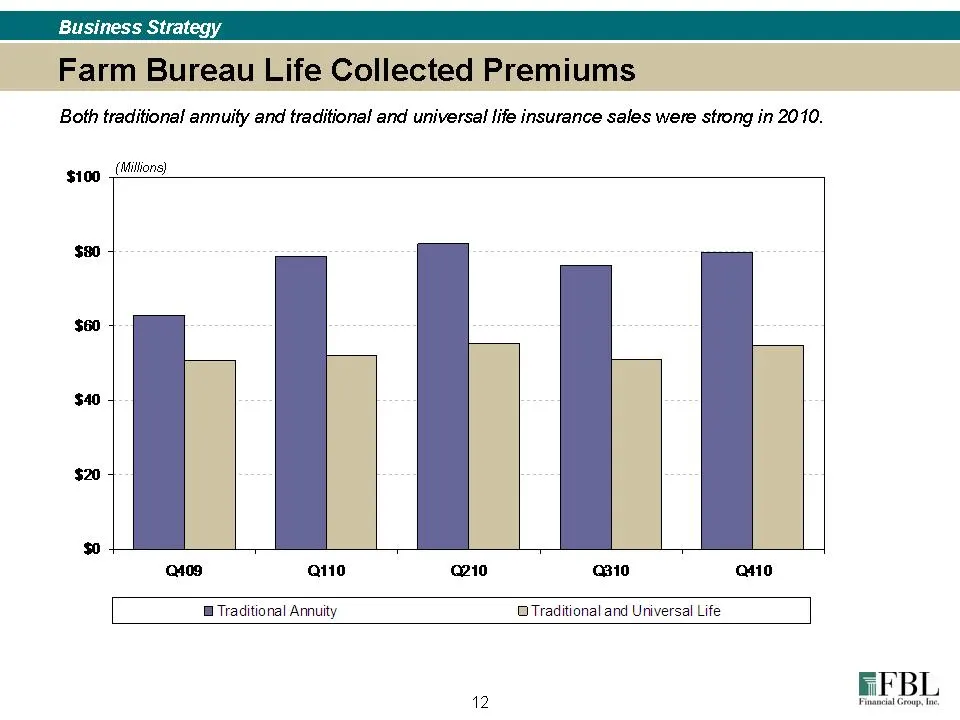
Business Strategy Farm Bureau Life Collected Premiums Both traditional annuity and traditional and universal life insurance sales were strong in 2010. (Mittions) $100 $80 $60 $40 $20 fet) aio aio aio a0 Traditional Annuity Traditional and Universal Life ed
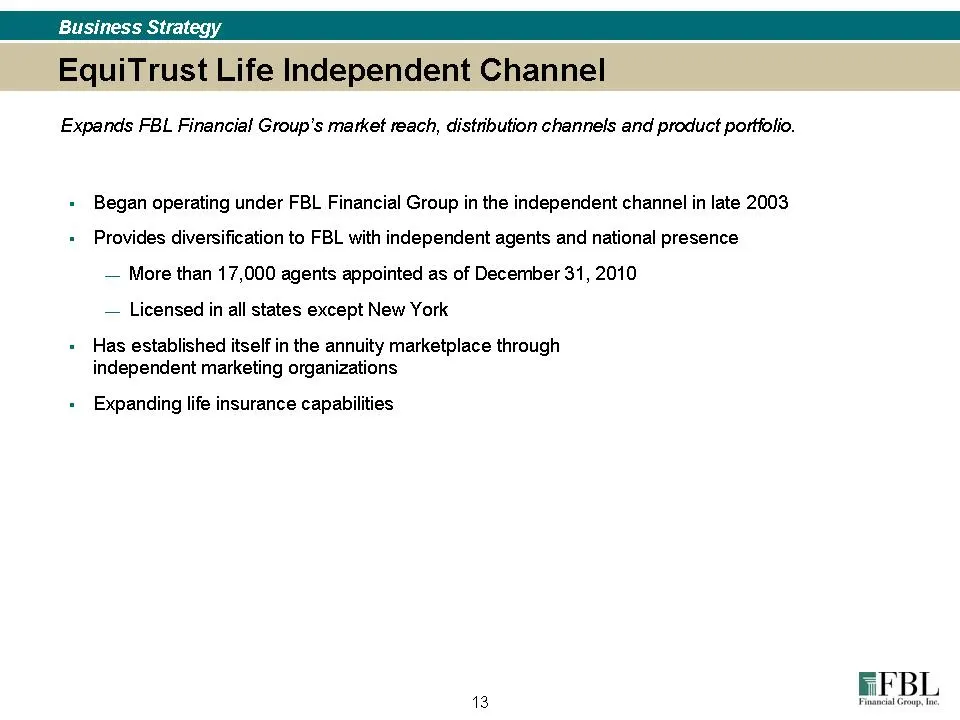
Slide 13: EquiTrust Life: Expanding Market Reach
Business Strategy Expands FBL Financial Group's market reach, distribution channels and product portfolio. Began operating under FBL Financial Group in the independent channel in late 2003 Provides diversification to FBL with independent agents and national presence — More than 17,000 agents appoint
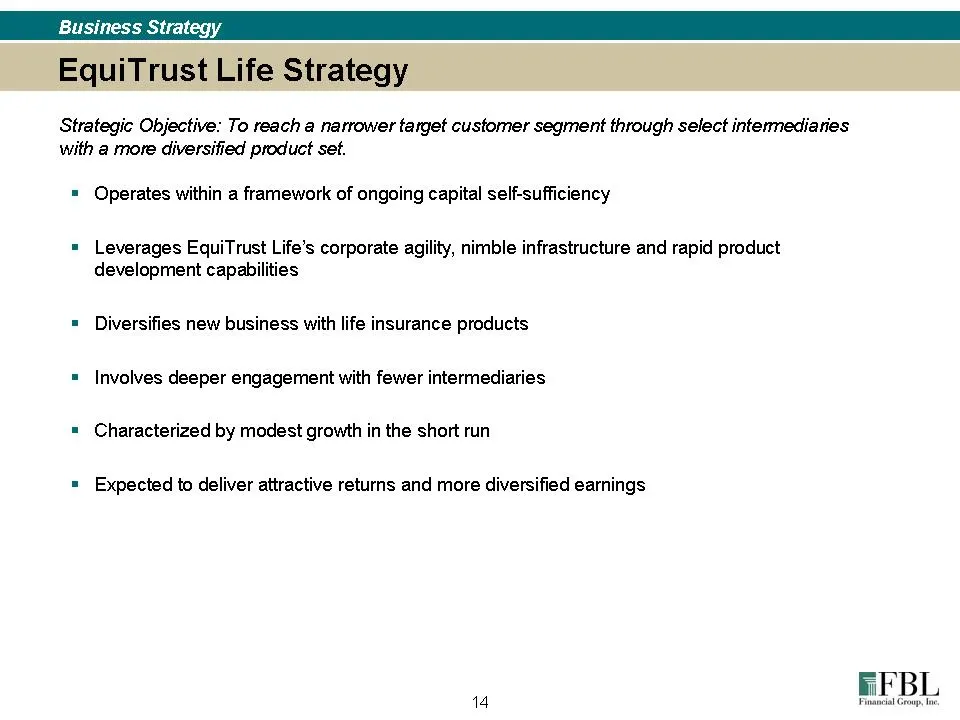
Slide 14: EquiTrust Life Strategic Objective
Business Strategy Strategic Objective: To reach a narrower target customer segment through select intermediaries with a more diversified product set. = Operates within a framework of ongoing capital self-sufficiency = Leverages EquiTrust Life's corporate agility, nimble infrastructure and rapid prod
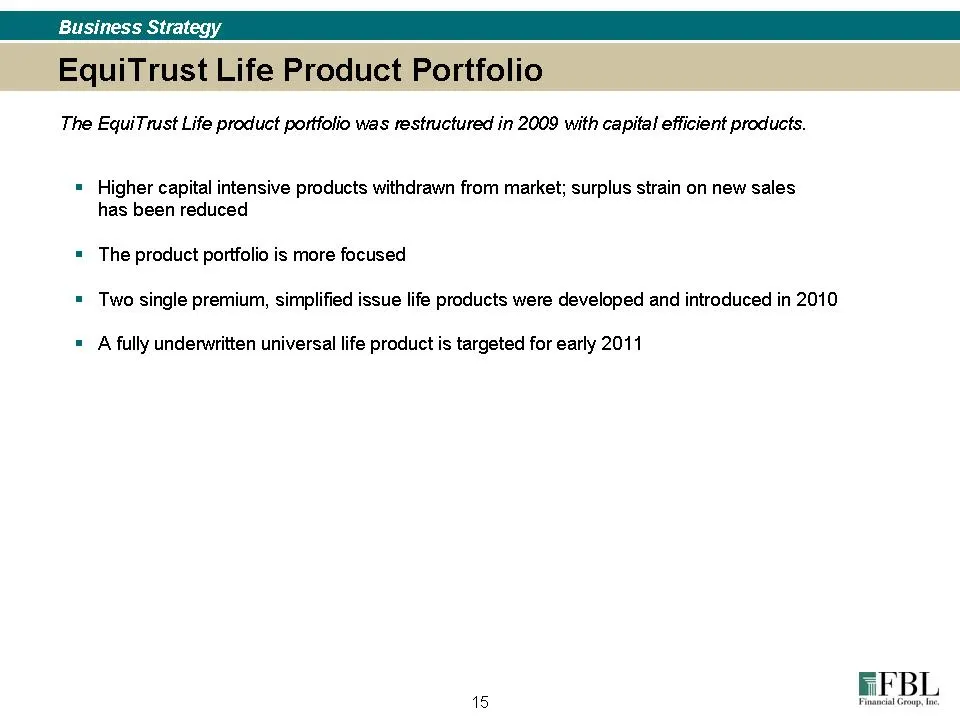
Slide 15: EquiTrust Life Product Portfolio Restructured
Business Strategy The EquiTrust Life product portfolio was restructured in 2009 with capital efficient products. = Higher capital intensive products withdrawn from market; surplus strain on new sales has been reduced = The product portfolio is more focused = Two single premium, simplified issue life
Slide 16: Business Strategy
= Company Overview = Business Strategy EFBL 16 Financial Group, fe,
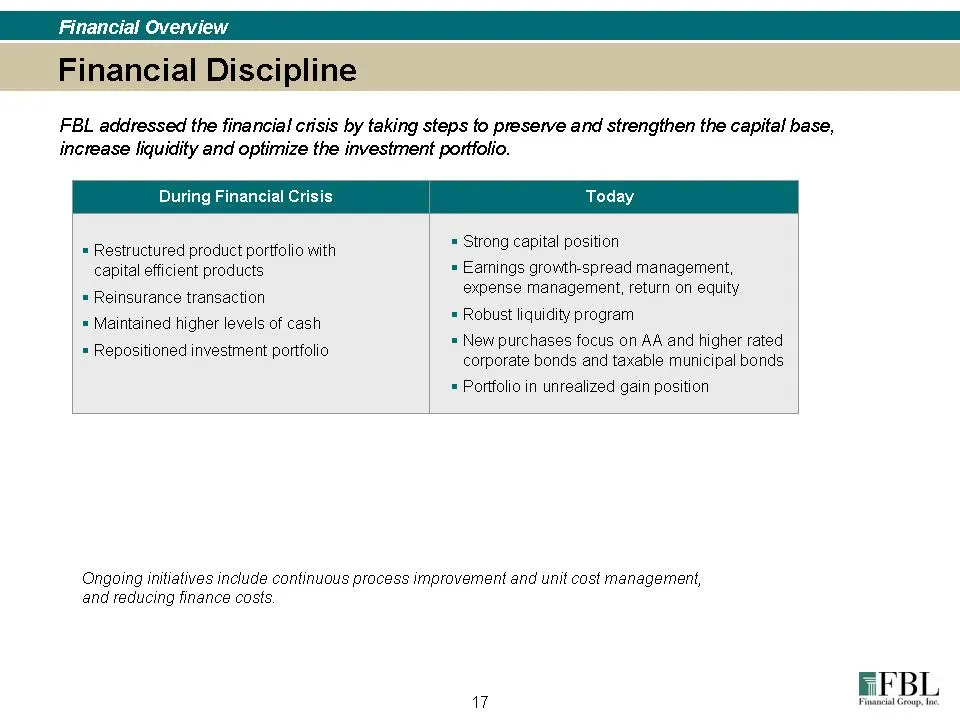
Slide 17: Actions Taken During the Financial Crisis
FBL addressed the financial crisis by taking steps fo preserve and strengthen the capital base, increase liquidity and optimize the investment portfolio. During Financial Crisis = Restructured product portfolio with O'Sutlg ea pliclipestiied capital efficient products = Eamings growth-spread managem
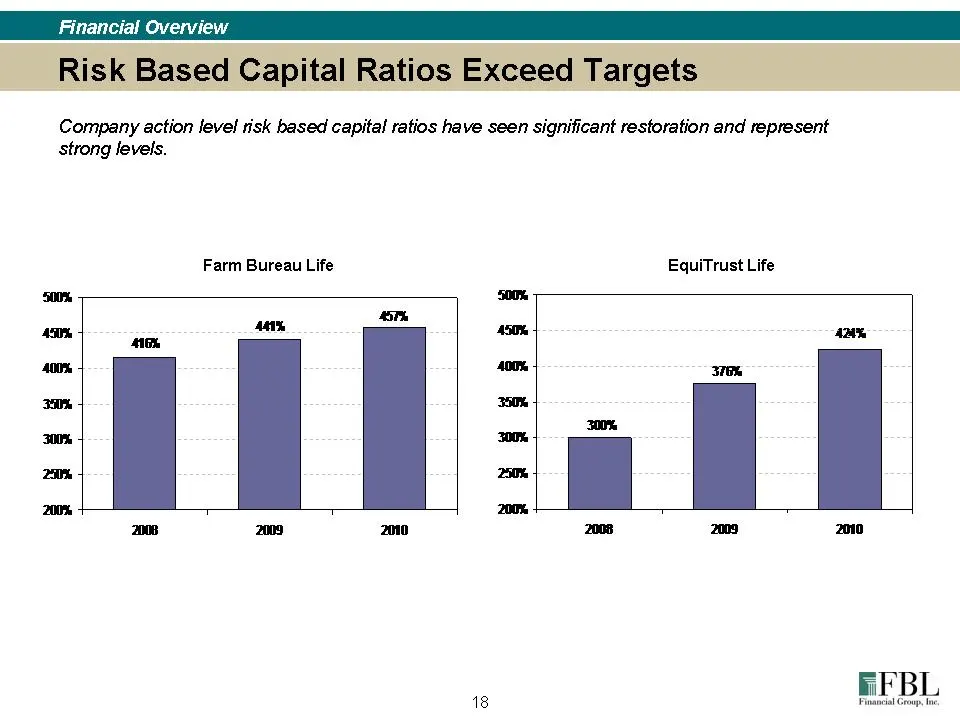
Slide 18: Risk Based Capital Ratios
Financial Overview Company action level risk based capital ratios have seen significant restoration and represent strong levels. Farm Bureau Life EquiTrust Life 500% 0% 15T% Cd 150% 5 A ‘oe Am 400% 10% 7% 35% 3% 20% 300% 20% . i [| 200% 1 200% 208 209 20 208 2009 amo EFBL 18 haat Grp
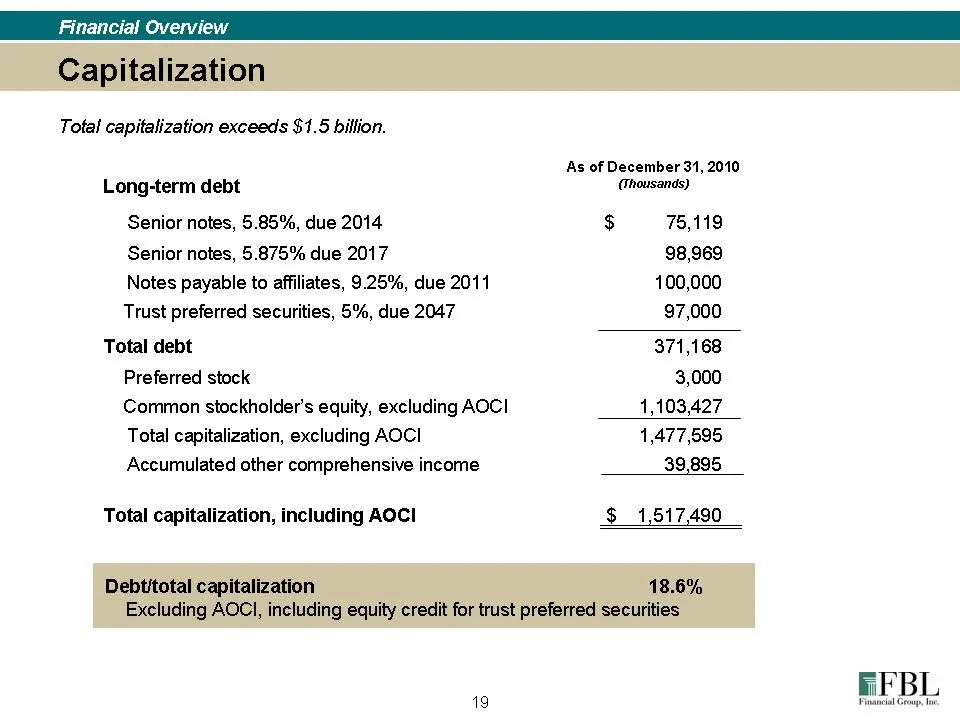
Slide 19: Total capitalization exceeds $1.5 billion
Total capitalization exceeds $1.5 billion. As of December 31, 2010 Long-term debt (Thousands) Senior notes, 5.85%, due 2014 $ 75,119 Senior notes, 5.875% due 2017 98,969 Notes payable to affiliates, 9.25%, due 2011 100,000. Trust preferred securities, 5%, due 2047 97,000 Total debt 371,168 Preferred
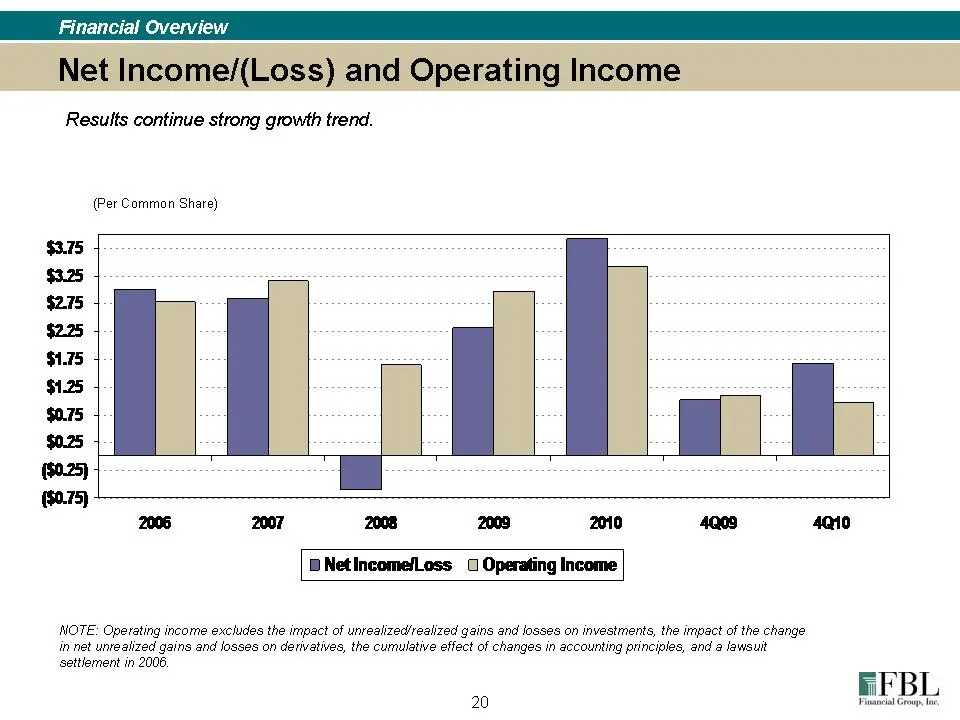
Slide 20: Results Continue Strong Growth Trend
Financial Overview Results continue strong growth trend. (Per Common Share) $275 $225 $1.75 2 $075 $0.25 2006 2007 2008 2003 2010 4Q03 4Qi0 BNetIncome/Loss ( Operating Income NOTE: Operating income excludes the impact of unrealized/realized gains and losses on investments, the impact of the change i
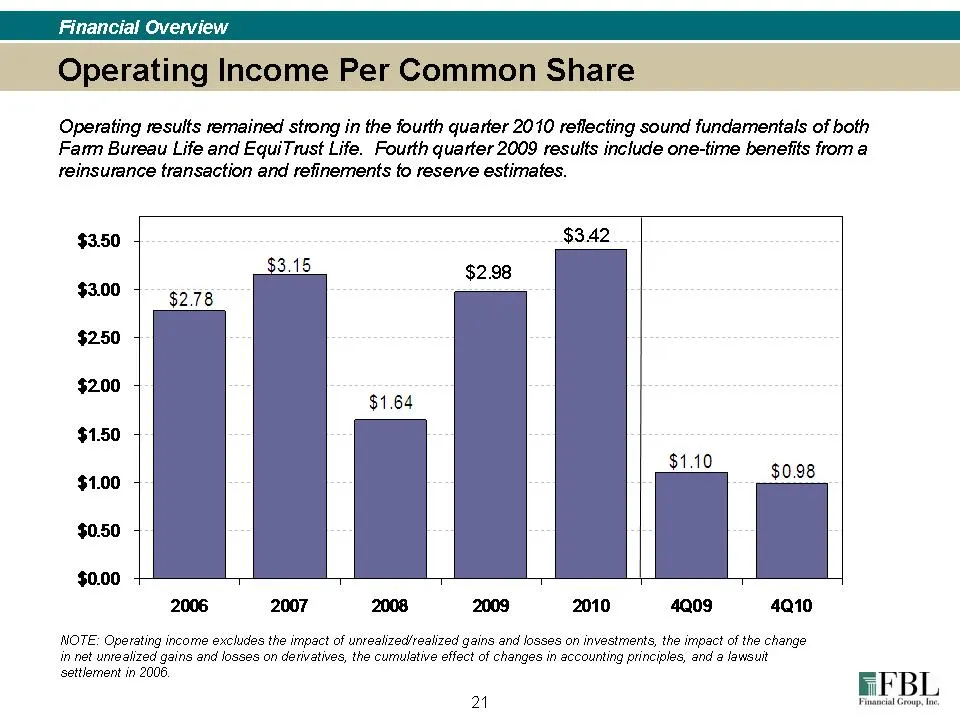
Slide 21: Operating Income Per Common Share
Financial Overview Operating Income Per Common Share Operating results remained strong in the fourth quarter 2010 reflecting sound fundamentals of both Farm Bureau Life and EquiTrust Life. Fourth quarter 2009 results include one-time benefits from a reinsurance transaction and refinements fo reserve
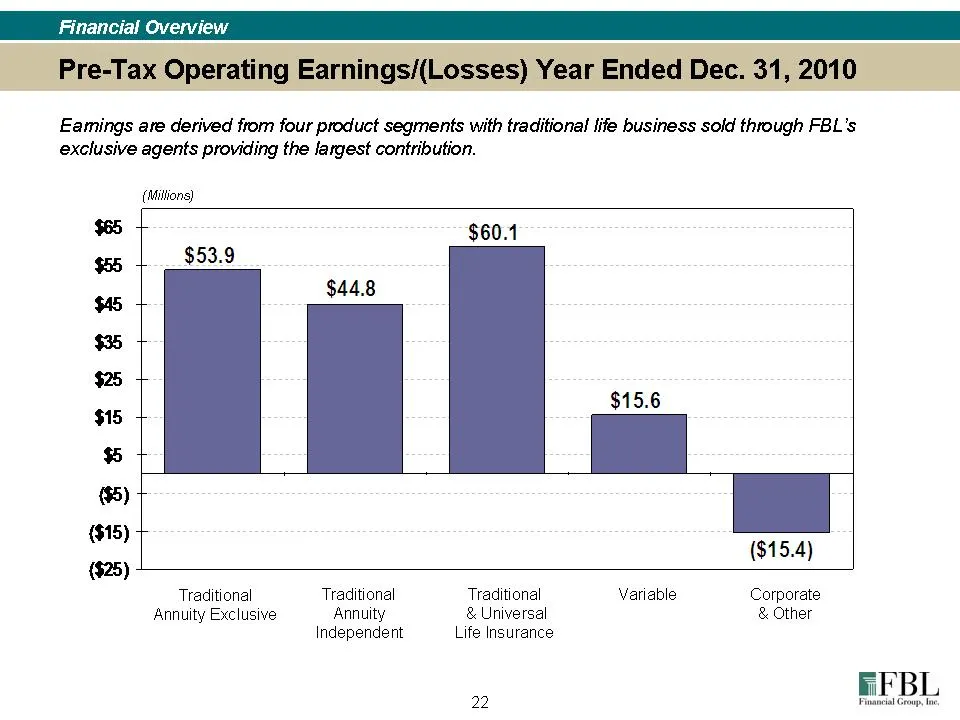
Slide 22: Earnings by Product Segment
Financial Overview Eamings are derived from four product segments with traditional life business sold through FBL's exclusive agents providing the largest contribution. (Millions) $5 7 $60.1 an $53.9 $44.8 “5 $35 gs + $15 ® ($15) + ($15.4) $25) Traditional Traditional Traditional Variable Corporate
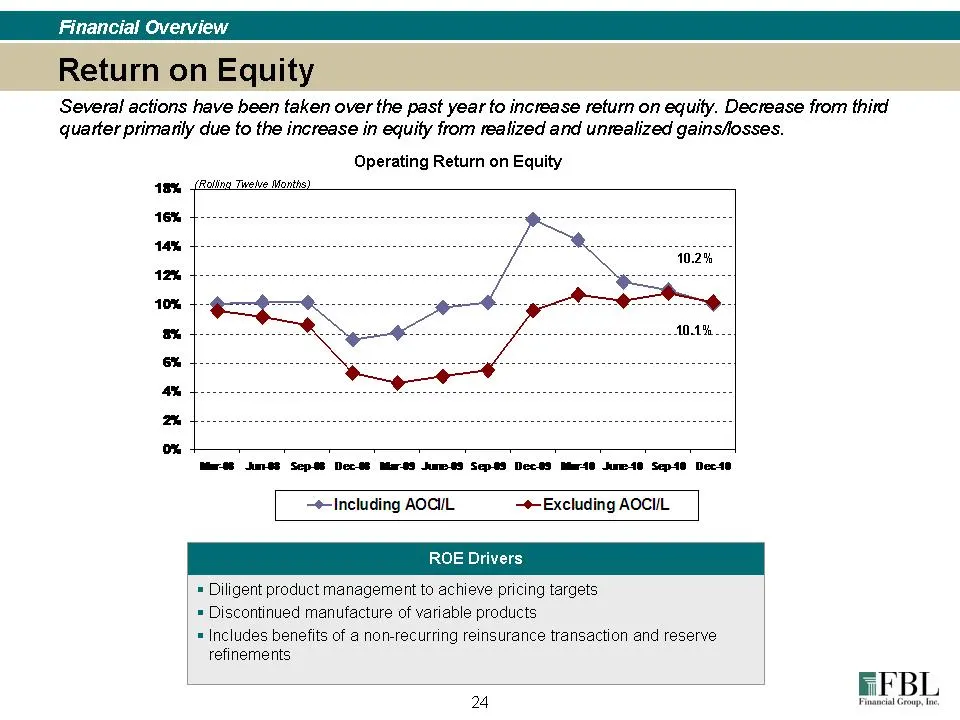
Slide 23: Operating Return on Equity
Several actions have been taken over the past year fo increase return on equity. Decrease from third quarter primarily due fo the increase in equity from realized and unrealized gainsfosses. Operating Return on Equity 49% (Ballo Twetve Monts: 14% Mia96 8S SepSS Dec8 Mares kunes9 Sepes Dec es Meart8
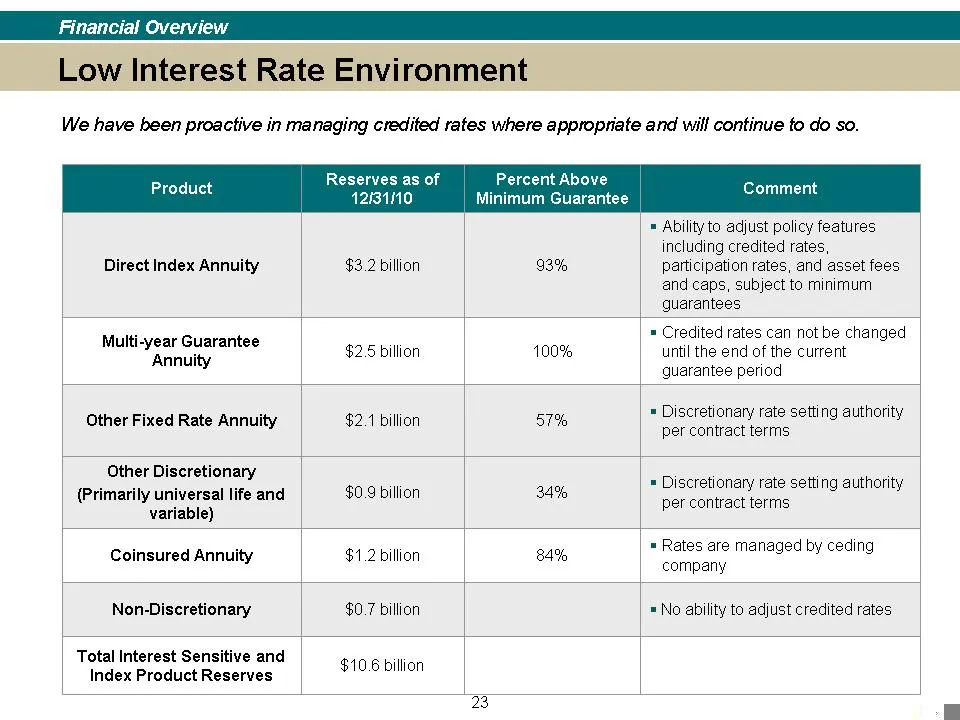
Slide 24: Managing Credited Rates
Financial Overview We have been proactive in managing credited rates where appropriate and will continue fo do so. Reserves as of Percent Above es 12131110 Minimum Guarantee pone * Ability to adjust policy features including credited rates, Direct Index Annuity $3.2 billion 93% patticipation rates,
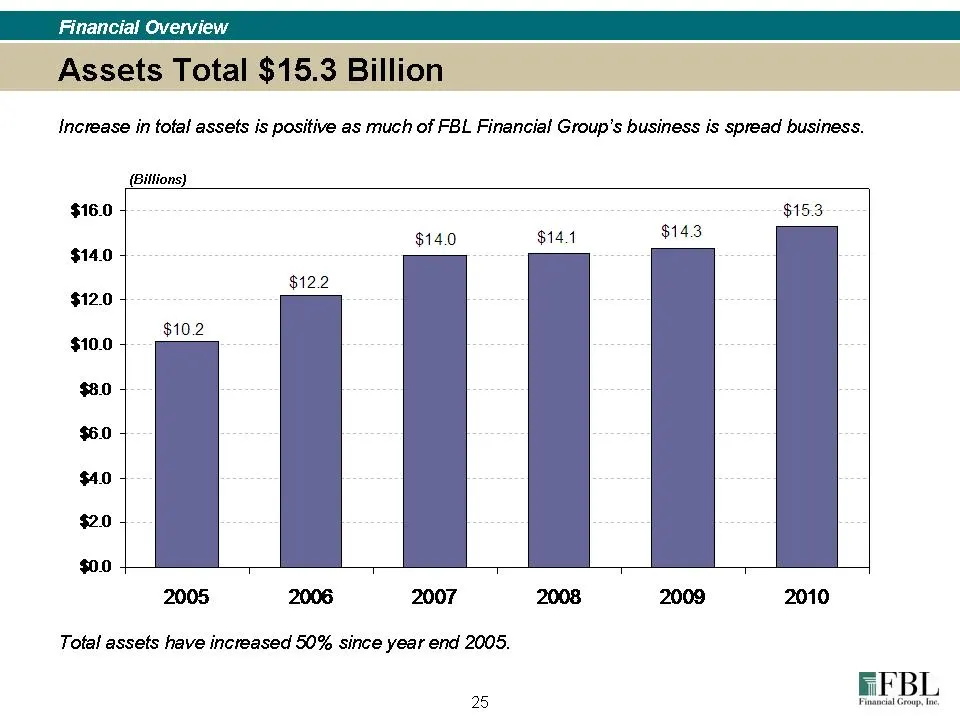
Slide 25: Assets Total $15.3 Billion
Financial Overview Assets Total $15.3 Billion increase in fofal assets is positive as much of FBL Financial Group's business is spread business. (Bittions) $16.0 $15.3 $14.0 $144 $143 $140 $12.2 $12.0 10.2 $10.0 : $80 $60 $40 $20 $00 , , T : 2005 2006 2007 2008 2009 Total assets have increased 50% s
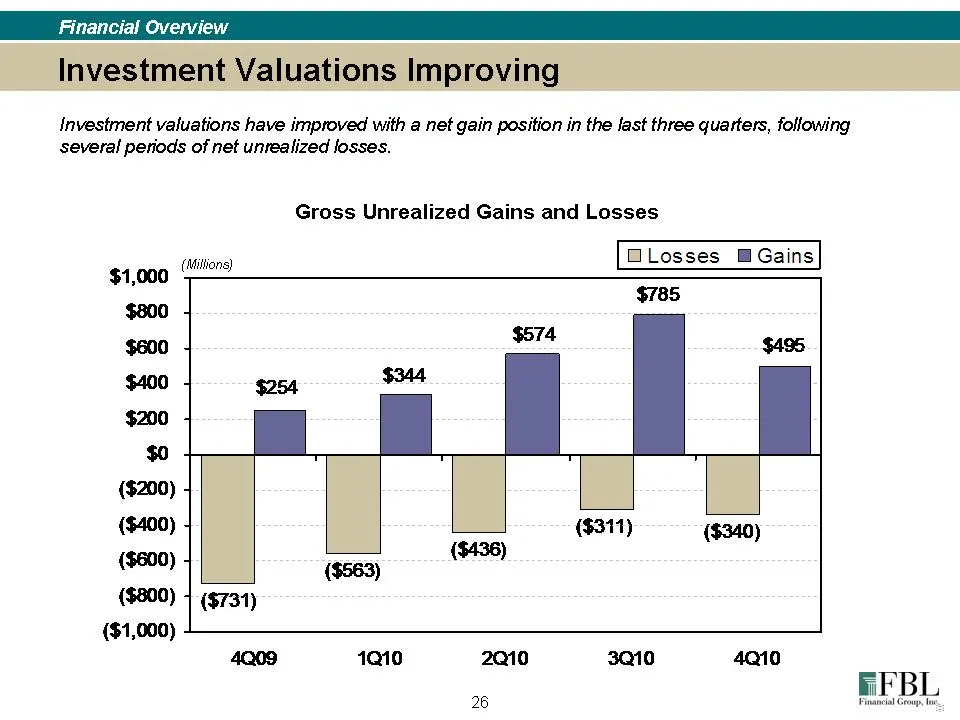
Slide 26: Investment valuations have improved
investment valuations have improved with a net gain position in the last three quarters, following several periods of net unrealized losses. Gross Unrealized Gains and Losses BLlosses_ @ Gains $1,000 “ers $800 $785 ($200) ($400) ($600) ($800) ($1,000) 4Q09 110 2Q10 3Q10 4Q10
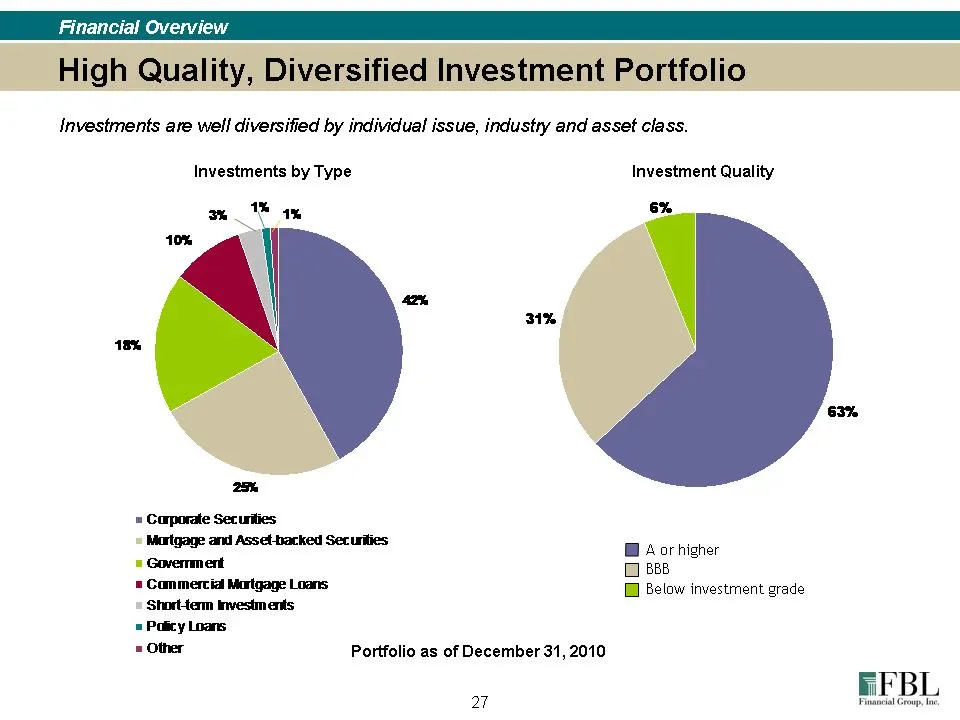
Slide 27: High Quality, Diversified Investment Portfolio
Financial Overview High Quality, Diversified Investment Portfolio investments are well diversified by individual issue, industry and asset class. Investments by Type Investment Quality 6% a ™ 1% 3% 63% = Corporate Securities Marigage and Asset-backed Securities Bi Aorhigher = Goverment 88a = Commerc
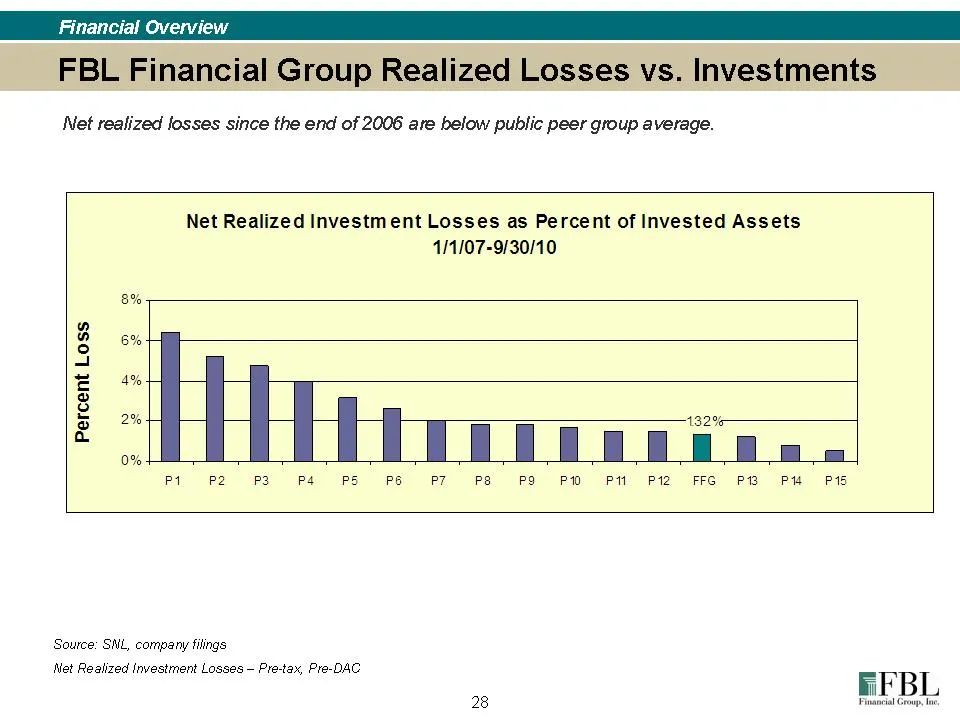
Slide 28: Net Realized Losses Below Peer Group Average
Net realized losses since the end of 2006 are below public peer group average. Net Realized Investment Losses as Percent of Invested Assets 111107-9/30/10 8% 6% 4% 2% LT 132% . PRR eee... P7 P8 PO PM OPM P12 FFG PR OPH OPIS Percent Loss Source: SNL, company filings Net Realized Investment Losses — P
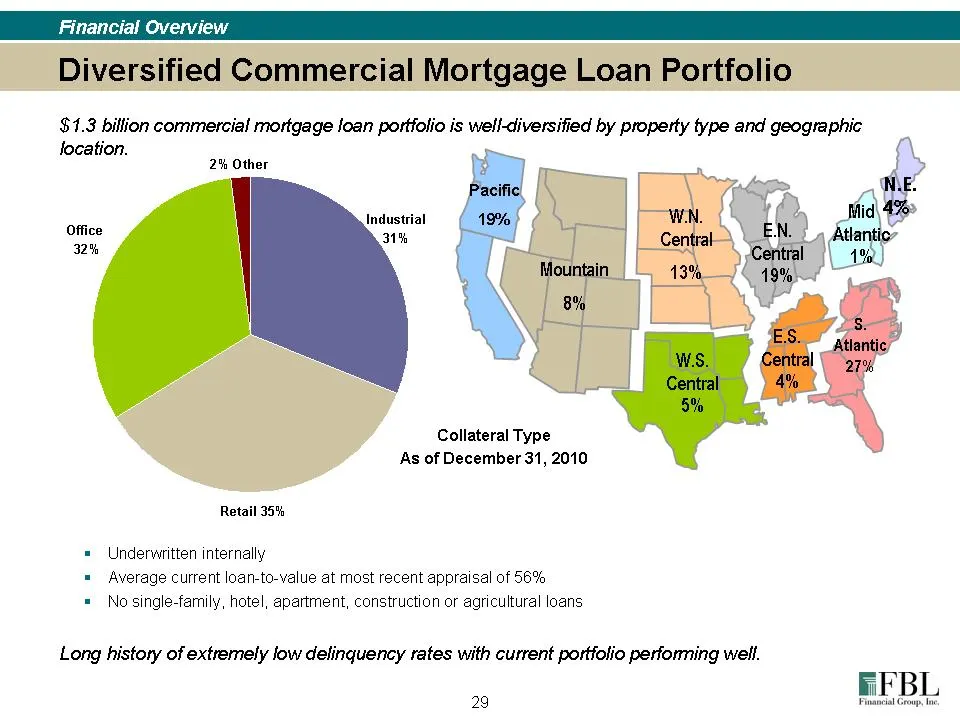
Slide 29: Diversified Commercial Mortgage Loan Portfolio
Financial Overview Diversified Commercial Mortgage Loan Portfolio $1.3 billion commercial mortgage loan porttolio is well-diversified by property type and geographic location. 2% Other of \ Industrial ae | 31% 32% Collateral Type As of December 31, 2010 Retail 35% = Underwritten internally = Average
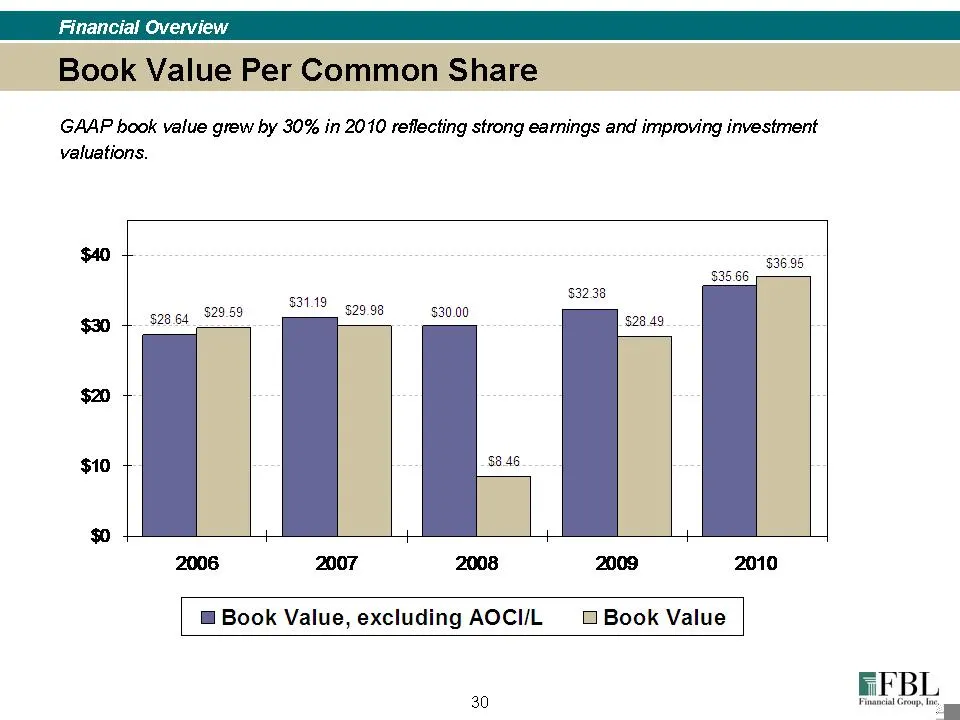
Slide 30: Book Value Per Common Share
Financial Overview Book Value Per Common Share GAAP book value grew by 30% in 2010 reflecting strong earnings and improving investment valuations. $36.95 $35.66 $32.38 $31.19 528.64 $29.59 $29.98 $30.00 aus $10 $8.46 2008 2007 2008 2009 2010 @ Book Value, excluding AOCI/L @ Book Value 30
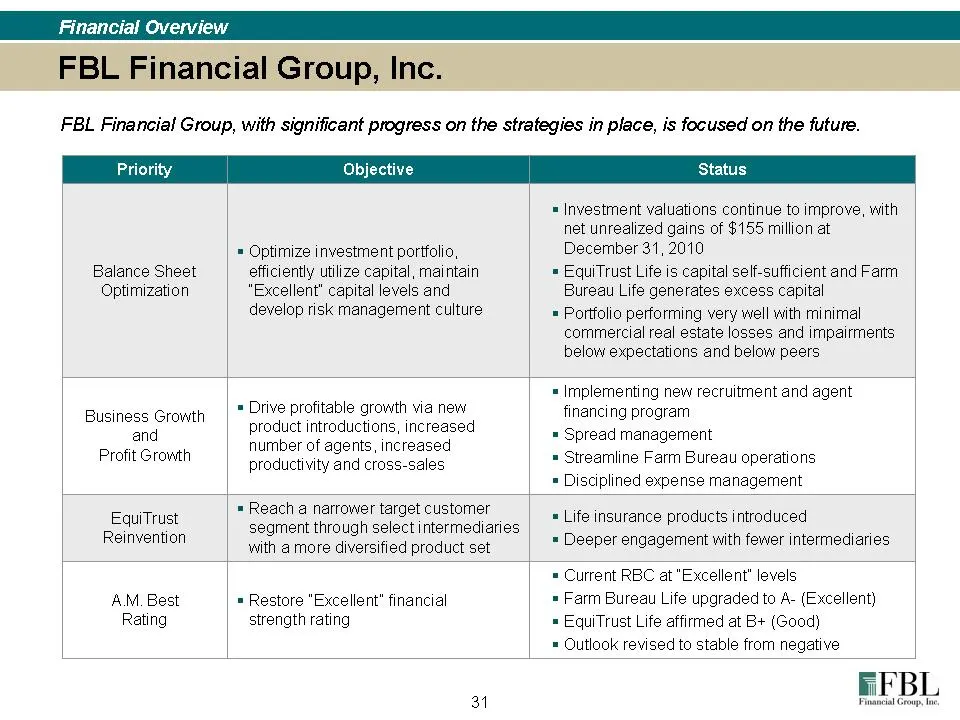
Slide 31: Focused on the Future: Priorities and Status
FBL Financial Group, with significant progress on the strategies in place, is focused on the future. Priority Balance Sheet Optimization Objective = Optimize investment portfolio, efficiently utilize capital, maintain “Excellent” capital levels and develop risk management culture Status = Investment
Slide 32: FBL Financial Group, Inc.
ii FBL Financial Group, Inc. p Farm Bureau Financial Services ¢ EquiTrust Financial Services www. fblfinancial.com
Source: SEC EDGAR · 8-K filed Feb 3, 2011
More decks from FBL Financial Group Inc
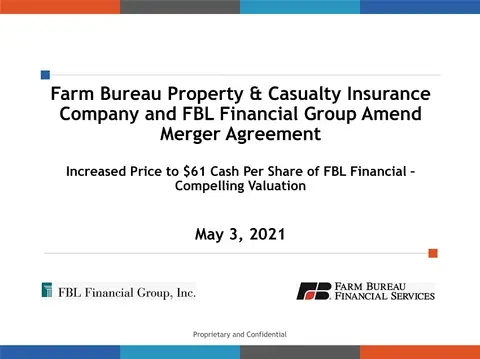 Merger or Acquisition (May 2021)8 slides · May 3, 2021
 Merger or Acquisition (April 2021)8 slides · Apr 22, 2021
 Merger or Acquisition (April 2021)6 slides · Apr 14, 2021
 Proxy Contest (April 2021)7 slides · Apr 13, 2021
 Merger or Acquisition (April 2021)8 slides · Apr 9, 2021
 Proxy Contest (April 2021)26 slides · Apr 7, 2021