Guaranty Bancorp — Sandler O'Neill + Partners 2013 West Coast Financial Services Conference
24 slides from Guaranty Bancorp's conference presentation, Mar 4, 2013

Slide 1: Sandler O'Neill 2013 West Coast Financial Services Conference
Sandler O’Neill + Partners, L.P. 2013 West Coast Financial Services Conference Marina del Rey, California March 5, 2013
Slide 2: Forward Looking Statements
2 Forward Looking Statements This presentation contains forward-looking statements, which are included in accordance with the “safe harbor” provisions of the Private Securities Litigation Reform Act of 1995. In some cases, you can identify forward-looking statements by terminology such as “may,” “wi
Slide 3: Company Highlights
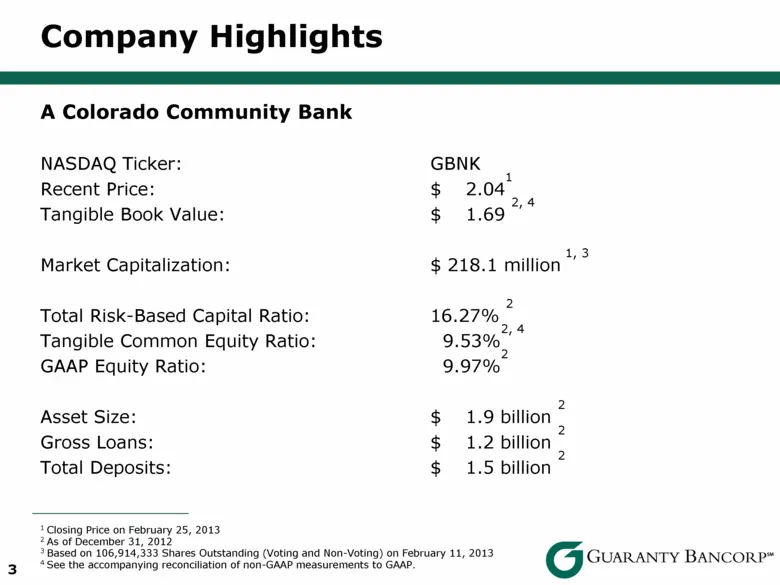
1 Closing Price on February 25, 2013 2 As of December 31, 2012 3 Based on 106,914,333 Shares Outstanding (Voting and Non-Voting) on February 11, 2013 4 See the accompanying reconciliation of non-GAAP measurements to GAAP. 3 A Colorado Community Bank NASDAQ Ticker: GBNK Recent Price: $ 2.041 Tangible
Slide 4: About Us
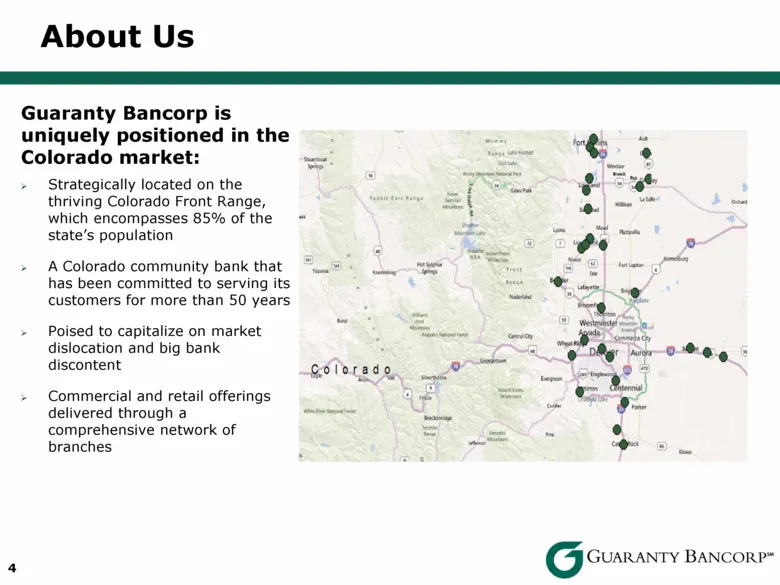
4 Guaranty Bancorp is uniquely positioned in the Colorado market: Strategically located on the thriving Colorado Front Range, which encompasses 85% of the state’s population A Colorado community bank that has been committed to serving its customers for more than 50 years Poised to capitalize on mark
Slide 5: Investment Considerations
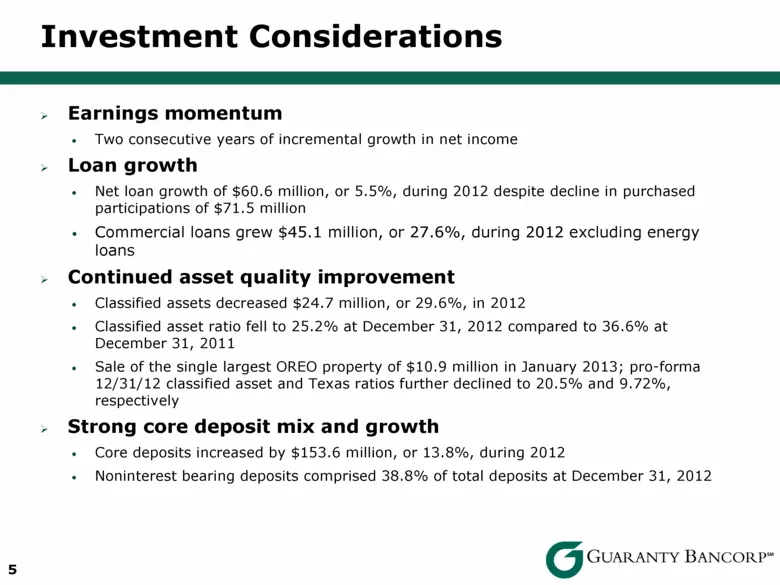
5 Investment Considerations Earnings momentum Two consecutive years of incremental growth in net income Loan growth Net loan growth of $60.6 million, or 5.5%, during 2012 despite decline in purchased participations of $71.5 million Commercial loans grew $45.1 million, or 27.6%, during 2012 excluding
Slide 6: Investment Considerations
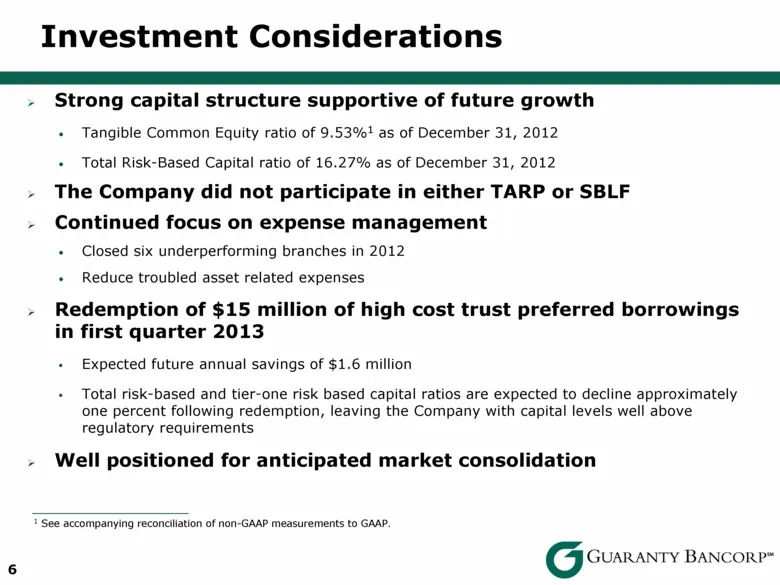
1 See accompanying reconciliation of non-GAAP measurements to GAAP. 6 Strong capital structure supportive of future growth Tangible Common Equity ratio of 9.53%1 as of December 31, 2012 Total Risk-Based Capital ratio of 16.27% as of December 31, 2012 The Company did not participate in either TARP or
Slide 7: Private Capital Management Acquisition
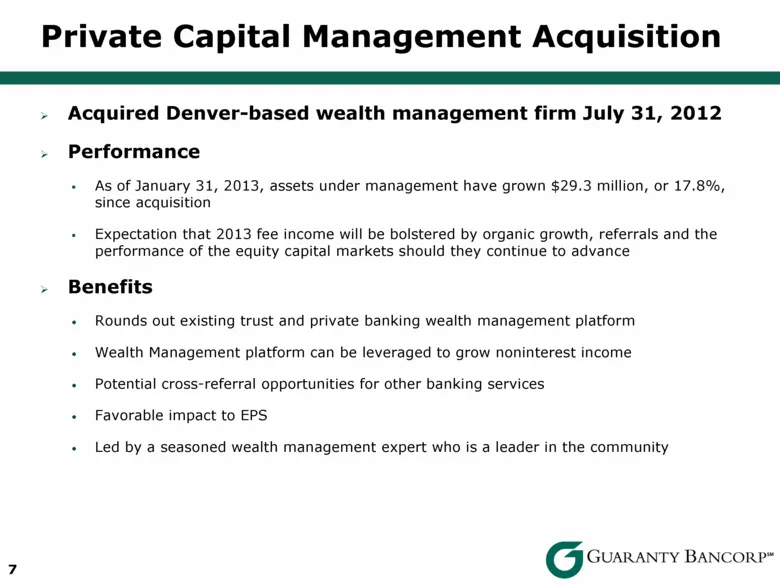
7 Private Capital Management Acquisition Acquired Denver-based wealth management firm July 31, 2012 Performance As of January 31, 2013, assets under management have grown $29.3 million, or 17.8%, since acquisition Expectation that 2013 fee income will be bolstered by organic growth, referrals and th
Slide 8: Deposit Composition
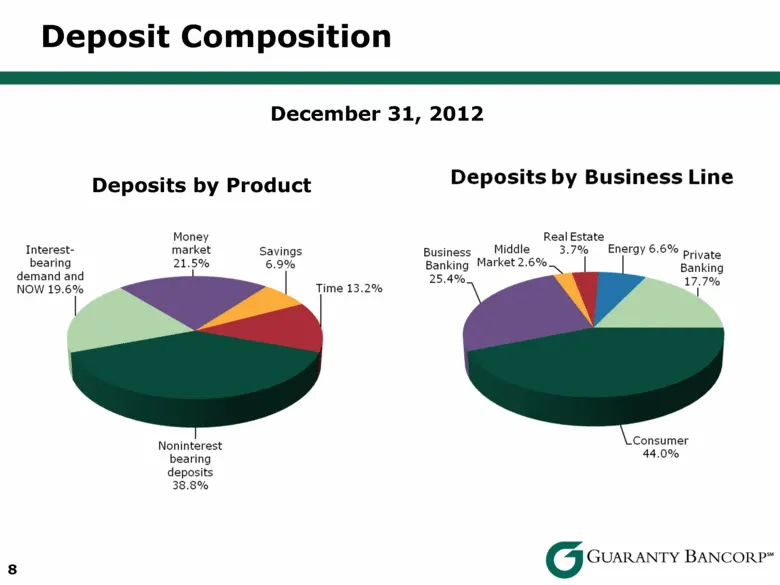
8 Deposit Composition December 31, 2012 Deposits by Product
Slide 9: Deposit Trends
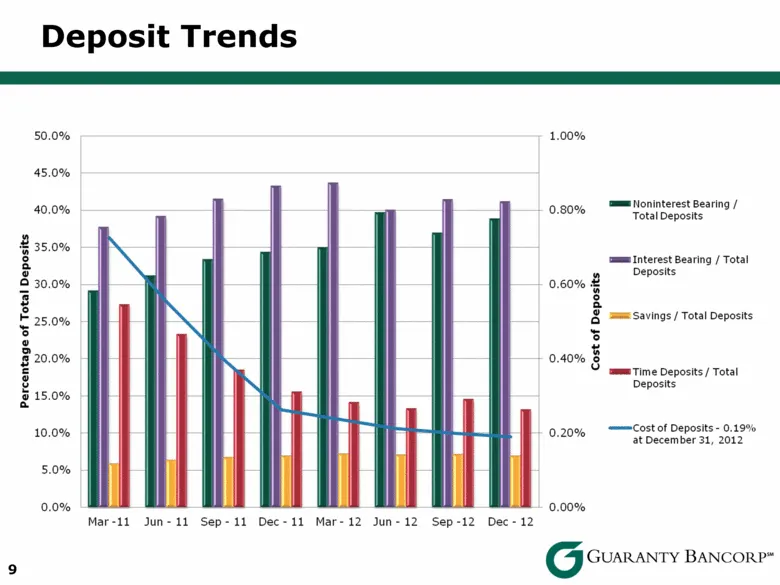
Deposit Trends 2 2 3 20.0% | H | 3 er H z 3 g Mar-11 Jun-11 Sep-11 Dec-11 Mar-12 Jun-12 Sep-12 Dec-12 sm toninterest Bearing / 3 Total Deposits ere eran ce Paes oso% 2 & 8 ee savings / Total Deposits 3. Prost ‘me Time Deposits / Total Deposits cost of Deposits- 0.19% Cr at December 31, 2012 0.00% Go
Slide 10: Loan Composition
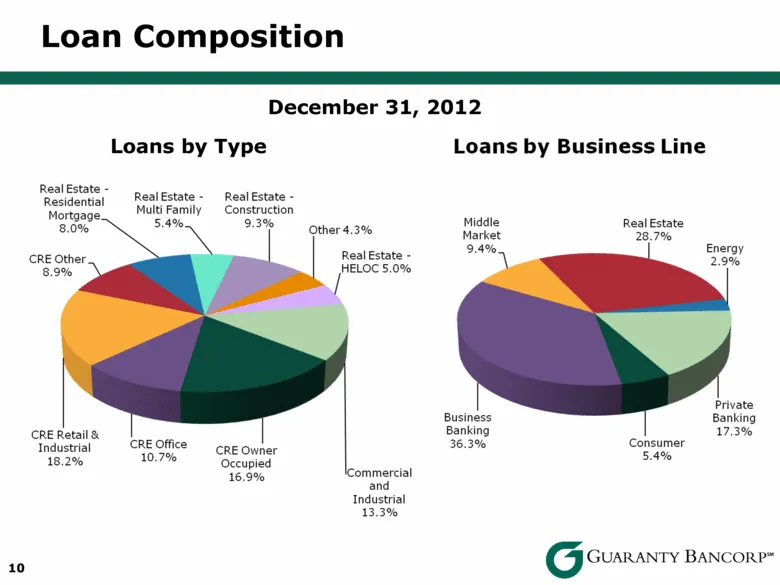
10 December 31, 2012 Loans by Type Loan Composition
Slide 11: CRE Lending Capacity
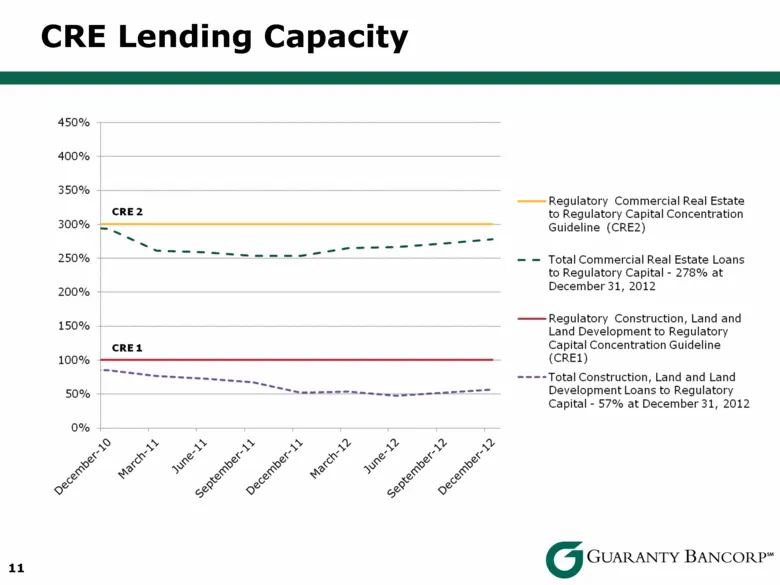
CRE Lending Capacity 450% 400% 350% Regulatory Commercial Real Estate Rez to Regulatory Capital Concentration 300% = Guideline (CRE2) 250% ees = = Total Commercial Real Estate Loans to Regulatory Capital - 278% at poor December 31, 2012 rors —Regulatory Construction, Land and Land Development to Reg
Slide 12: Classified Asset Improvement
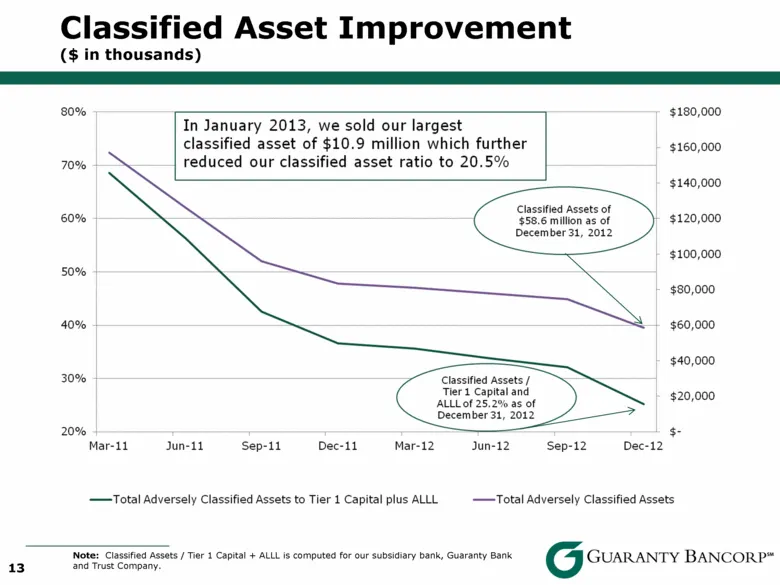
13 Note: Classified Assets / Tier 1 Capital + ALLL is computed for our subsidiary bank, Guaranty Bank and Trust Company. Classified Asset Improvement ($ in thousands)
Slide 13: Strong Capital Ratios
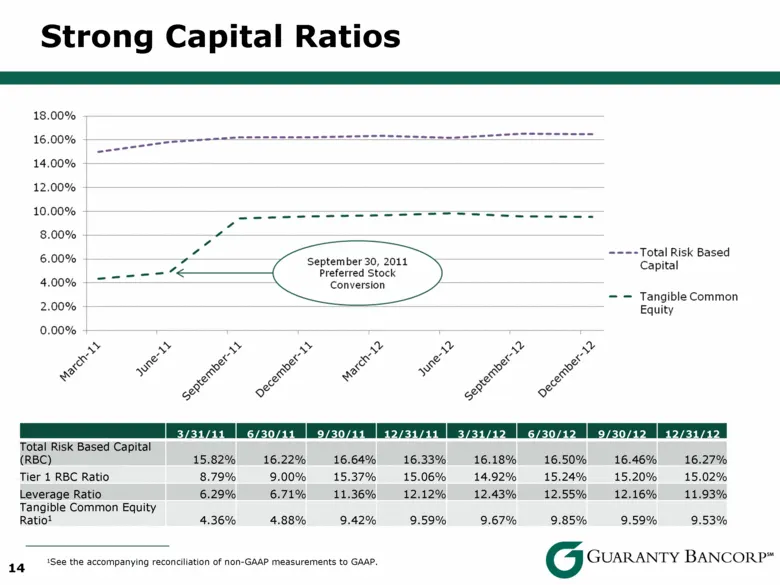
14 3/31/11 6/30/11 9/30/11 12/31/11 3/31/12 6/30/12 9/30/12 12/31/12 Total Risk Based Capital (RBC) 15.82% 16.22% 16.64% 16.33% 16.18% 16.50% 16.46% 16.27% Tier 1 RBC Ratio 8.79% 9.00% 15.37% 15.06% 14.92% 15.24% 15.20% 15.02% Leverage Ratio 6.29% 6.71% 11.36% 12.12% 12.43% 12.55% 12.16% 11.93% Tang
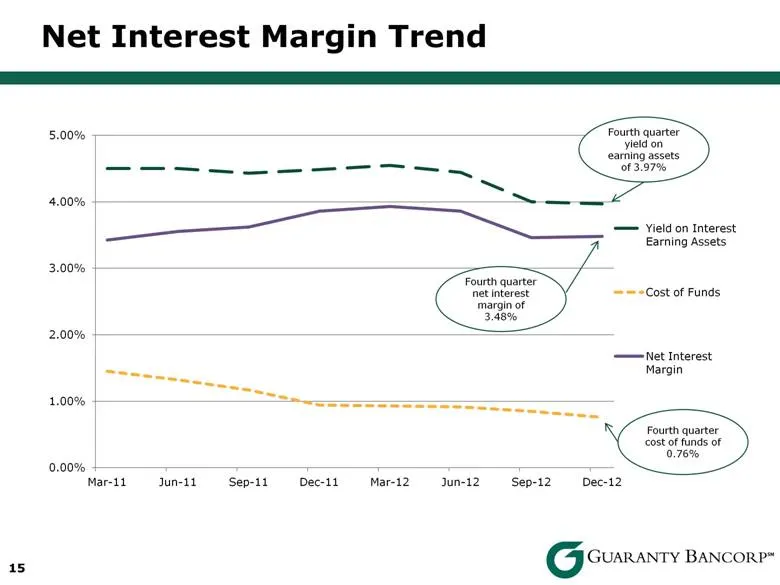
Slide 14: Net Interest Margin Trend
15 Fourth quarter yield on earning assets of 3.97% Net Interest Margin Trend
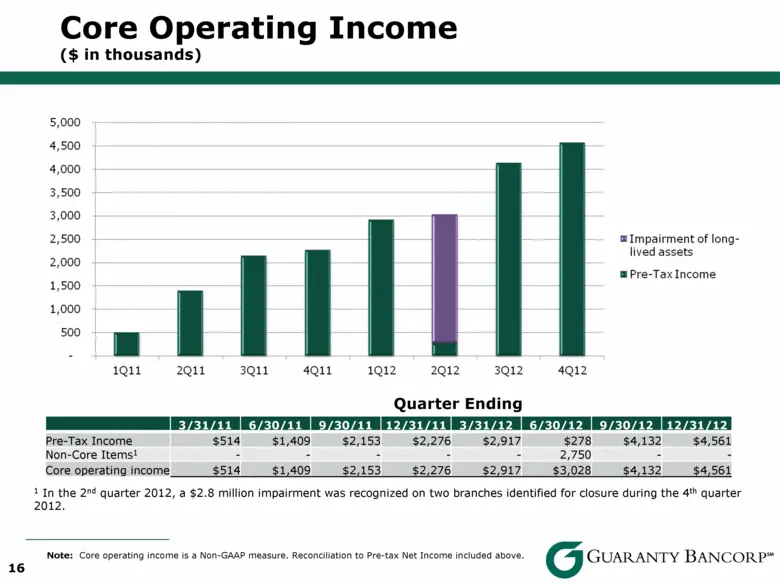
Slide 15: Core Operating Income
16 3/31/11 6/30/11 9/30/11 12/31/11 3/31/12 6/30/12 9/30/12 12/31/12 Pre-Tax Income $514 $1,409 $2,153 $2,276 $2,917 $278 $4,132 $4,561 Non-Core Items1 - - - - - 2,750 - - Core operating income $514 $1,409 $2,153 $2,276 $2,917 $3,028 $4,132 $4,561 Quarter Ending Note: Core operating income is a Non-
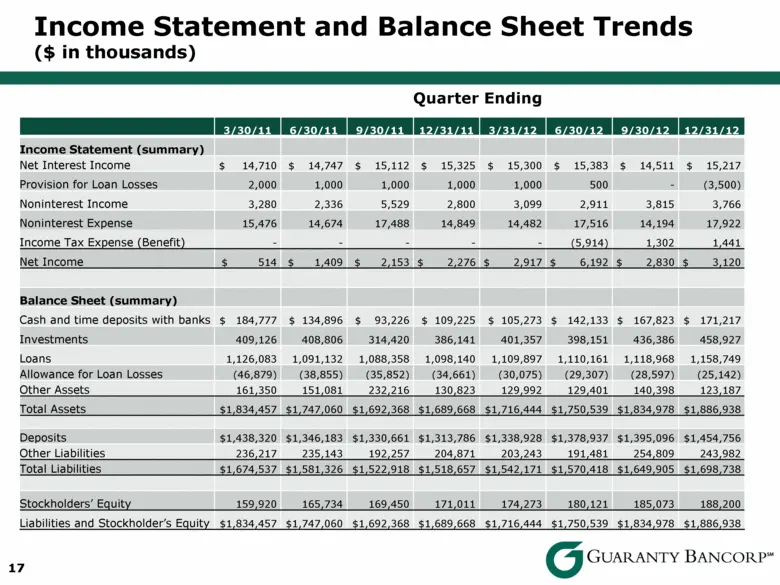
Slide 16: Income Statement and Balance Sheet Trends
Income Statement and Balance Sheet Trends ($ in thousands) 17 3/30/11 6/30/11 9/30/11 12/31/11 3/31/12 6/30/12 9/30/12 12/31/12 Income Statement (summary) Net Interest Income $ 14,710 $ 14,747 $ 15,112 $ 15,325 $ 15,300 $ 15,383 $ 14,511 $ 15,217 Provision for Loan Losses 2,000 1,000 1,000 1,000 1,0

Slide 17: Colorado Market
Colorado Market Govreanry BANCORP*
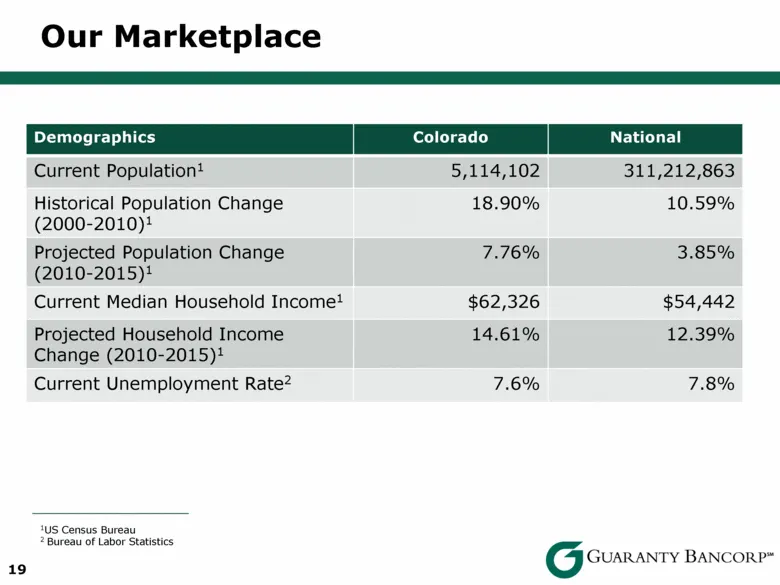
Slide 18: Our Marketplace Demographics
1US Census Bureau 2 Bureau of Labor Statistics 19 Our Marketplace Demographics Colorado National Current Population1 5,114,102 311,212,863 Historical Population Change (2000-2010)1 18.90% 10.59% Projected Population Change (2010-2015)1 7.76% 3.85% Current Median Household Income1 $62,326 $54,442 Pro
Slide 19: Our Marketplace Business Climate
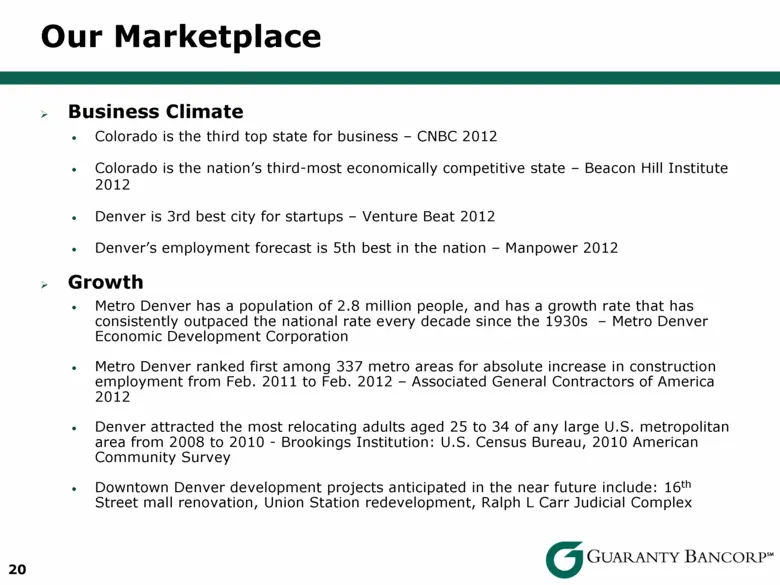
20 Our Marketplace Business Climate Colorado is the third top state for business – CNBC 2012 Colorado is the nation’s third-most economically competitive state – Beacon Hill Institute 2012 Denver is 3rd best city for startups – Venture Beat 2012 Denver’s employment forecast is 5th best in the nation
Slide 20: Our Marketplace Economy
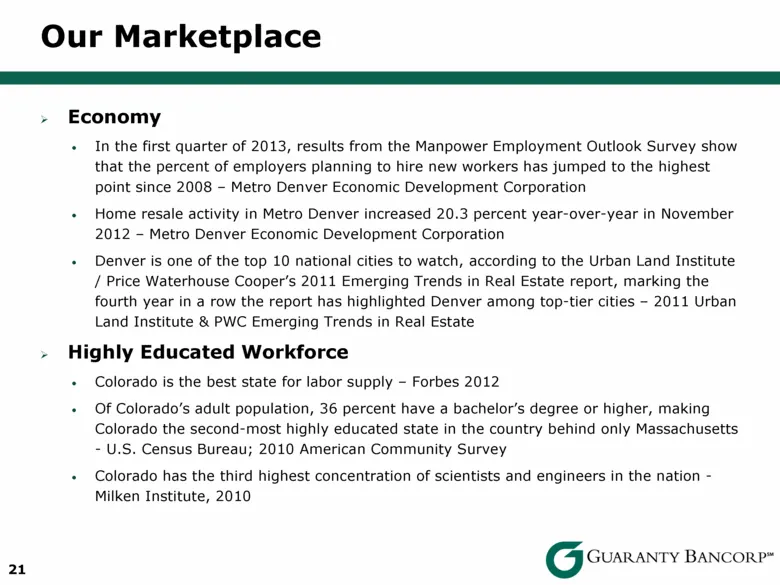
21 Our Marketplace Economy In the first quarter of 2013, results from the Manpower Employment Outlook Survey show that the percent of employers planning to hire new workers has jumped to the highest point since 2008 – Metro Denver Economic Development Corporation Home resale activity in Metro Denver
Slide 21: Metro Denver Employer Expansions
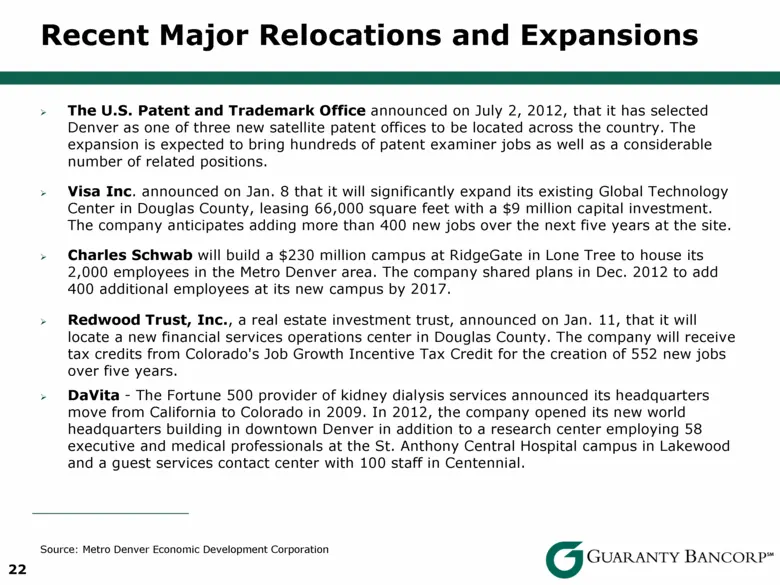
Source: Metro Denver Economic Development Corporation 22 The U.S. Patent and Trademark Office announced on July 2, 2012, that it has selected Denver as one of three new satellite patent offices to be located across the country. The expansion is expected to bring hundreds of patent examiner jobs as w
Slide 22: Metro Denver Employer Expansions
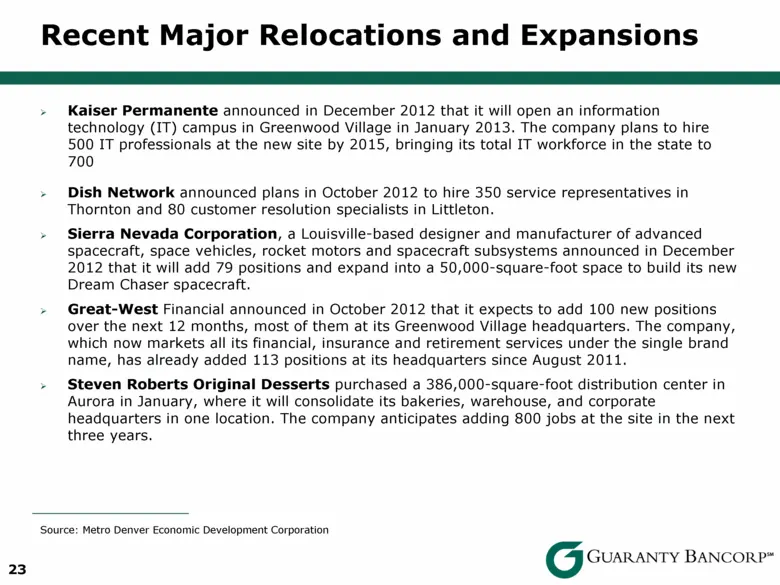
Source: Metro Denver Economic Development Corporation 23 Kaiser Permanente announced in December 2012 that it will open an information technology (IT) campus in Greenwood Village in January 2013. The company plans to hire 500 IT professionals at the new site by 2015, bringing its total IT workforce
Slide 23: Reconciliations of Non-GAAP Measures
24 Reconciliations of Non-GAAP Measures
Slide 24: Non-GAAP Measure Reconcilements
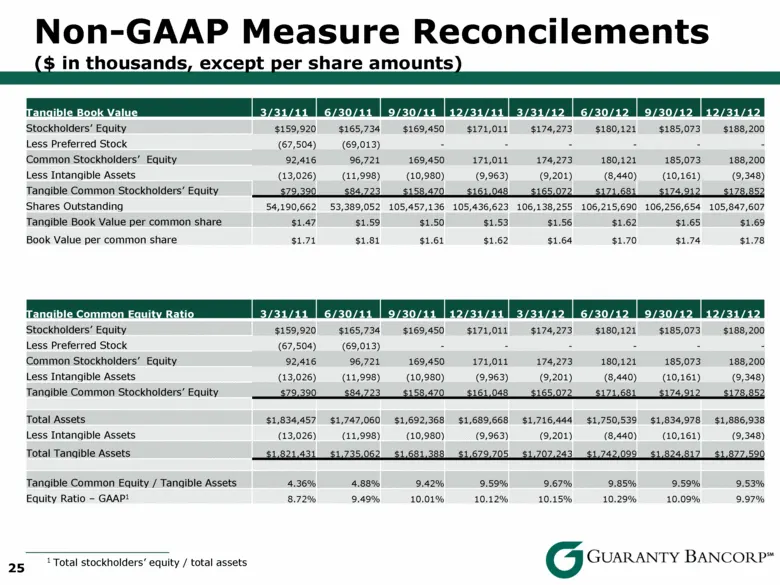
Non-GAAP Measure Reconcilements ($ in thousands, except per share amounts) 25 Tangible Book Value 3/31/11 6/30/11 9/30/11 12/31/11 3/31/12 6/30/12 9/30/12 12/31/12 Stockholders’ Equity $159,920 $165,734 $169,450 $171,011 $174,273 $180,121 $185,073 $188,200 Less Preferred Stock (67,504) (69,013) - -
Source: SEC EDGAR · 8-K filed Mar 4, 2013
More decks from Guaranty Bancorp
 Merger or Acquisition (May 2018)19 slides · May 23, 2018
 Merger or Acquisition (July 2017)8 slides · Jul 19, 2017
 D.A. Davidson 19th Annual Financial Services Conference 201722 slides · May 9, 2017
 FIG Partners 8th Annual West Coast Bank CEO Forum 201727 slides · Jan 31, 2017
 2016 FBR 23rd Annual Investor Conference27 slides · Nov 28, 2016
 2016 KBW Community Bank Investor Conference26 slides · Aug 1, 2016