Guaranty Bancorp — FIG Partners 8th Annual West Coast Bank CEO Forum 2017
27 slides from Guaranty Bancorp's conference presentation, Jan 31, 2017
Slide 1: FIG Partners 8th Annual West Coast Bank CEO Forum
FIG Partners 8th Annual West Coast Bank CEO Forum Los Angeles, CA February 1st – 2nd, 2017
Slide 2: Forward-looking statements
This presentation contains forward-looking statements, which are included in accordance with the “safe harbor” provisions of the Private Securities Litigation Reform Act of 1995. In some cases, you can identify forward-looking statements by terminology such as “may,” “will,” “should,” “could,” “expe
Slide 3: Guaranty Bancorp – About Us
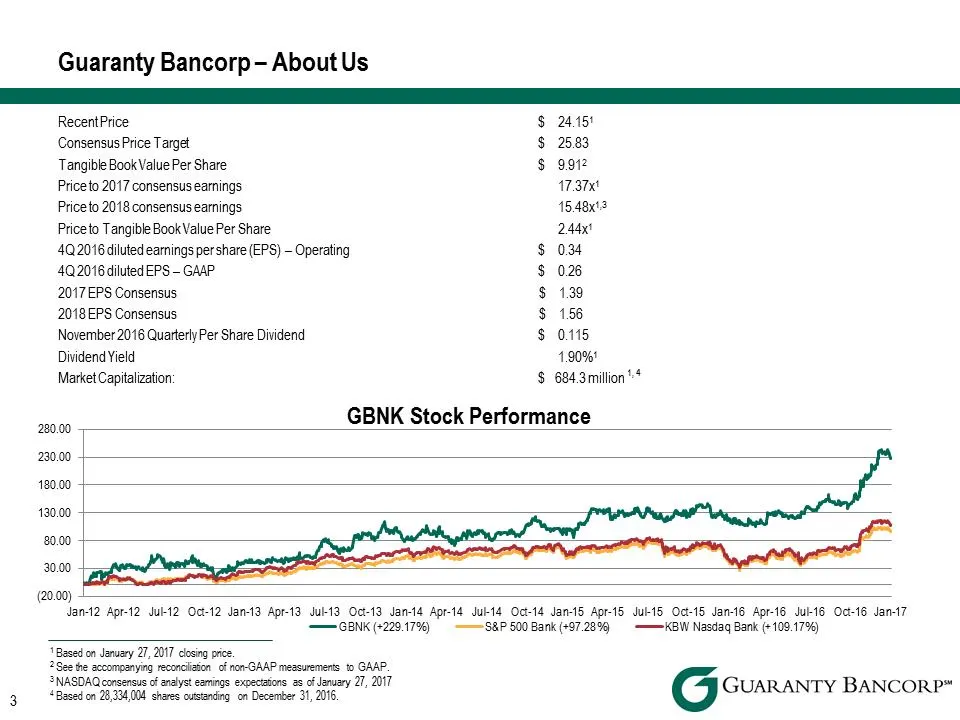
Recent Price $ 24.151 Consensus Price Target $ 25.83 Tangible Book Value Per Share $ 9.912 Price to 2017 consensus earnings 17.37x1 Price to 2018 consensus earnings 15.48x1,3 Price to Tangible Book Value Per Share 2.44x1 4Q 2016 diluted earnings per share (EPS) – Operating $ 0.34 4Q 2016 diluted EPS
Slide 4: Guaranty Bancorp is uniquely positioned in the Colorado market
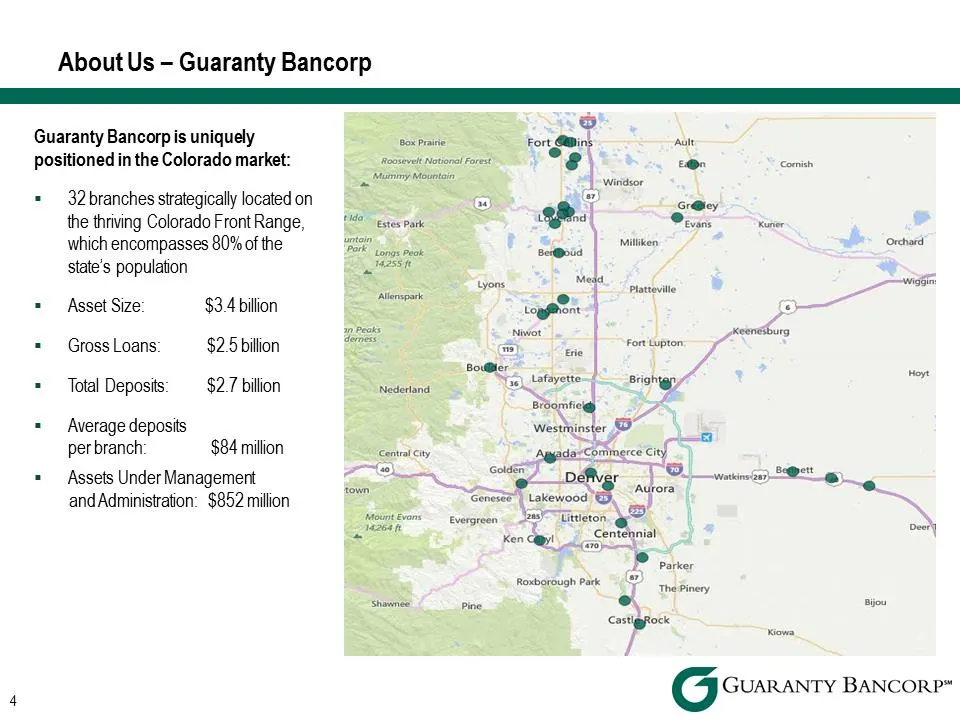
Guaranty Bancorp is uniquely positioned in the Colorado market: .32 branches strategically located on the thriving Colorado Front Range, which encompasses 80% of the state’s population .Asset Size: $3.4 billion .Gross Loans: $2.5 billion .Total Deposits: $2.7 billion .Average deposits per branch: $8
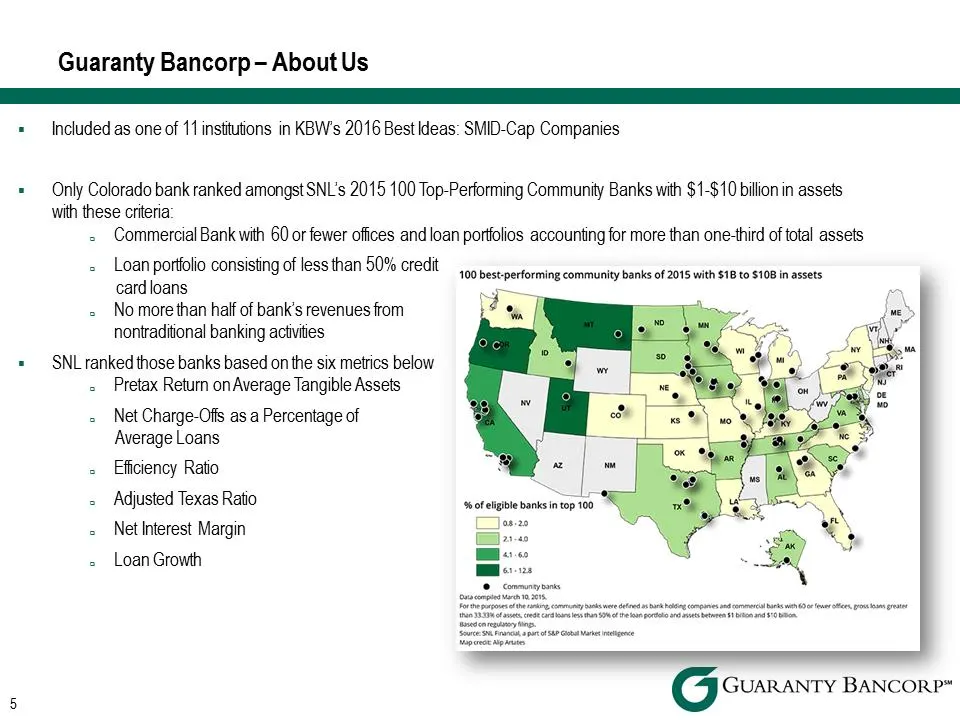
Slide 5: KBW Best Ideas and SNL Top-Performing Community Banks
.Included as one of 11 institutions in KBW’s 2016 Best Ideas: SMID-Cap Companies Only Colorado bank ranked amongst SNL’s 2015 100 Top-Performing Community Banks with $1-$10 billion in assets with these criteria: .Commercial Bank with 60 or fewer offices and loan portfolios accounting for more than o
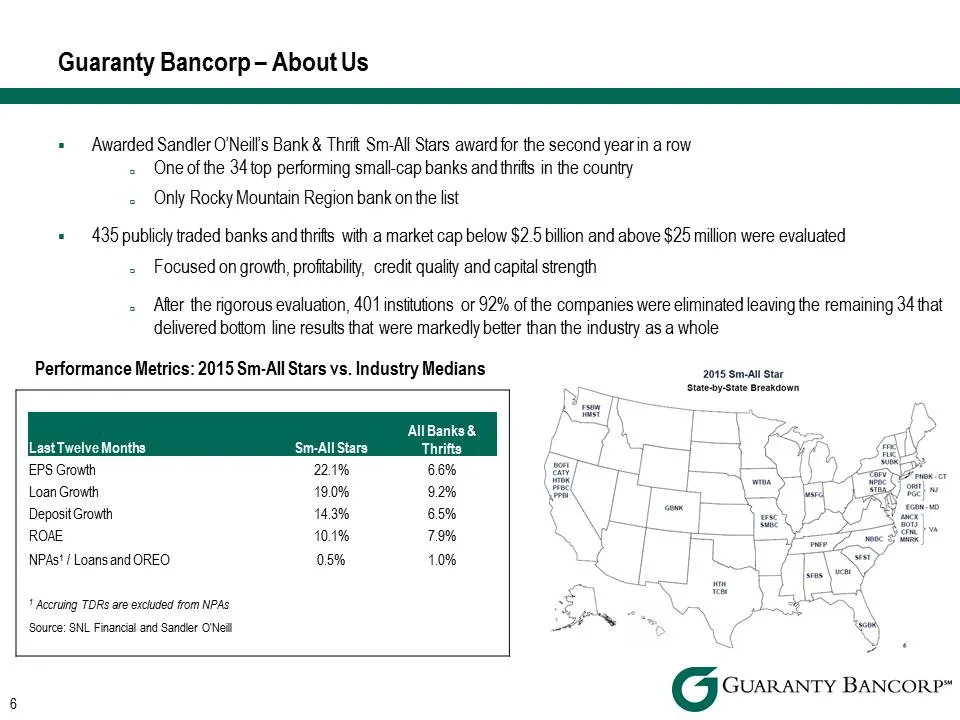
Slide 6: Sandler O'Neill Sm-All Stars award
.Awarded Sandler O’Neill’s Bank & Thrift Sm-All Stars award for the second year in a row .One of the 34 top performing small-cap banks and thrifts in the country .Only Rocky Mountain Region bank on the list .435 publicly traded banks and thrifts with a market cap below $2.5 billion and above $25 mil
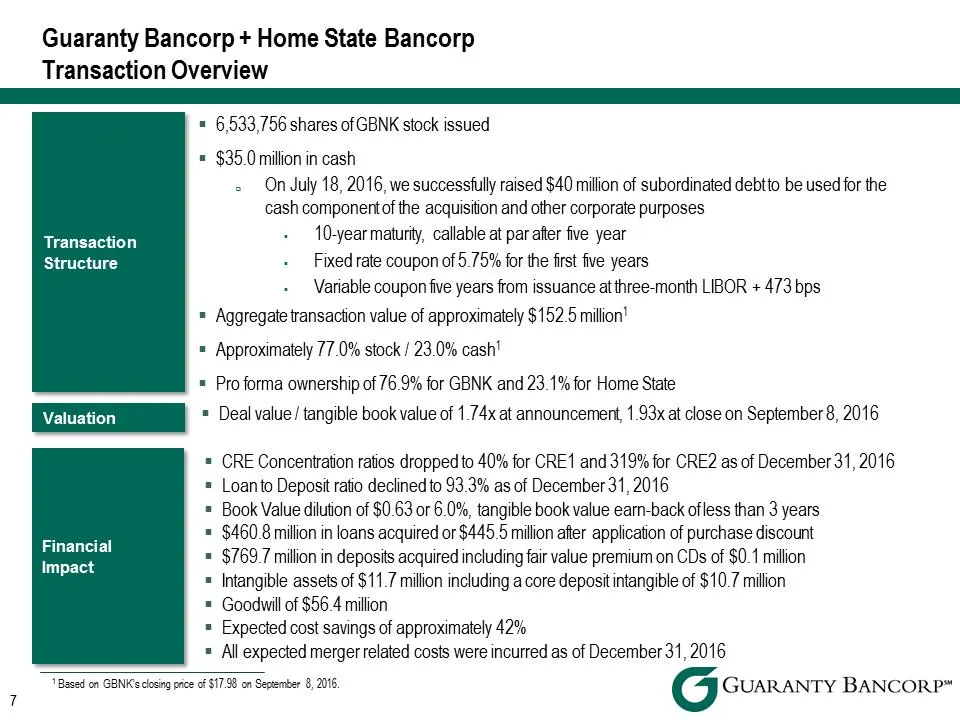
Slide 7: Home State Transaction Structure
7 Transaction Structure .6,533,756 shares of GBNK stock issued .$35.0 million in cash .On July 18, 2016, we successfully raised $40 million of subordinated debt to be used for the cash component of the acquisition and other corporate purposes .10-year maturity, callable at par after five year .Fixed
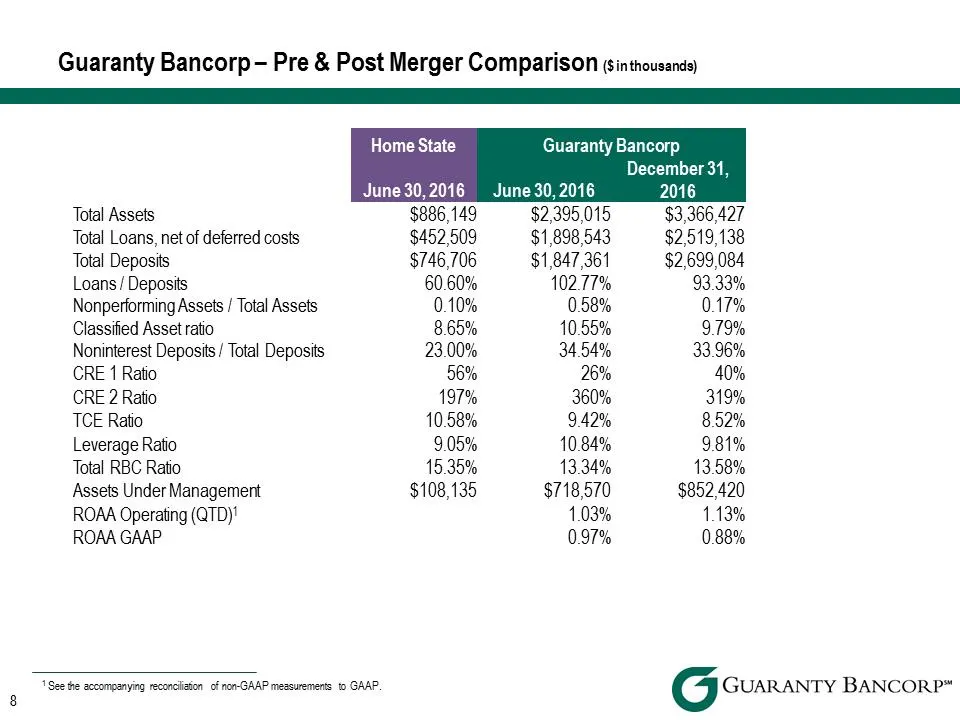
Slide 8: Pre & Post Merger Comparison
Home State Guaranty Bancorp June 30, 2016 June 30, 2016 December 31, 2016 Total Assets $886,149 $2,395,015 $3,366,427 Total Loans, net of deferred costs $452,509 $1,898,543 $2,519,138 Total Deposits $746,706 $1,847,361 $2,699,084 Loans / Deposits 60.60% 102.77% 93.33% Nonperforming Assets / Total As
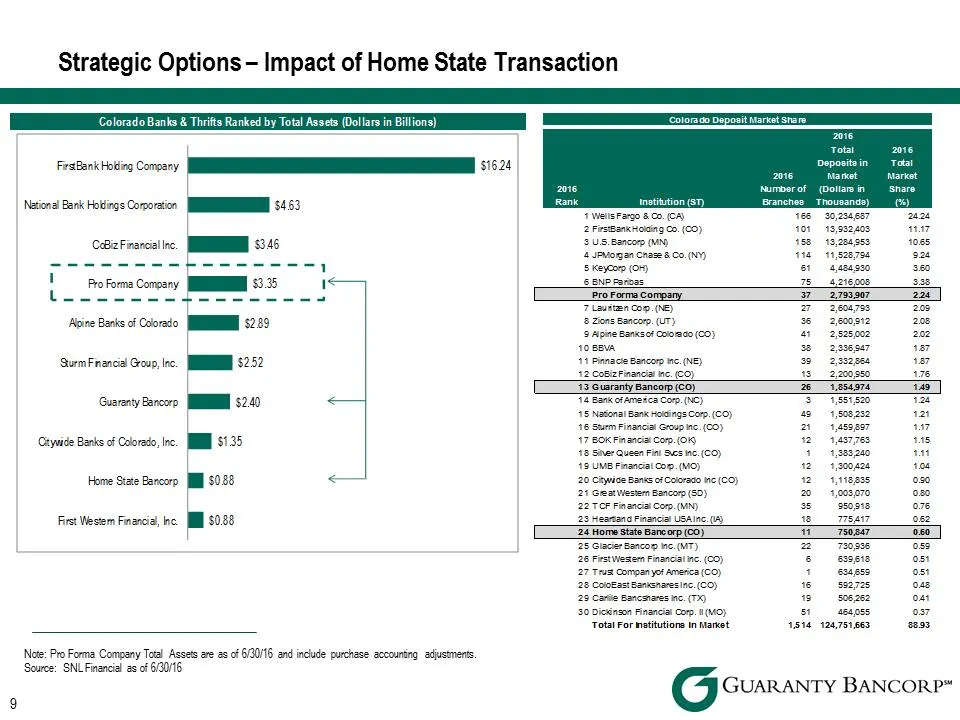
Slide 9: Strategic Options – Impact of Home State Transaction
Strategic Options – Impact of Home State Transaction Colorado Banks & Thrifts Ranked by Total Assets (Dollars in Billions)$0.88 $0.88 $1.35 $2.40 $2.52 $2.89 $3.35 $3.46 $4.63 $16.24 First Western Financial, Inc. Home State Bancorp Citywide Banks of Colorado, Inc. Guaranty Bancorp Sturm Financial Gr
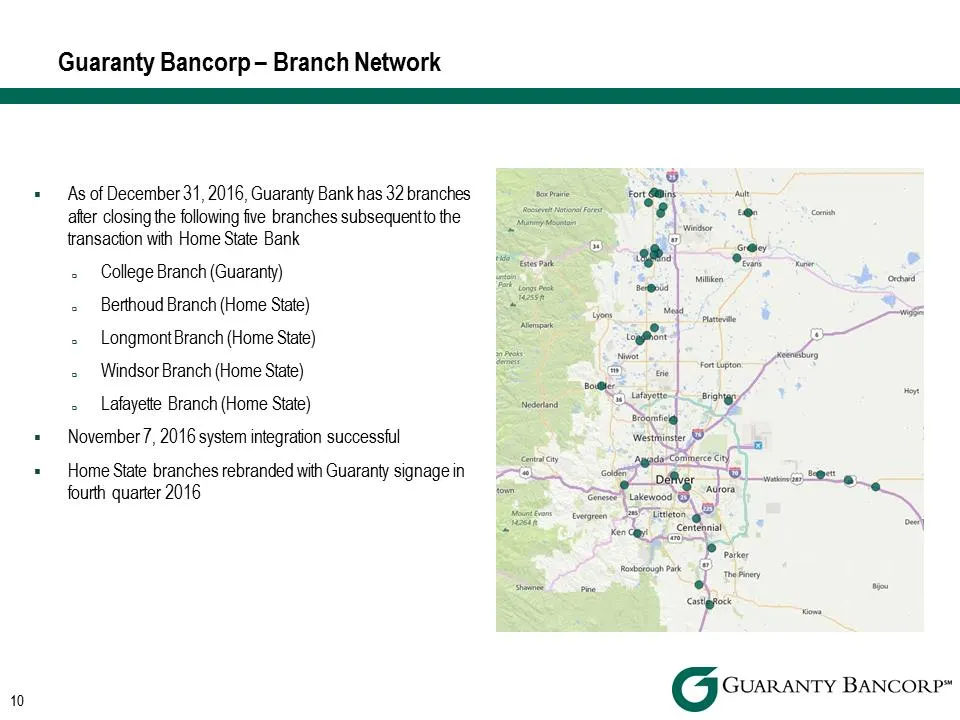
Slide 10: Branch Network
.As of December 31, 2016, Guaranty Bank has 32 branches after closing the following five branches subsequent to the transaction with Home State Bank .College Branch (Guaranty) .Berthoud Branch (Home State) .Longmont ranch (Home State) .Windsor Branch (Home State) .Lafayette Branch (Home State) .Nove
Slide 11: Loan growth momentum, asset quality and deposit mix
.Loan growth momentum .2016 net loan growth of $259.1 million, or 14.3%, excluding $445.5 million in loans acquired in Home State transaction .Loan to deposit ratio reduced to 93.3% as of December 31, 2016, as a result of Home State transaction .Strong asset quality (ratios as of December 31, 2016)
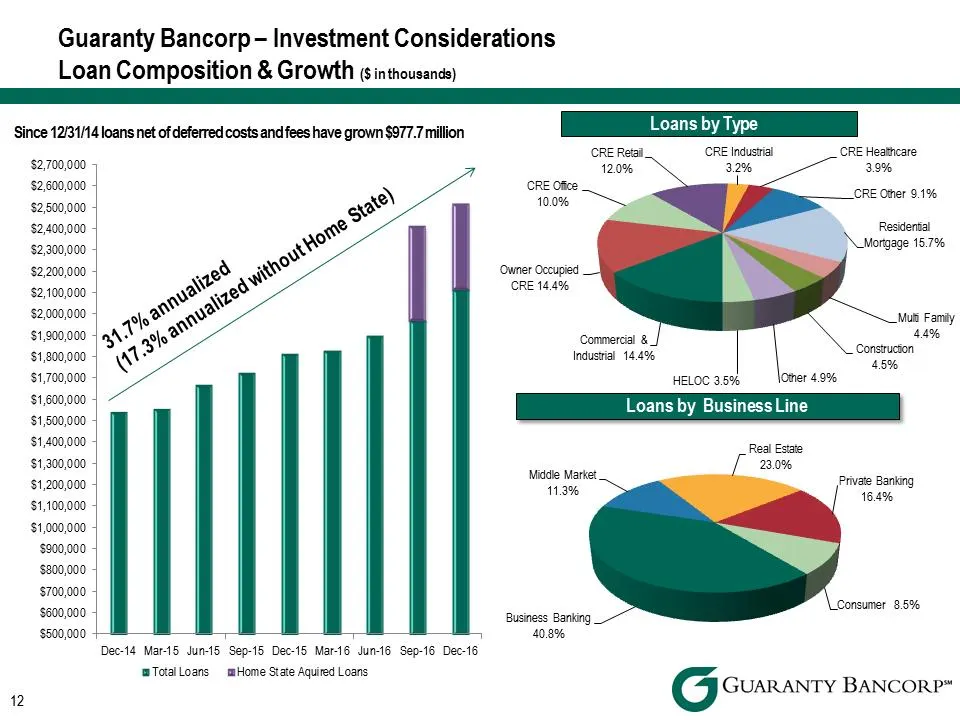
Slide 12: Loan Composition & Growth
Guaranty Bancorp - Investment Considerations Bancorp Logo.jpg $500,000 $600,000 $700,000 $800,000 $900,000 $1,000,000 $1,100,000 $1,200,000 $1,300,000 $1,400,000 $1,500,000 $1,600,000 $1,700,000 $1,800,000 $1,900,000 $2,000,000 $2,100,000 $2,200,000 $2,300,000 $2,400,000 $2,500,000 $2,600,000 $2,700
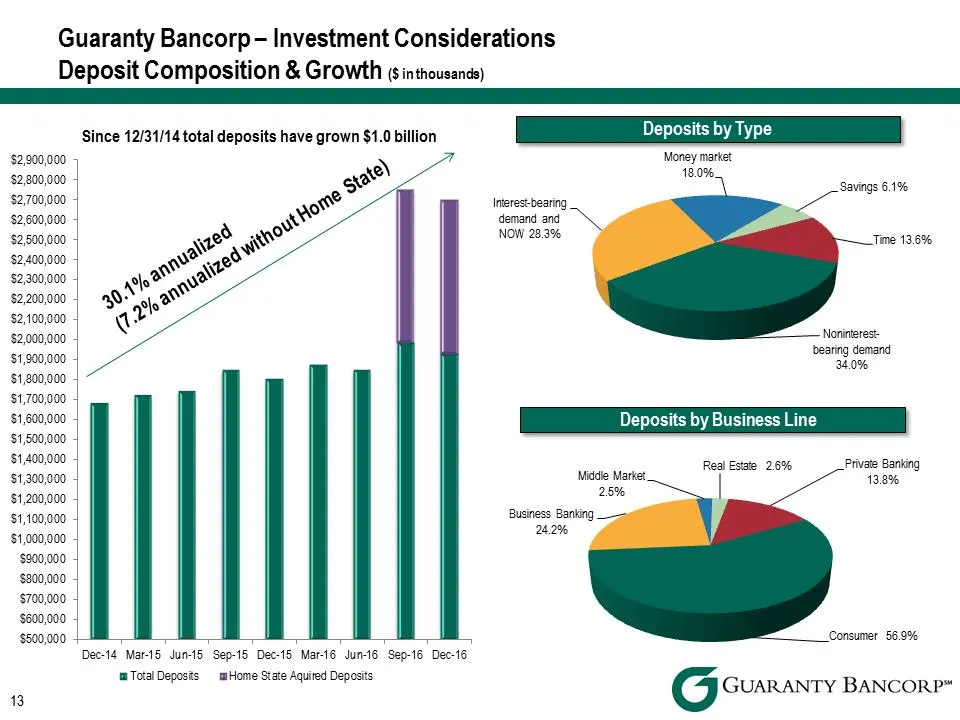
Slide 13: Deposit Composition & Growth
$500,000 $600,000 $700,000 $800,000 $900,000 $1,000,000 $1,100,000 $1,200,000 $1,300,000 $1,400,000 $1,500,000 $1,600,000 $1,700,000 $1,800,000 $1,900,000 $2,000,000 $2,100,000 $2,200,000 $2,300,000 $2,400,000 $2,500,000 $2,600,000 $2,700,000 $2,800,000 $2,900,000 Dec-14 Mar-15 Jun-15 Sep-15 Dec-15
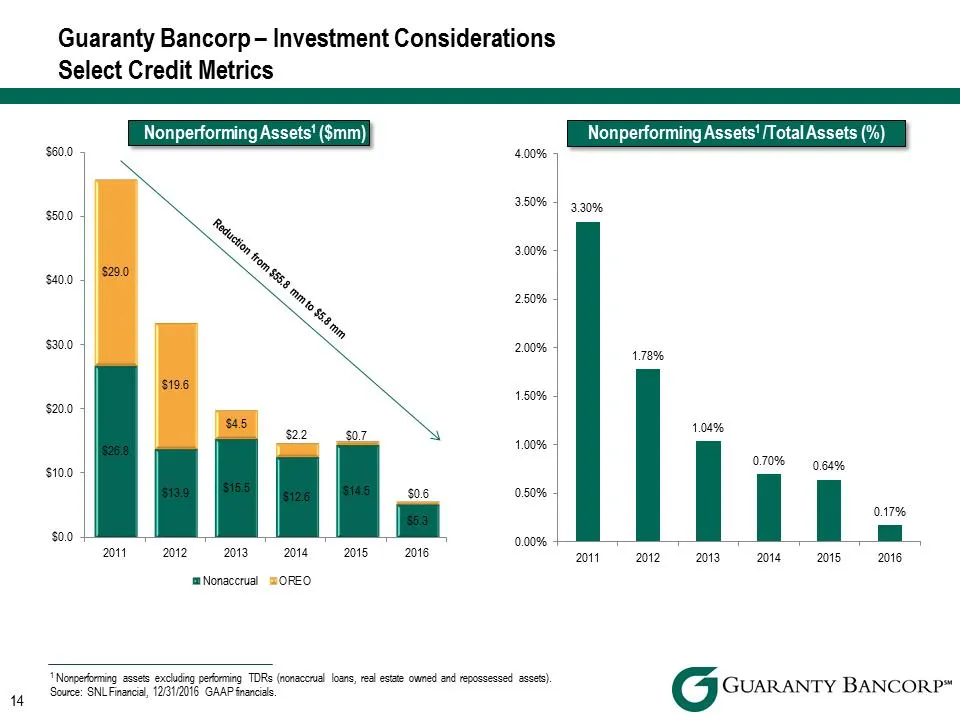
Slide 14: Select Credit Metrics
Bancorp Logo.jpg $26.8 $13.9 $15.5 $12.6 $14.5 $5.3 $29.0 $19.6 $4.5 $2.2 $0.7 $0.6 $0.0 $10.0 $20.0 $30.0 $40.0 $50.0 $60.0 2011 2012 2013 2014 2015 2016 Nonperforming Assets1 ($mm) Nonaccrual OREO14 Guaranty Bancorp – Investment Considerations Select Credit Metrics 1 Nonperforming assets excluding
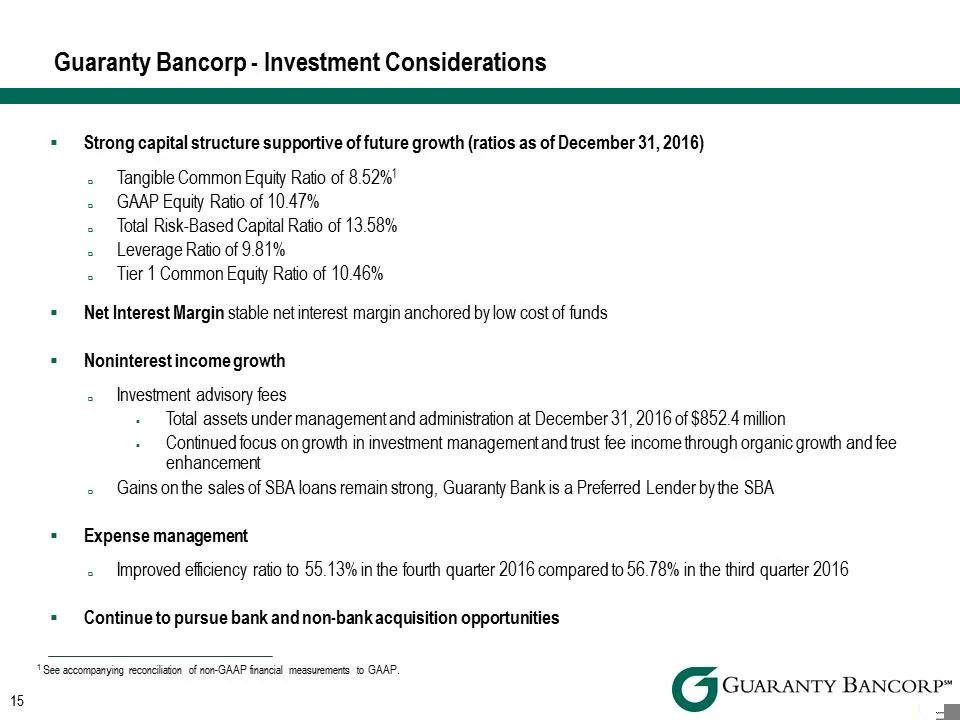
Slide 15: Capital structure, noninterest income and expense management
Bancorp .Strong capital structure supportive of future growth (ratios as of December 31, 2016) .Tangible Common Equity Ratio of 8.52%1 .GAAP Equity Ratio of 10.47% .Total Risk-Based Capital Ratio of 13.58% .Leverage Ratio of 9.81% .Tier 1 Common Equity Ratio of 10.46% .Net Interest Margin stable net
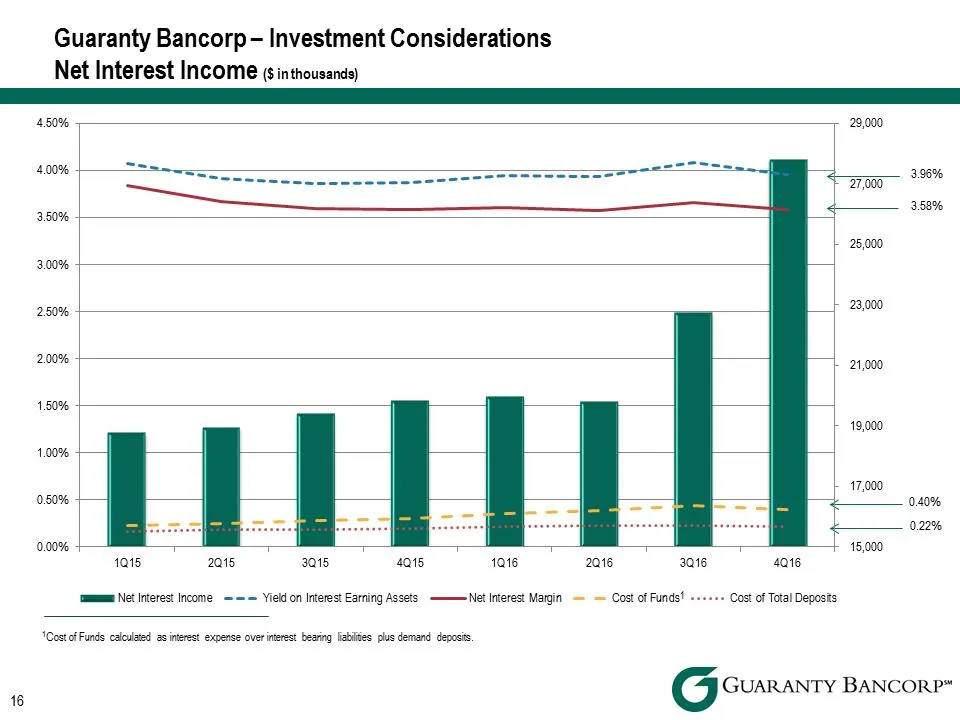
Slide 16: Net Interest Income
Guaranty Bancorp – Investment Considerations Net Interest Income ($ in thousands) 16 1Cost of Funds calculated as interest expense over interest bearing liabilities plus demand deposits. 3.96% 3.58% 0.22% 0.40% 1 15,000 17,000 19,000 21,000 23,000 25,000 27,000 29,000 0.00% 0.50% 1.00% 1.50% 2.00% 2
Slide 17: Key Financial Measures
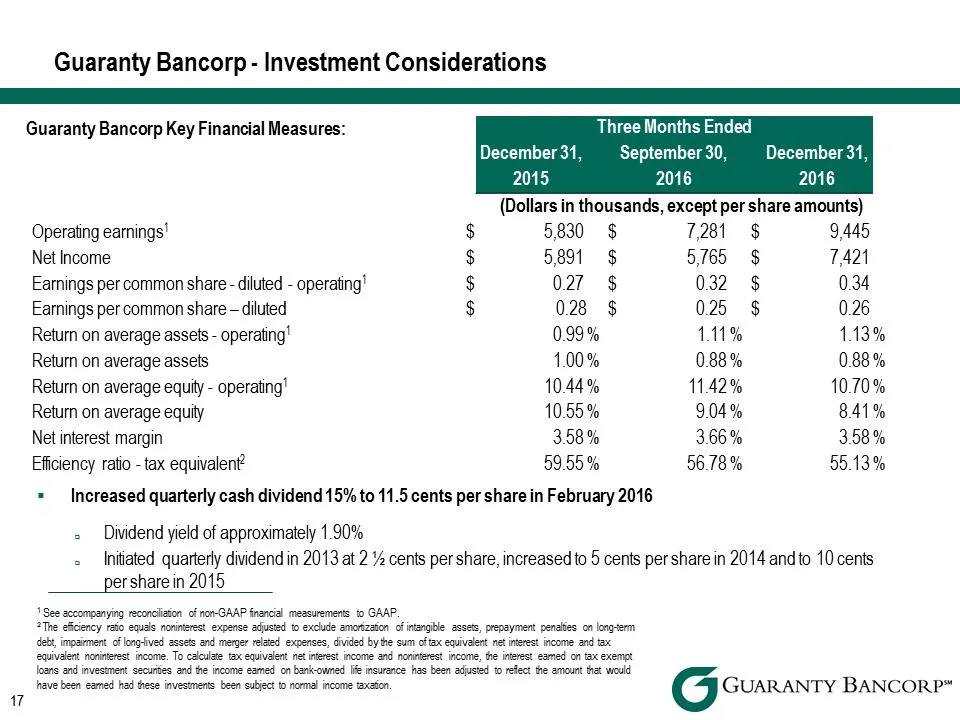
Guaranty Bancorp Key Financial Measures: Guaranty Bancorp - Investment Considerations 17 1 See accompanying reconciliation of non-GAAP financial measurements to GAAP. 2 The efficiency ratio equals noninterest expense adjusted to exclude amortization of intangible assets, prepayment penalties on long
Slide 18: Operating Earnings
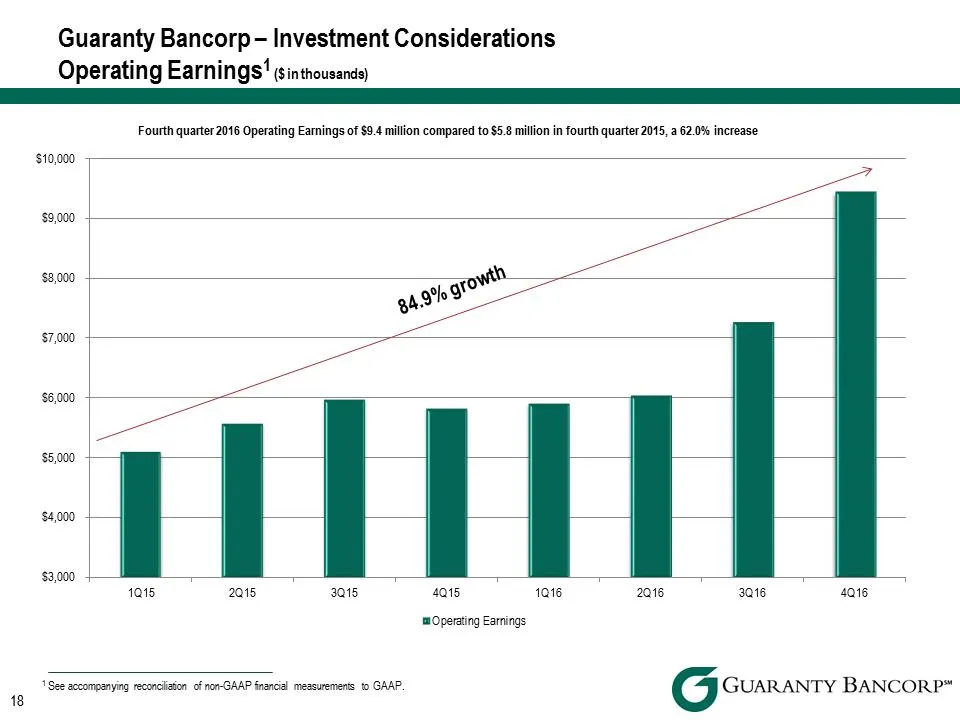
$3,000 $4,000 $5,000 $6,000 $7,000 $8,000 $9,000 $10,000 1Q15 2Q15 3Q15 4Q15 1Q16 2Q16 3Q16 4Q16 Operating Earnings 18 Guaranty Bancorp – Investment Considerations Operating Earnings1 ($ in thousands) 1 See accompanying reconciliation of non-GAAP financial measurements to GAAP. Fourth quarter 2016 O
Slide 19: Income Statement and Balance Sheet
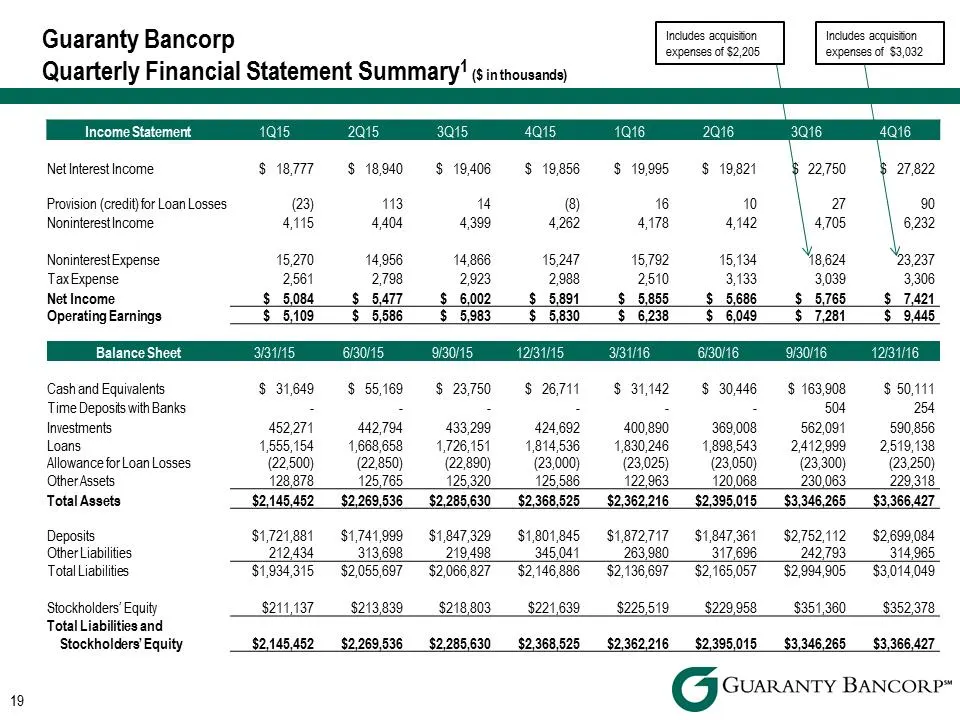
Income Statement 1Q15 2Q15 3Q15 4Q15 1Q16 2Q16 3Q16 4Q16 Net Interest Income $ 18,777 $ 18,940 $ 19,406 $ 19,856 $ 19,995 $ 19,821 $ 22,750 $ 27,822 Provision (credit) for Loan Losses (23) 113 14 (8) 16 10 27 90 Noninterest Income 4,115 4,404 4,399 4,262 4,178 4,142 4,705 6,232 Noninterest Expense 1
Slide 20: Colorado Market
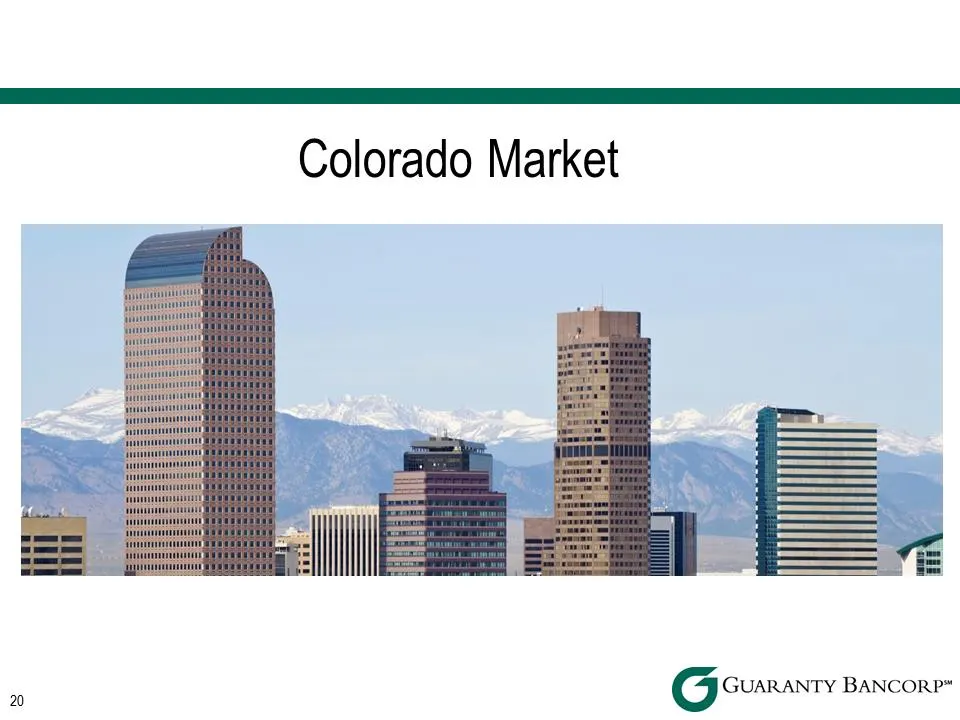
Colorado Market G GUARANTY BANCORP”
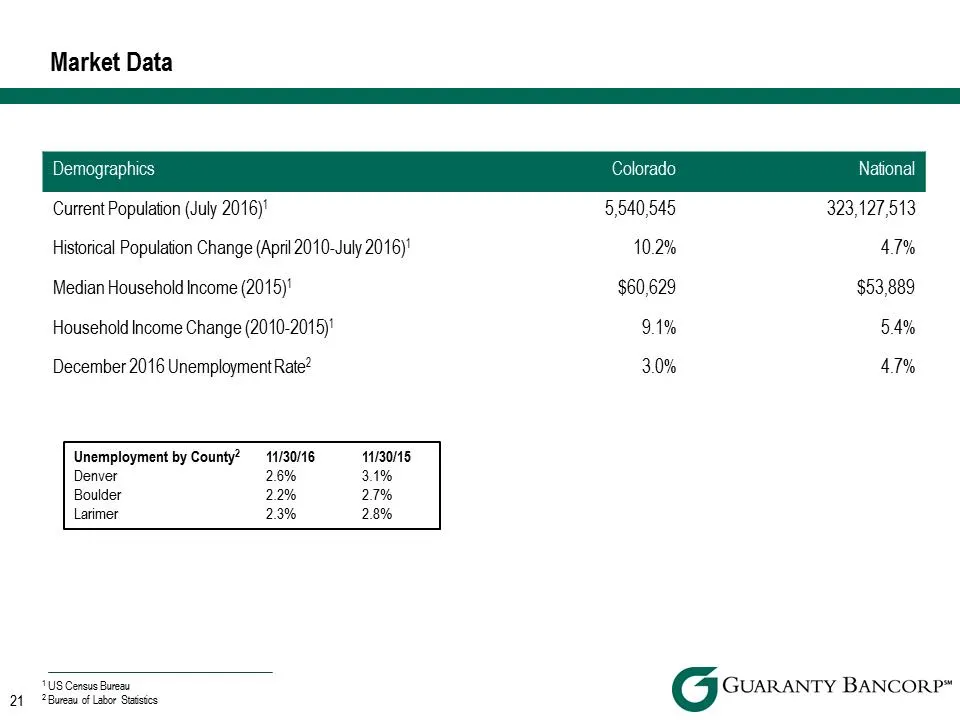
Slide 21: Demographics Market Data
Demographics Colorado National Current Population (July 2016)1 5,540,545 323,127,513 Historical Population Change (April 2010-July 2016)1 10.2% 4.7% Median Household Income (2015)1 $60,629 $53,889 Household Income Change (2010-2015)1 9.1% 5.4% December 2016 Unemployment Rate2 3.0% 4.7% Market Data 2
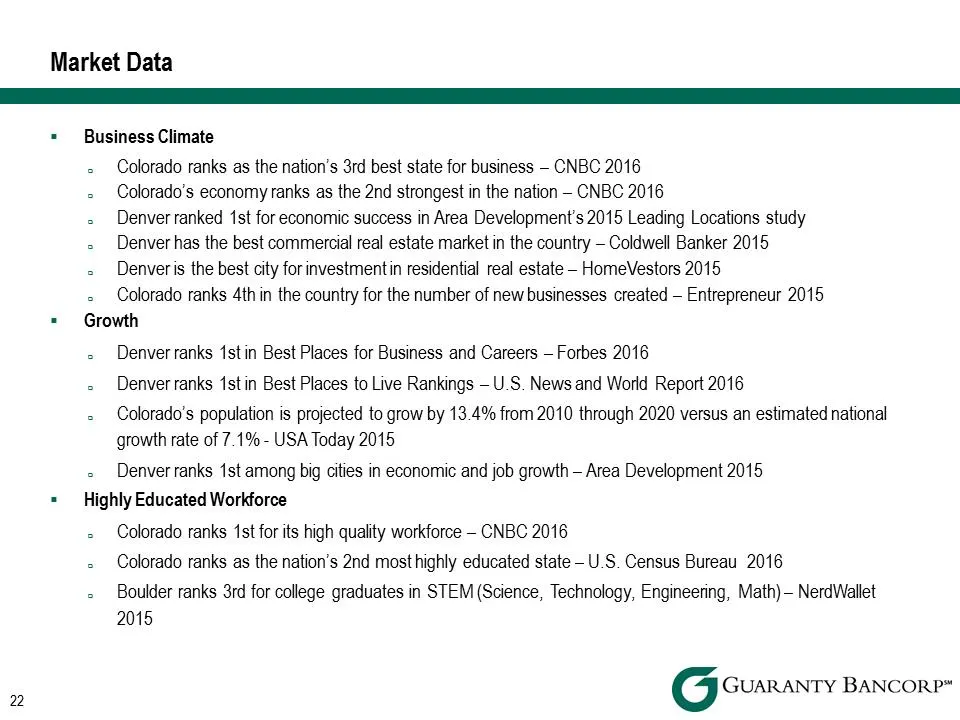
Slide 22: Business Climate and Growth
.Business Climate .Colorado ranks as the nation’s 3rd best state for business – CNBC 2016 .Colorado’s economy ranks as the 2nd strongest in the nation – CNBC 2016 .Denver ranked 1st for economic success in Area Development’s 2015 Leading Locations study .Denver has the best commercial real estate ma
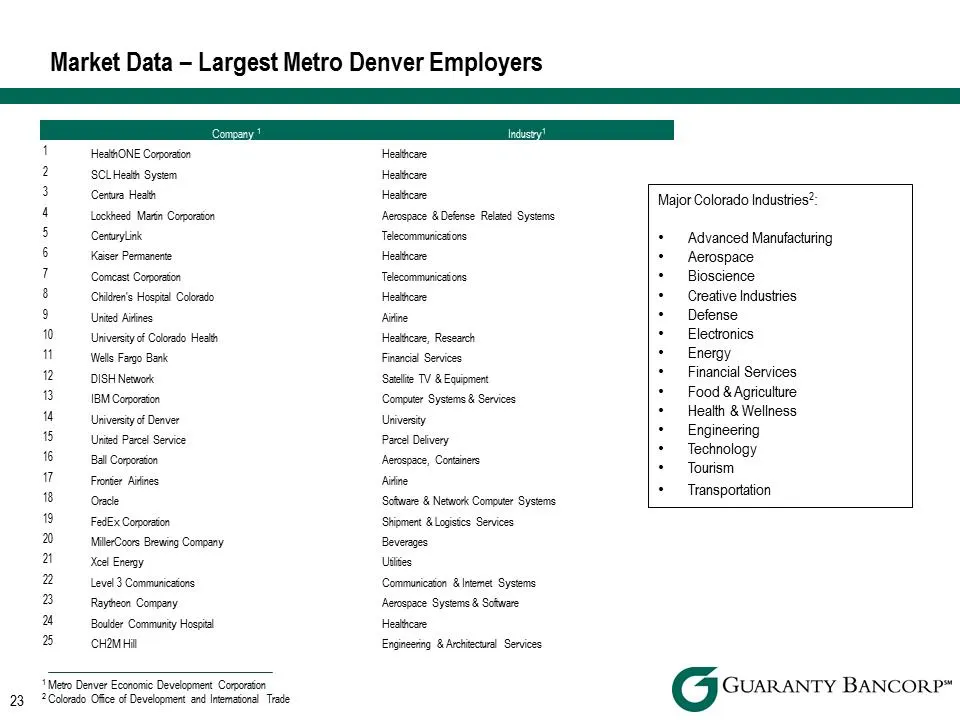
Slide 23: Largest Metro Denver Employers
23 Market Data – Largest Metro Denver Employers Company 1 Industry1 1 HealthONE Corporation Healthcare 2 SCL Health System Healthcare 3 Centura Health Healthcare 4 Lockheed Martin Corporation Aerospace & Defense Related Systems 5 CenturyLink Telecommunications 6 Kaiser Permanente Healthcare 7 Comcas
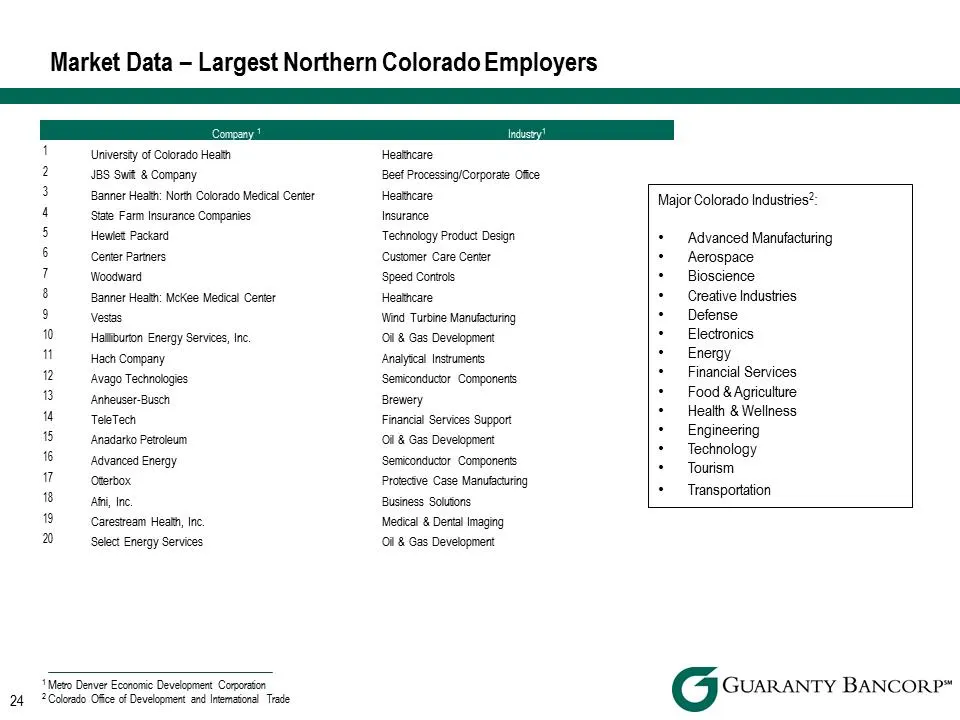
Slide 24: Largest Northern Colorado Employers
Market Data – Largest Northern Colorado Employers Company 1 Industry1 1 University of Colorado Health Healthcare 2 JBS Swift & Company Beef Processing/Corporate Office 3 Banner Health: North Colorado Medical Center Healthcare 4 State Farm Insurance Companies Insurance 5 Hewlett Packard Technology Pr
Slide 25: Reconciliation of Non-GAAP Financial Measures
Reconciliation of Non-GAAP Financial Measures 25
Slide 26: Tangible Book Value and Tangible Common Equity Ratio
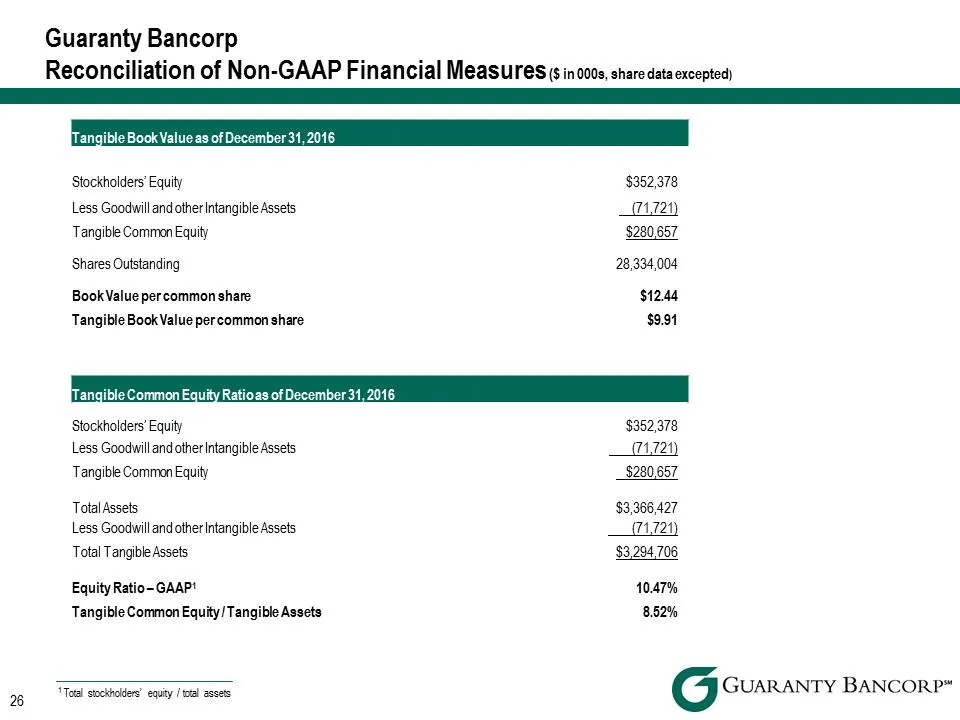
Tangible Book Value as of December 31, 2016 Stockholders’ Equity $352,378 Less Goodwill and other Intangible Assets (71,721) Tangible Common Equity $280,657 Shares Outstanding 28,334,004 Book Value per common share $12.44 Tangible Book Value per common share $9.91 Tangible Common Equity Ratio as of
Slide 27: Operating Earnings Reconciliation
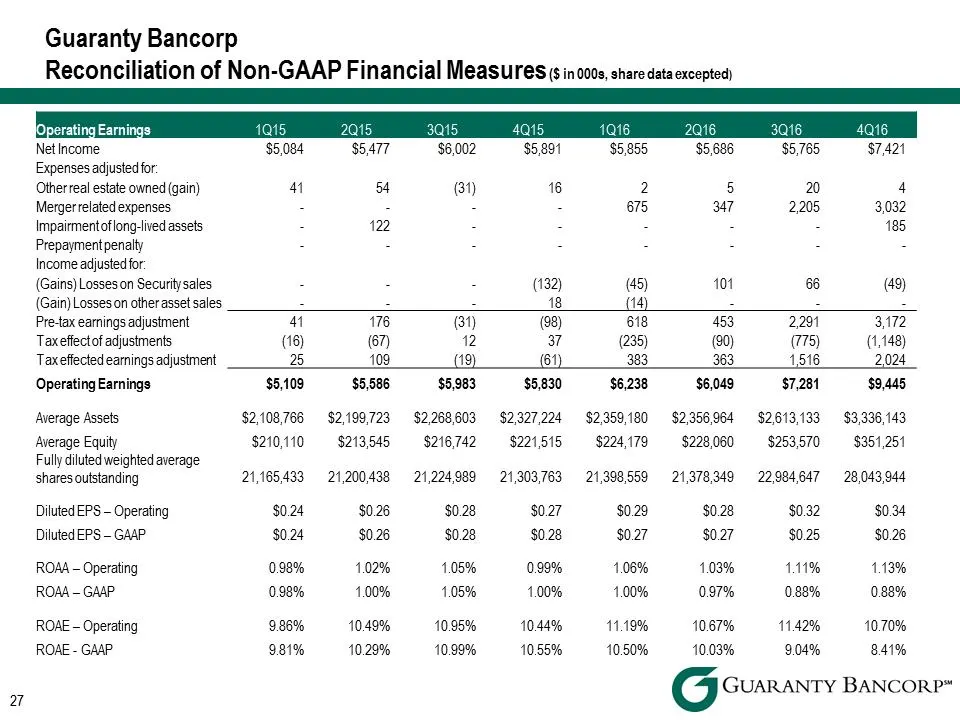
Operating Earnings 1Q15 2Q15 3Q15 4Q15 1Q16 2Q16 3Q16 4Q16 Net Income $5,084 $5,477 $6,002 $5,891 $5,855 $5,686 $5,765 $7,421 Expenses adjusted for: Other real estate owned (gain) 41 54 (31) 16 2 5 20 4 Merger related expenses - - - 675 347 2,205 3,032 Impairment of long-lived assets - 122 - - - - -
Source: SEC EDGAR · 8-K filed Jan 31, 2017
More decks from Guaranty Bancorp
 Merger or Acquisition (May 2018)19 slides · May 23, 2018
 Merger or Acquisition (July 2017)8 slides · Jul 19, 2017
 D.A. Davidson 19th Annual Financial Services Conference 201722 slides · May 9, 2017
 2016 FBR 23rd Annual Investor Conference27 slides · Nov 28, 2016
 2016 KBW Community Bank Investor Conference26 slides · Aug 1, 2016
 IPO Roadshow (July 2016)30 slides · Jul 13, 2016