Gemfields Group Limited · JSE:GML
Gemfields — FY2023 Earnings Presentation
37 slides from Gemfields's earnings presentation, Mar 25, 2024
Slide 1: Full Year Results
Full Year Results For the year ended 31 December 2023 PUBLISHED 25 MARCH 2024 A Story in Every Gemstone | Discover more about Gemfields and Fabergé at gemfieldsgroup.com
Slide 2: Legal Disclaimer
Legal Disclaimer 2023 FULL YEAR RESULTS This document, which has been compiled by Gemfields Group Limited (the Certain statements in this presentation, or given in response to questions, may “Company”), comprises written materials and information regarding the Company, constitute forward-looking sta
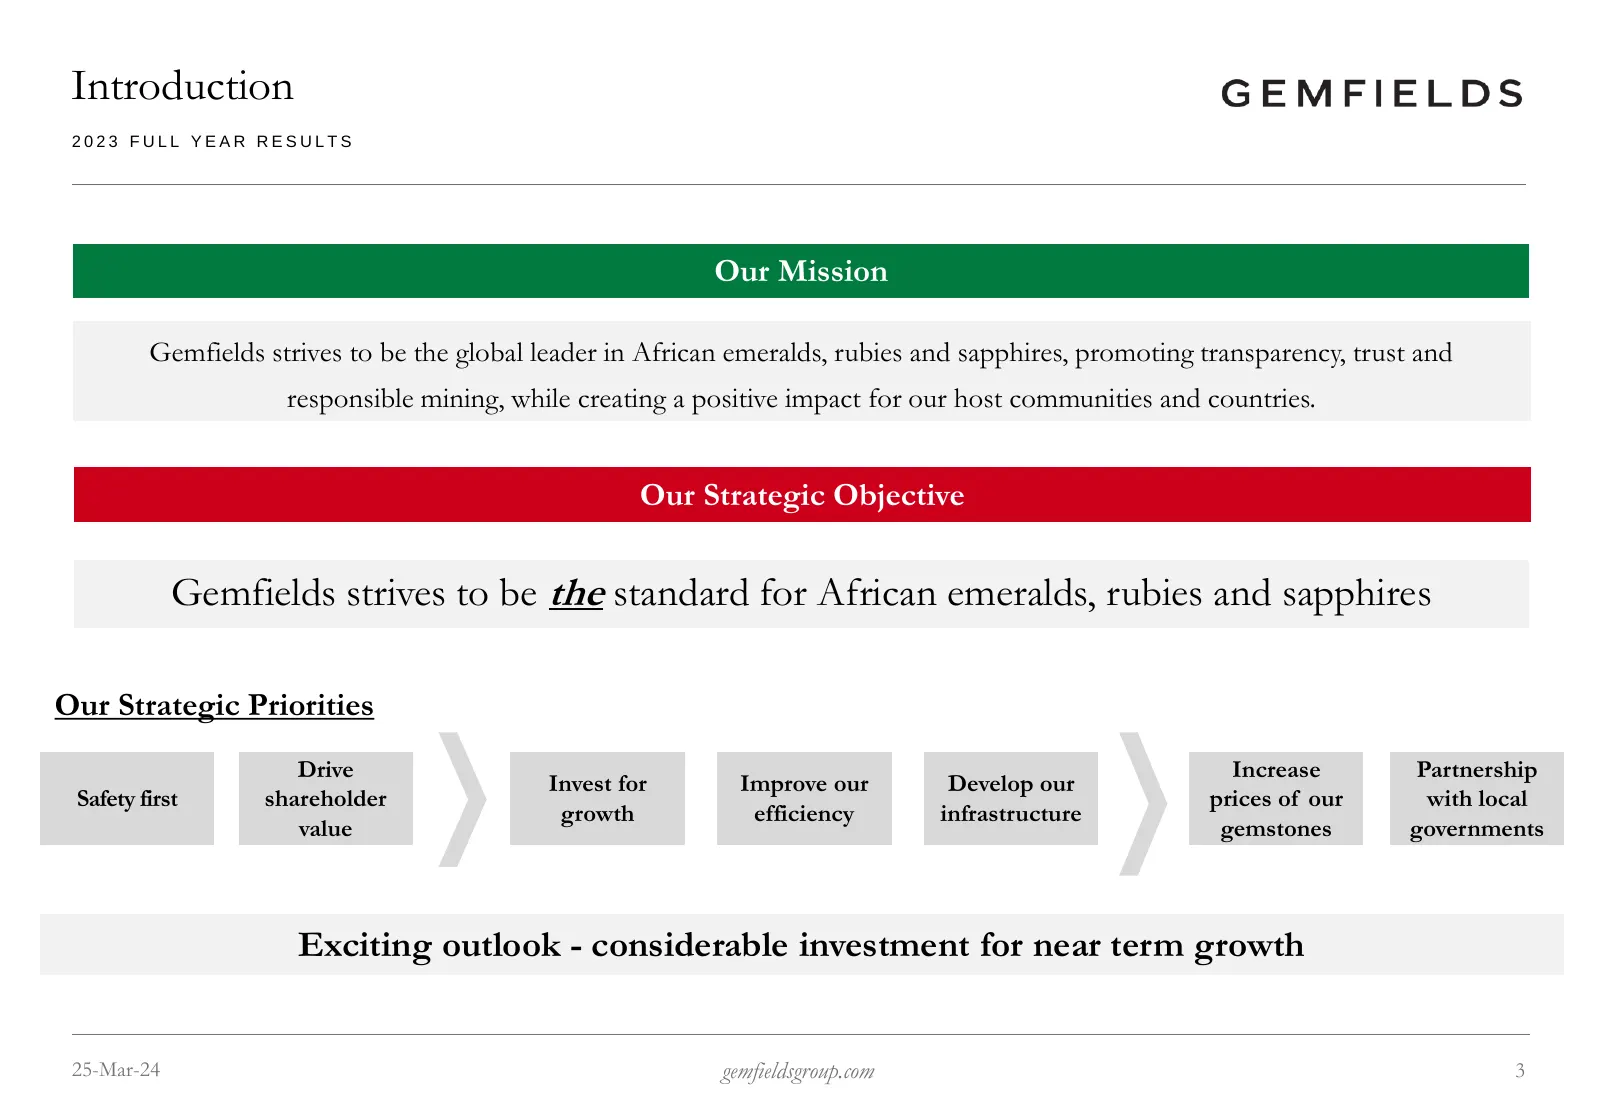
Slide 3: Introduction
Introduction 2023 FULL YEAR RESULTS Our Mission Gemfields strives to be the global leader in African emeralds, rubies and sapphires, promoting transparency, trust and responsible mining, while creating a positive impact for our host communities and countries. Our Strategic Objective Gemfields strive
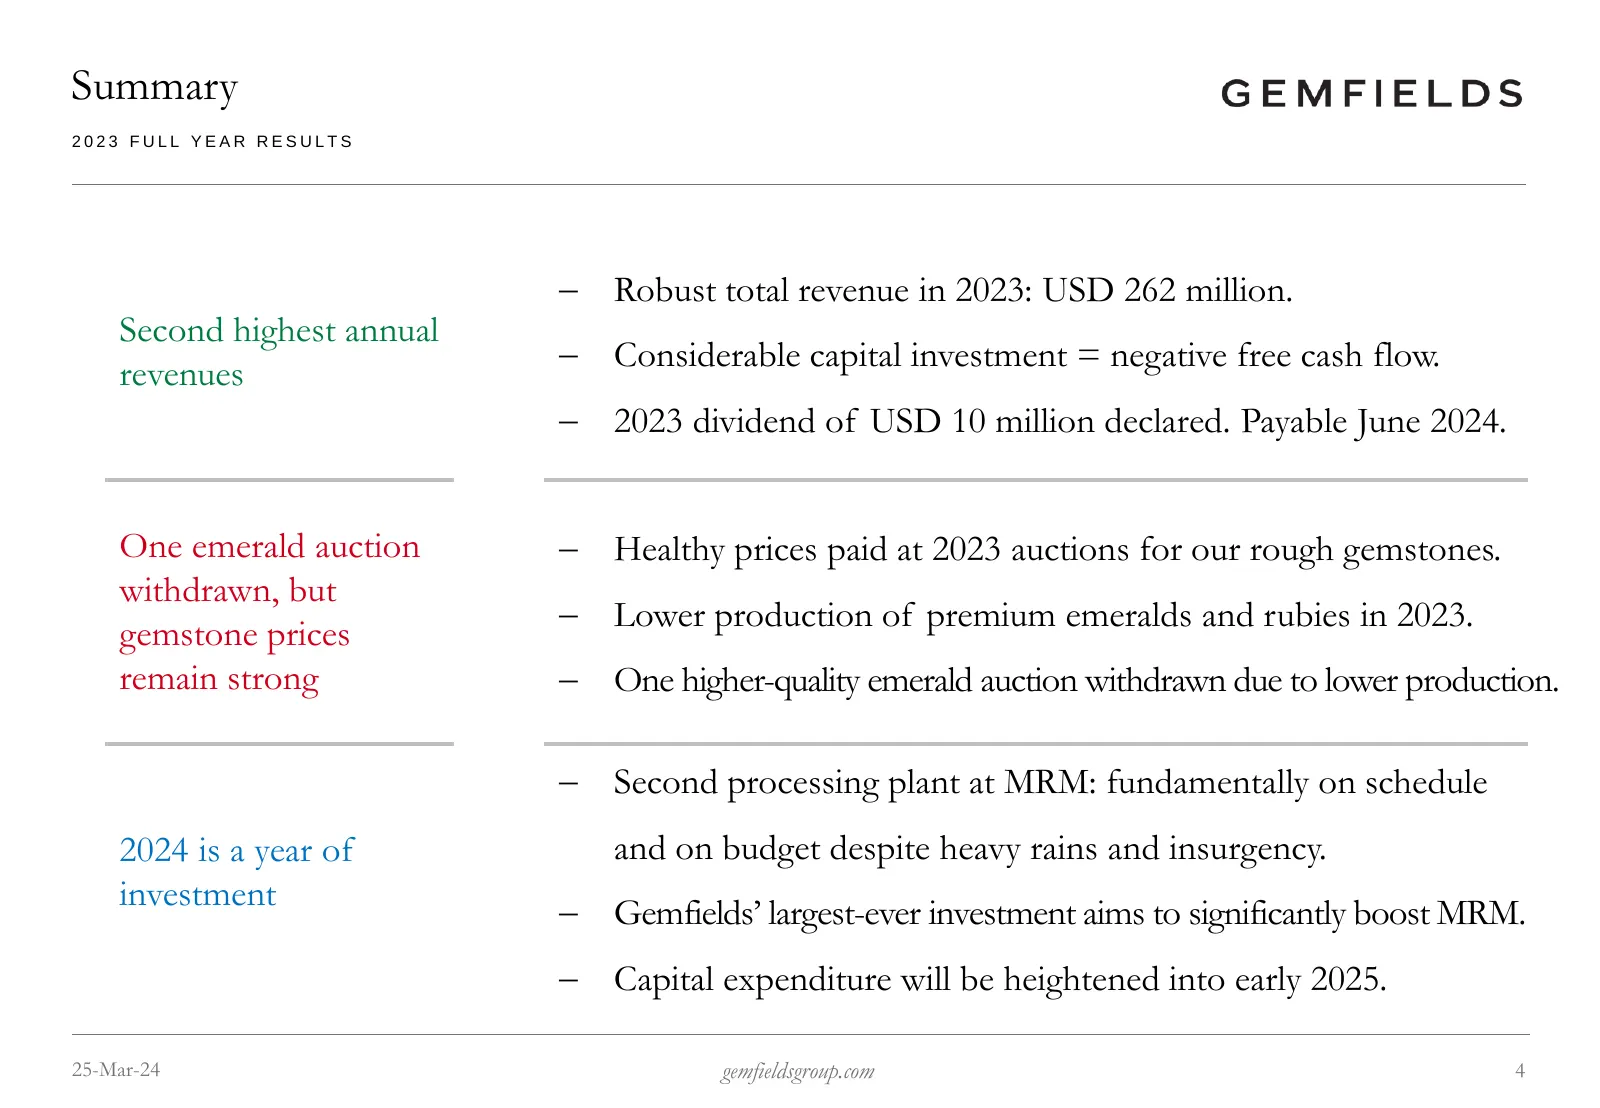
Slide 4: Summary
Summary 2023 FULL YEAR RESULTS − Robust total revenue in 2023: USD 262 million. Second highest annual − Considerable capital investment = negative free cash flow. revenues − 2023 dividend of USD 10 million declared. Payable June 2024. One emerald auction − Healthy prices paid at 2023 auctions for ou
Slide 5: 2023 Full Year Results - Finance Review
2023 Full Year Results - Finance Review DAVID LOVETT, CFO A Story in Every Gemstone | Discover more about Gemfields and Fabergé at gemfieldsgroup.com
Slide 6: Financial Performance
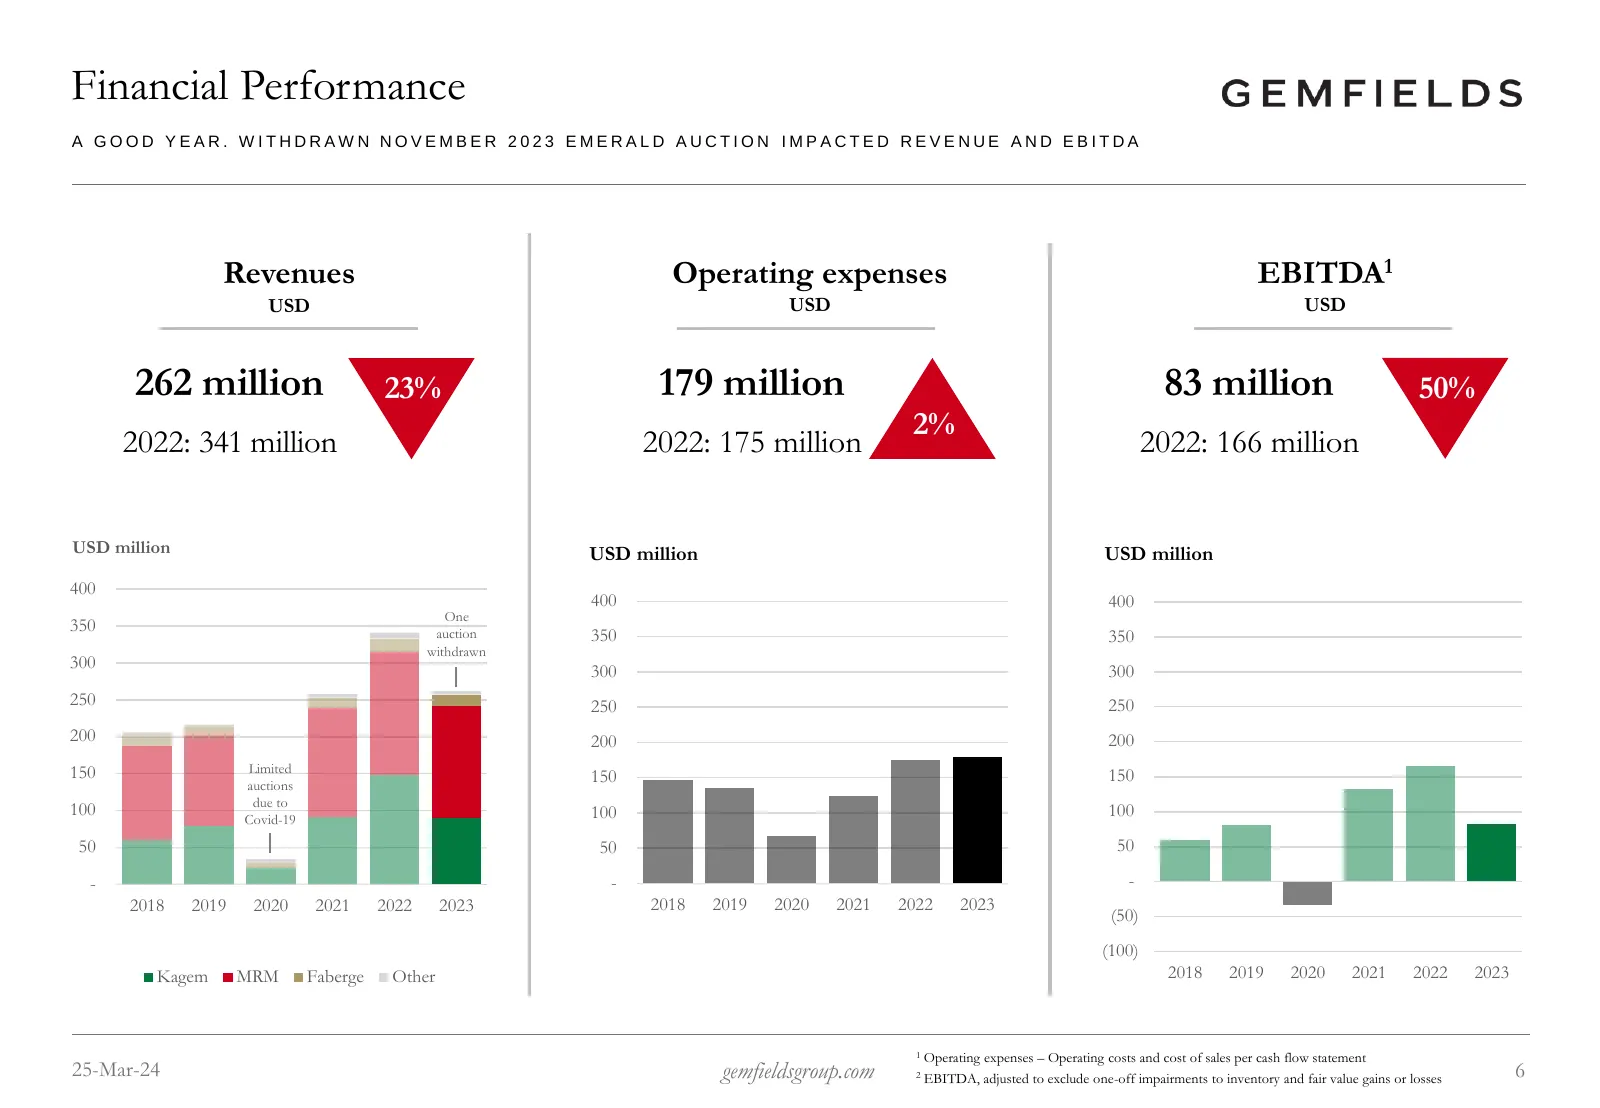
Financial Performance A GOOD YEAR. WITHDRAWN NOVEMBER 2023 EMERALD AUCTION IMPACTED REVENUE AND EBITDA Revenues Operating expenses EBITDA1 USD USD USD 262 million 23% 179 million 83 million 50% 20% 41% 2% 2022: 341 million 2022: 175 million 2022: 166 million USD million USD million USD million 400 4
Slide 7: Financial Performance
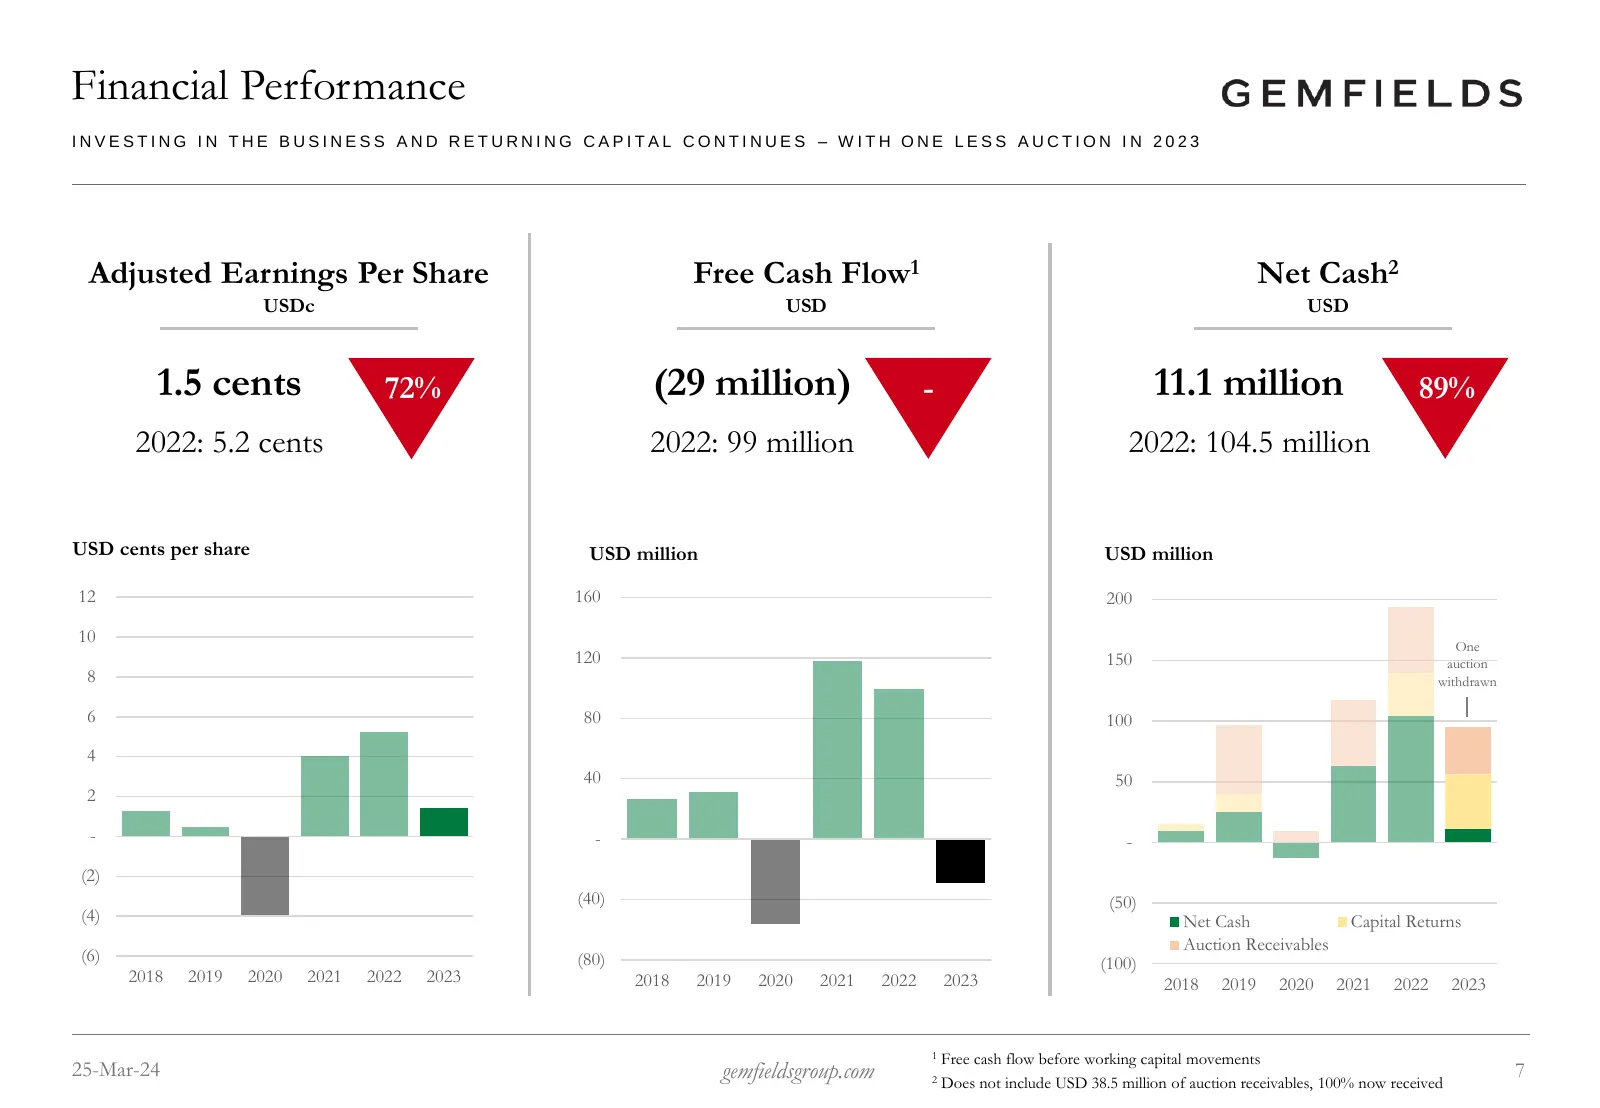
Financial Performance INVESTING IN THE BUSINESS AND RETURNING CAPITAL CONTINUES – WITH ONE LESS AUCTION IN 2023 Adjusted Earnings Per Share Free Cash Flow1 Net Cash2 USDc USD USD 1.5 cents 72% (29 million) - 11.1 million 89% 20% 41% 2022: 5.2 cents 2022: 99 million 2022: 104.5 million USD cents per
Slide 8: Group Revenue – Second Highest Year Ever
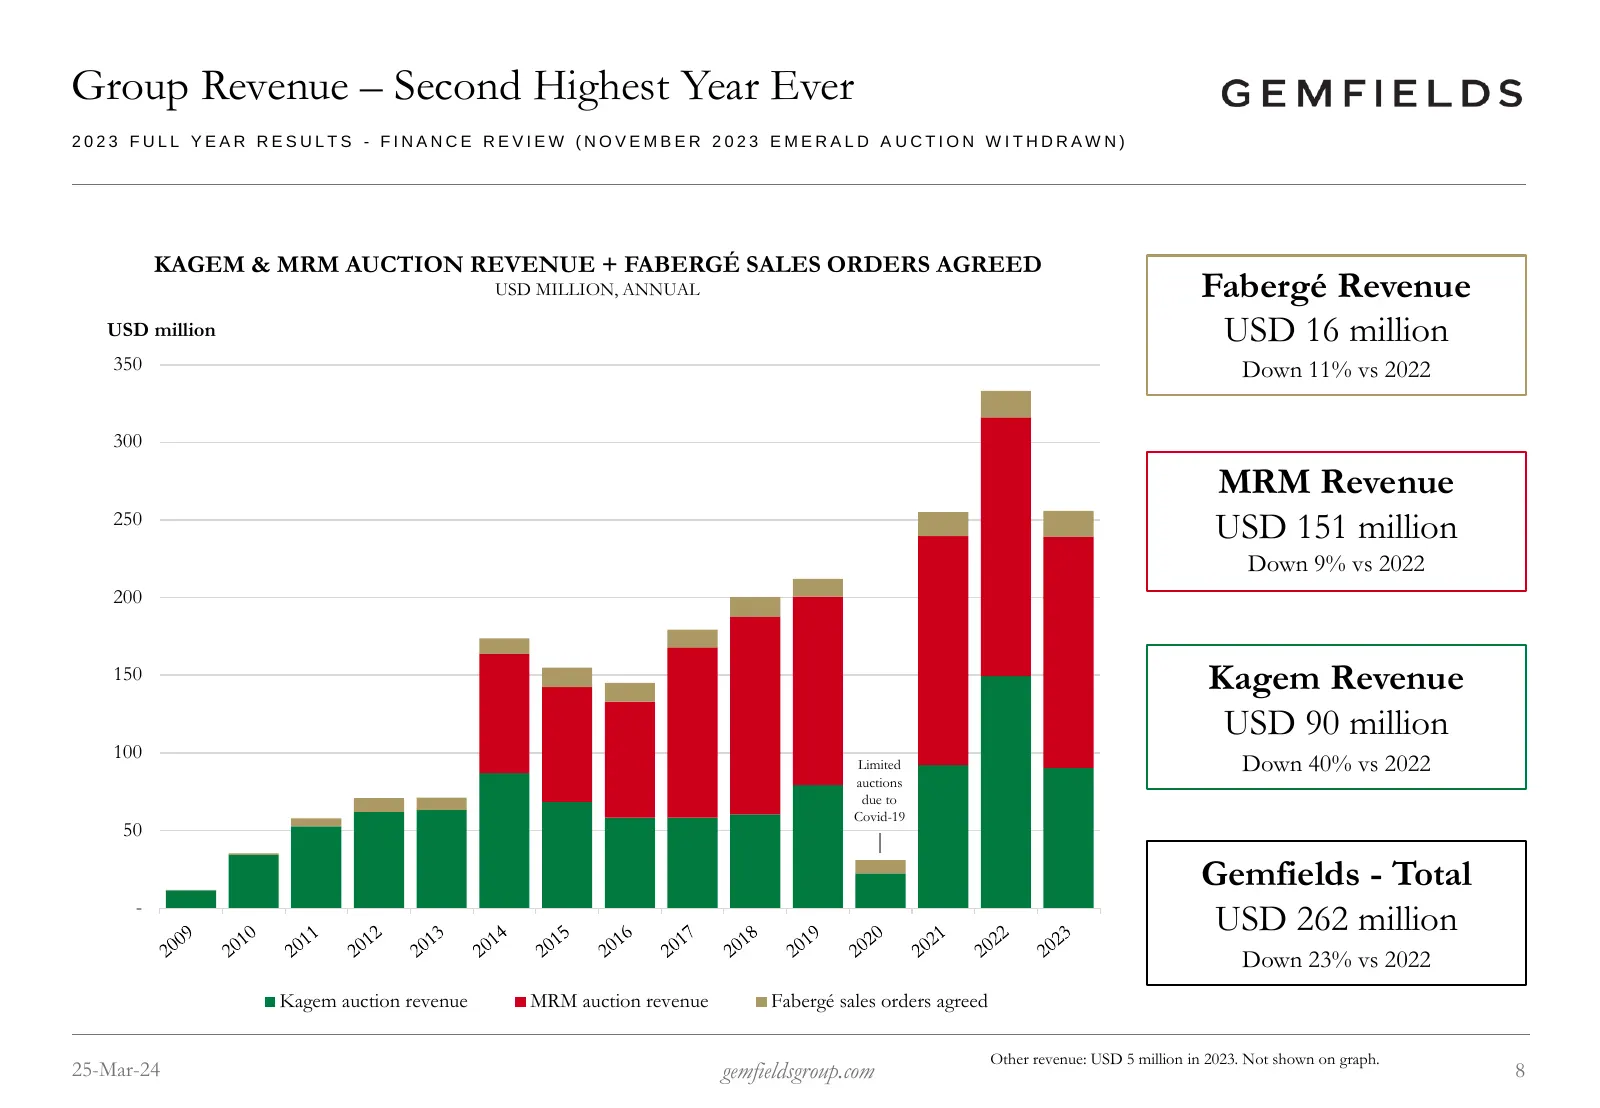
Group Revenue – Second Highest Year Ever 2023 FULL YEAR RESULTS - FINANCE REVIEW (NOVEMBER 2023 EMERALD A UCTION WITHDRAWN) KAGEM & MRM AUCTION REVENUE + FABERGÉ SALES ORDERS AGREED USD MILLION, ANNUAL Fabergé Revenue USD million USD 16 million 350 Down 11% vs 2022 300 MRM Revenue 250 USD 151 millio
Slide 9: Operating Costs Remain Heightened; Inflation Easing
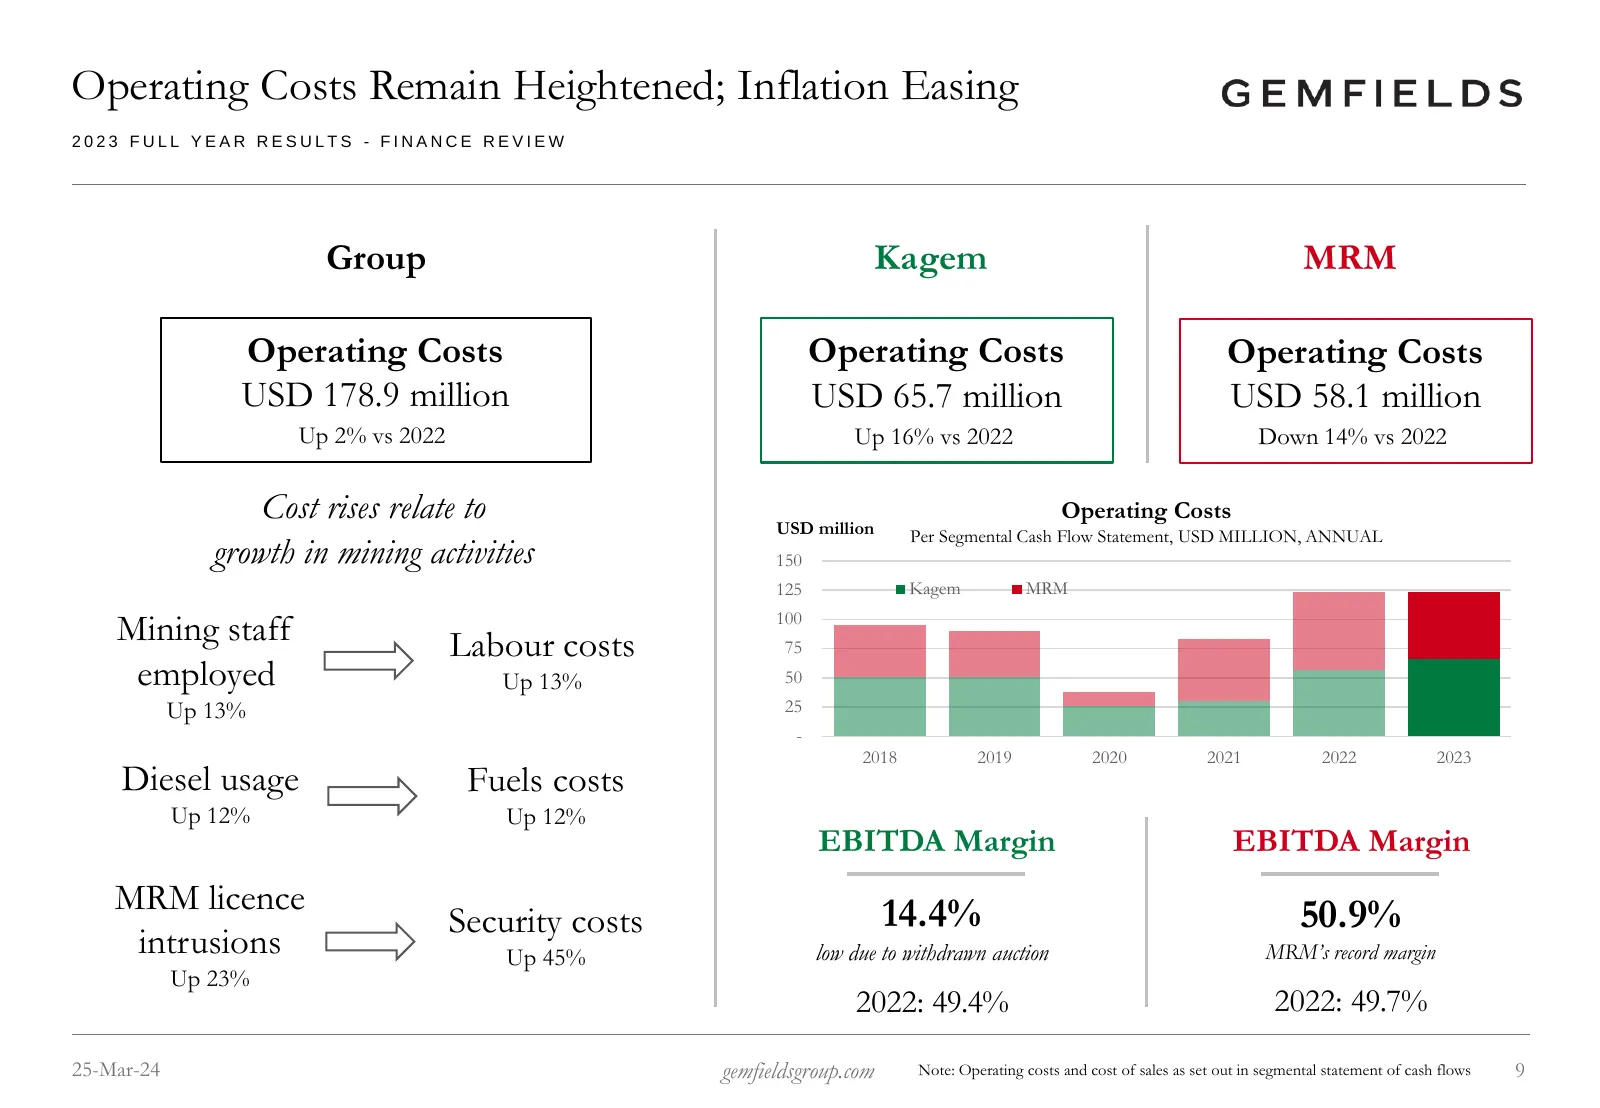
Operating Costs Remain Heightened; Inflation Easing 2023 FULL YEAR RESULTS - FINANCE REVIEW Group Kagem MRM Operating Costs Operating Costs Operating Costs USD 178.9 million USD 65.7 million USD 58.1 million Up 2% vs 2022 Up 16% vs 2022 Down 14% vs 2022 Cost rises relate to USD million Operating Cos
Slide 10: Capital Expenditure: Investing For Growth
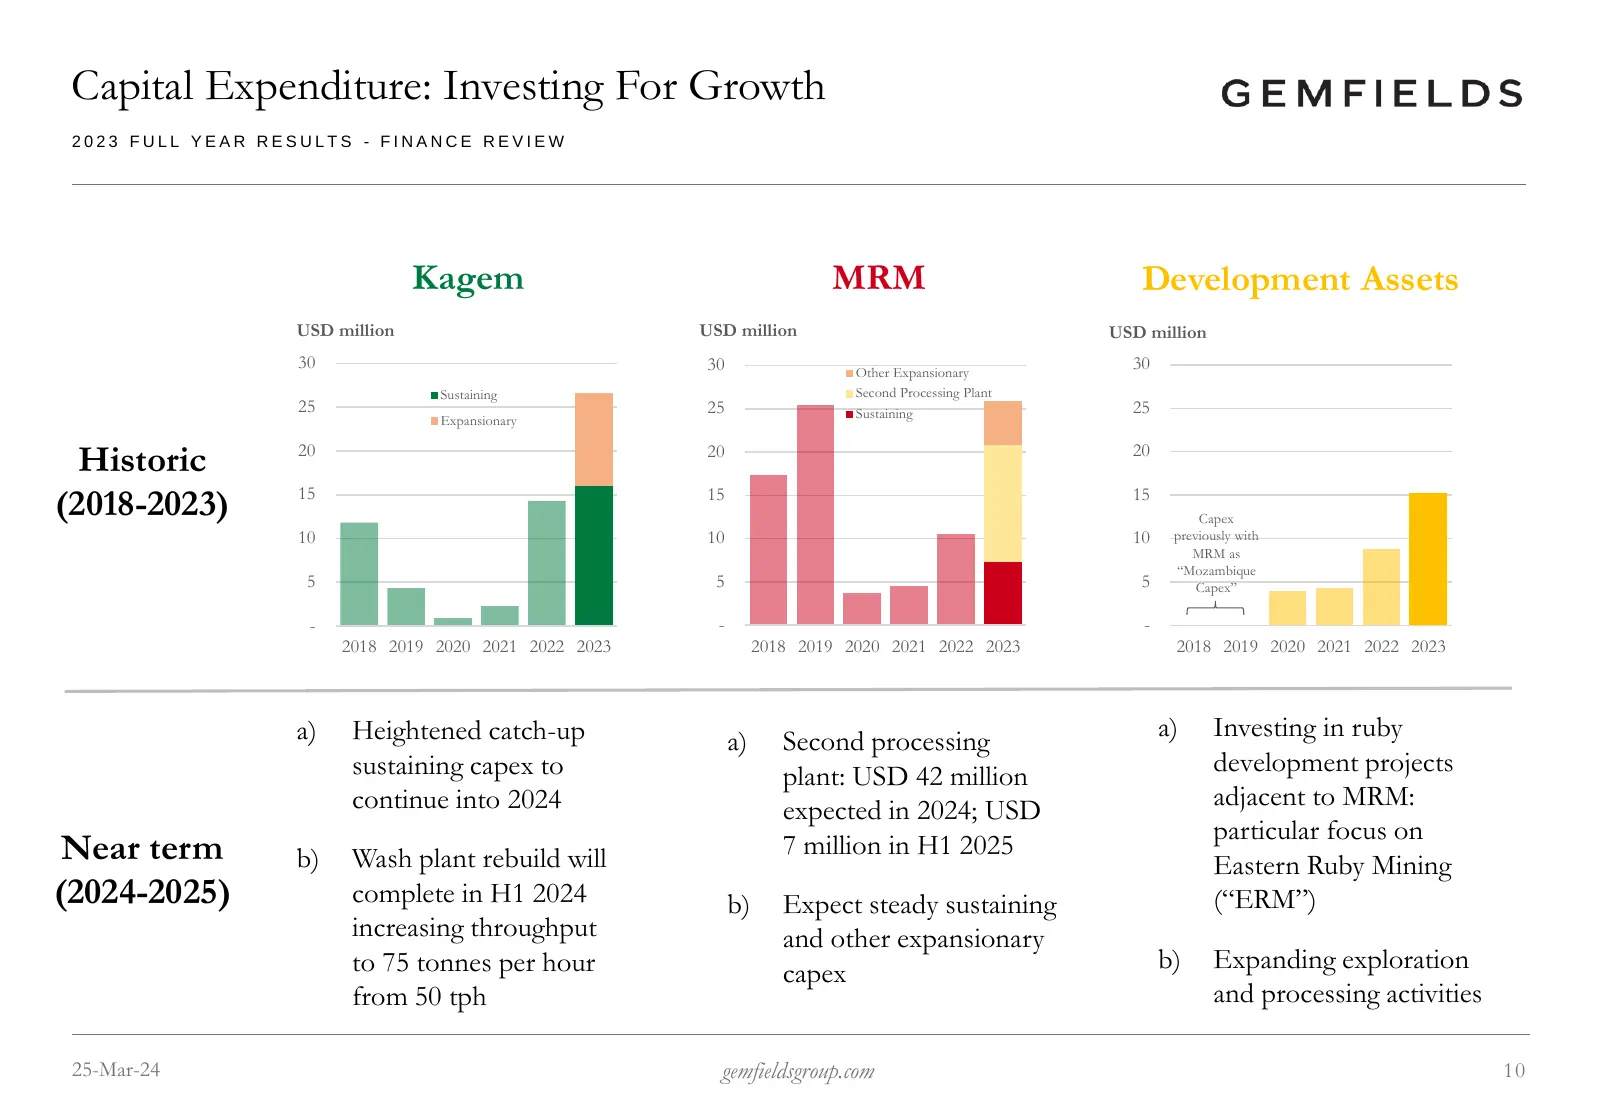
Capital Expenditure: Investing For Growth 2023 FULL YEAR RESULTS - FINANCE REVIEW Kagem MRM Development Assets USD million USD million USD million 30 30 Other Expansionary 30 Sustaining Second Processing Plant 25 25 Sustaining 25 Expansionary Historic 20 20 20 (2018-2023) 15 15 15 Capex 10 10 10 pre
Slide 11: MRM PP2: Fundamentally on Schedule and on Budget
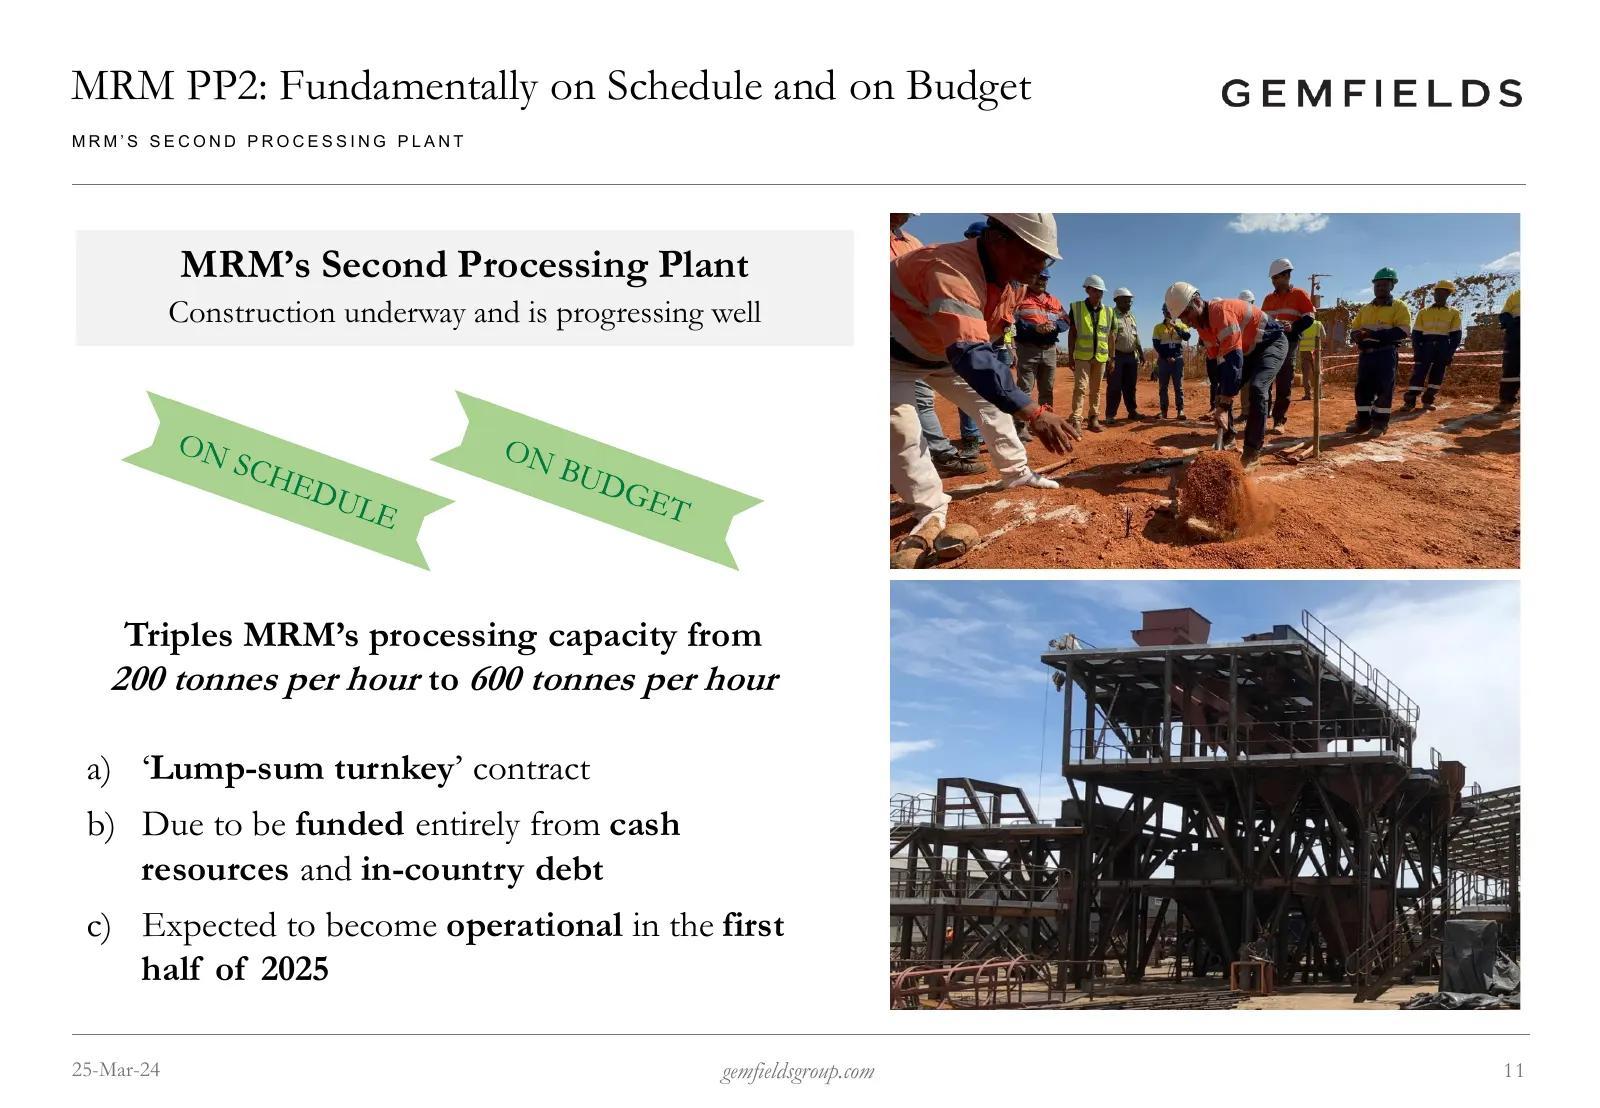
MRM PP2: Fundamentally on Schedule and on Budget MRM’S SECOND PROCESSING PLANT MRM’s Second Processing Plant Construction underway and is progressing well Triples MRM’s processing capacity from 200 tonnes per hour to 600 tonnes per hour a) ‘Lump-sum turnkey’ contract b) Due to be funded entirely fro
Slide 12: MRM Capital Expenditure
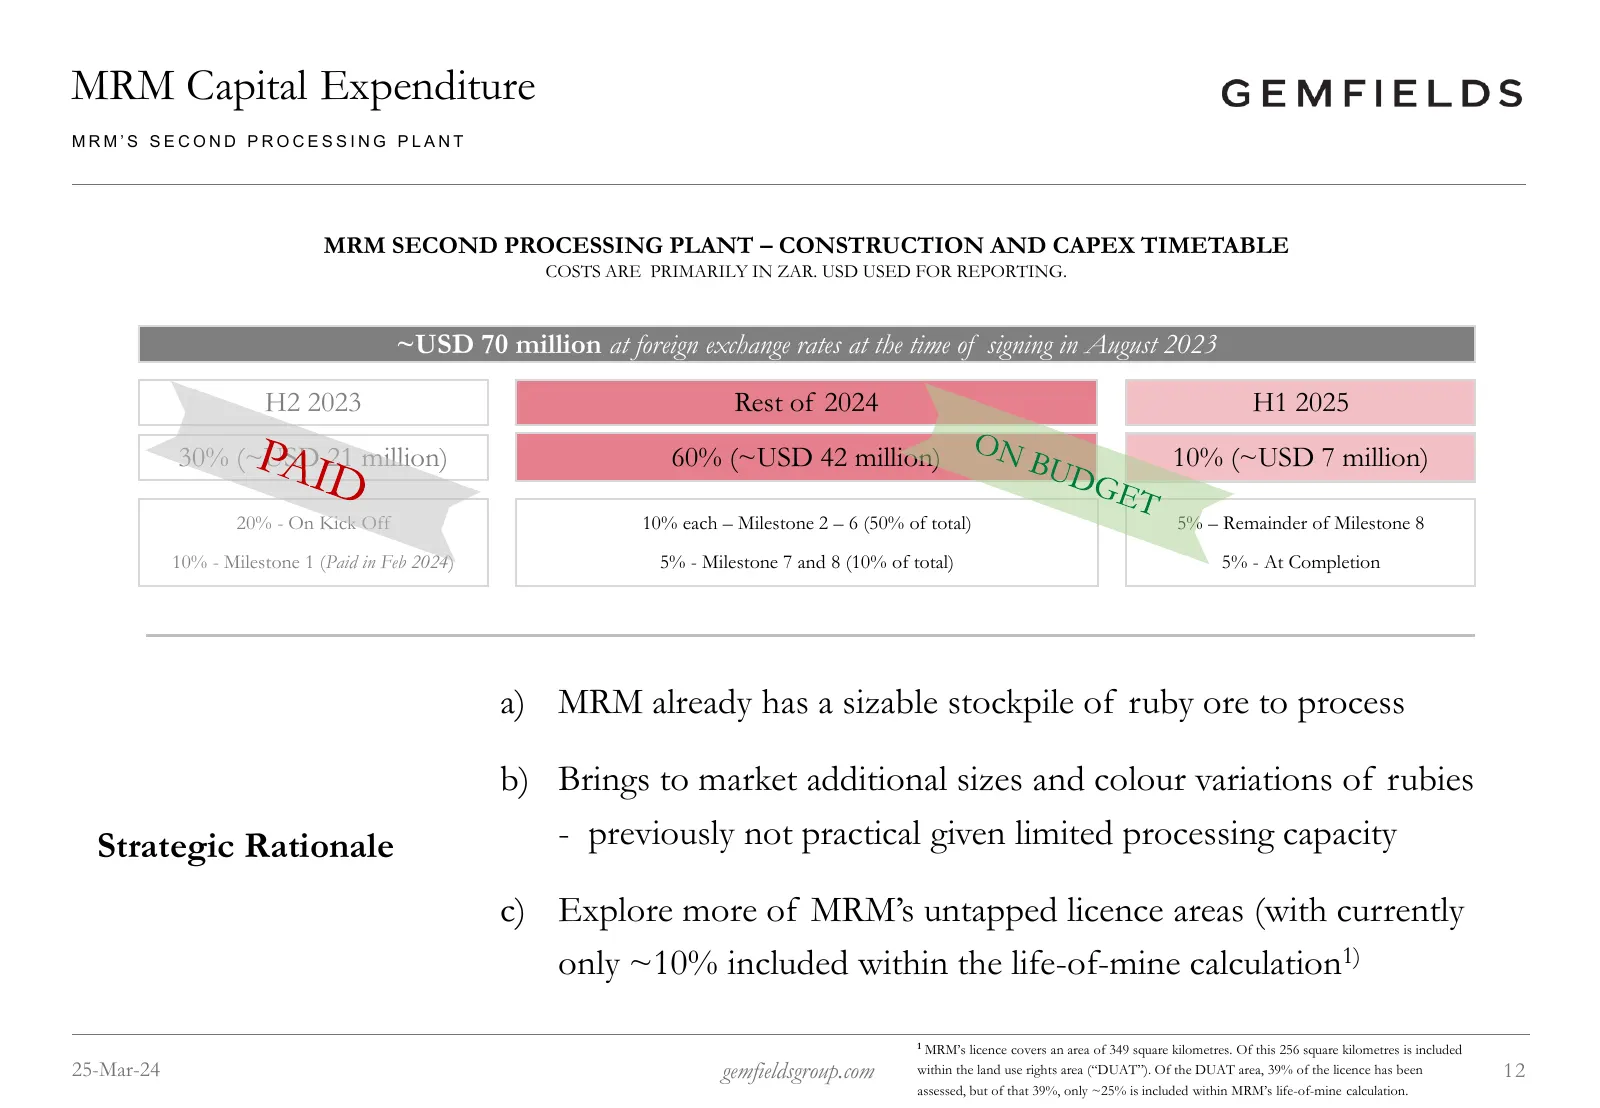
MRM Capital Expenditure MRM’S SECOND PROCESSING PLANT MRM SECOND PROCESSING PLANT – CONSTRUCTION AND CAPEX TIMETABLE COSTS ARE PRIMARILY IN ZAR. USD USED FOR REPORTING. ~USD 70 million at foreign exchange rates at the time of signing in August 2023 H2 2023 Rest of 2024 H1 2025 30% (~USD 21 million)
Slide 13: Fabergé – No Direct Funding Required in 2023
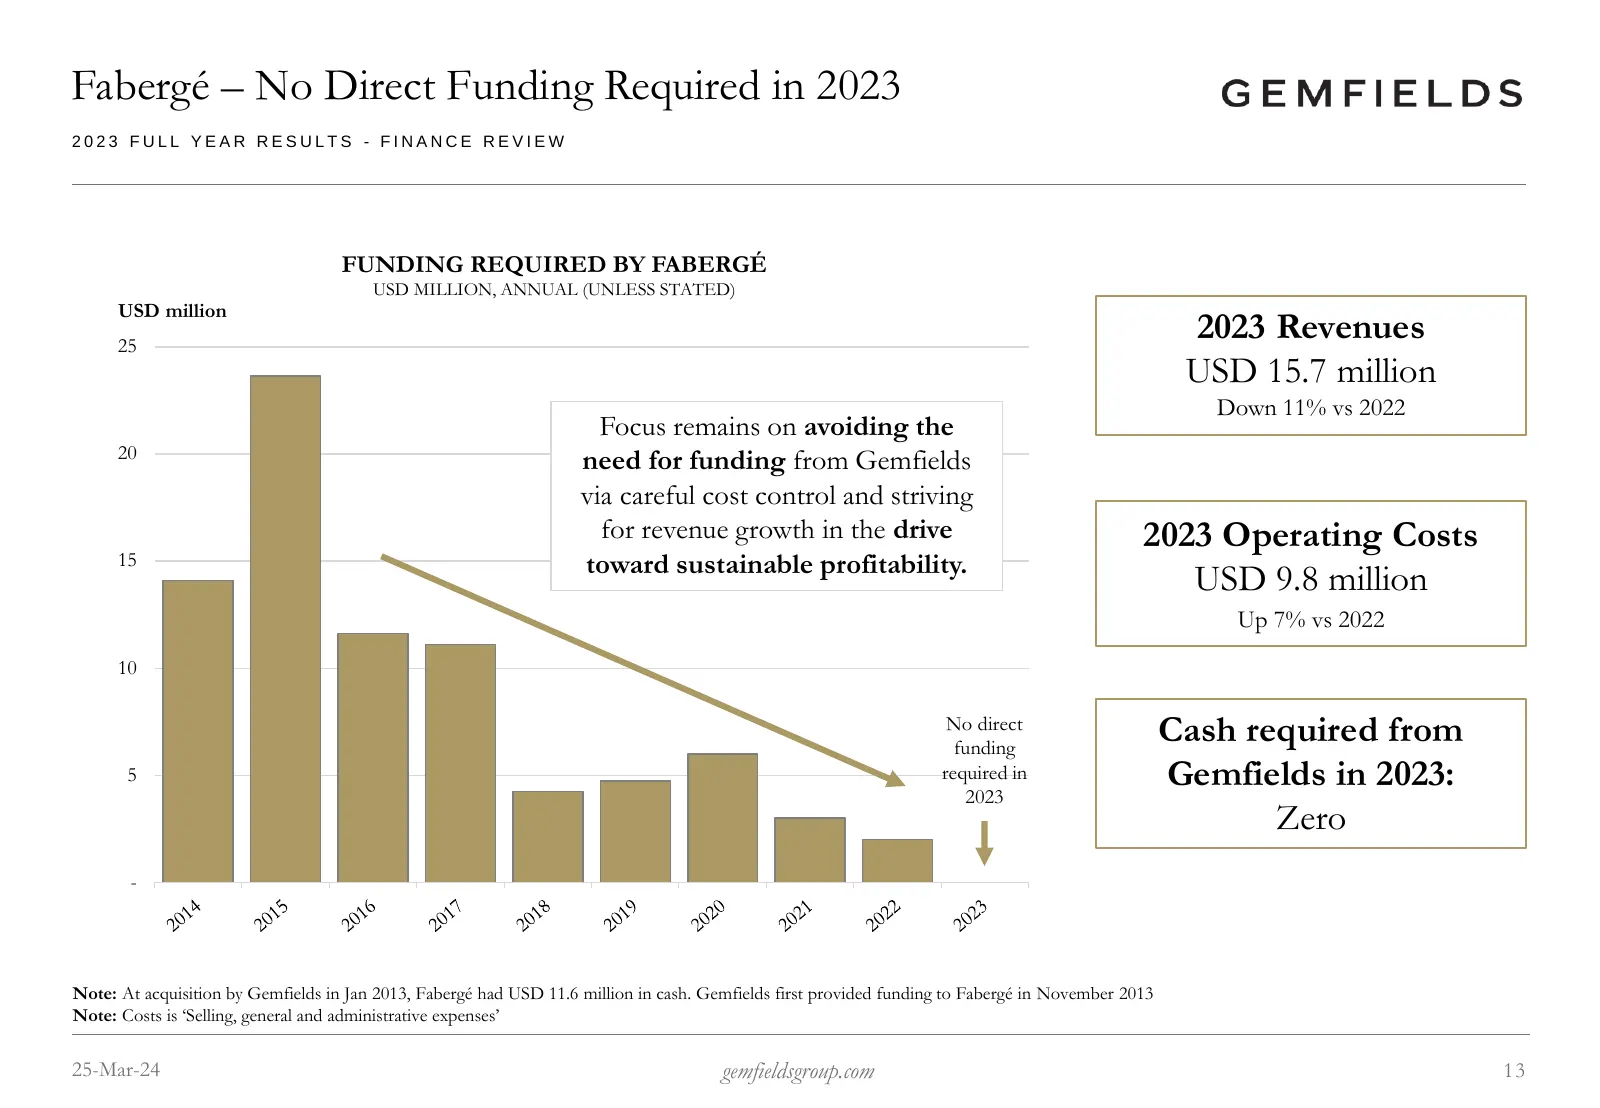
Fabergé – No Direct Funding Required in 2023 2023 FULL YEAR RESULTS - FINANCE REVIEW FUNDING REQUIRED BY FABERGÉ USD MILLION, ANNUAL (UNLESS STATED) USD million 25 2023 Revenues USD 15.7 million Down 11% vs 2022 Focus remains on avoiding the 20 need for funding from Gemfields via careful cost contro
Slide 14: Capex & Large Cash Tax Bill Drive Negative Free Cash Flow
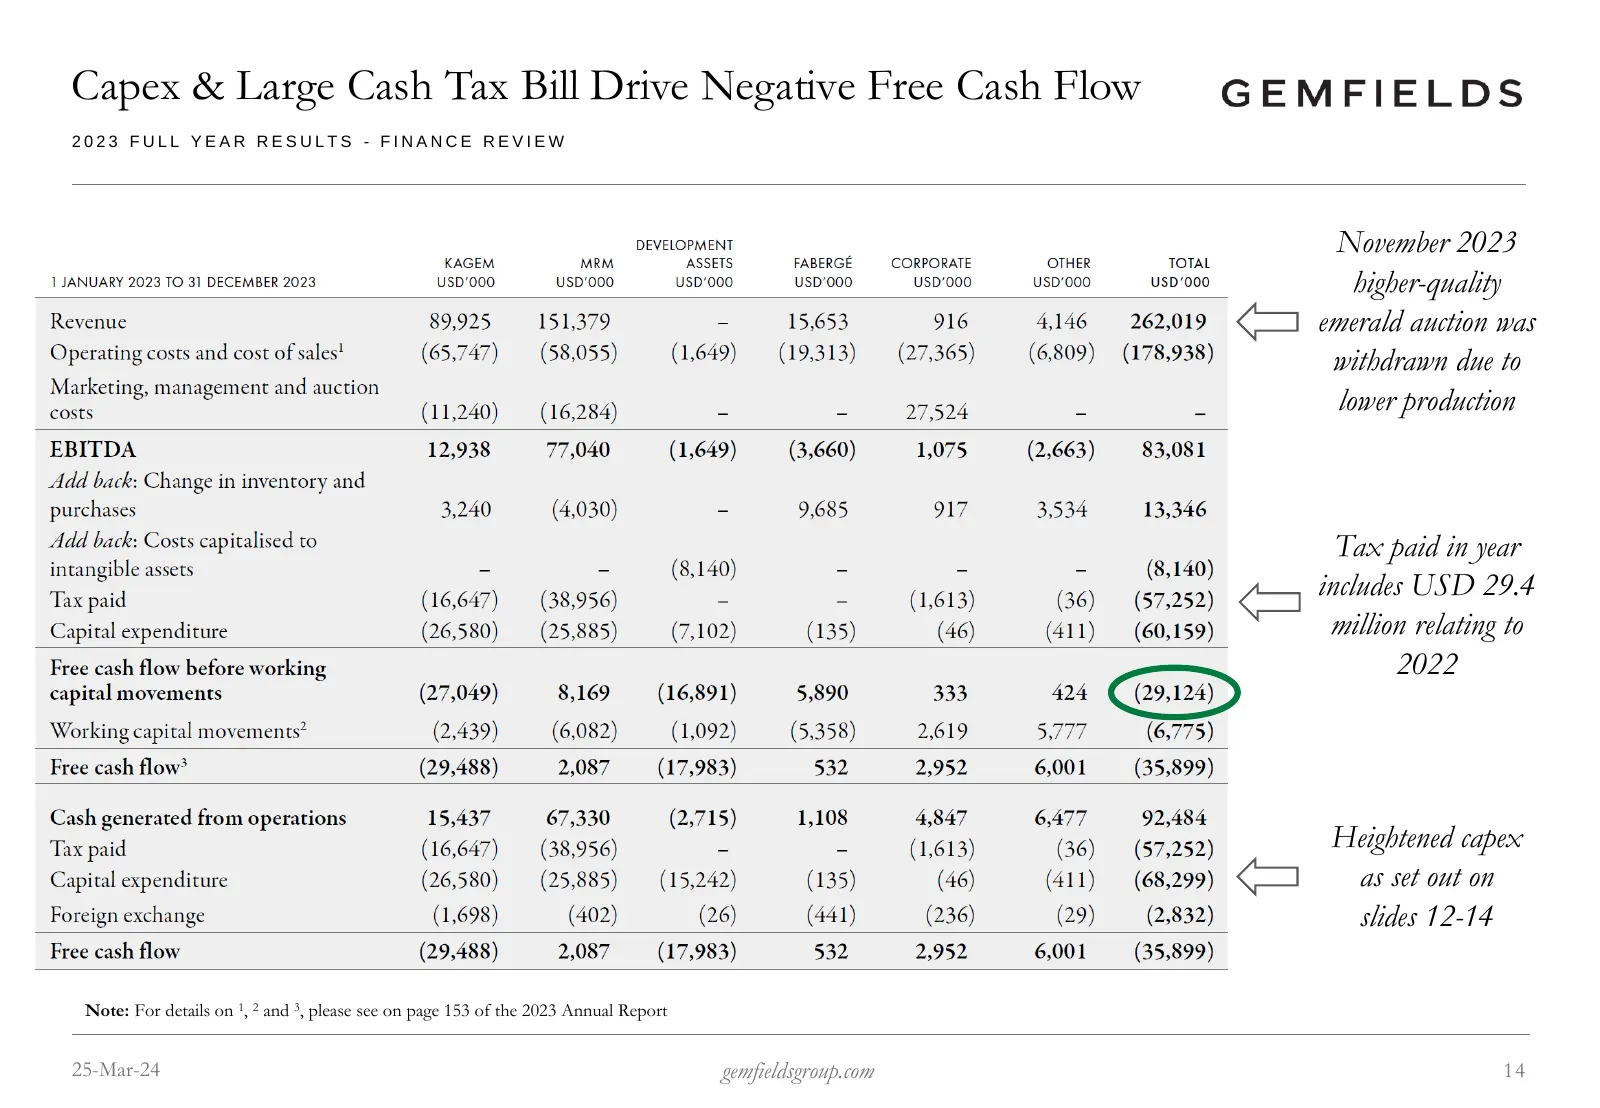
Capex & Large Cash Tax Bill Drive Negative Free Cash Flow 2023 FULL YEAR RESULTS - FINANCE REVIEW November 2023 higher-quality emerald auction was withdrawn due to lower production Tax paid in year includes USD 29.4 million relating to 2022 Heightened capex as set out on slides 12-14 Note: For detai
Slide 15: Net Cash Lower Due To Considerable 2023 Cash Usage
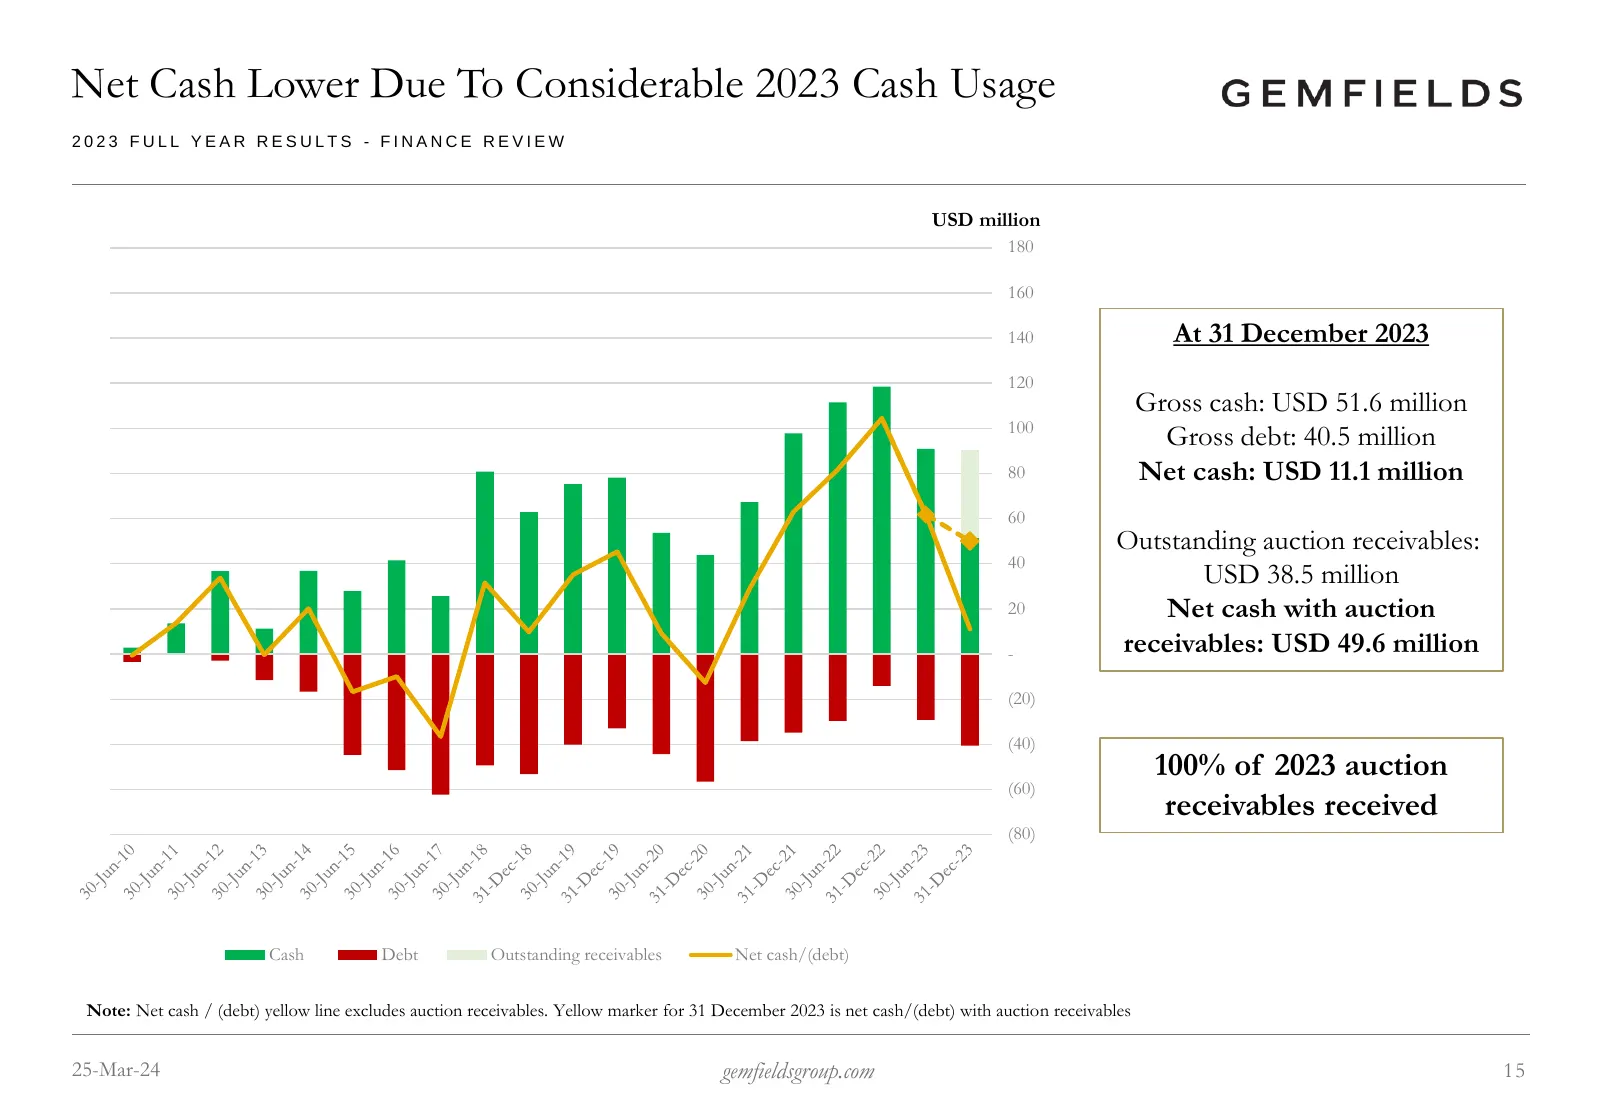
Net Cash Lower Due To Considerable 2023 Cash Usage 2023 FULL YEAR RESULTS - FINANCE REVIEW USD million 180 160 140 At 31 December 2023 120 Gross cash: USD 51.6 million 100 Gross debt: 40.5 million 80 Net cash: USD 11.1 million 60 Outstanding auction receivables: 40 USD 38.5 million 20 Net cash with
Slide 16: Balanced approach to Capital Allocation
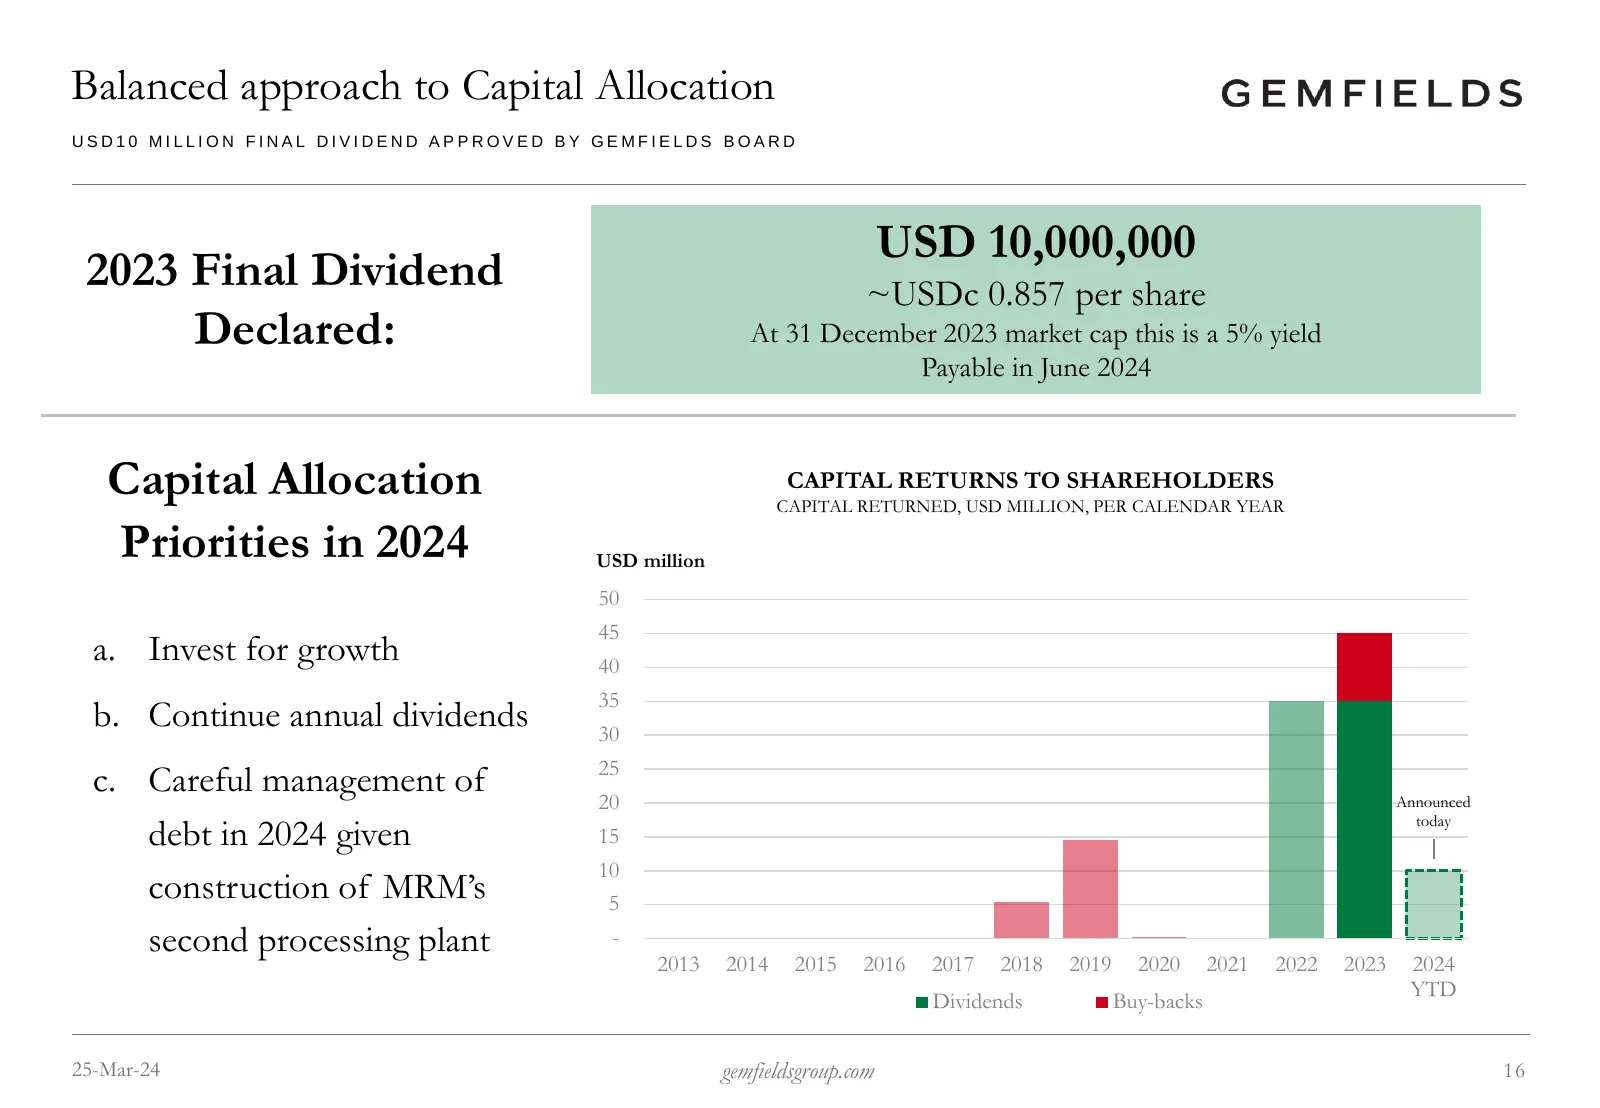
Balanced approach to Capital Allocation USD10 MILLION FINAL DIVIDEND APPROVED BY GEMFIELDS BOARD USD 10,000,000 2023 Final Dividend ~USDc 0.857 per share Declared: At 31 December 2023 market cap this is a 5% yield Payable in June 2024 Capital Allocation CAPITAL RETURNS TO SHAREHOLDERS CAPITAL RETURN
Slide 17: Gemfields sits at a considerable discount to Net Asset Value
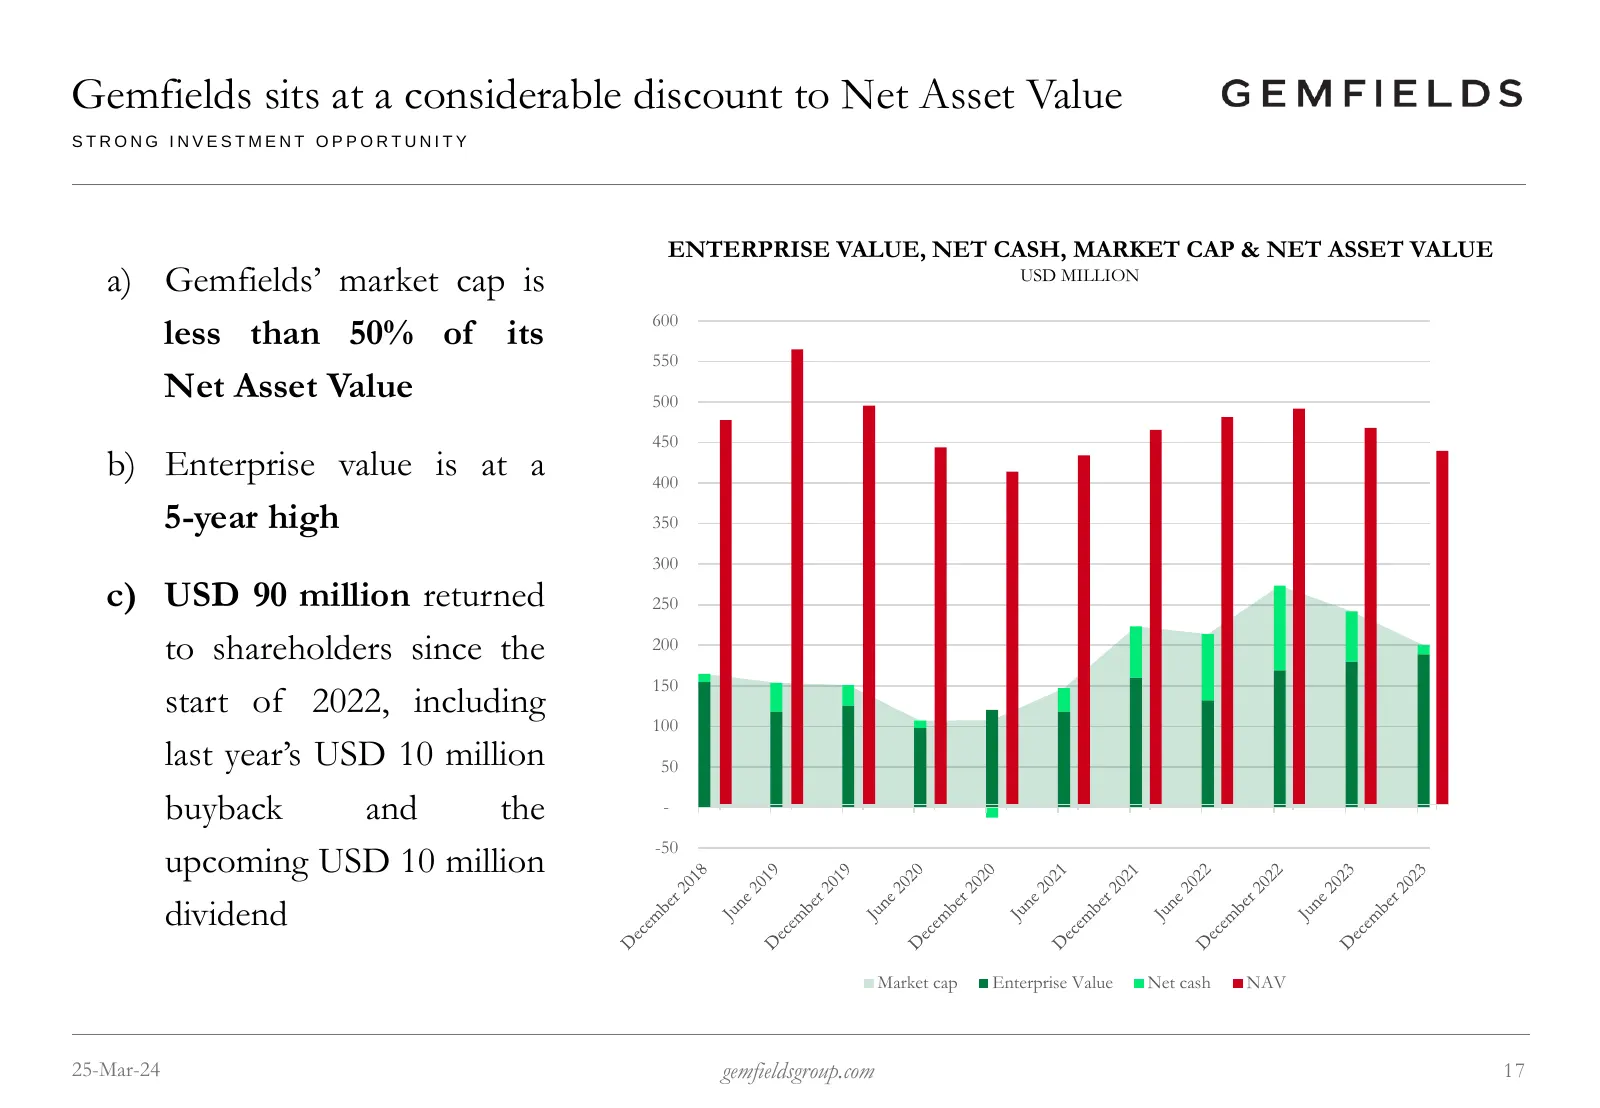
Gemfields sits at a considerable discount to Net Asset Value STRONG INVESTMENT OPPORTUNITY ENTERPRISE VALUE, NET CASH, MARKET CAP & NET ASSET VALUE a) Gemfields’ market cap is USD MILLION 600 less than 50% of its 550 Net Asset Value 500 450 b) Enterprise value is at a 400 5-year high 350 300 c) USD
Slide 18: Outlook and Summary
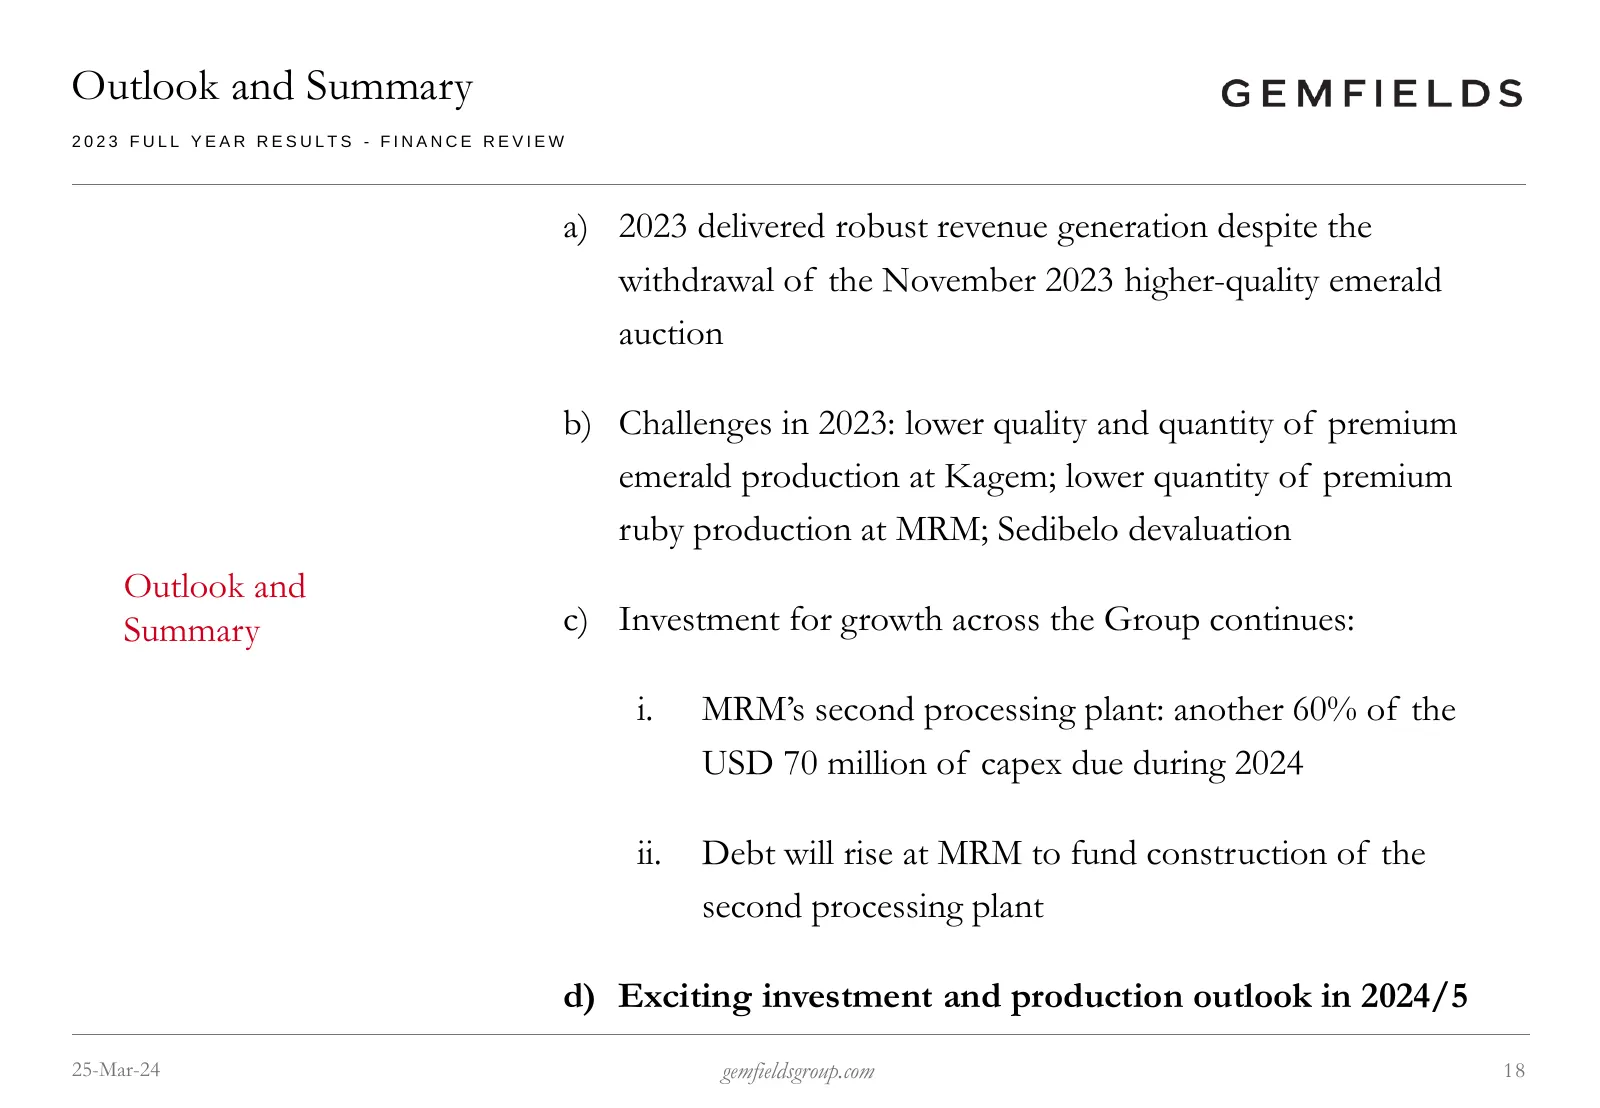
Outlook and Summary 2023 FULL YEAR RESULTS - FINANCE REVIEW a) 2023 delivered robust revenue generation despite the withdrawal of the November 2023 higher-quality emerald auction b) Challenges in 2023: lower quality and quantity of premium emerald production at Kagem; lower quantity of premium ruby
Slide 19: 2023 Full Year Results - Operational Review
2023 Full Year Results - Operational Review SEAN GILBERTSON, CEO A Story in Every Gemstone | Discover more about Gemfields and Fabergé at gemfieldsgroup.com
Slide 20: Our Strategy
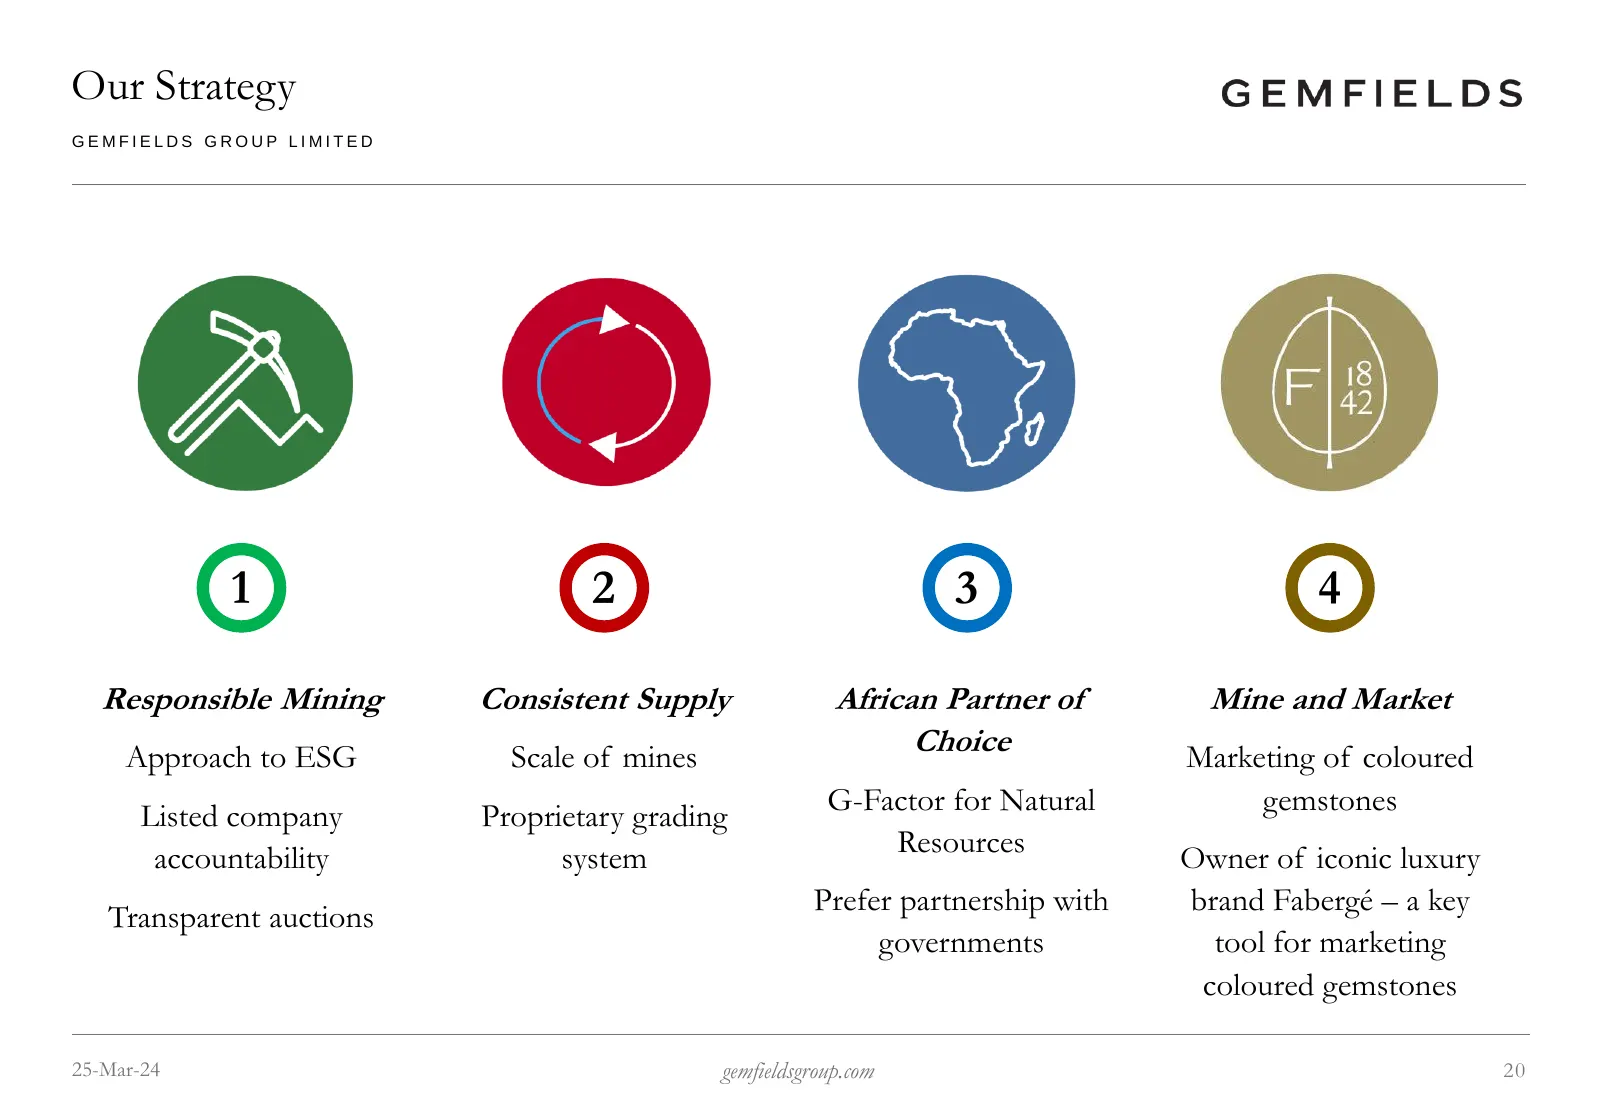
Our Strategy GEMFIELDS GROUP LIMITED 1 2 3 4 Responsible Mining Consistent Supply African Partner of Mine and Market Approach to ESG Scale of mines Choice Marketing of coloured Listed company Proprietary grading G-Factor for Natural gemstones accountability system Resources Owner of iconic luxury Tr
Slide 21: Responsible Mining
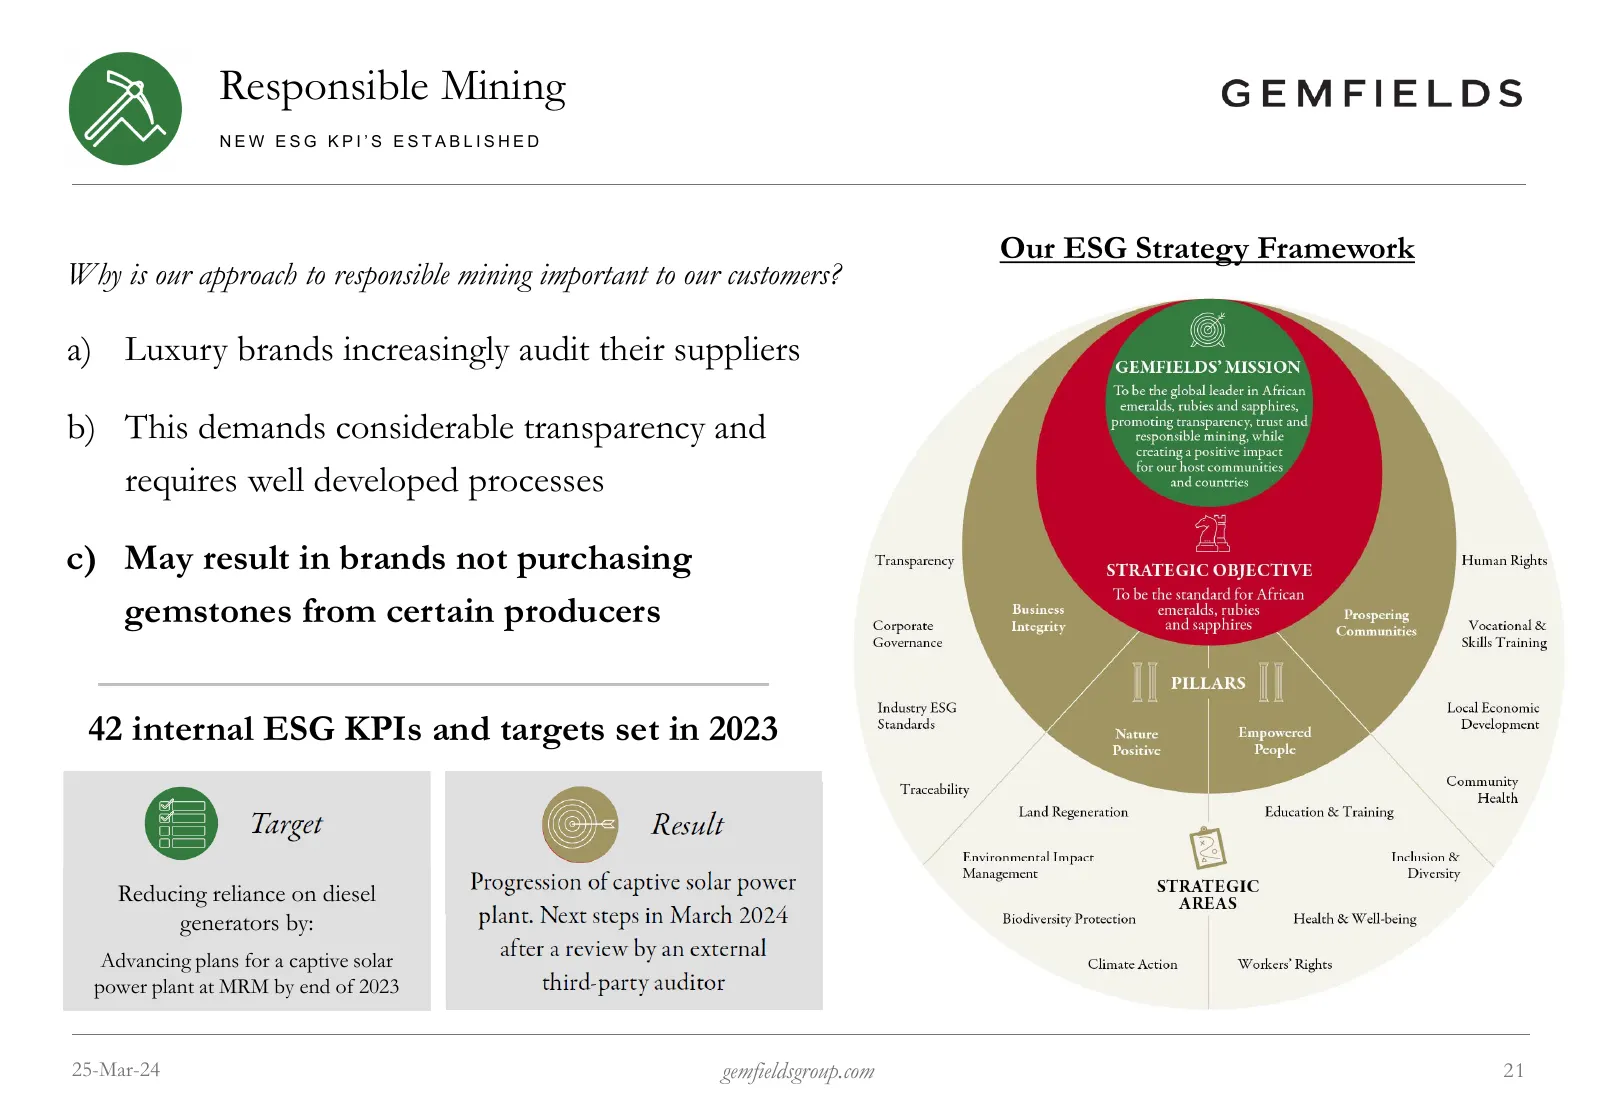
Responsible Mining NEW ESG KPI’S ESTABLISHED Our ESG Strategy Framework Why is our approach to responsible mining important to our customers? a) Luxury brands increasingly audit their suppliers b) This demands considerable transparency and requires well developed processes c) May result in brands no
Slide 22: Consistent Supply: Normal Auction Schedule Expected in 2024
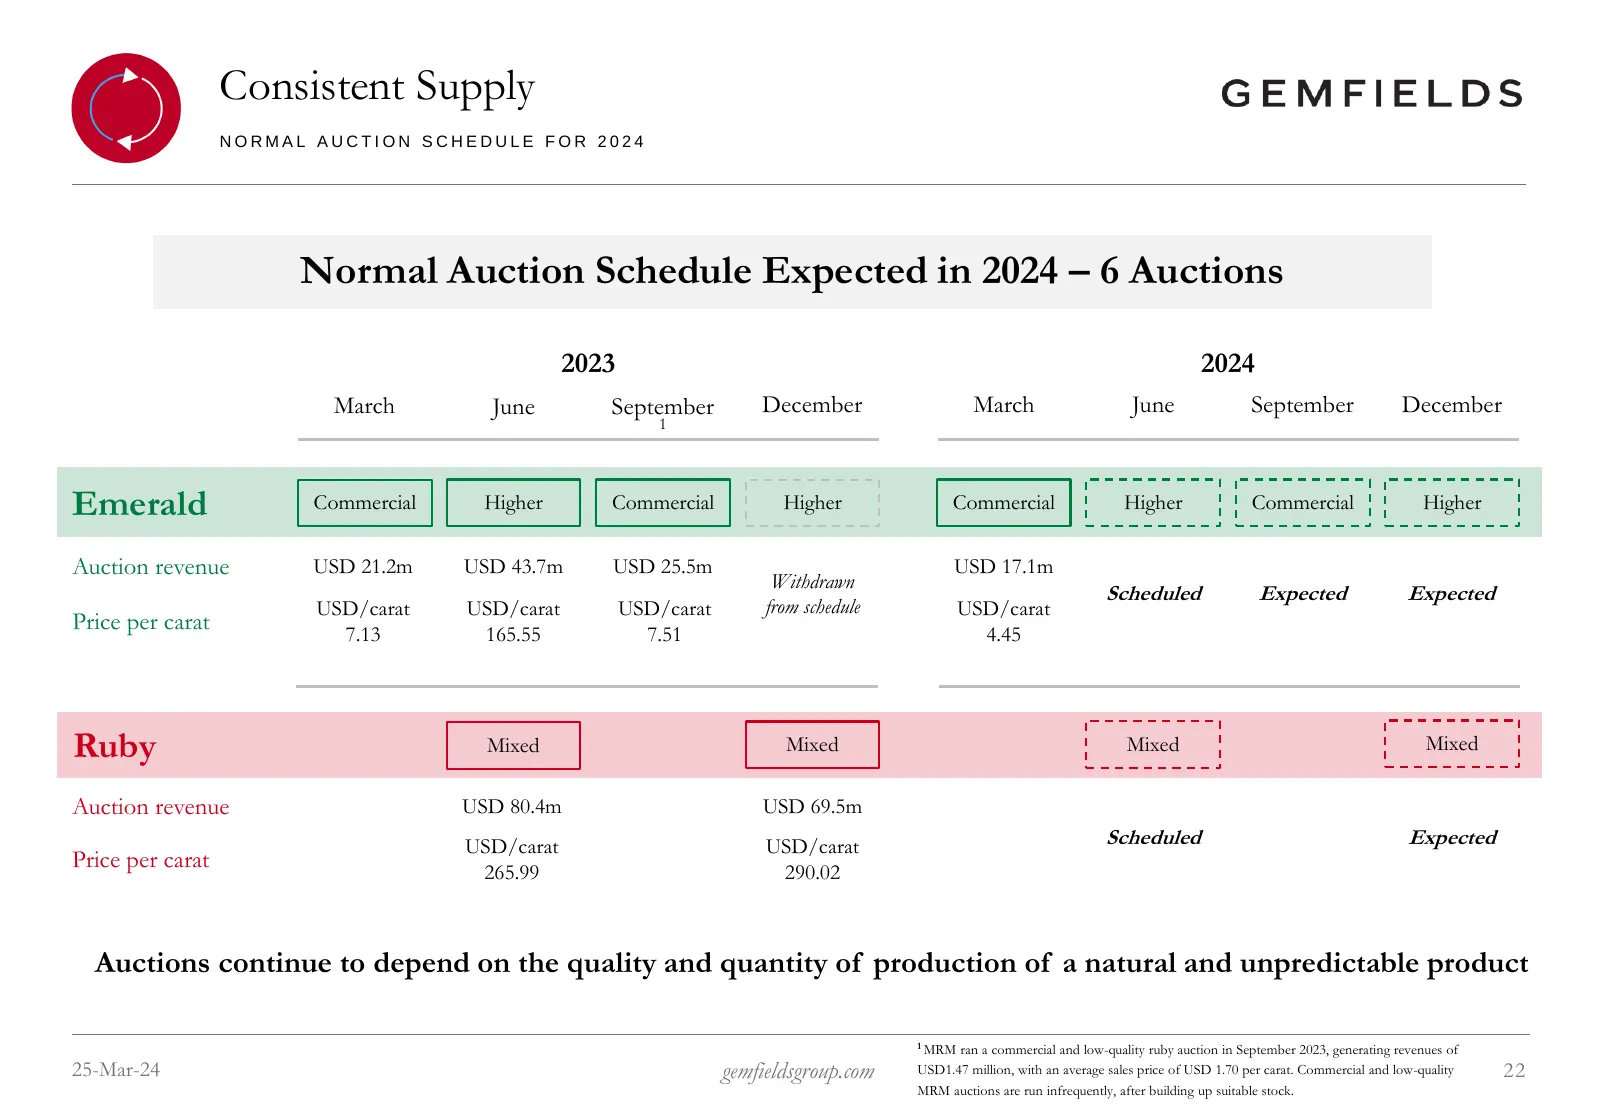
Consistent Supply NORMAL AUCTION SCHEDULE FOR 2024 Normal Auction Schedule Expected in 2024 – 6 Auctions 2023 2024 March June September December March June September December 1 Emerald Commercial Higher Commercial Higher Commercial Higher Commercial Higher Auction revenue USD 21.2m USD 43.7m USD 25.
Slide 23: Consistent Supply
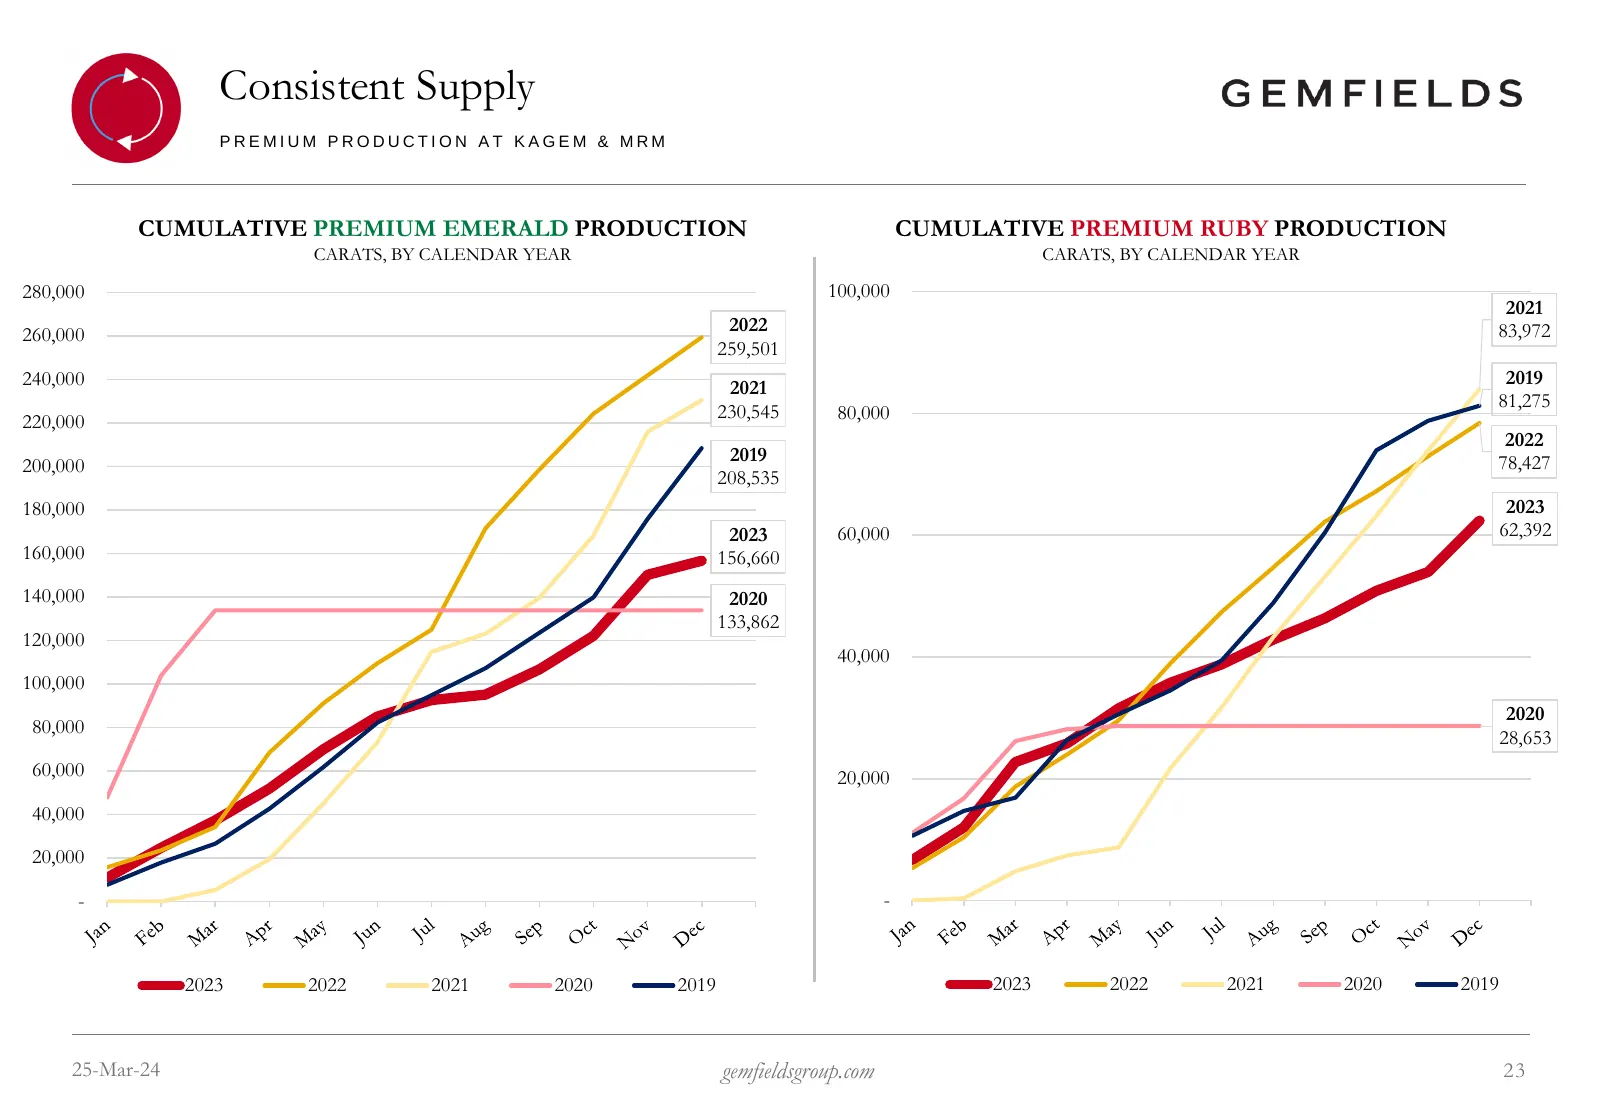
Consistent Supply PREMIUM PRODUCTION AT KAGEM & MRM CUMULATIVE PREMIUM EMERALD PRODUCTION CUMULATIVE PREMIUM RUBY PRODUCTION CARATS, BY CALENDAR YEAR CARATS, BY CALENDAR YEAR 280,000 100,000 2021 260,000 2022 83,972 259,501 240,000 2019 2021 81,275 230,545 80,000 220,000 2022 2019 78,427 200,000 208
Slide 24: Consistent Supply
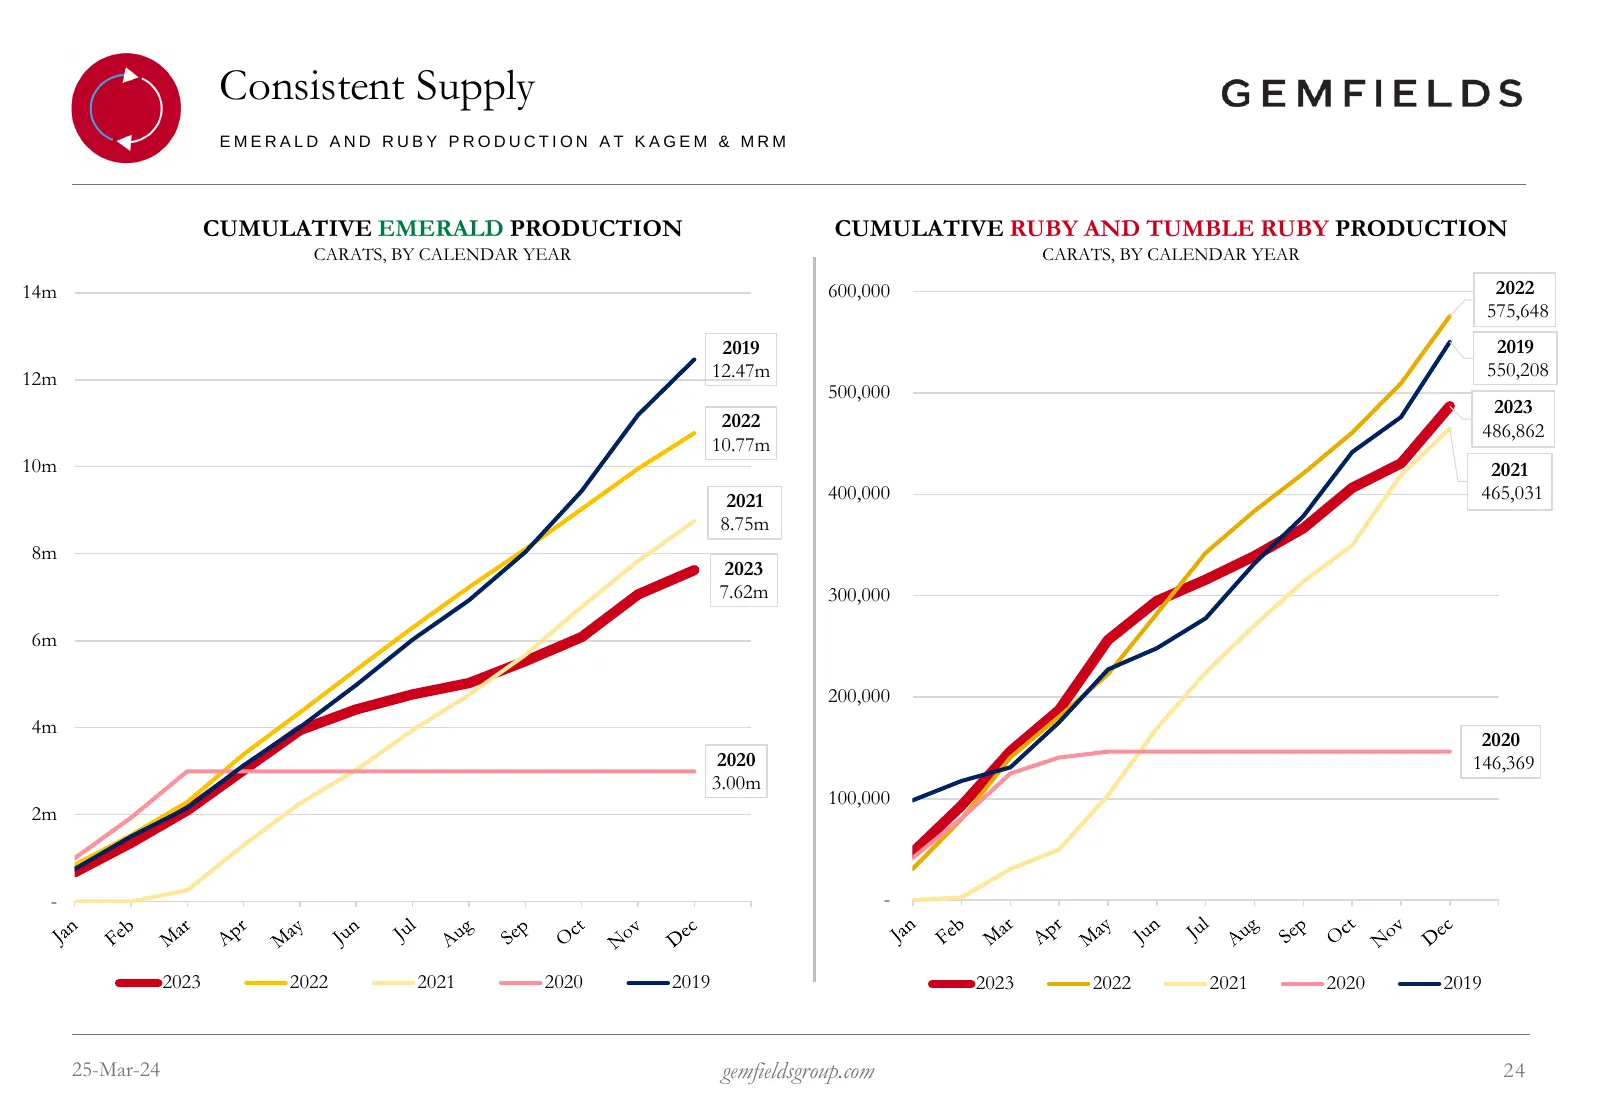
Consistent Supply EMERALD AND RUBY PRODUCTION AT KAGEM & MRM CUMULATIVE EMERALD PRODUCTION CUMULATIVE RUBY AND TUMBLE RUBY PRODUCTION CARATS, BY CALENDAR YEAR CARATS, BY CALENDAR YEAR 14m 600,000 2022 575,648 2019 2019 12m 12.47m 550,208 500,000 2023 2022 486,862 10.77m 10m 2021 2021 400,000 465,031
Slide 25: Africa’s Partner of Choice
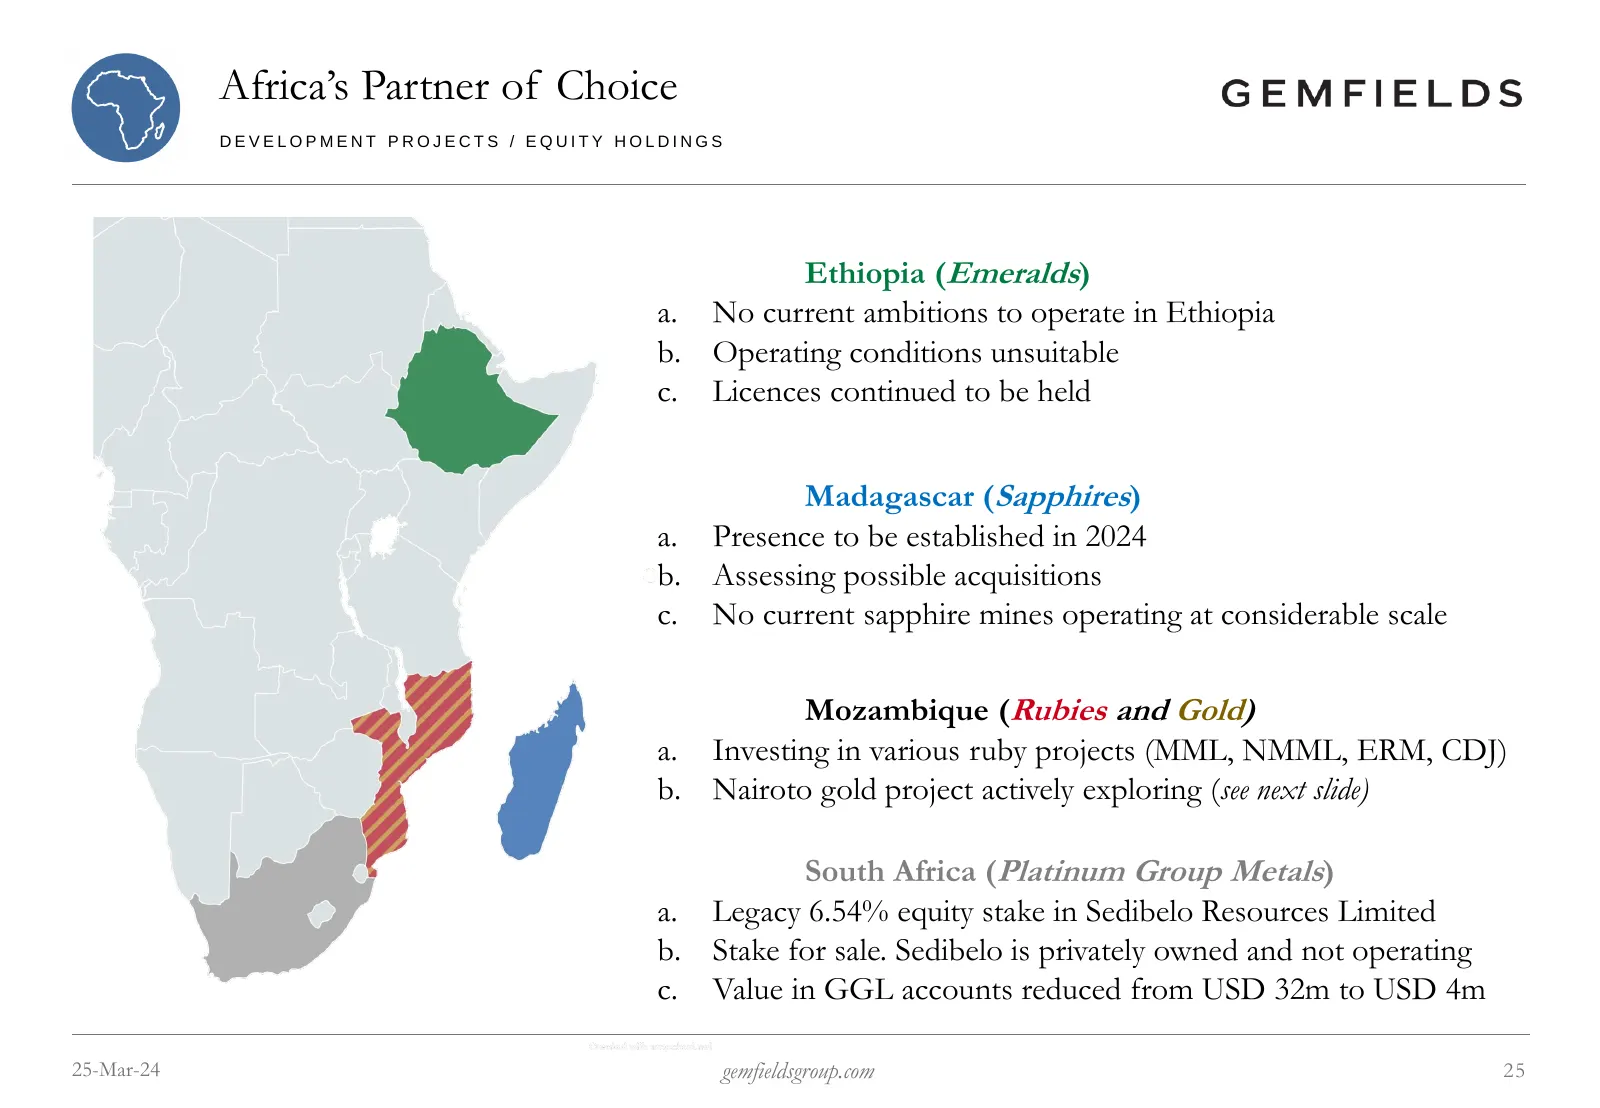
Africa’s Partner of Choice DEVELOPMENT PROJECTS / EQUITY HOLDINGS Ethiopia (Emeralds) a. No current ambitions to operate in Ethiopia b. Operating conditions unsuitable c. Licences continued to be held Madagascar (Sapphires) a. Presence to be established in 2024 b. Assessing possible acquisitions c.
Slide 26: Nairoto Gold Project: Actively Exploring to Establish Gold Resources
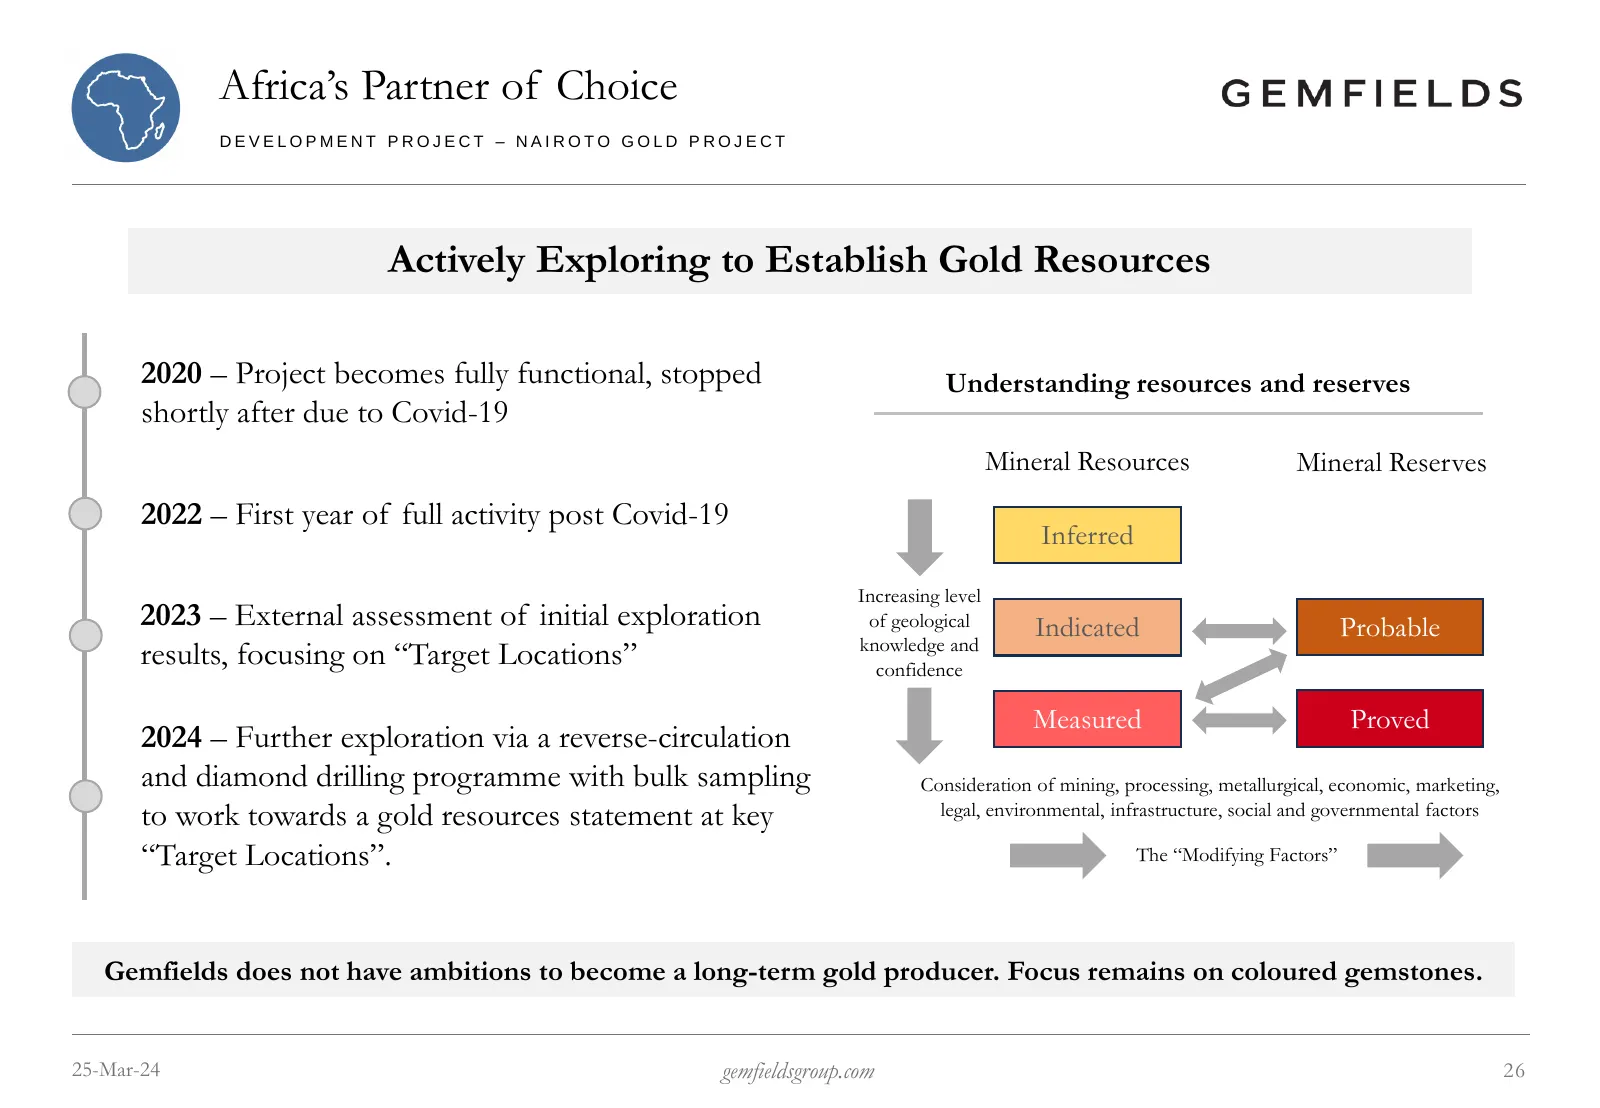
Africa’s Partner of Choice DEVELOPMENT PROJECT – NAIROTO GOLD PROJECT Actively Exploring to Establish Gold Resources 2020 – Project becomes fully functional, stopped Understanding resources and reserves shortly after due to Covid-19 Mineral Resources Mineral Reserves 2022 – First year of full activi
Slide 27: Mine and Market
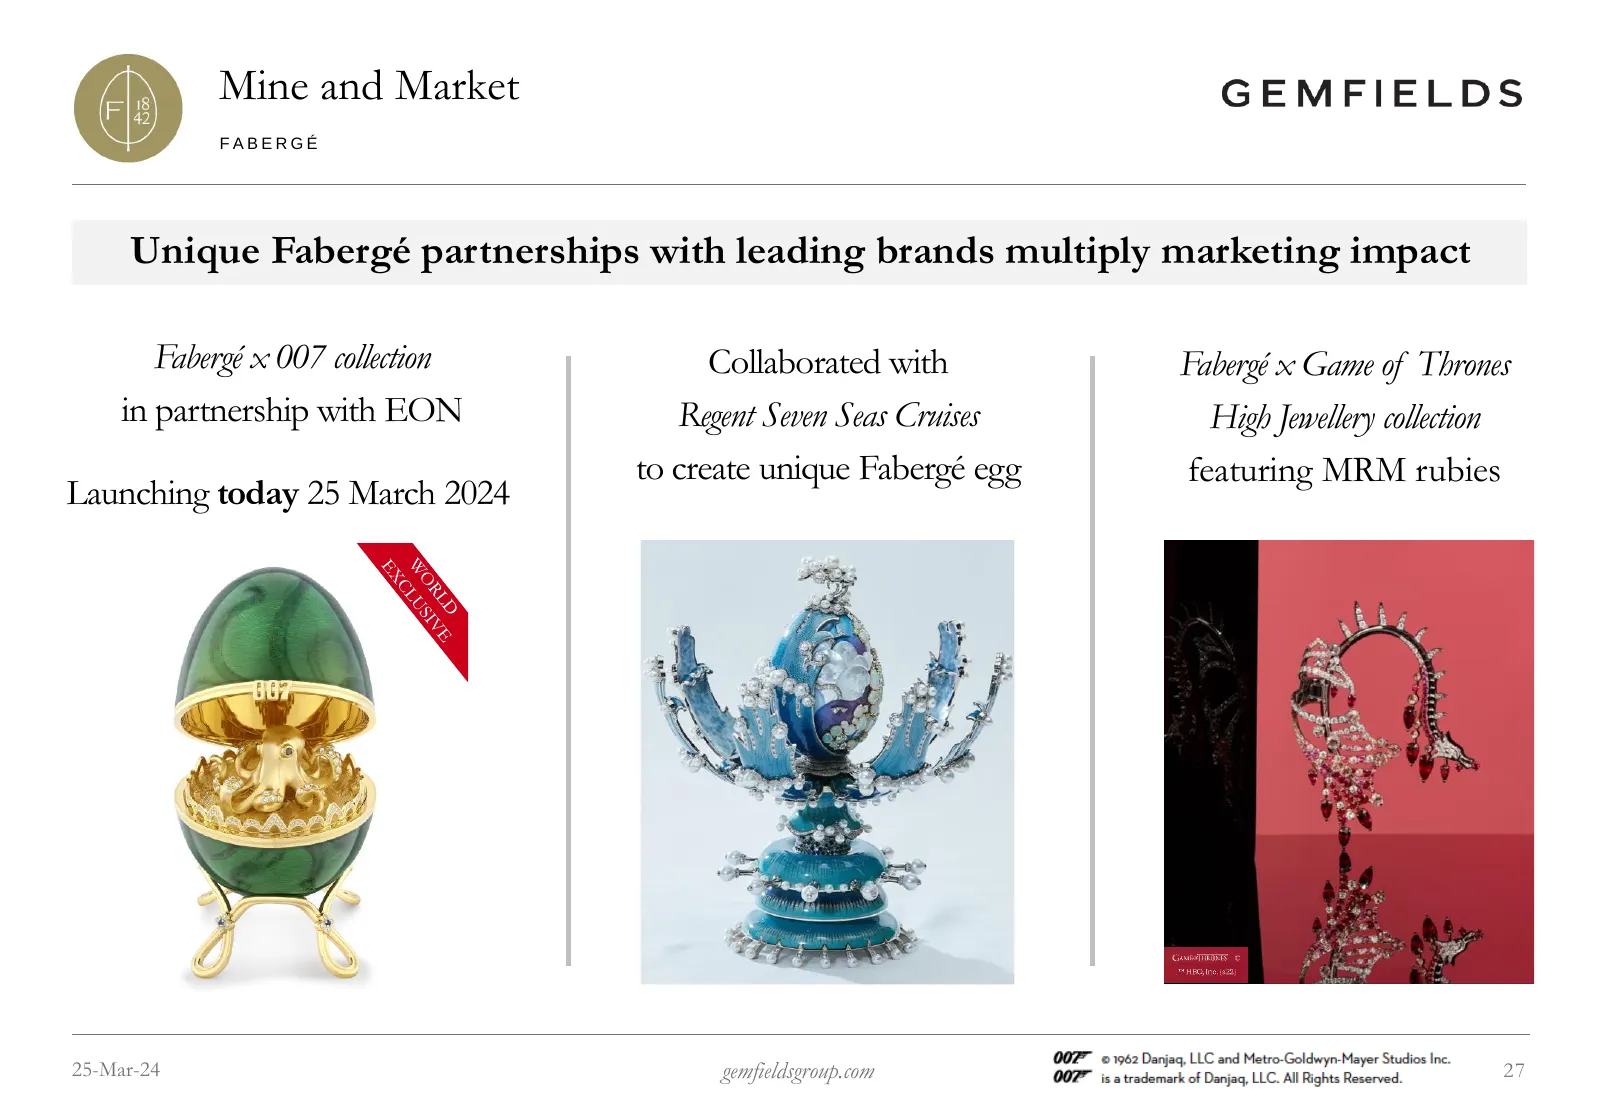
Mine and Market FABERGÉ Unique Fabergé partnerships with leading brands multiply marketing impact Fabergé x 007 collection Collaborated with Fabergé x Game of Thrones in partnership with EON Regent Seven Seas Cruises High Jewellery collection to create unique Fabergé egg featuring MRM rubies Launchi
Slide 28: Strategic Priorities
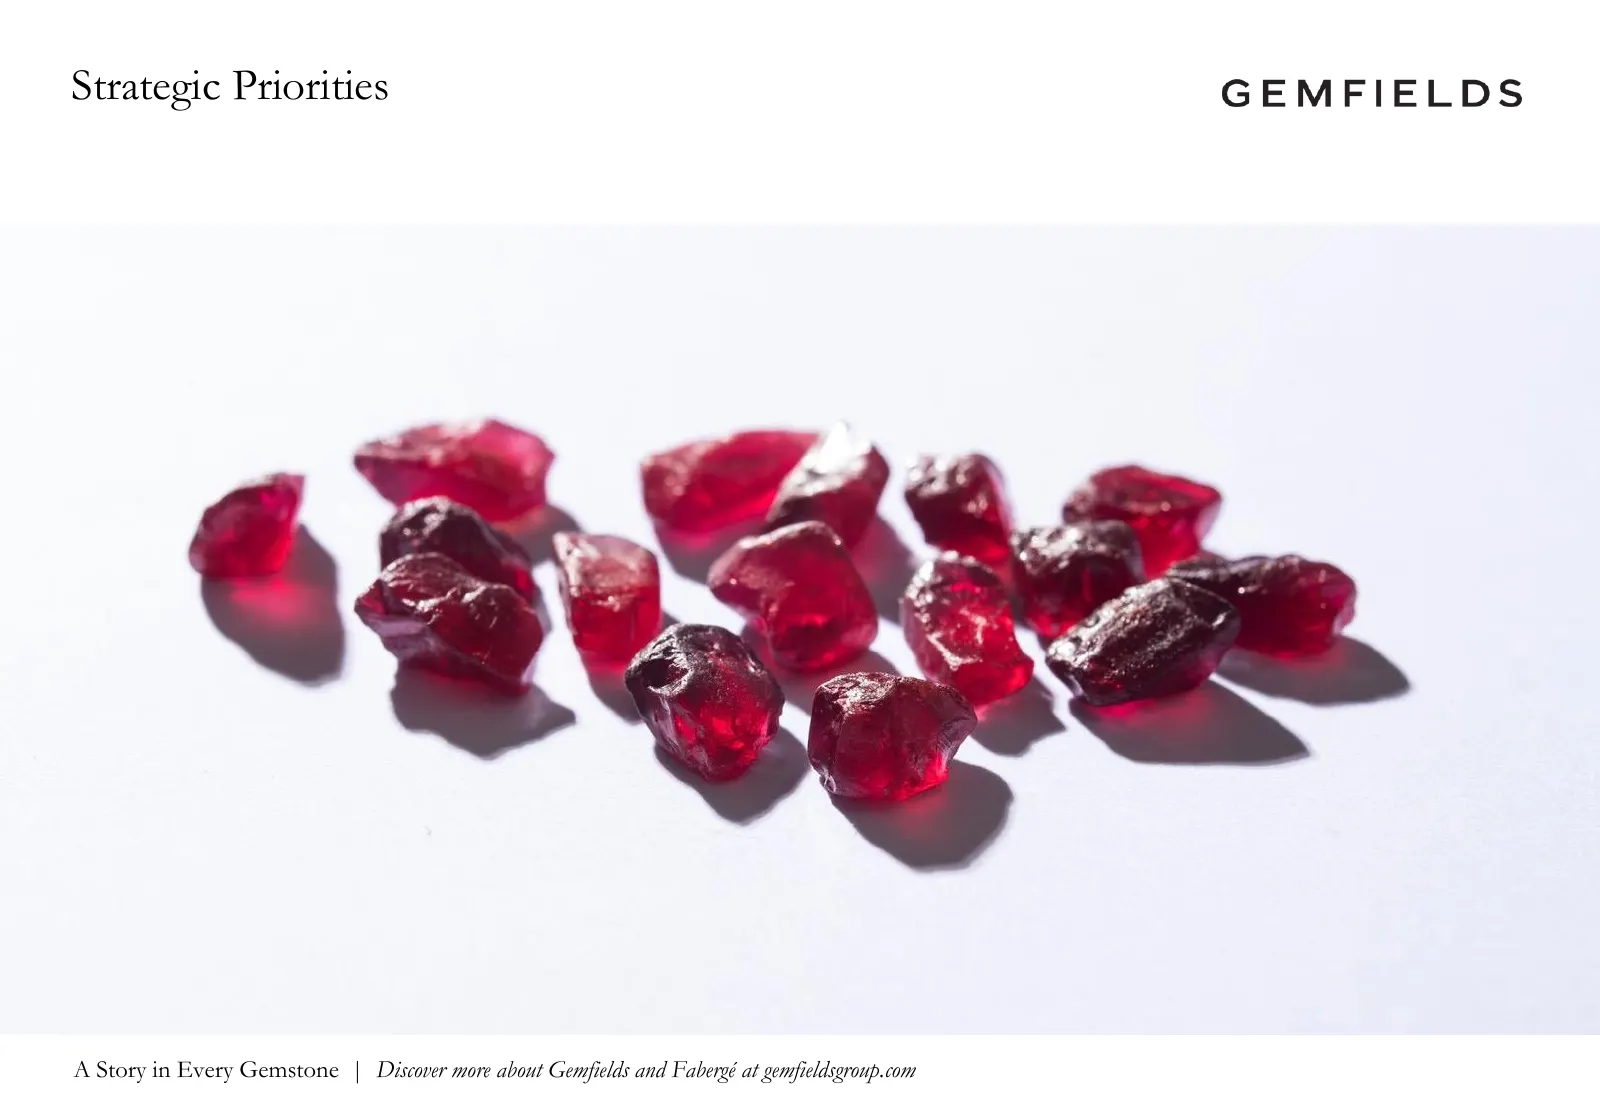
Strategic Priorities A Story in Every Gemstone | Discover more about Gemfields and Fabergé at gemfieldsgroup.com
Slide 29: Our Strategy
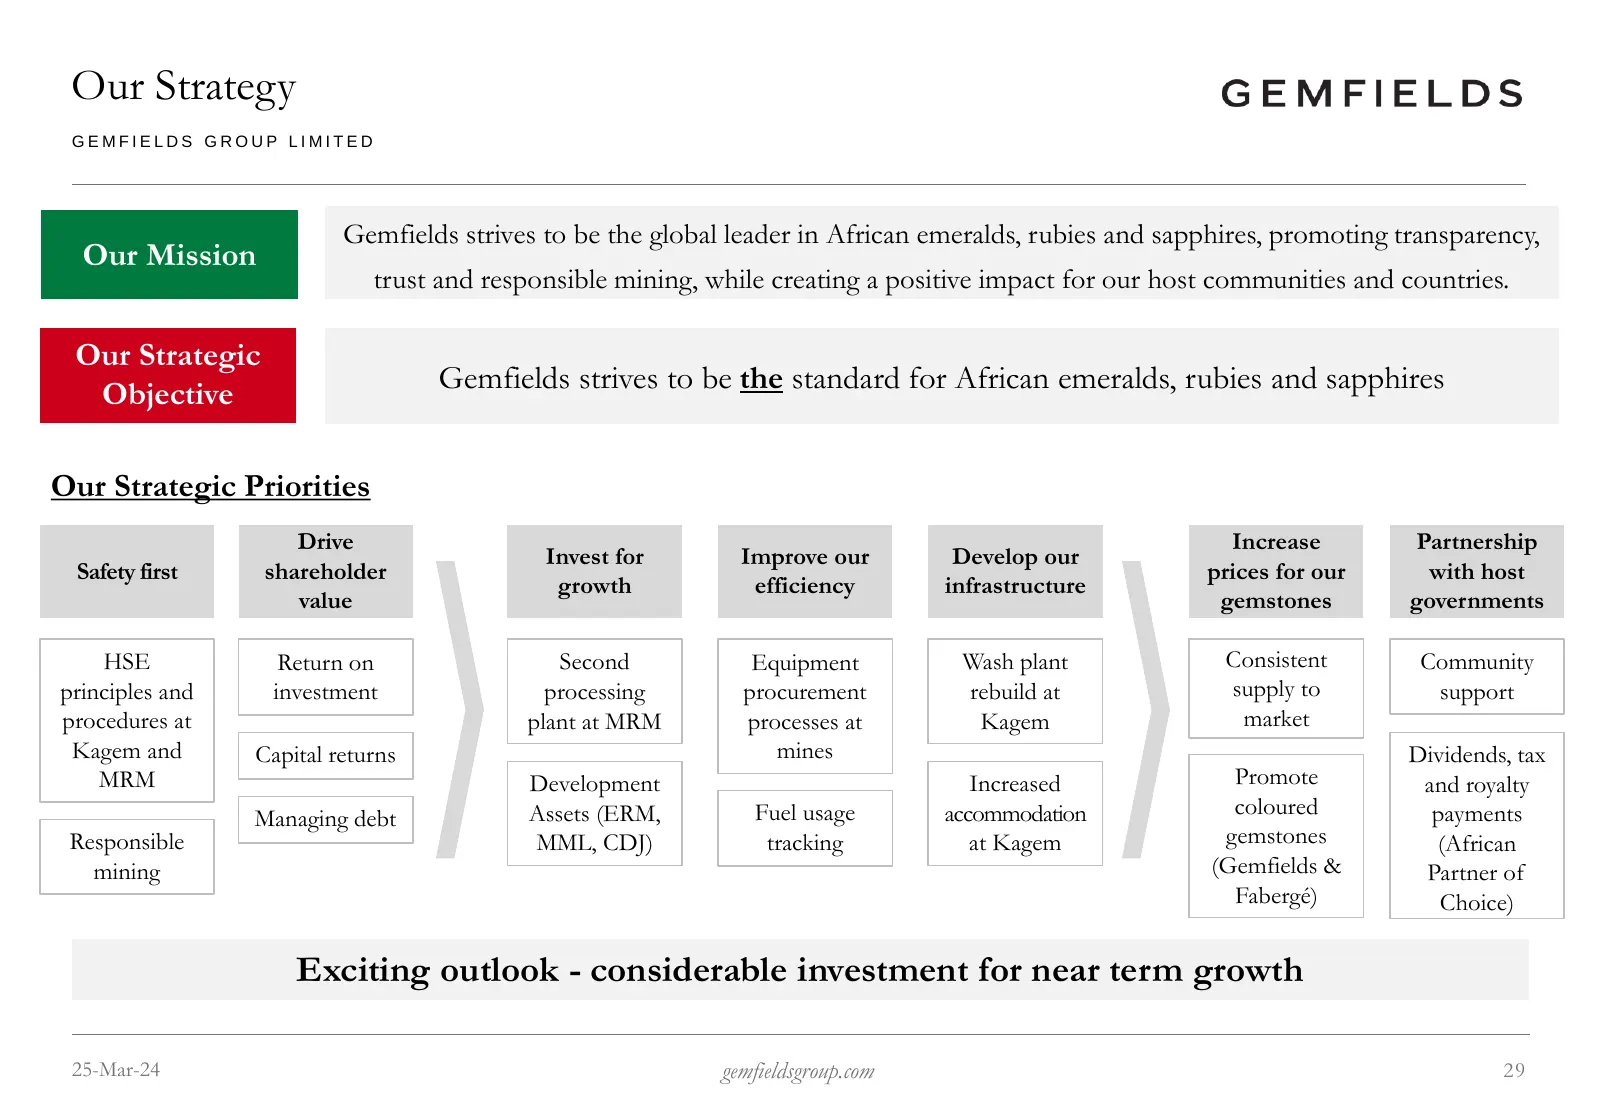
Our Strategy GEMFIELDS GROUP LIMITED Gemfields strives to be the global leader in African emeralds, rubies and sapphires, promoting transparency, Our Mission trust and responsible mining, while creating a positive impact for our host communities and countries. Our Strategic Objective Gemfields striv
Slide 30: Appendix
Appendix A Story in Every Gemstone | Discover more about Gemfields and Fabergé at gemfieldsgroup.com
Slide 31: Gemfields Group Limited
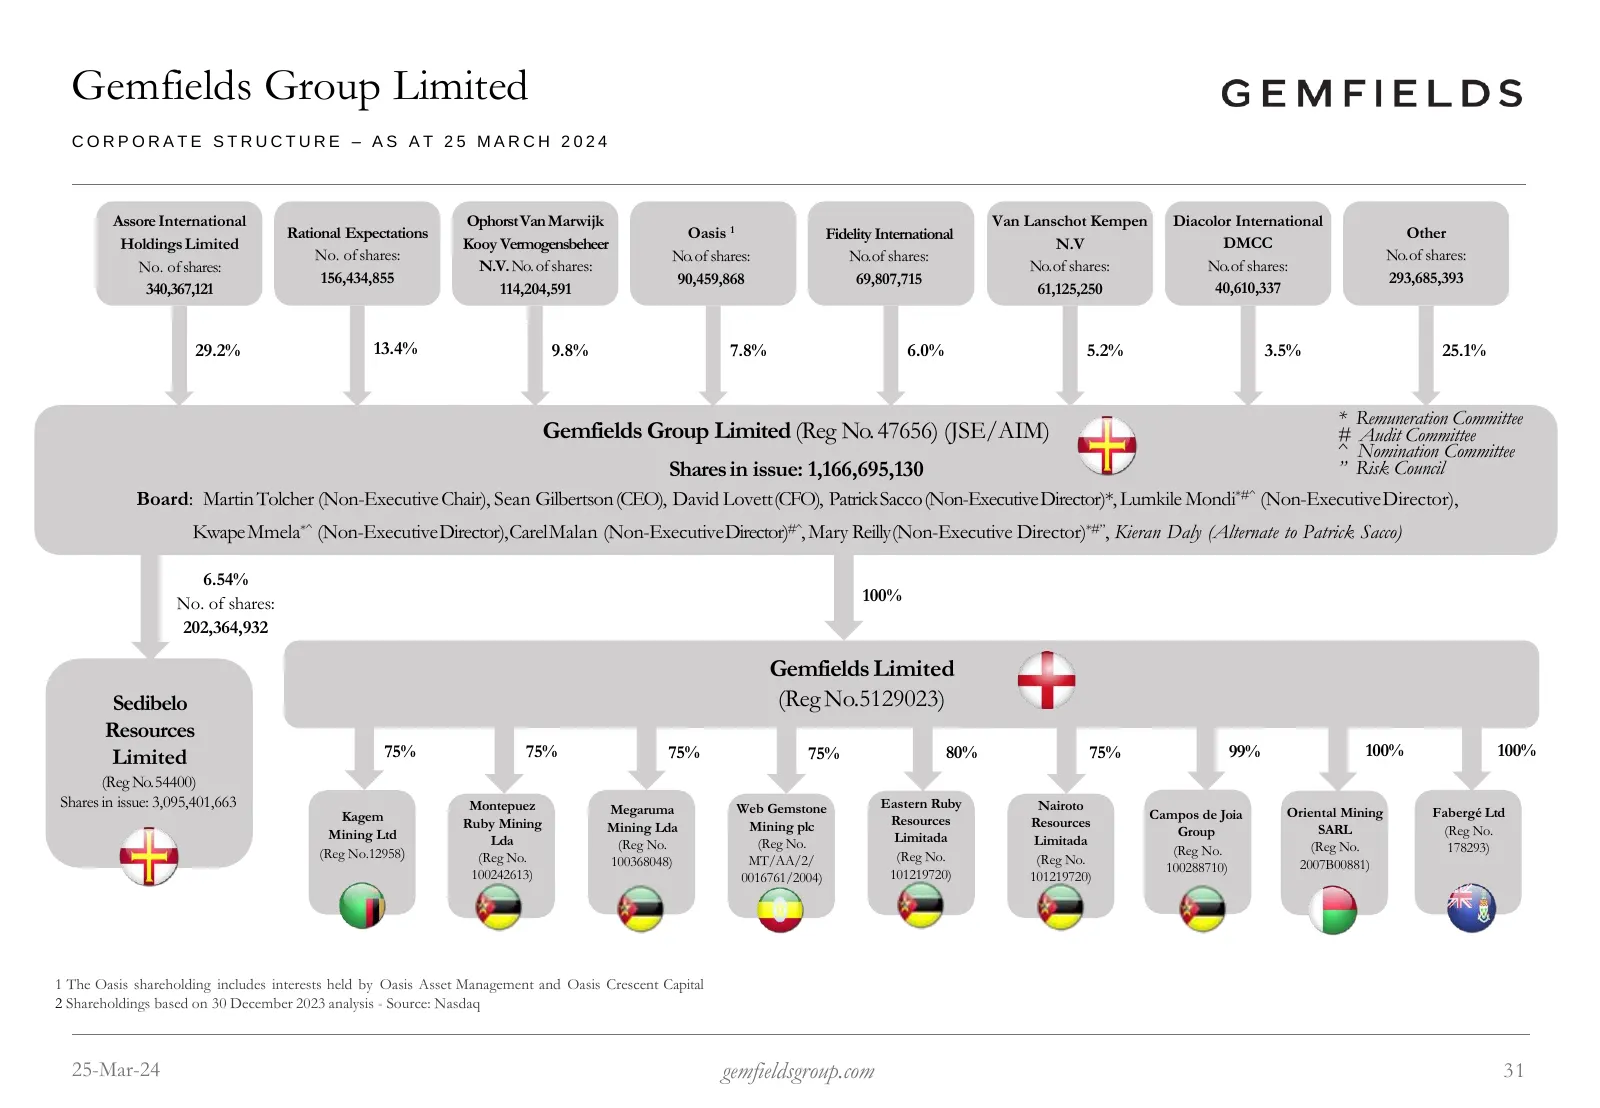
Gemfields Group Limited CORPORATE STRUCTURE – AS AT 25 MARCH 2024 Assore International Ophorst Van Marwijk Van Lanschot Kempen Diacolor International Rational Expectations Oasis 1 Fidelity International Other Holdings Limited Kooy Vermogensbeheer N.V DMCC No. of shares: No.of shares: No.of shares: N
Slide 32: Who We Are
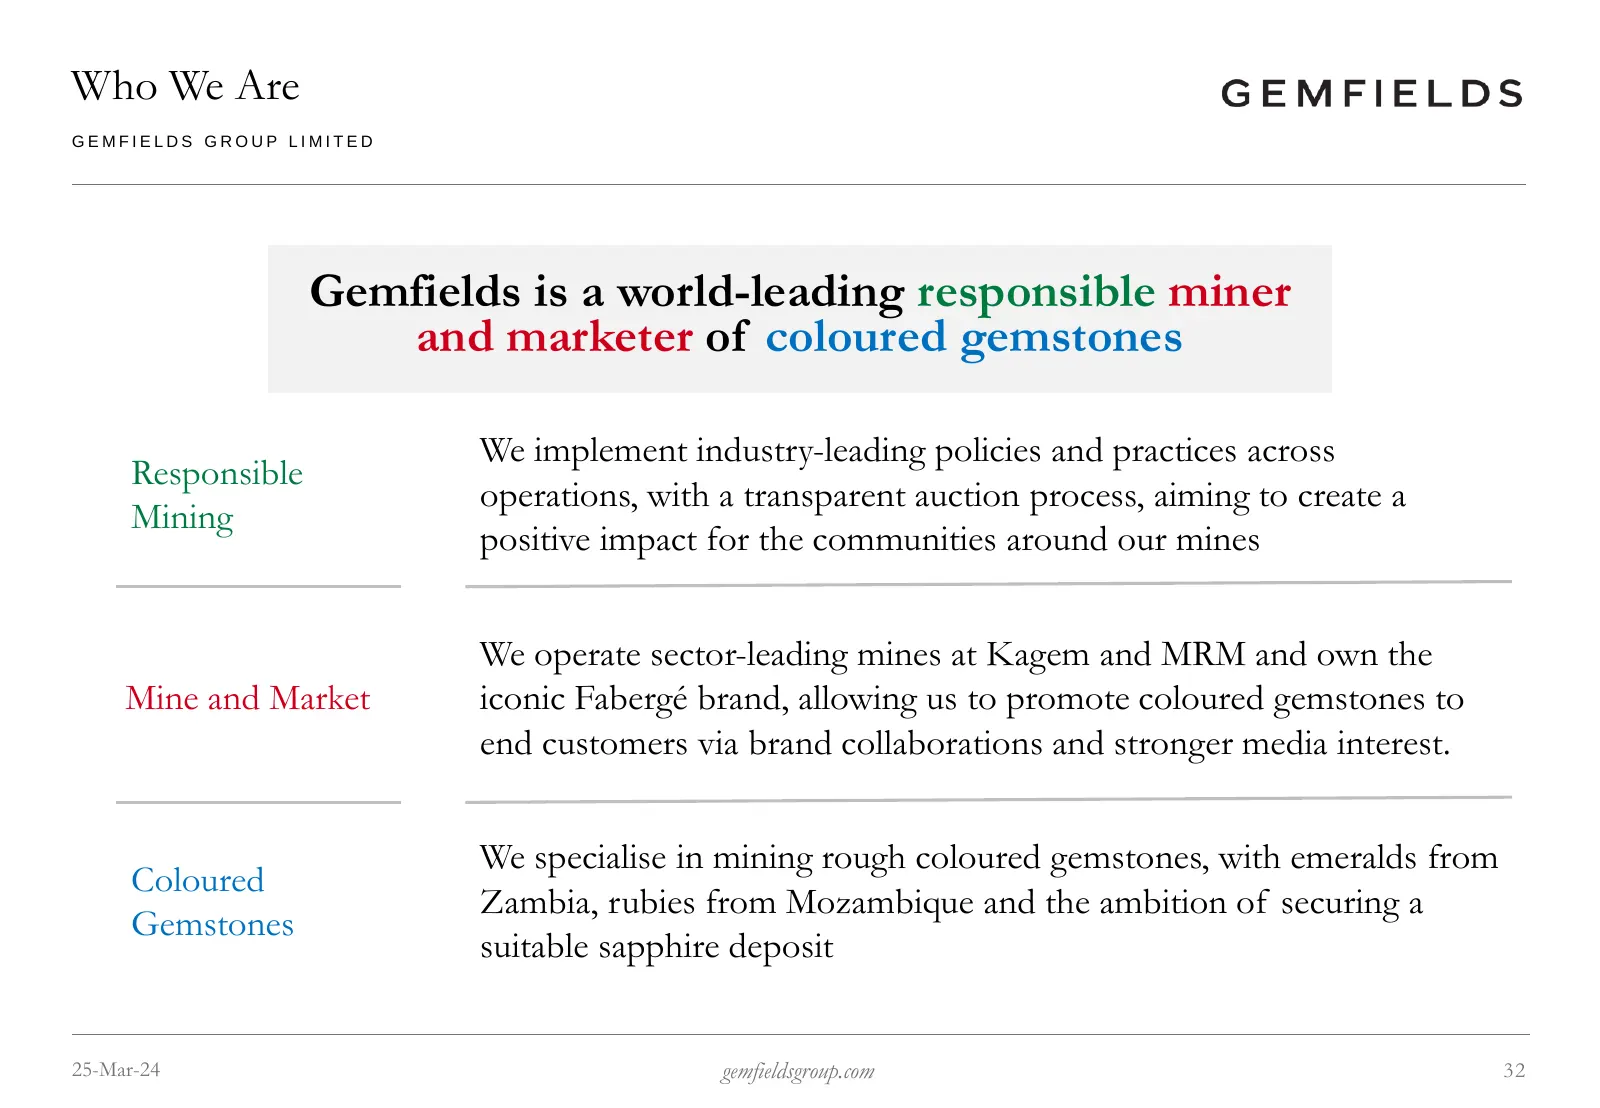
Who We Are GEMFIELDS GROUP LIMITED Gemfields is a world-leading responsible miner and marketer of coloured gemstones We implement industry-leading policies and practices across Responsible operations, with a transparent auction process, aiming to create a Mining positive impact for the communities a
Slide 33: Key Assets – Kagem and MRM
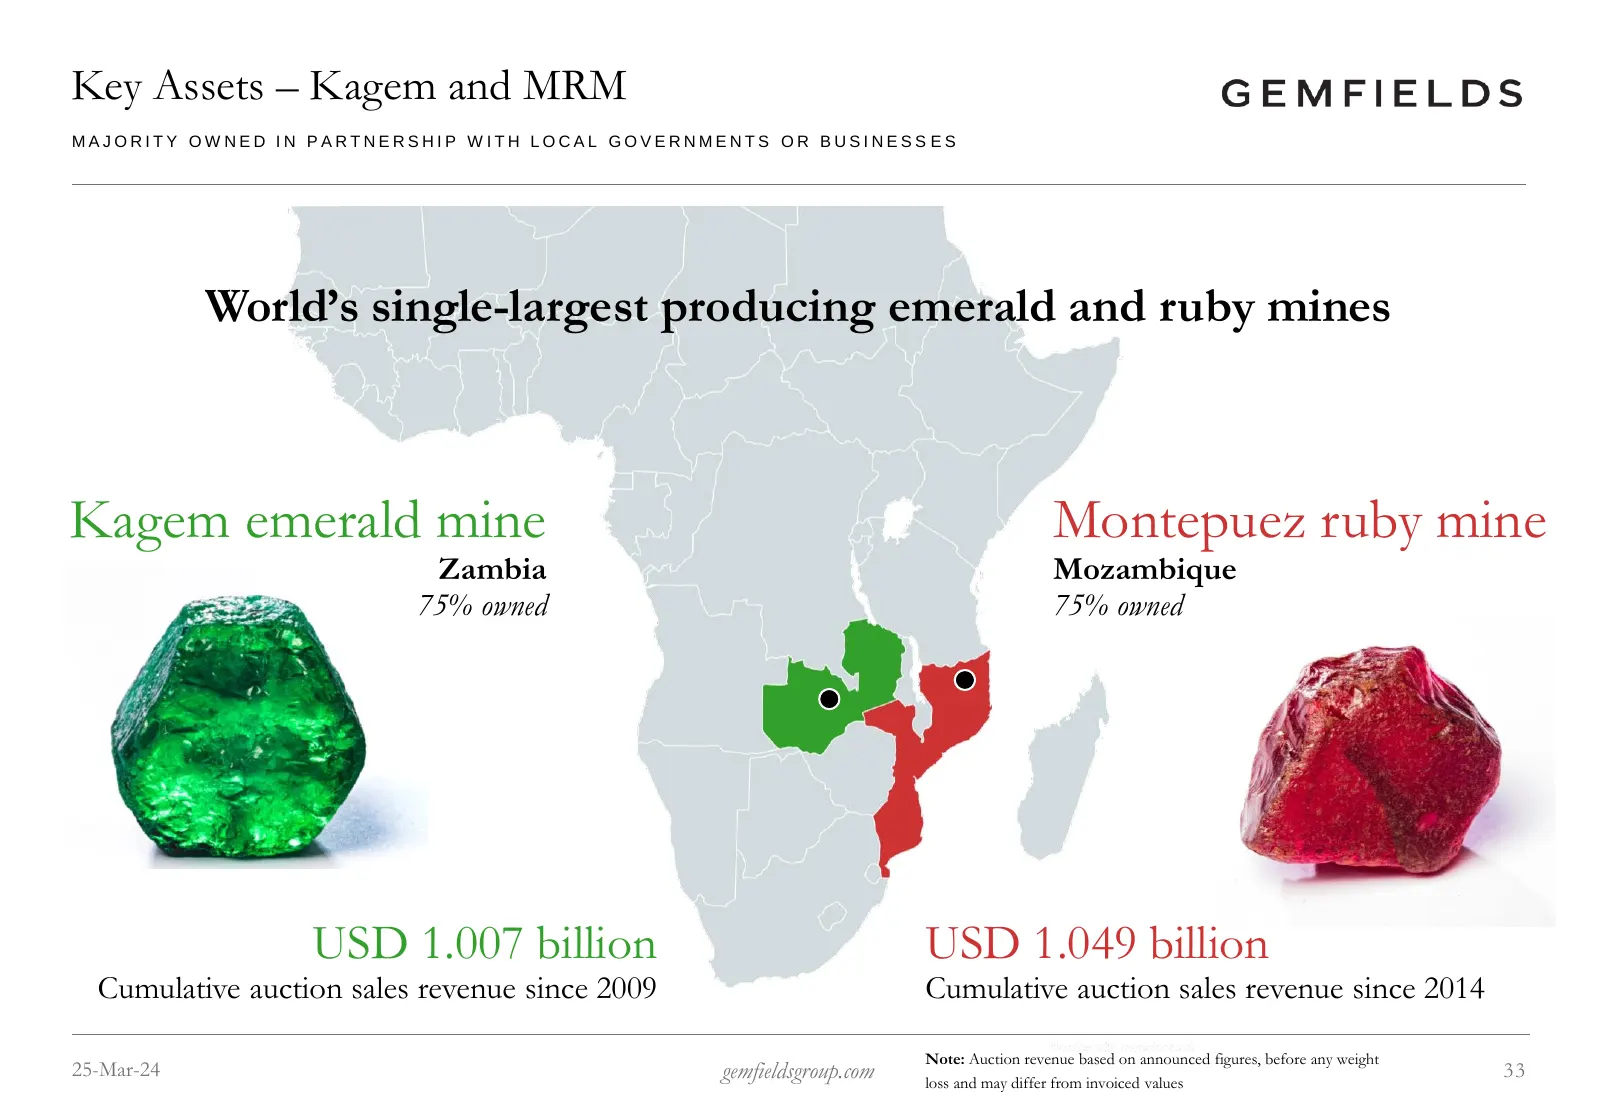
Key Assets – Kagem and MRM MAJORITY OWNED IN PARTNERSHIP WITH LOCAL GOVERNMENTS OR BUSINESS ES World’s single-largest producing emerald and ruby mines Kagem emerald mine Montepuez ruby mine Zambia Mozambique 75% owned 75% owned USD 1.007 billion USD 1.049 billion Cumulative auction sales revenue sin
Slide 34: Coloured Gemstone Market
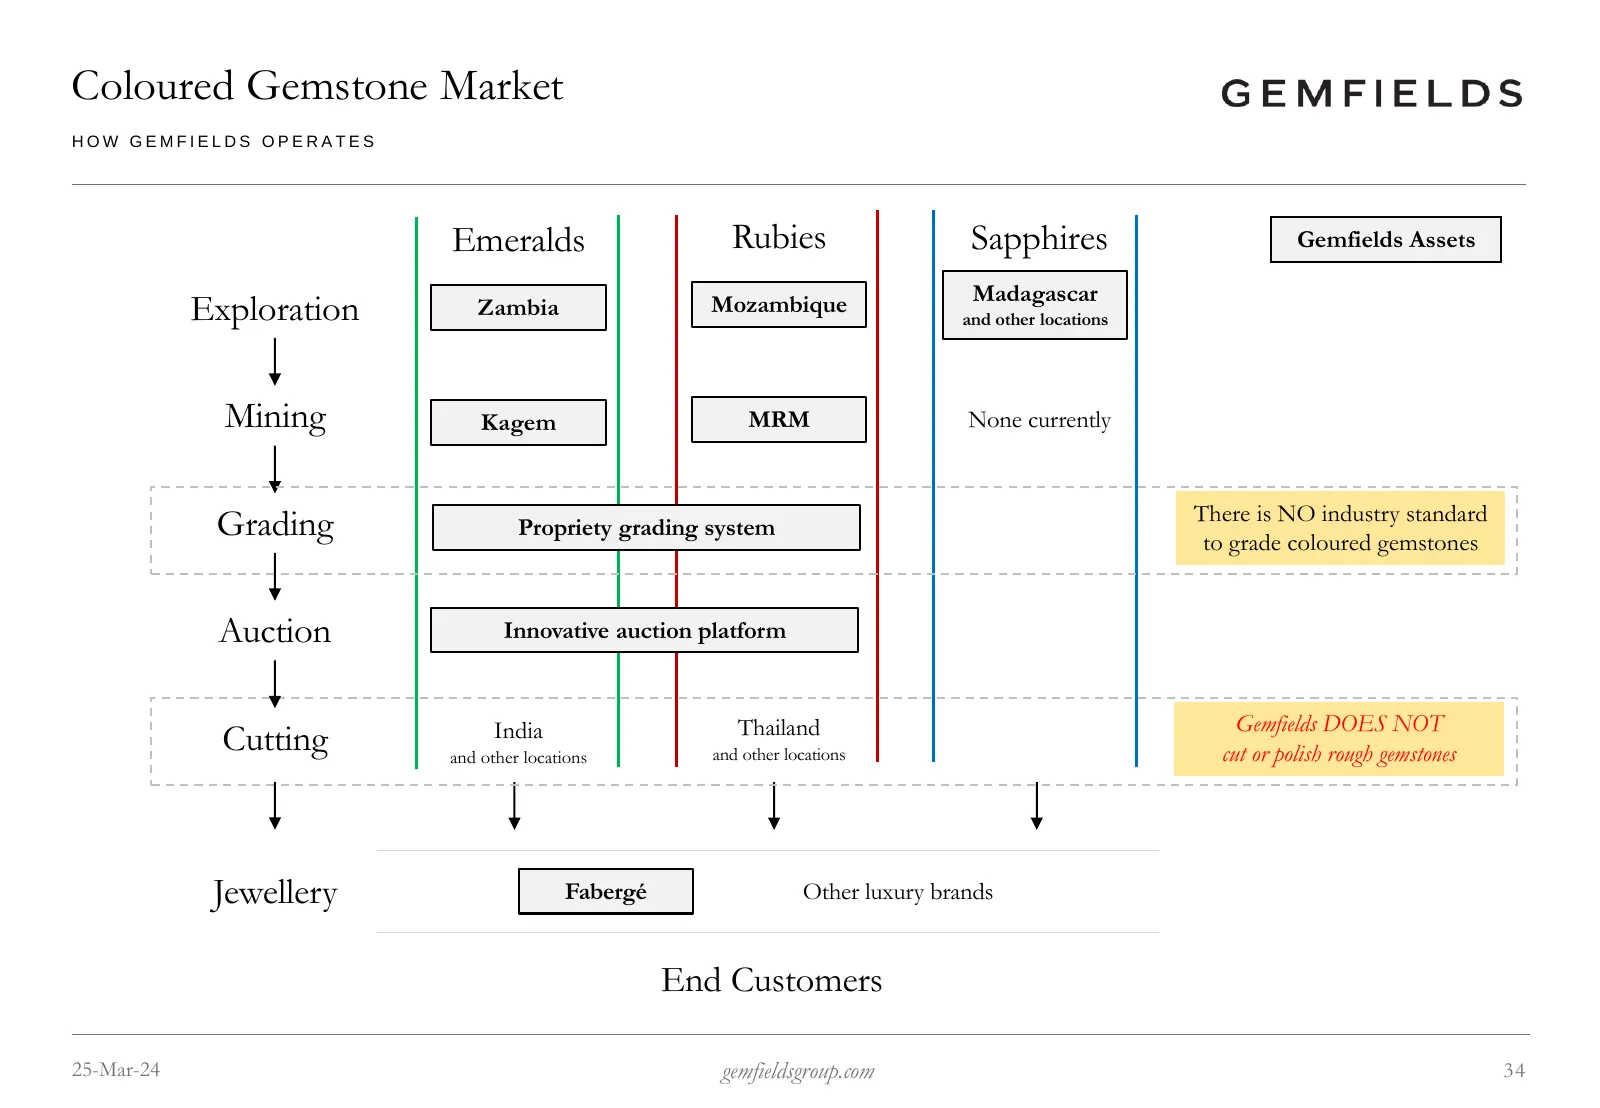
Coloured Gemstone Market HOW GEMFIELDS OPERATES Emeralds Rubies Sapphires Gemfields Assets Madagascar Exploration Zambia Mozambique and other locations Mining Kagem MRM None currently There is NO industry standard Grading Propriety grading system to grade coloured gemstones Auction Innovative auctio
Slide 35: 2023 Production Summary
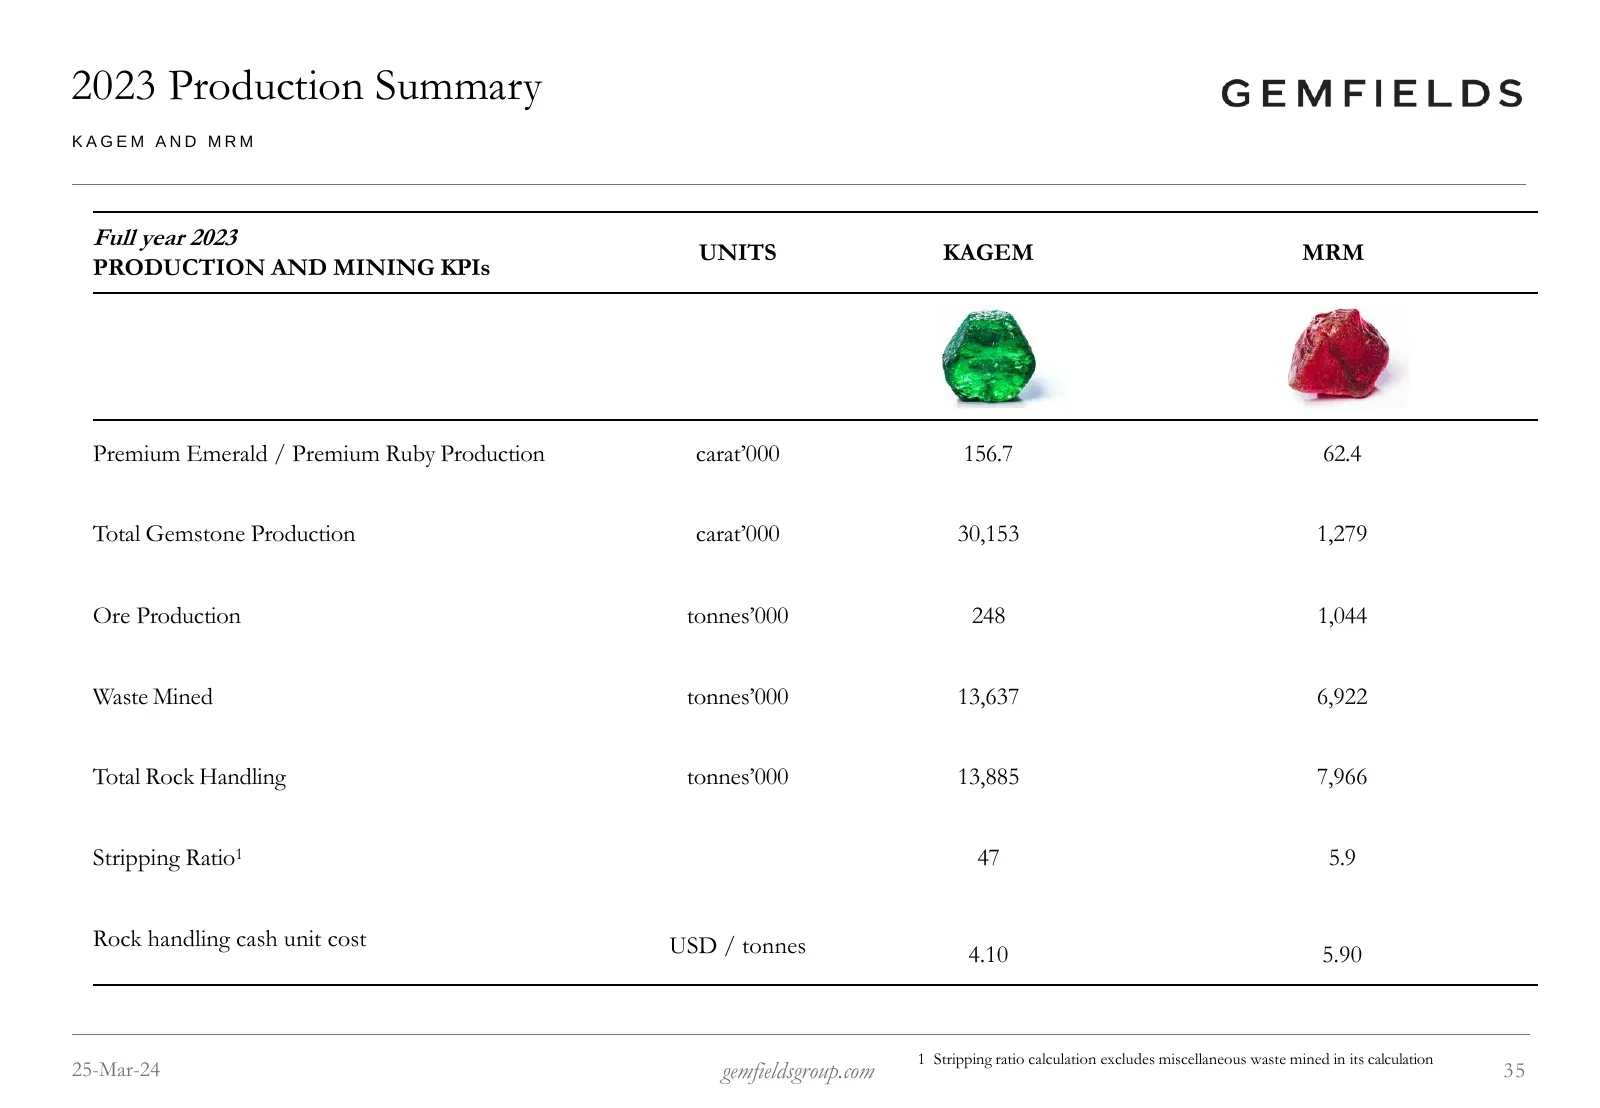
2023 Production Summary KAGEM AND MRM Full year 2023 UNITS KAGEM MRM PRODUCTION AND MINING KPIs Premium Emerald / Premium Ruby Production carat’000 156.7 62.4 Total Gemstone Production carat’000 30,153 1,279 Ore Production tonnes’000 248 1,044 Waste Mined tonnes’000 13,637 6,922 Total Rock Handling
Slide 36: Competent Persons Reports
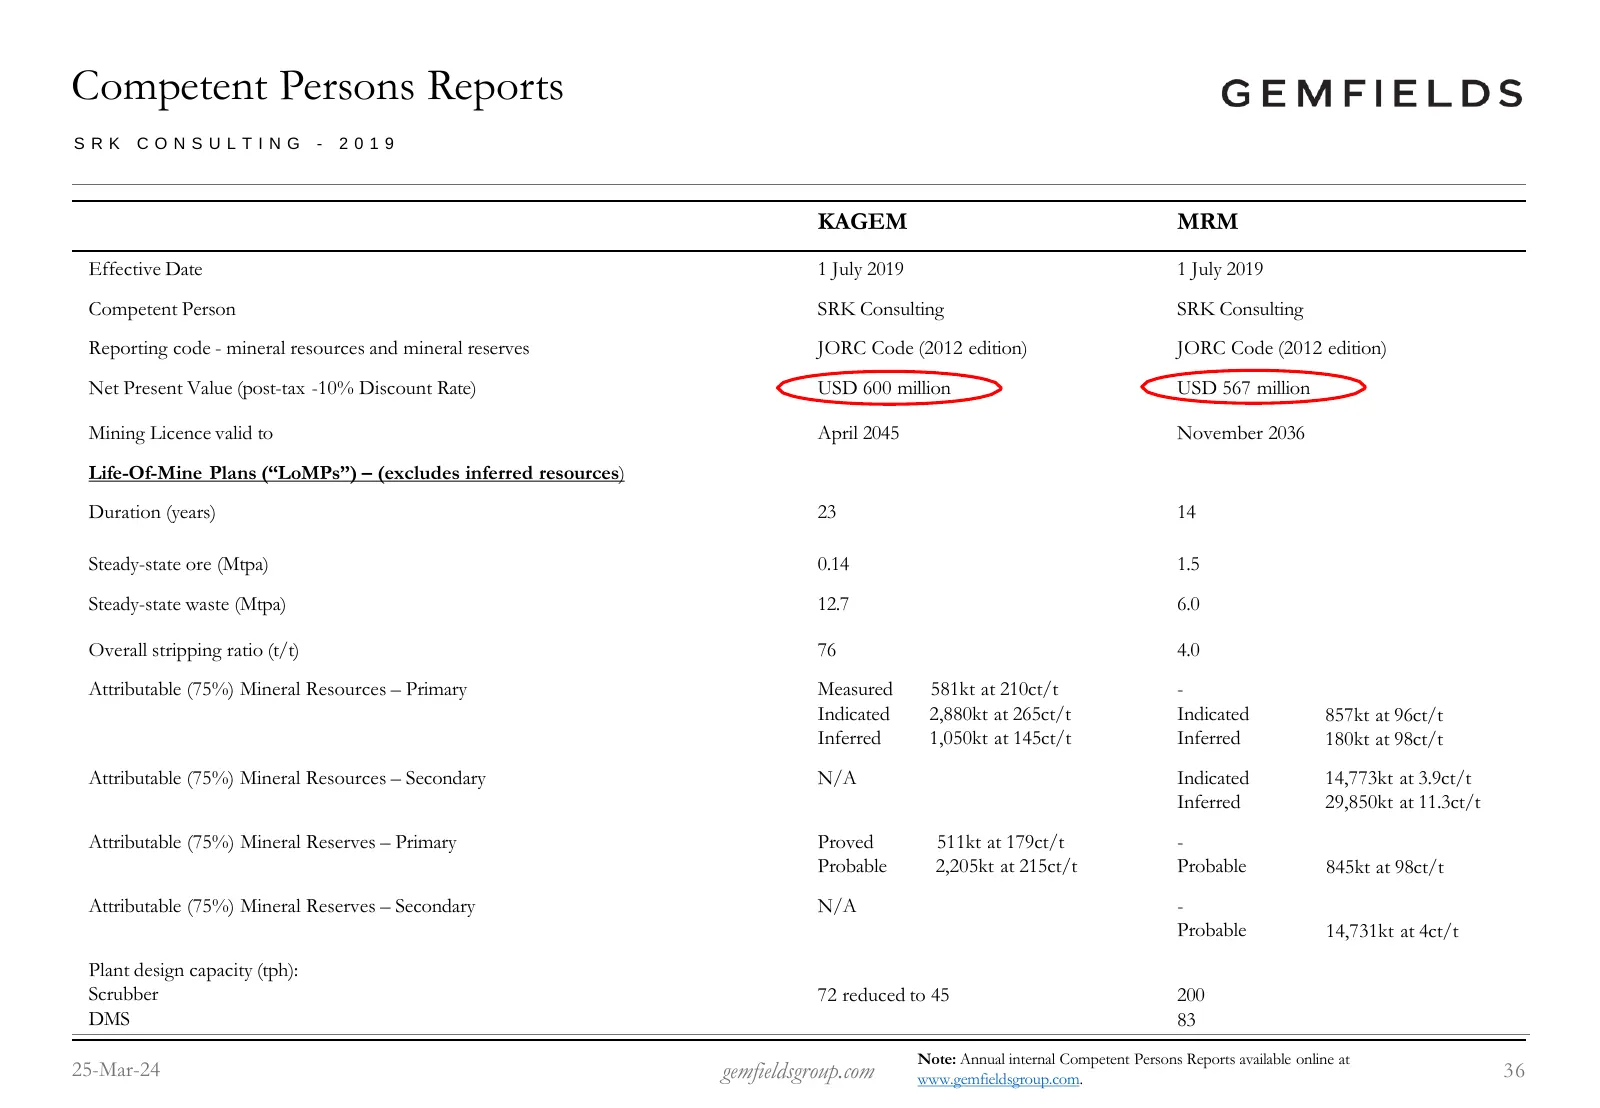
Competent Persons Reports SRK CONSULTING - 2019 KAGEM MRM Effective Date 1 July 2019 1 July 2019 Competent Person SRK Consulting SRK Consulting Reporting code - mineral resources and mineral reserves JORC Code (2012 edition) JORC Code (2012 edition) Net Present Value (post-tax -10% Discount Rate) US
Slide 37: 1 CATHEDRAL PI AZZA LONDON SW1E 5BP UNITED KINGDOM
1 CATHEDRAL PI AZZA LONDON SW1E 5BP UNITED KINGDOM T +44 20 7518 3419
Source: Internet Archive copy of gemfieldsgroup.com
More decks from Gemfields Group Limited
 FY2025 Earnings Presentation26 slides · Mar 26, 2026
 H1 2025 Earnings Presentation74 slides · Sep 26, 2025
 FY2024 Earnings Presentation30 slides · Apr 11, 2025
 Investor Presentation (November 2024)39 slides · November 2024
 FY2022 Earnings Presentation71 slides · Mar 24, 2023
 FY2021 Earnings Presentation68 slides · Mar 25, 2022