Plains Exploration & Production Company
Plains Exploration & Production — Investor Day (October 2004)
189 slides from Plains Exploration & Production's investor day presentation, Oct 5, 2004
Slide 1: Plains Exploration & Production Company
PLAINS EXPLORATION & PRODUCTION COMPANY James C. Flores Chairman, President and Chief Executive Officer NYSE:PXP www.plainsxp.com
Slide 2: Presentation Agenda
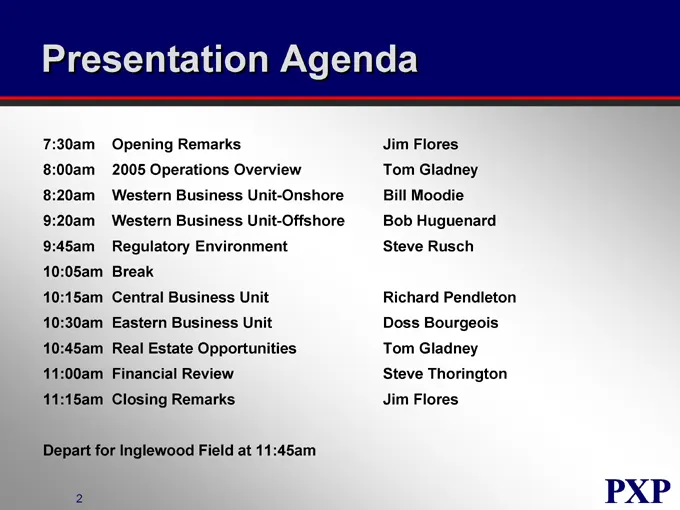
Presentation Agenda 7:30am Opening Remarks Jim Flores 8:00am 2005 Operations Overview Tom Gladney 8:20am Western Business Unit-Onshore Bill Moodie 9:20am Western Business Unit-Offshore Bob Huguenard 9:45am Regulatory Environment Steve Rusch 10:05am Break 10:15am Central Business Unit Richard Pendlet
Slide 3: Forward Looking Statements
Forward Looking Statements Except for the historical information contained herein, the matters discussed in this presentation are forward-looking statements that involve certain assumptions and known and unknown risks, uncertainties and other factors that could cause our actual results to differ mat
Slide 4: PXP Strategy
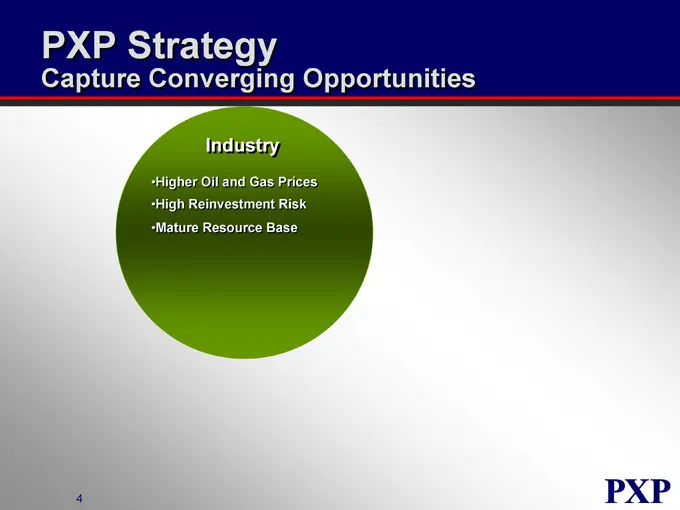
PXP Strategy Capture Converging Opportunities Industry Higher Oil and Gas Prices High Reinvestment Risk Mature Resource Base
Slide 5: PXP Strategy
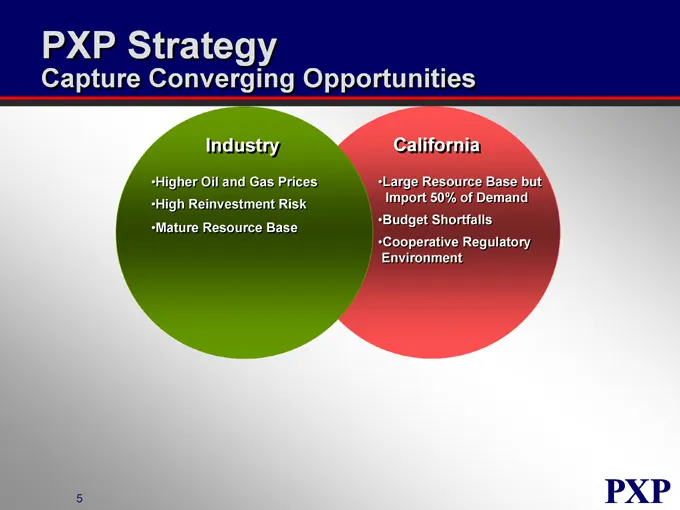
PXP Strategy Capture Converging Opportunities Industry Higher Oil and Gas Prices High Reinvestment Risk Mature Resource Base California Large Resource Base but Import 50% of Demand Budget Shortfalls Cooperative Regulatory Environment
Slide 6: PXP Strategy
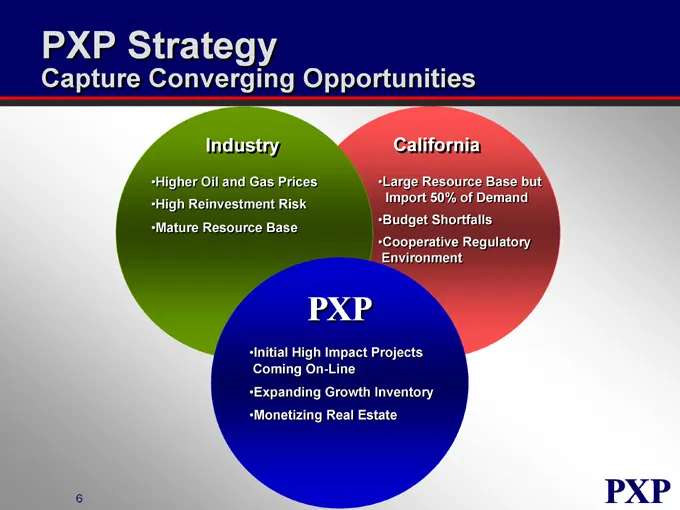
PXP Strategy Capture Converging Opportunities Industry Higher Oil and Gas Prices High Reinvestment Risk Mature Resource Base California Large Resource Base but Import 50% of Demand Budget Shortfalls Cooperative Regulatory Environment Initial High Impact Projects Coming On-Line Expanding Growth Inven
Slide 7: History
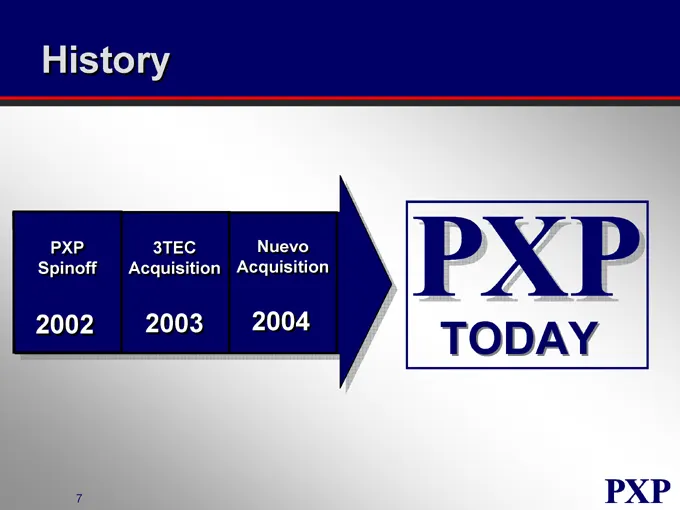
History PXP Spinoff 3TEC Acquisition Nuevo Acquisition
Slide 8: Reserve and Production Growth
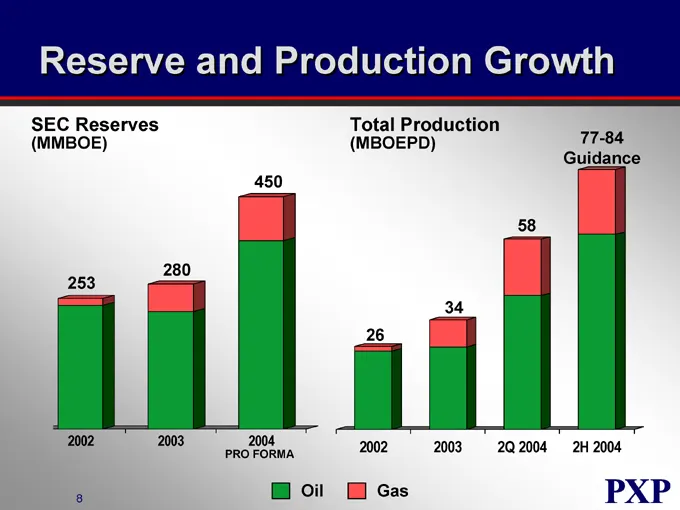
Reserve and Production Growth SEC Reserves (MMBOE) Total Production (MBOEPD) 77-84 Guidance 2002 2003 2004 PRO FORMA 2002 2003 2Q 2004 2H 2004 Oil Gas
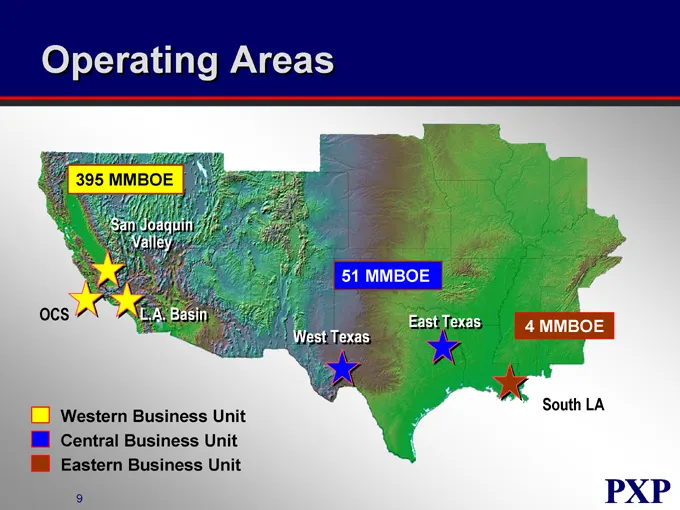
Slide 9: Operating Areas MMBOE
Operating Areas 395 MMBOE San Joaquin Valley OCS L.A. Basin 51 MMBOE West Texas East Texas 4 MMBOE South LA Western Business Unit Central Business Unit Eastern Business Unit
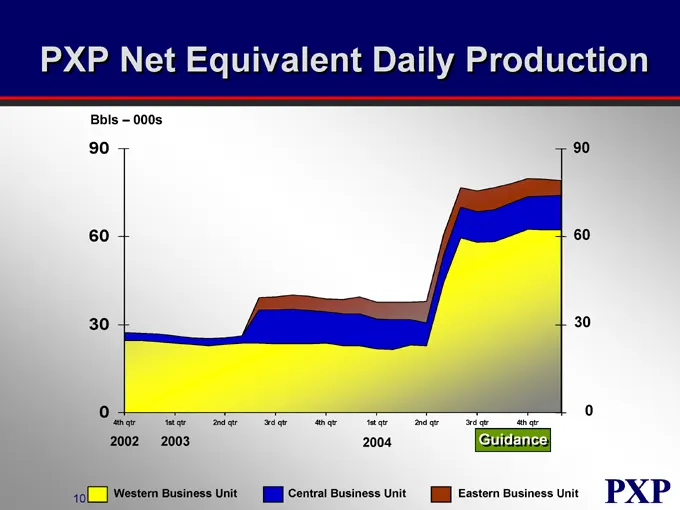
Slide 10: PXP Net Equivalent Daily Production
PXP Net Equivalent Daily Production Bbls – 000s 90 60 30 0 90 60 30 0 4th qtr 1st qtr 2nd qtr 3rd qtr 4th qtr 1st qtr 2nd qtr 3rd qtr 4th qtr 2002 2003 2004 Guidance Western Business Unit Central Business Unit Eastern Business Unit
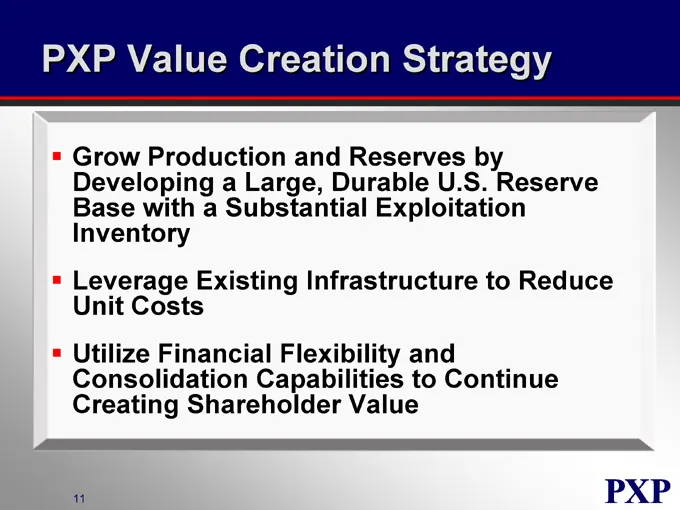
Slide 11: PXP Value Creation Strategy
PXP Value Creation Strategy Grow Production and Reserves by Developing a Large, Durable U.S. Reserve Base with a Substantial Exploitation Inventory Leverage Existing Infrastructure to Reduce Unit Costs Utilize Financial Flexibility and Consolidation Capabilities to Continue Creating Shareholder Valu
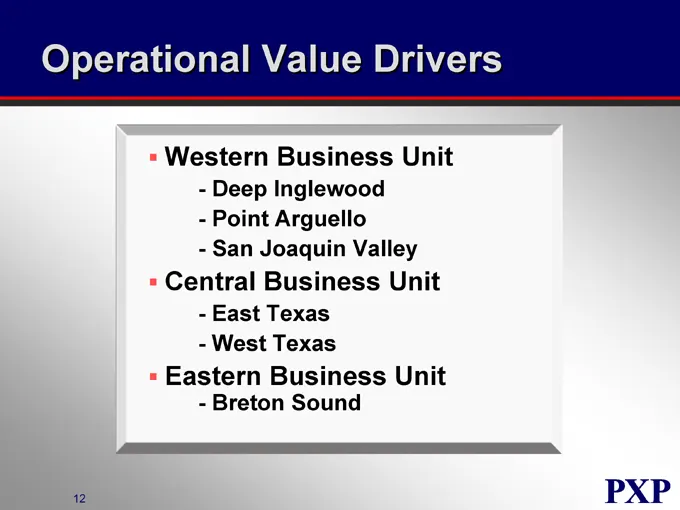
Slide 12: Operational Value Drivers
Operational Value Drivers Western Business Unit Deep Inglewood Point Arguello San Joaquin Valley Central Business Unit East Texas West Texas Eastern Business Unit Breton Sound
Slide 13: Strategic Growth Initiatives
Strategic Growth Initiatives Tranquillon Ridge Gulf of Mexico Exploration Leverage Core Competencies With Targeted Asset Acquisitions
Slide 14: PXP Value Creation Strategy
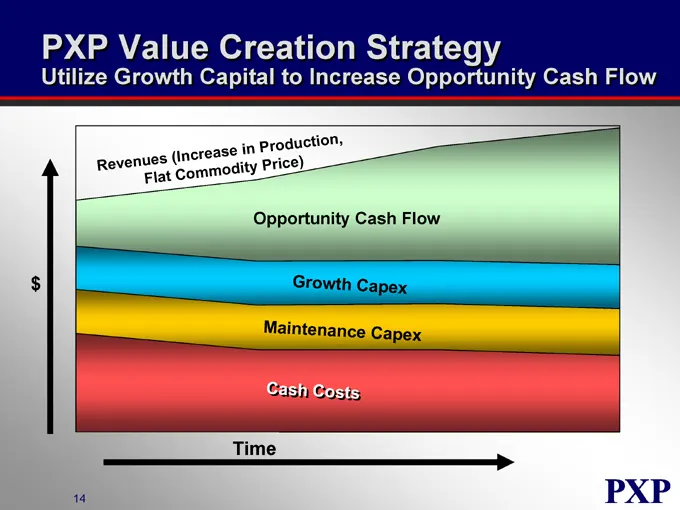
PXP Value Creation Strategy Utilize Growth Capital to Increase Opportunity Cash Flow Revenues (increase in Production, Flat Commodity price) Opportunity Cash Flow Growth Capex Maintenance Capex Cash Cost
Slide 15: 2004 Year-to-Date
2004 Year-to-Date Record Production and Cash Flow Nuevo Integration Better Than Expected Operational Synergies –Cost Savings –Accounting Integration –Debt Refinancing Drilled 85 Wells with 95% Success 100% Deep Inglewood –100% San Joaquin Valley –100% East Texas 65% Breton Sound
Slide 16: Positioned for the Future
Positioned for the Future Large Durable Reserve Base with 16 Year R/P Multi-Year Inventory of High Impact, Low Risk Exploitation Drilling Opportunities Improved Financial Flexibility
Slide 17: Plains Exploration & Production Company
PLAINS EXPLORATION & PRODUCTION COMPANY NYSE:PXP www.plainsxp.com
Slide 18: 2005 Operations Overview
PLAINS EXPLORATION & PRODUCTION COMPANY 2005 Operations Overview Tom Gladney Executive Vice President Exploration and Production NYSE : PXP www.plainsxp.com
Slide 19: PXP Operations
PXP Operations Organized by Business Units Assets in Core Areas with High Return Growth Potential Ability to Improve Margins Always Staying Focused on Safety and Environmental Compliance
Slide 20: Property Sales
Property Sales Sale of Non Core Offshore California Higher Cost Assets; Opportunities Insufficient to Change High Cost Character Buyer Responsible for Well P&A, PXP for Platform Removal (About 40/60 Split) South Texas/New Mexico Sales Mature, Scattered, and Small Remaining Properties High Potential,
Slide 21: 2005+ Plan Objectives
2005+ Plan Objectives Allocate Capital Competitively Consider Projects Without Oil vs. Gas or Geographical Bias Plan for Efficient Execution Expand Inventory of Value Creation Projects Re-Deploy and Re-Adjust During the Year
Slide 22: Western Business Unit Offshore
Western Business Unit Offshore Continued Drilling of Rocky Point Structure Through-Out 2005 and Into 2006 Benefit From the Learning Curve Permit and Plan for Similar Extended Reach Opportunities Maintain and Improve Unique High Capacity Infra-Structure
Slide 23: Western Business Unit Onshore, Los Angeles Basin
Western Business Unit Onshore, Los Angeles Basin Drill Inglewood Deep Through-Out 2005 and Into 2006 Including Exploitation of “Shallow” Deep Zones and the Vickers-Rindge Waterflood Continue to Refine Technology and Costs
Slide 24: Western Business Unit Onshore, San Joaquin Valley
Western Business Unit Onshore, San Joaquin Valley Significantly Ramp Up Program and Drill About 10% of 1600+ Well Inventory Develop Identified New Zones/Areas Continue Investments in New Technology Test New Zones and Geologic Features for Future Expansion Expand and Improve Facility Capacity as Need
Slide 25: Eastern Business Unit
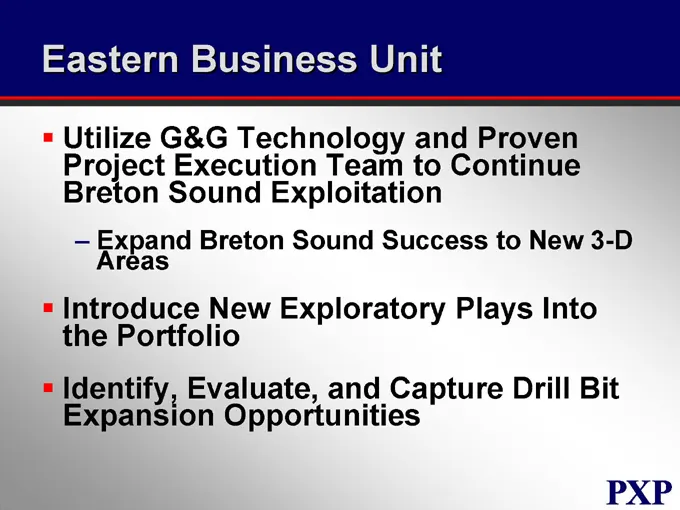
Eastern Business Unit Utilize G&G Technology and Proven Project Execution Team to Continue Breton Sound Exploitation Expand Breton Sound Success to New 3-D Areas Introduce New Exploratory Plays Into the Portfolio Identify, Evaluate, and Capture Drill Bit Expansion Opportunities
Slide 26: Central Business Unit
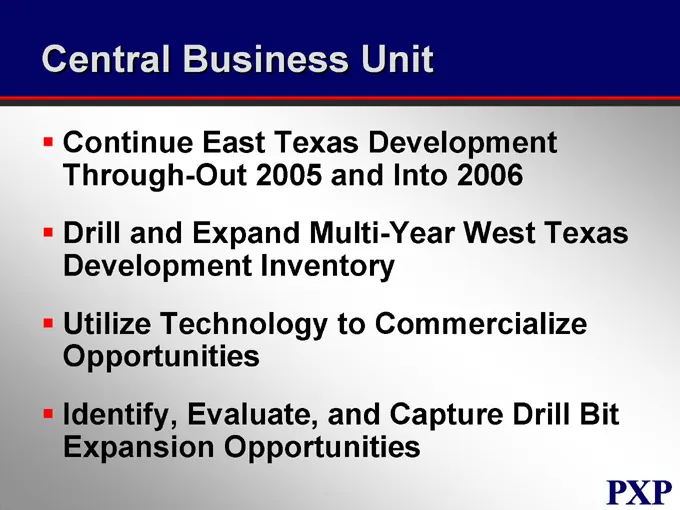
Central Business Unit Continue East Texas Development Through-Out 2005 and Into 2006 Drill and Expand Multi-Year West Texas Development Inventory Utilize Technology to Commercialize Opportunities Identify, Evaluate, and Capture Drill Bit Expansion Opportunities
Slide 27: Operational Capital Forecast by Business Unit
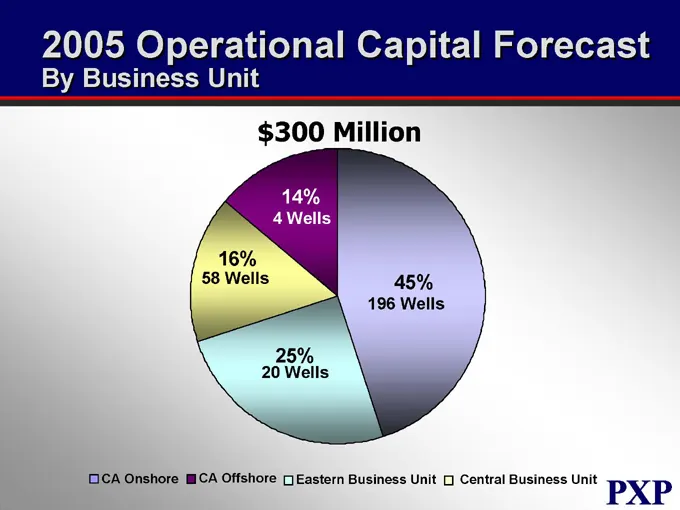
Operational Capital Forecast By Business Unit $300 Million 14% 4 Wells 16% 58 Wells 25% 20 Wells 45% 196 Wells CA Onshore CA Offshore Eastern Business Unit Central Business Unit
Slide 28: Operational Capital Forecast by Type
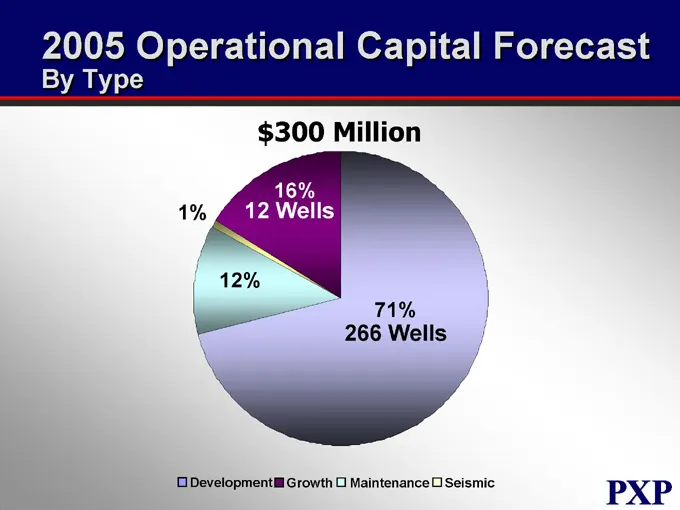
Operational Capital Forecast By Type $300 Million 1% 16% 12 Wells 12% 71% 266 Wells Development Growth Maintenance Seismic
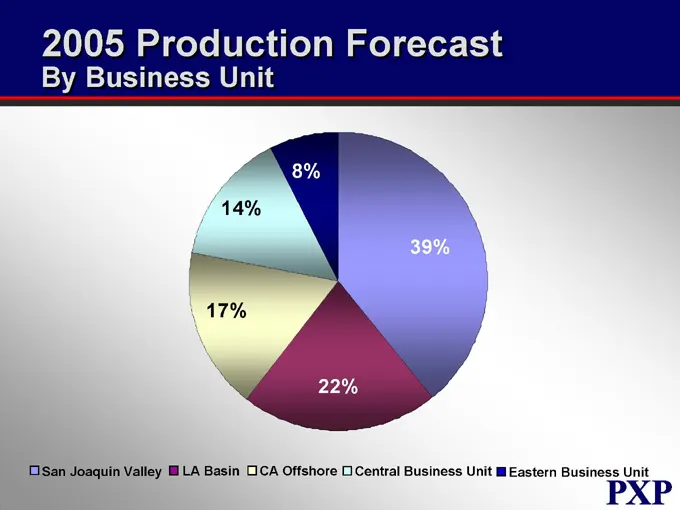
Slide 29: Production Forecast by Business Unit
Production Forecast By Business Unit 8% 14% 17% 22% 39% San Joaquin Valley LA Basin CA Offshore Central Business Unit Eastern Business Unit
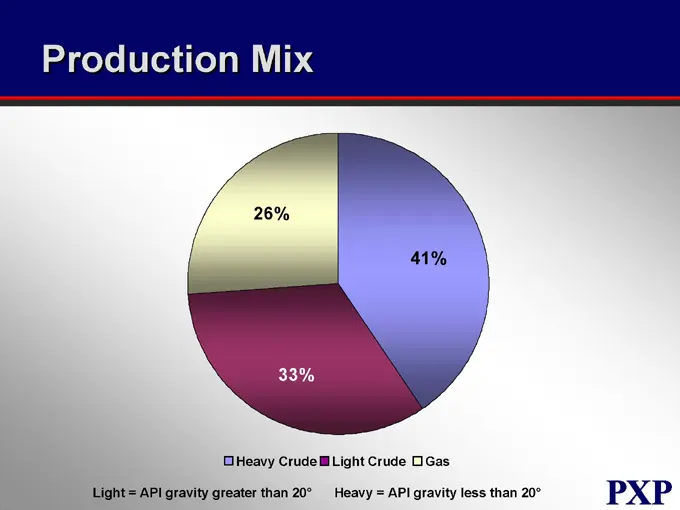
Slide 30: Production Mix
Production Mix 26% 33% 41% Heavy Crude Light Crude Gas Light = API gravity greater than 20° Heavy = API gravity less than 20°
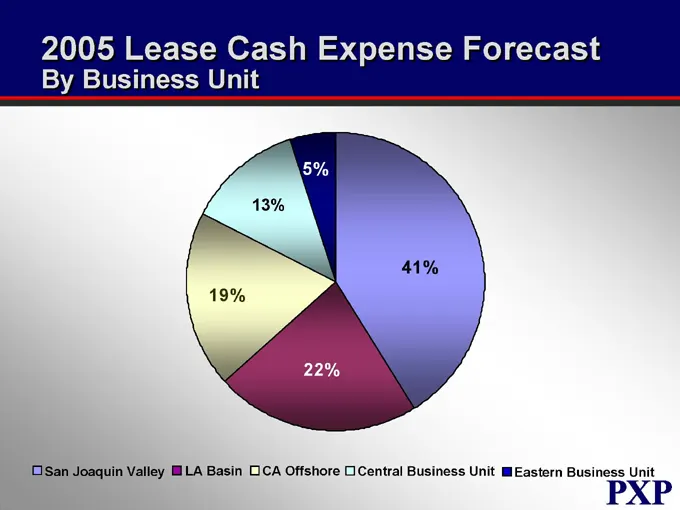
Slide 31: 2005 Lease Cash Expense Forecast
2005 Lease Cash Expense Forecast By Business Unit 5% 13% 19% 22% 41% San Joaquin Valley LA Basin CA Offshore Central Business Unit Eastern Business Unit
Slide 32: Plains Exploration & Production Company
PLAINS EXPLORATION & PRODUCTIONCOMPANY NYSE:PXP www.plainsxp.com
Slide 33: Western Business Unit Onshore California
PLAINS EXPLORATION & PRODUCTION COMPANY Western Business Unit Onshore California Bill Moodie Vice President NYSE : PXP www.plainsxp.com
Slide 34: Onshore California - Who We Are
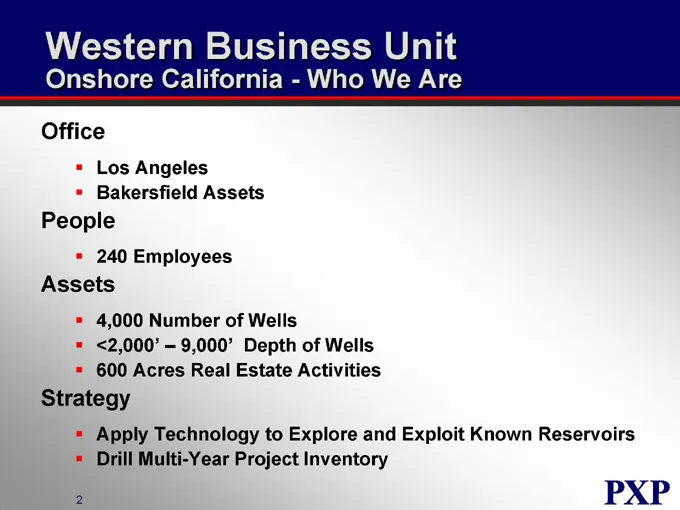
Western Business Unit Onshore California - Who We Are Office Los Angeles Bakersfield Assets People Employees Assets 4,000 Number of Wells <2,000’ – 9,000’ Depth of Wells 600 Acres Real Estate Activities Strategy Apply Technology to Explore and Exploit Known Reservoirs Drill Multi-Year Project Invent
Slide 35: Onshore Production and Reserves
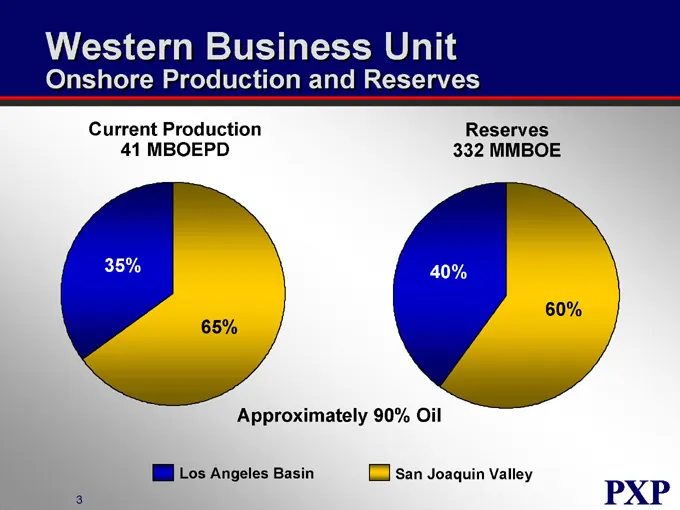
Western Business Unit Onshore Production and Reserves Current Production 41 MBOEPD Reserves 332 MMBOE 35% 65% 40% 60% Approximately 90% Oil Los Angeles Basin San Joaquin Valley
Slide 36: Onshore Operating Areas
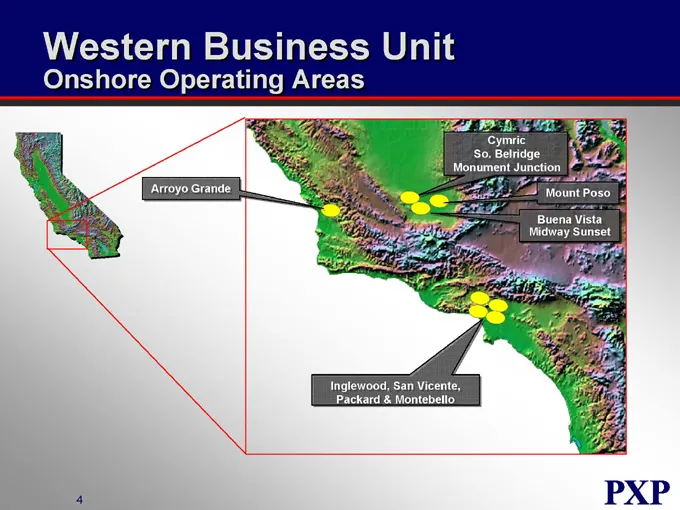
Western Business Unit Onshore Operating Areas Arroyo Grande Cymric So. Belridge Monument Junction Mount Poso Buena Vista Midway Sunset Inglewood, San Vicente, Packard & Montebello
Slide 37: A Tale of Two Basins
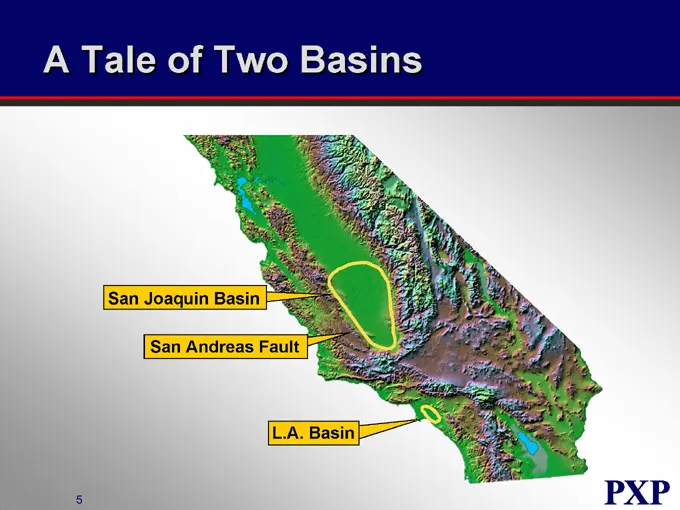
A Tale of Two Basins San Joaquin Basin San Andreas Fault L.A. Basin
Slide 38: Los Angeles Basin Cross Section
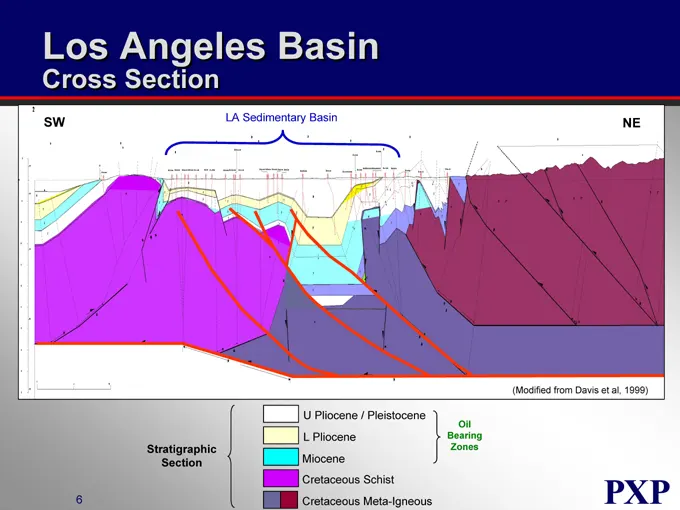
Los Angeles Basin Cross Section SW LA Sedimentary Basin NE (Modified from Davis et al, 1999) U Pliocene / Pleistocene L Pliocene Miocene Cretaceous Schist Cretaceous Meta-Igneous Stratigraphic Section Oil Bearing Zones
Slide 39: Los Angeles Basin Oil Field Complexity
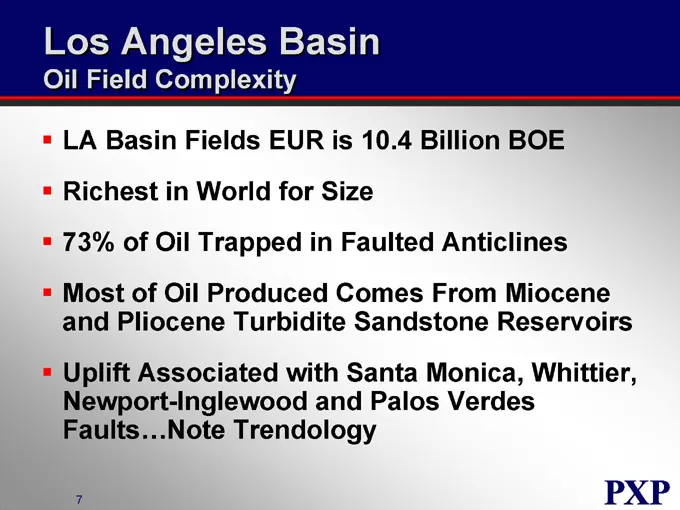
Los Angeles Basin Oil Field Complexity LA Basin Fields EUR is 10.4 Billion BOE Richest in World for Size 73% of Oil Trapped in Faulted Anticlines Most of Oil Produced Comes From Miocene and Pliocene Turbidite Sandstone Reservoirs Uplift Associated with Santa Monica, Whittier, Newport-Inglewood and P
Slide 40: Los Angeles Basin Fields
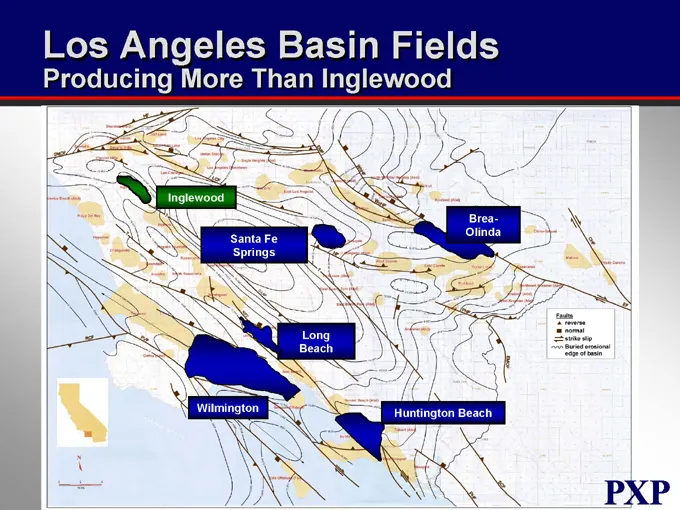
Los Angeles Basin Fields Producing More Than Inglewood Inglewood Brea-Olinda Santa Fe Springs Long Beach Wilmington Huntington Beach
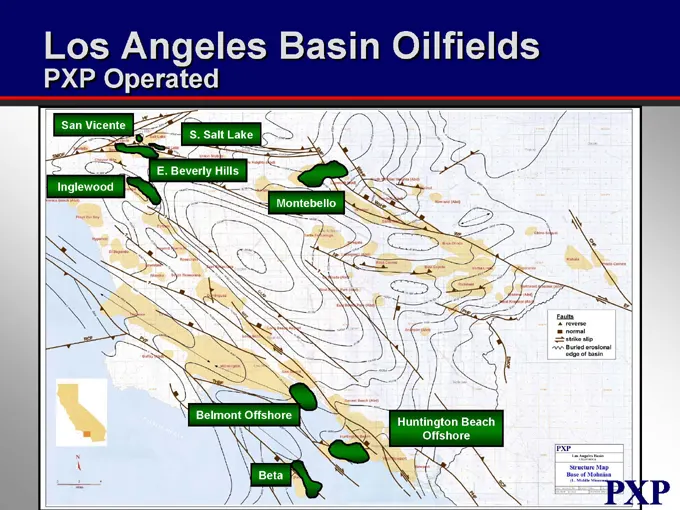
Slide 41: Los Angeles Basin Oilfields
Los Angeles Basin Oilfields PXP Operated San Vicente S. Salt Lake Inglewood E. Beverly Hills Montebello Belmont Offshore Huntington Beach Offshore Beta
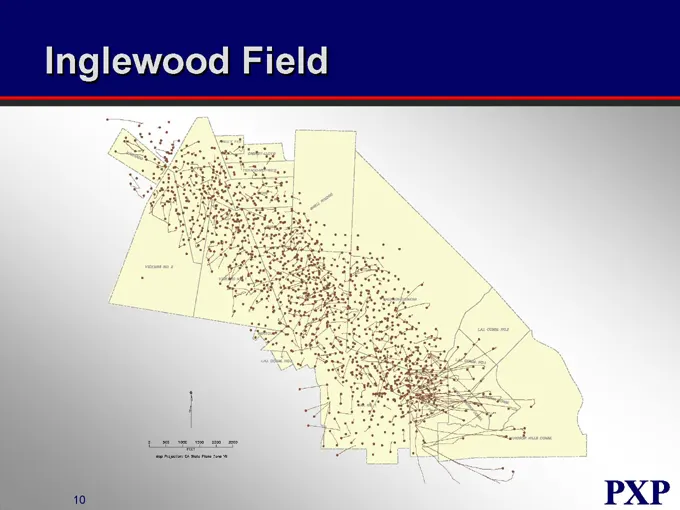
Slide 42: Inglewood Field
Inglewood Field a PXP
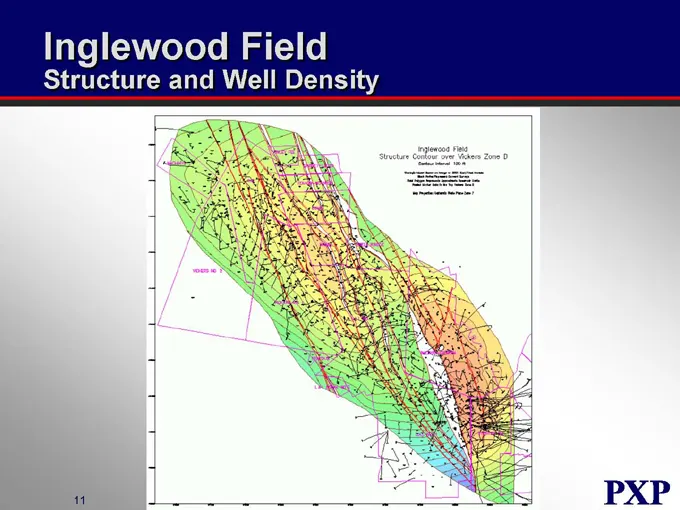
Slide 43: Inglewood Field Structure and Well Density
Inglewood Field Structure and Well Density
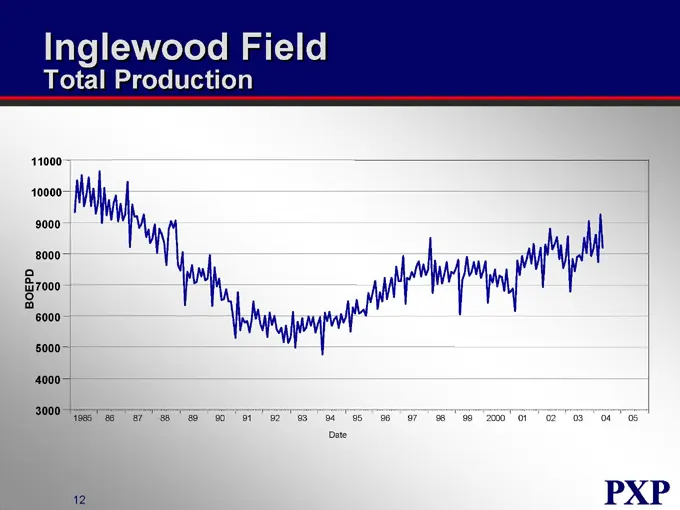
Slide 44: Inglewood Field Total Production
Inglewood Field Total Production BOEPD 11000 10000 9000 8000 7000 6000 5000 4000 3000 1985 86 87 88 89 90 91 92 93 94 95 96 97 98 99 2000 01 02 03 04 05 Date
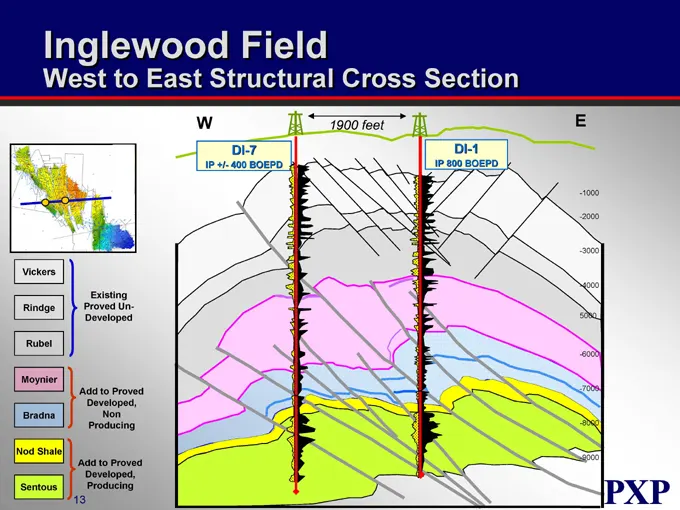
Slide 45: West to East Structural Cross Section
Inglewood Field West to East Structural Cross Section W 1900 feet DI-7 IP +/- 400 BOEPD DI-1 IP 800 BOEPD E Vickers Rindge Rubel Moynier Bradna Nod Shale Sentous Existing Proved UnDeveloped Add to Proved Developed, Non Producing Add to Proved Developed, Producing -1000 -2000 -3000 -4000 -6000 - -700
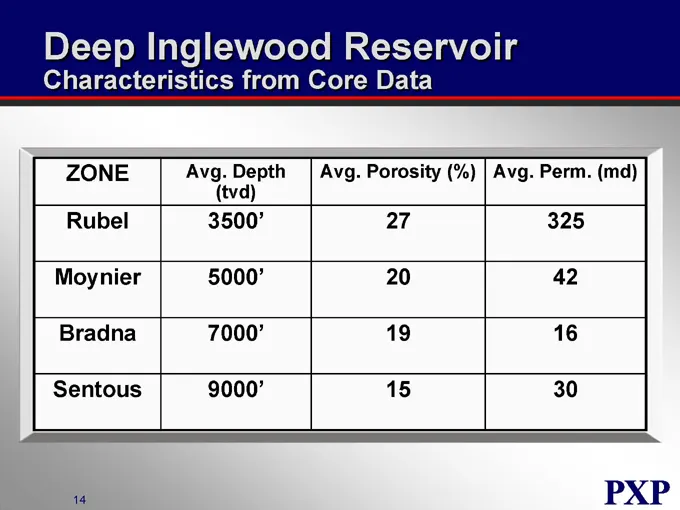
Slide 46: Deep Inglewood Reservoir Characteristics
Deep Inglewood Reservoir Characteristics from Core Data ZONE Avg. Depth Avg. Porosity (%) Avg. Perm. (md) (tvd) Rubel 3500’ 27 325 Moynier 5000’ 20 42 Bradna 7000’ 19 16 Sentous 9000’ 15 30
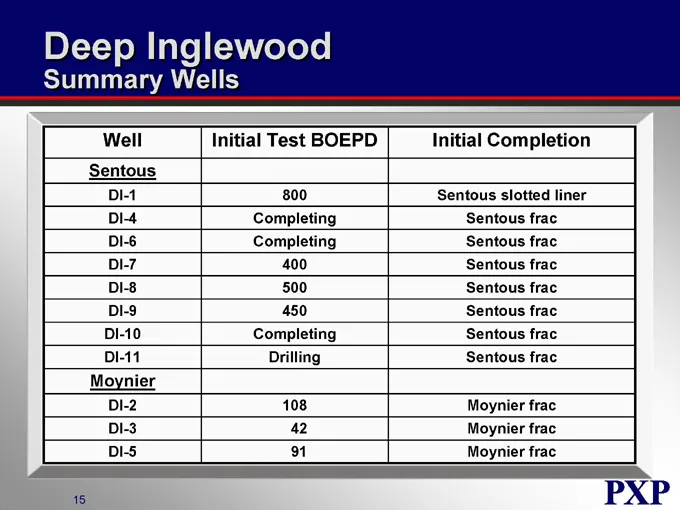
Slide 47: Deep Inglewood Summary Wells
Deep Inglewood Summary Wells Well Initial Test BOEPD Initial Completion Sentous DI-1 800 Sentous slotted liner DI-4 Completing Sentous frac DI-6 Completing Sentous frac DI-7 400 Sentous frac DI-8 500 Sentous frac DI-9 450 Sentous frac DI-10 Completing Sentous frac DI-11 Drilling Sentous frac Moynier
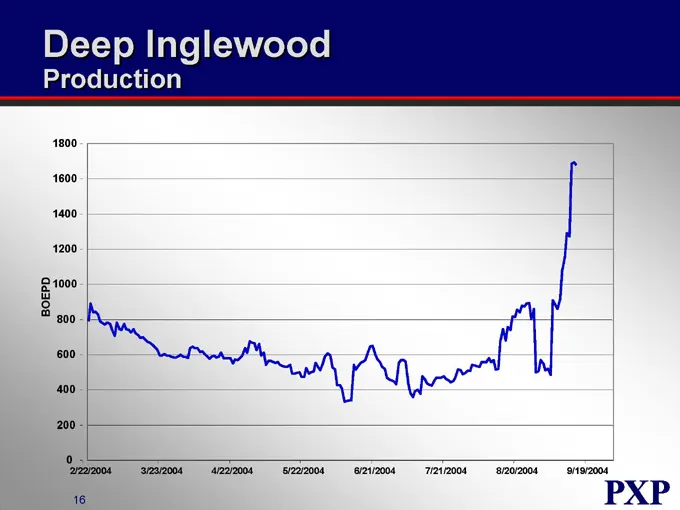
Slide 48: Deep Inglewood Production
Deep Inglewood Production BOEPD 1800 1600 1400 1200 1000 800 600 400 200 0 2/22/2004 3/23/2004 4/22/2004 5/22/2004 6/21/2004 7/21/2004 8/20/2004 9/19/2004
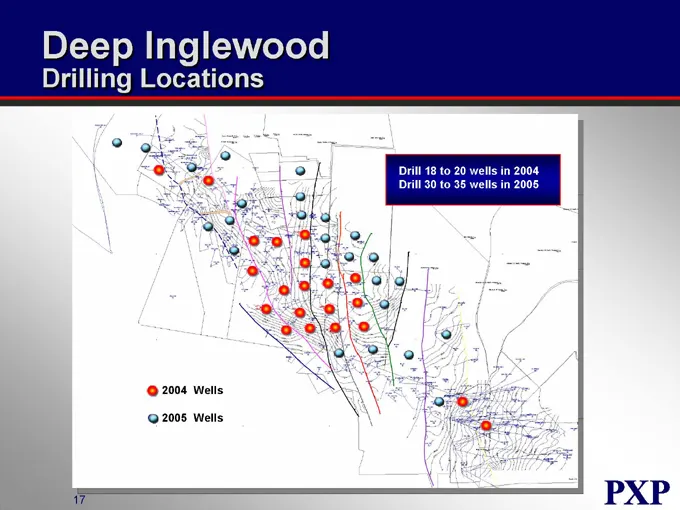
Slide 49: Deep Inglewood Drilling Locations
Deep Inglewood Drilling Locations Drill 18 to 20 wells in 2004 Drill 30 to 35 wells in 2005 2004 Wells 2005 Wells
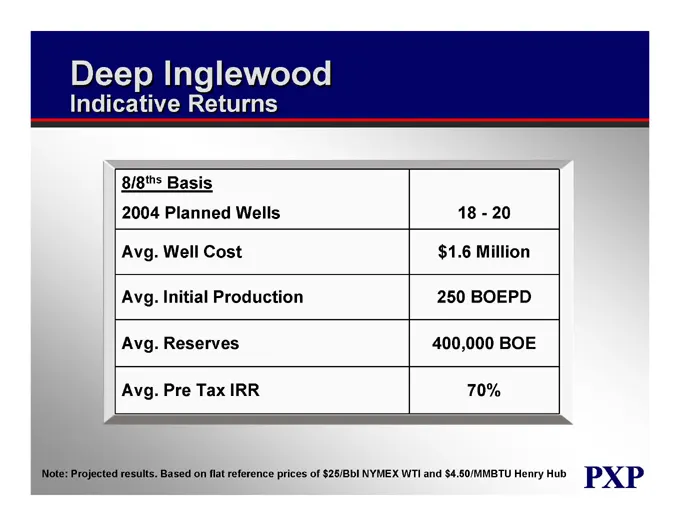
Slide 50: Deep Inglewood Indicative Returns
Deep Inglewood Indicative Returns 8/8ths Basis 2004 Planned Wells 18 - 20 Avg. Well Cost $1.6 Million Avg. Initial Production 250 BOEPD Avg. Reserves 400,000 BOE Avg. Pre Tax IRR 70% Note: Projected results. Based on flat reference prices of $25/Bbl NYMEX WTI and $4.50/MMBTU Henry Hub
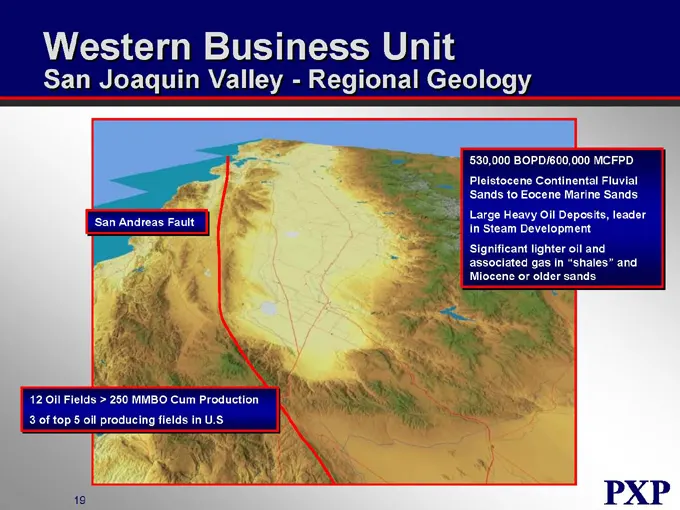
Slide 51: San Joaquin Valley - Regional Geology
Western Business Unit San Joaquin Valley - Regional Geology 530,000 BOPD/600,000 MCFPD Pleistocene Continental Fluvial Sands to Eocene Marine Sands Large Heavy Oil Deposits, leader in Steam Development Significant lighter oil and associated gas in “shales” and Miocene or older sands San Andreas Faul
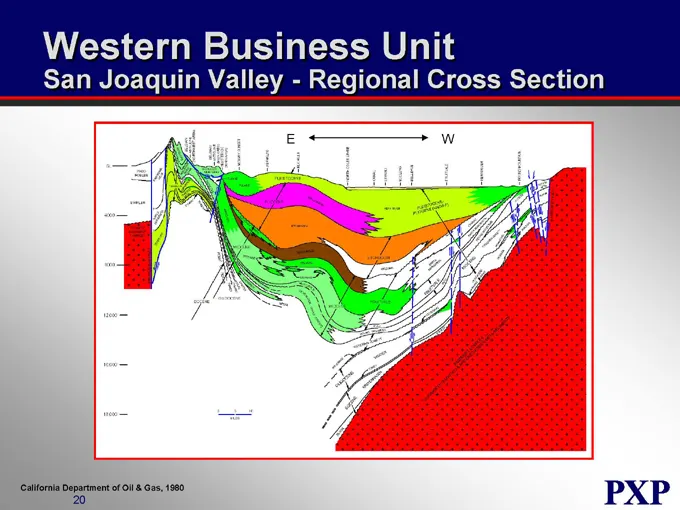
Slide 52: San Joaquin Valley - Regional Cross Section
Western Business Unit San Joaquin Valley - Regional Cross Section E W California Department of Oil & Gas, 1980
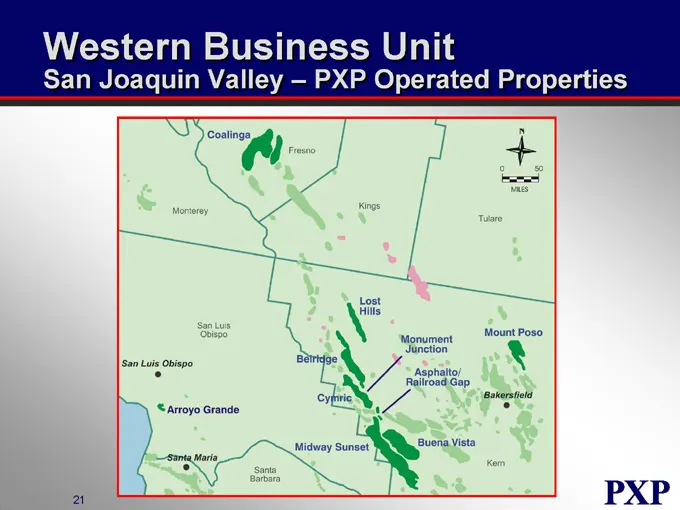
Slide 53: San Joaquin Valley - PXP Operated Properties
Western Business Unit San Joaquin Valley – PXP Operated Properties Coalinga Fresno Moneterey Kings Tulare San Luis Obispo Lost Hills San Luis Obispo Belridge Monument Junction Mount Poso Arroyo Grande Cymric Asphalto/Rail Gap Bakersfield Midway Sunset Buena Vista Kern Santa Maria Santa Barbara
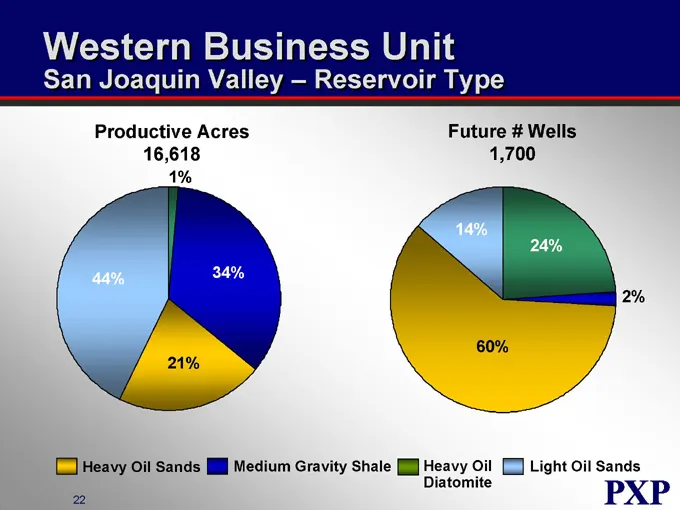
Slide 54: San Joaquin Valley - Reservoir Type
Western Business Unit San Joaquin Valley – Reservoir Type Productive Acres 16,618 Future # Wells 1,700 1% 44% 34% 21% 14% 24% 60% 2% Heavy Oil Sands Medium Gravity Shale Heavy Oil Diatomite Light Oil Sands
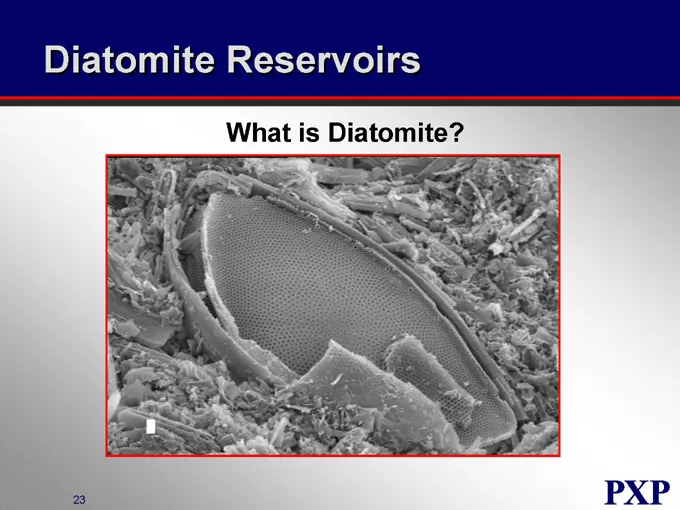
Slide 55: Diatomite Reservoirs
Diatomite Reservoirs What is Diatomite?
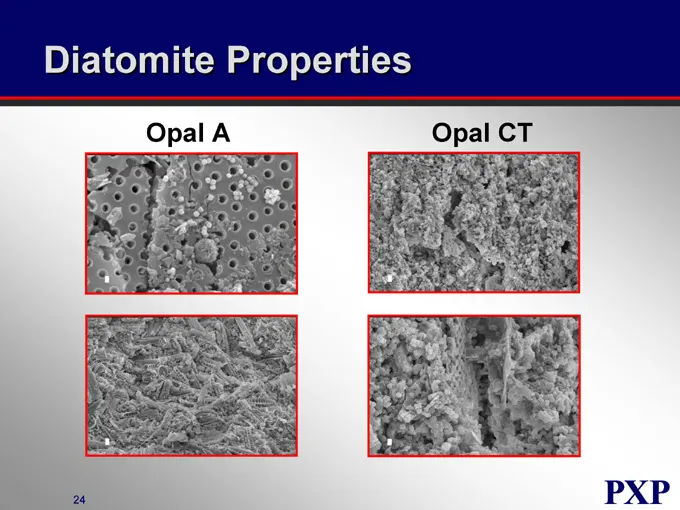
Slide 56: Diatomite Properties
Diatomite Properties Opal A Opal CT
Slide 57: Heavy Oil Diatomite
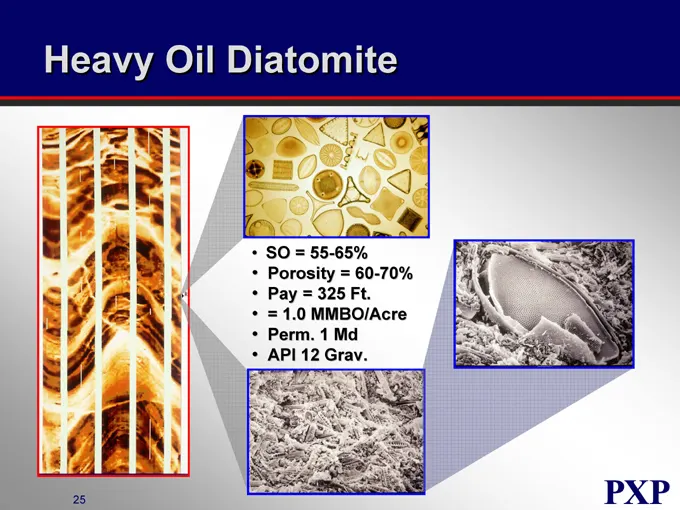
Heavy Oil Diatomite SO = 55-65% Porosity = 60-70% Pay = 325 Ft. = 1.0 MMBO/Acre Perm. 1 Md API 12 Grav.
Slide 58: Heavy Oil Diatomite Production Practices
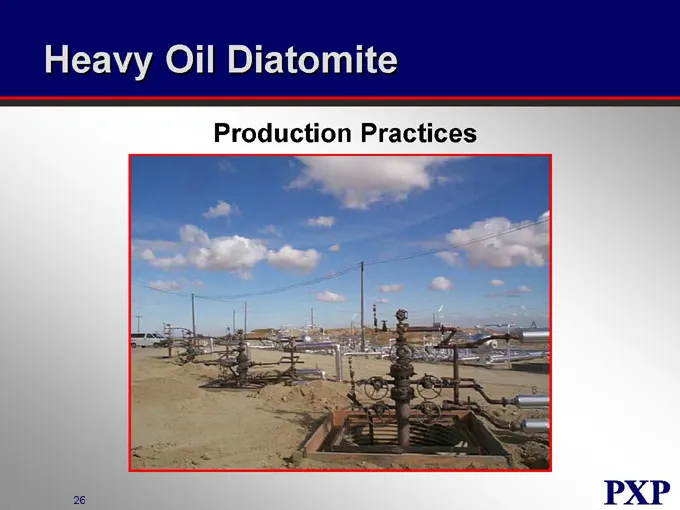
Heavy Oil Diatomite Production Practices
Slide 59: Triple Completion Technology
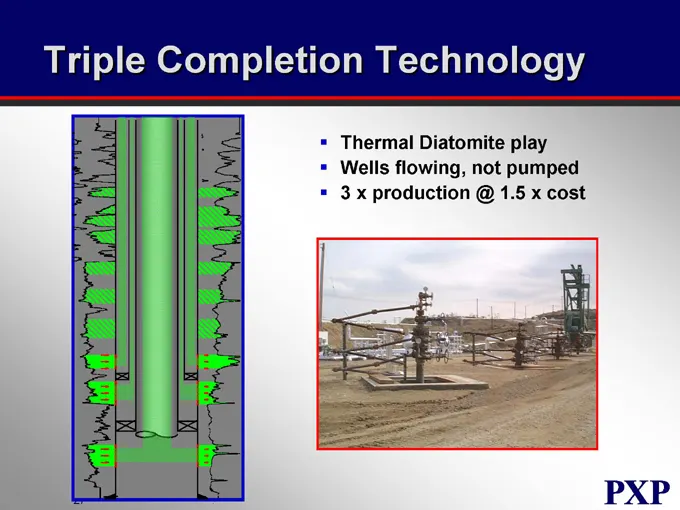
Triple Completion Technology Thermal Diatomite play Wells flowing, not pumped 3 x production @ 1.5 x cost
Slide 60: Heavy Oil Diatomite Typical Cyclic Well Response
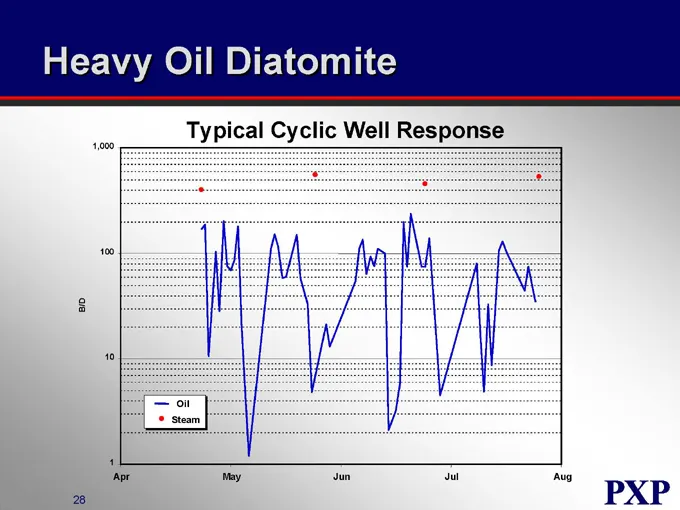
Heavy Oil Diatomite B/D 1,000 100 10 1 Typical Cyclic Well Response Oil Steam Apr May Jun Jul Aug
Slide 61: San Joaquin Valley - Reservoir Statistics
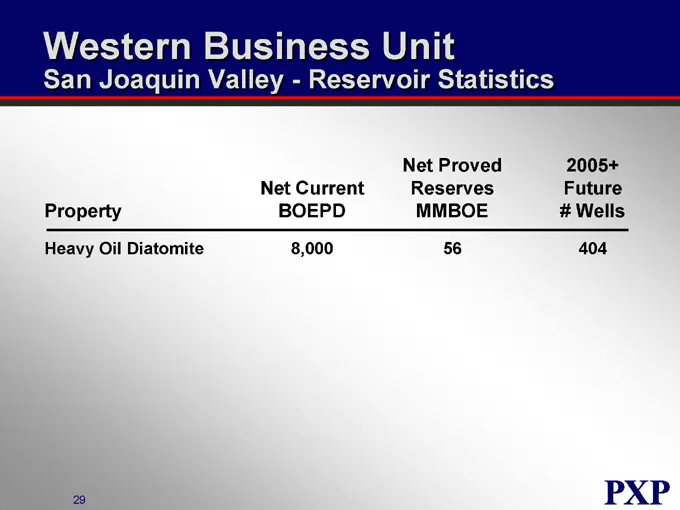
Western Business Unit San Joaquin Valley - Reservoir Statistics Property Net Current BOEPD Net Proved Reserves MMBOE 2005+ Future # Wells Heavy Oil Diatomite 8,000 56 404
Slide 62: Cymric Field - Diatomite
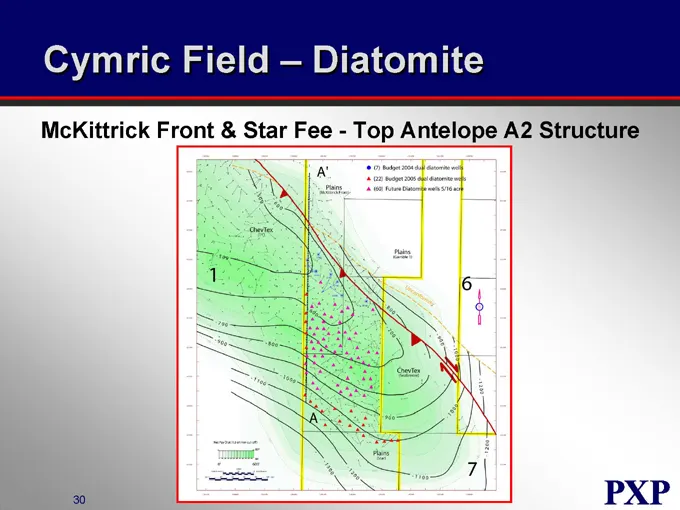
Cymric Field – Diatomite McKittrick Front & Star Fee—Top Antelope A2 Structure
Slide 63: Cymric Field - Structural Cross Section
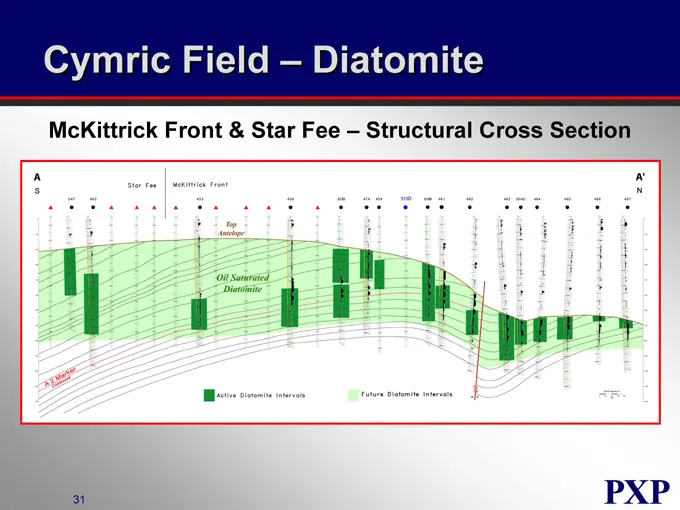
Cymric Field – Diatomite McKittrick Front & Star Fee – Structural Cross Section
Slide 64: Cymric Field - Diatomite Core
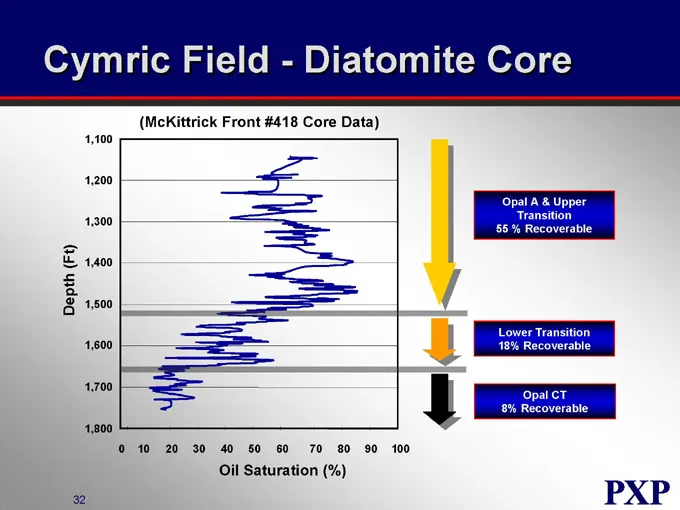
Cymric Field - - Diatomite Core (McKittrick Front #418 Core Data) Depth (Ft) 1,100 1,200 1,300 1,400 1,500 1,600 1,700 1,800 0 10 20 30 40 50 60 70 80 90 100 Oil Saturation (%) Opal A & Upper Transition 55% Recoverable Lower Transition 18% Recoverable Opal CT 8% Recoverable
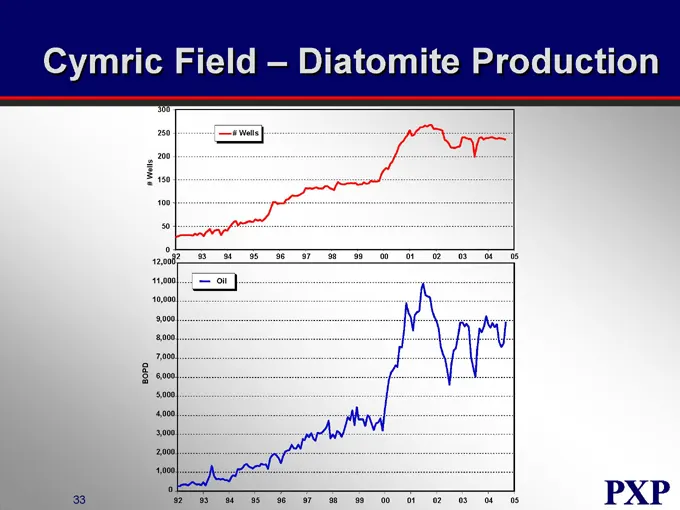
Slide 65: Cymric Field - Diatomite Production
Cymric Field – Diatomite Production # Wells 300 250 200 150 100 50 0 # Wells 92 93 94 95 96 97 98 99 00 01 02 03 04 05 BOPD 12,000 11,000 10,000 9,000 8,000 7,000 6,000 5,000 4,000 3,000 2,000 1,000 0 Oil 92 93 94 95 96 97 98 99 00 01 02 03 04 05
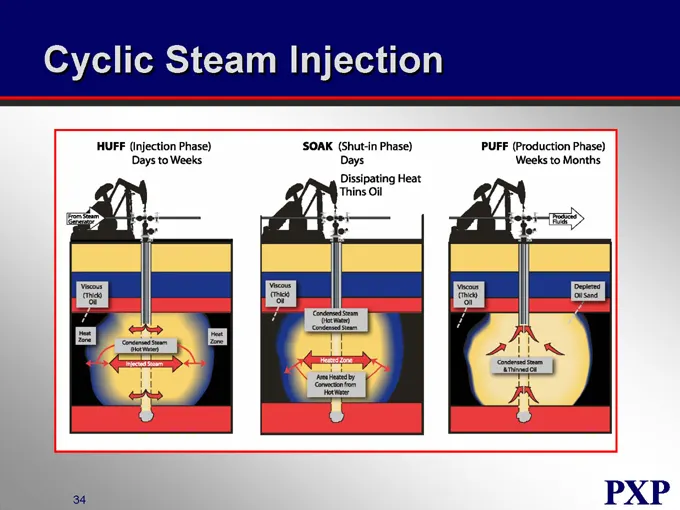
Slide 66: Cyclic Steam Injection
Cyclic Steam Injection HUFF (Injection Days to Weeks) SOAK (Shut-in Phase) Days Dissipating Heat Thins Oil PUFF (Production Phase) Weeks to Months
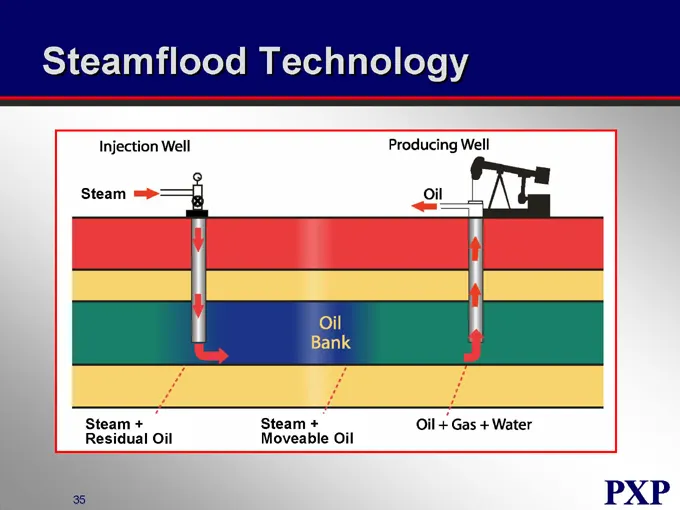
Slide 67: Steamflood Technology
Steamflood Technology Injection Well Producing Well Steam Oil Oil Bank Oil + Gas + Water Steam + Residual Oil Steam + Moveable Oil
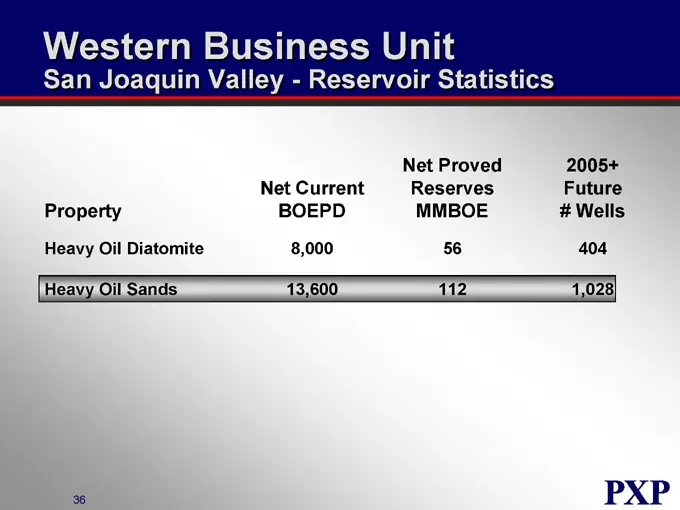
Slide 68: San Joaquin Valley - Reservoir Statistics
Western Business Unit San Joaquin Valley - Reservoir Statistics Property Net Current BOEPD Net Proved Reserves MMBOE 2005+ Future # Wells Heavy Oil Diatomite 8,000 56 404 Heavy Oil Sands 13,600 112 1,028
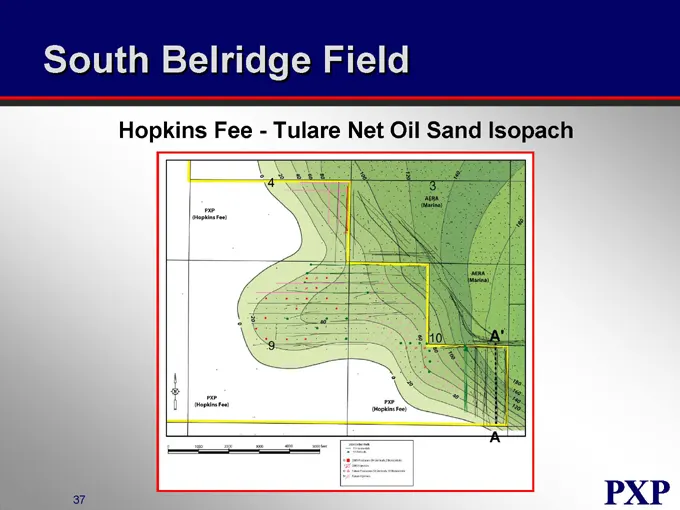
Slide 69: South Belridge Field
South Belridge Field Hopkins Fee - Tulare Net Oil Sand Isopach
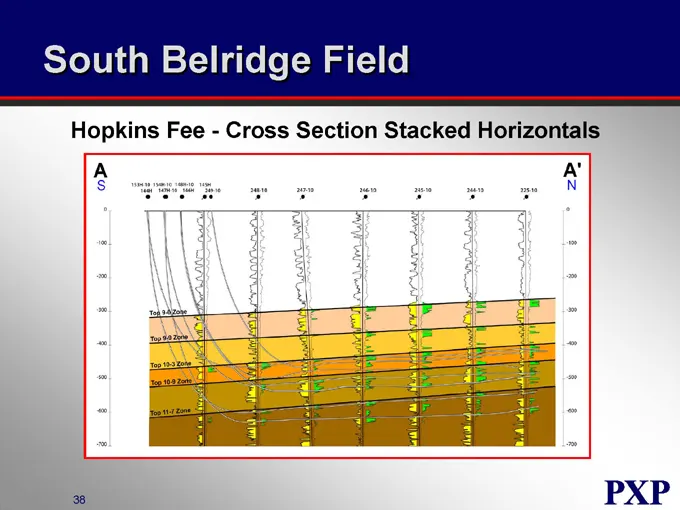
Slide 70: South Belridge Field Cross Section
South Belridge Field Hopkins Fee - Cross Section Stacked Horizontals
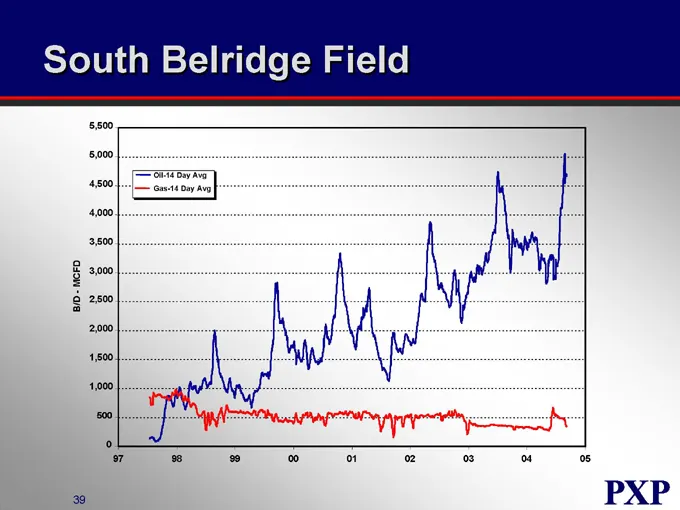
Slide 71: South Belridge Field
South Belridge Field B/D - MCFD 5,500 5,000 4,500 4,000 3,500 3,000 2,500 2,000 1,500 1,000 500 0 Oil-14 Day Avg Gas-14 Day Avg 97 98 99 00 01 02 03 04 05
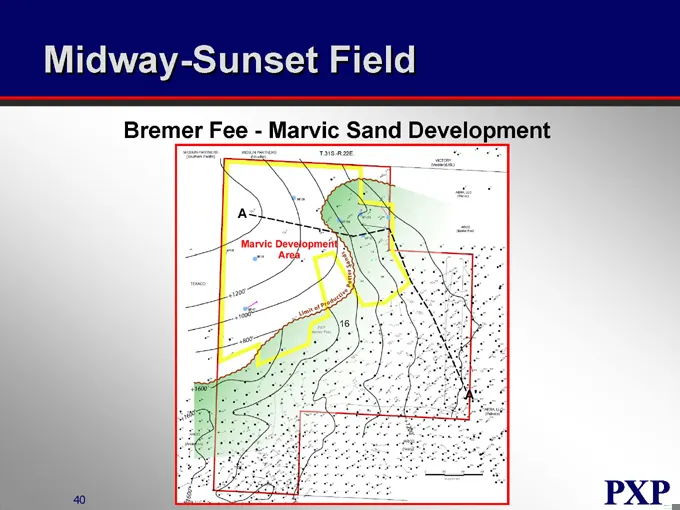
Slide 72: Midway-Sunset Field
Midway-Sunset Field Bremer Fee - Marvic Sand Development
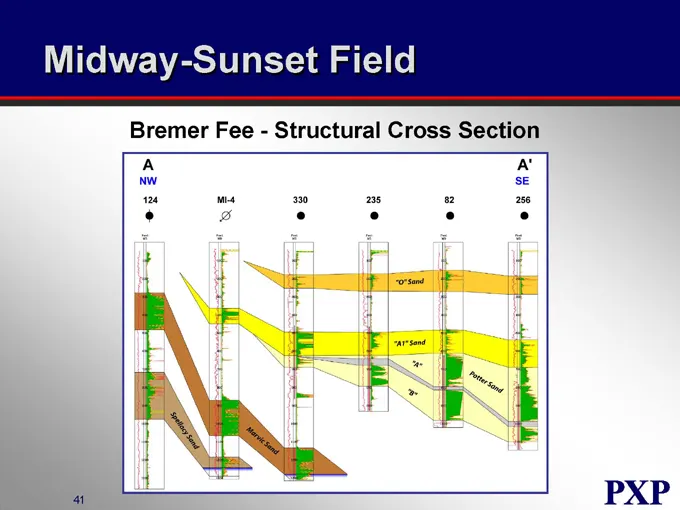
Slide 73: Midway-Sunset Field Structural Cross Section
Midway-Sunset Field Bremer Fee - Structural Cross Section
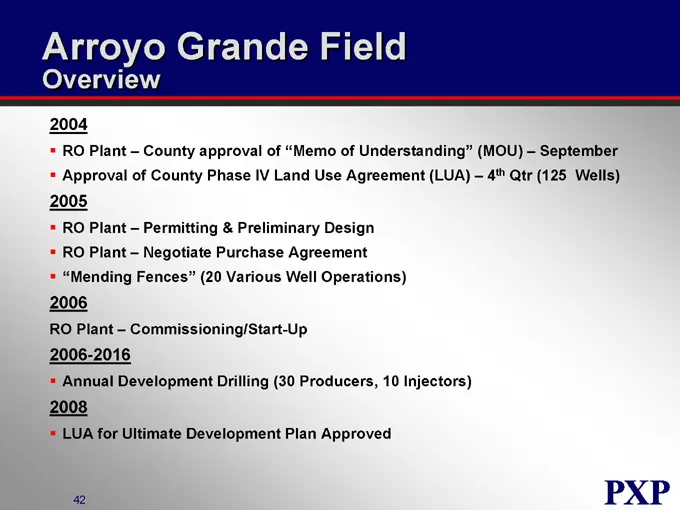
Slide 74: Arroyo Grande Field Overview
Arroyo Grande Field Overview RO Plant – County approval of “Memo of Understanding” (MOU) – September Approval of County Phase IV Land Use Agreement (LUA) – 4th Qtr (125 Wells) RO Plant – Permitting & Preliminary Design RO Plant – Negotiate Purchase Agreement “Mending Fences” (20 Various Well Operati
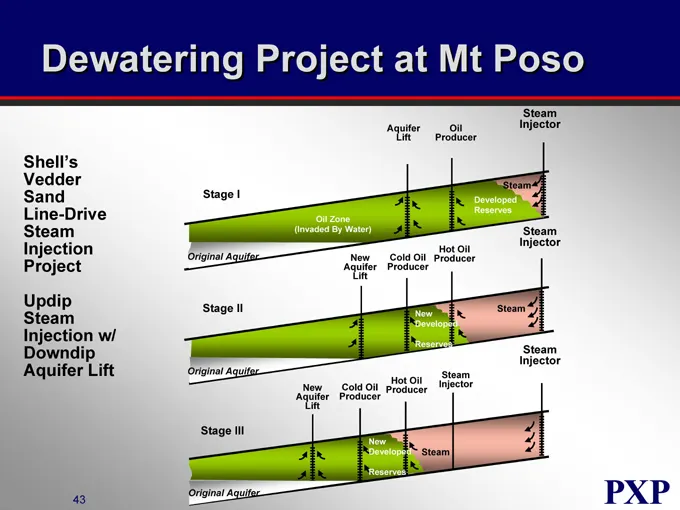
Slide 75: Dewatering Project at Mt Poso
Dewatering Project at Mt Poso Shell’s Vedder Sand Line-Drive Steam Injection Project Updip Steam Injection w/ Downdip Aquifer Lift Stage I Aquifer Lift Oil Producer Steam Injector Oil Zone (Invaded By Water) Developed Reserves Steam Original Aquifer New Aquifer Lift Cold Oil Producer Hot Oil Produce
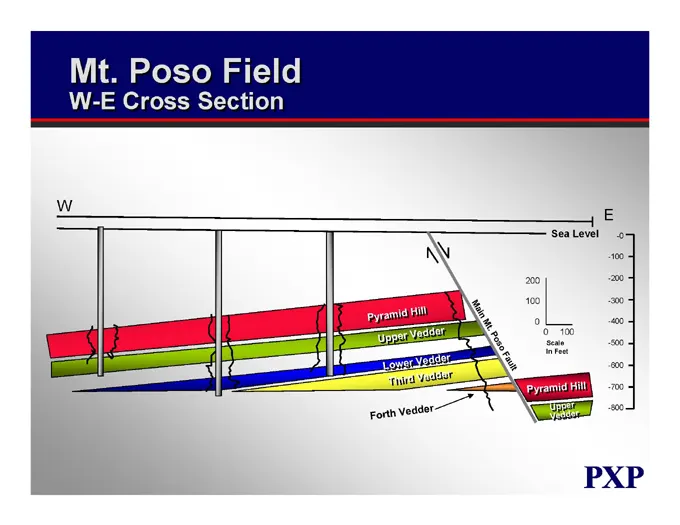
Slide 76: Mt. Poso Field W-E Cross Section
Mt. Poso Field W-E Cross Section W E Pyramid Hill Upper Vedder Lower Vedder Third Vedder Forth Vedder Main Mt. Poso Fault Sea Level -0 -100 -200 -300 -400 -500 -600 -700 -800
Slide 77: San Joaquin Valley - Reservoir Statistics
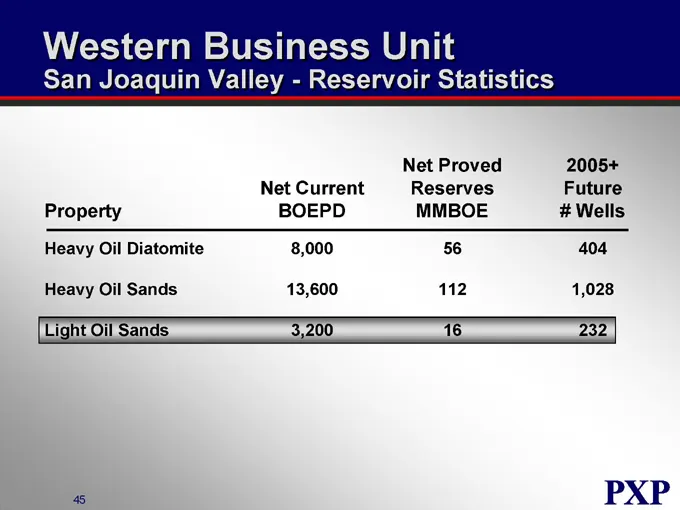
Western Business Unit San Joaquin Valley - Reservoir Statistics Property Net Current BOEPD Net Proved Reserves MMBOE 2005+ Future # Wells Heavy Oil Diatomite 8,000 56 404 Heavy Oil Sands 13,600 112 1,028 Light Oil Sands 3,200 16 232
Slide 78: Mount Poso Field 2005 Drilling Program
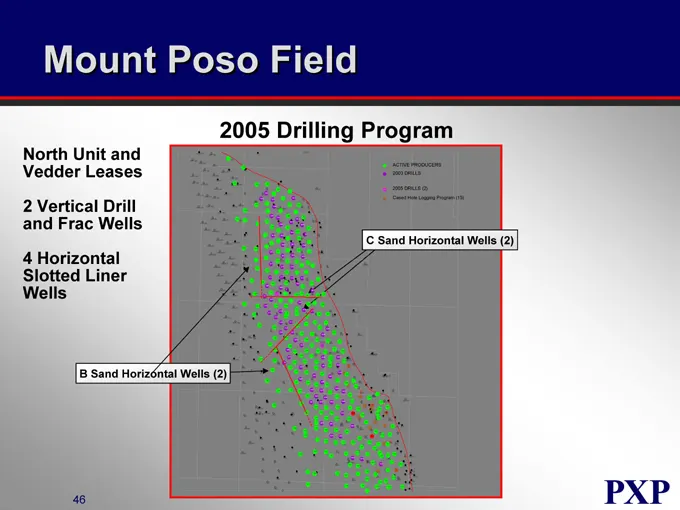
Mount Poso Field North Unit and Vedder Leases 2 Vertical Drill and Frac Wells 4 Horizontal Slotted Liner Wells 2005 Drilling Program C Sand Horizontal Wells (2) B Sand Horizontal Wells (2)
Slide 79: Mount Poso Field Horizontal Well Concept
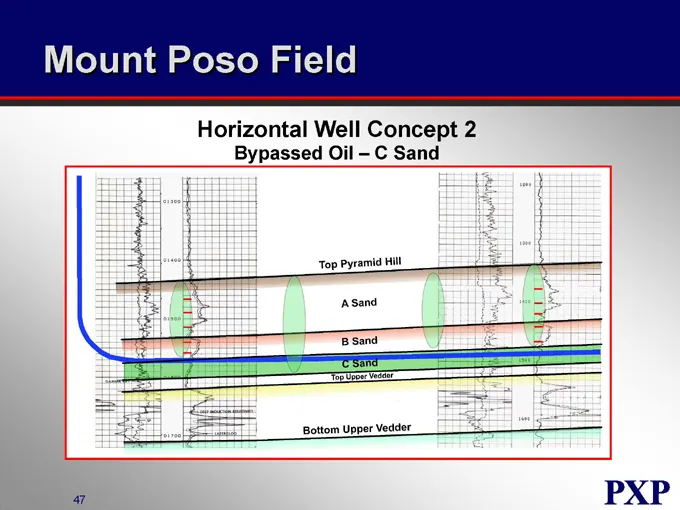
Mount Poso Field Horizontal Well Concept 2 Bypassed Oil – C Sand Top Pyramid Hill A Sand B Sand C Sand Top Upper Vedder Bottom Upper Vedder
Slide 80: San Joaquin Valley - Reservoir Statistics
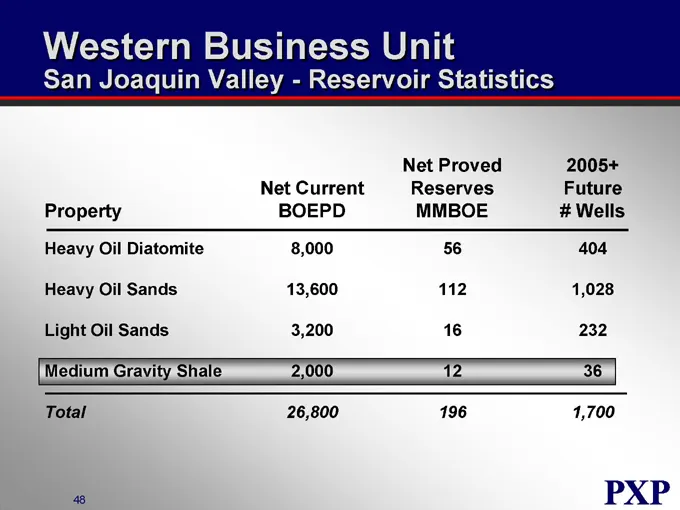
Western Business Unit San Joaquin Valley - Reservoir Statistics Property Net Current BOEPD Net Proved Reserves MMBOE 2005+ Future # Wells Heavy Oil Diatomite 8,000 56 404 Heavy Oil Sands 13,600 112 1,028 Light Oil Sands 3,200 16 232 Medium Gravity Shale 2,000 12 36 Total 26,800 196 1,700
Slide 81: San Joaquin Valley - 2004 vs. 2005
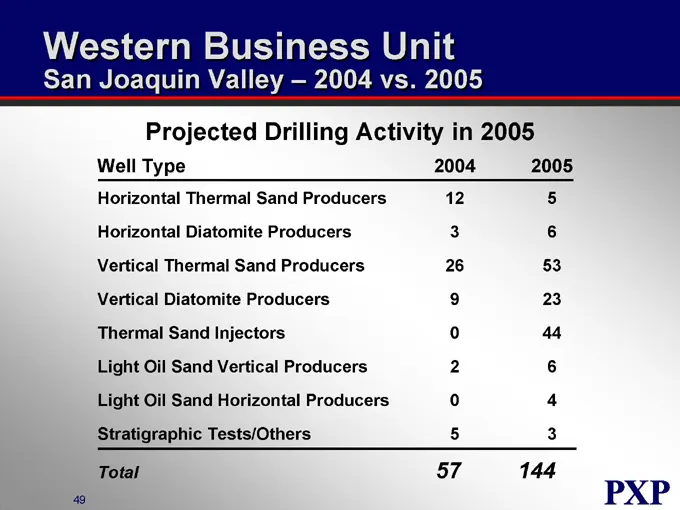
Western Business Unit San Joaquin Valley – 2004 vs. 2005 Projected Drilling Activity in 2005 Well Type 2004 2005 Horizontal Thermal Sand Producers 12 5 Horizontal Diatomite Producers 3 6 Vertical Thermal Sand Producers 26 53 Vertical Diatomite Producers 9 23 Thermal Sand Injectors 0 44 Light Oil San
Slide 82: San Joaquin Valley Indicative Returns
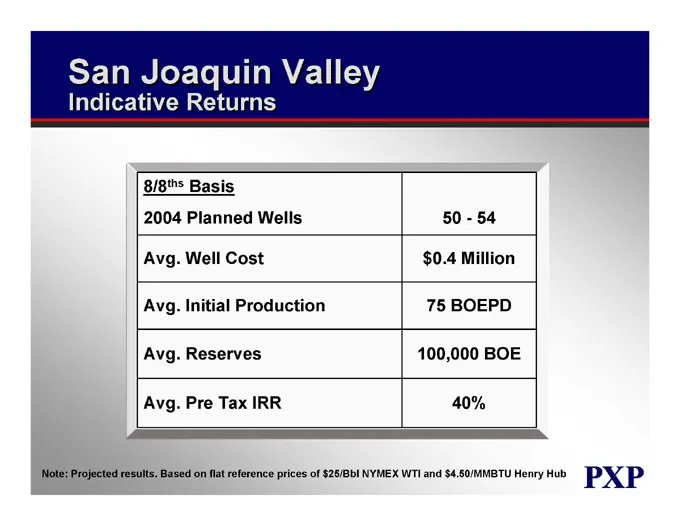
San Joaquin Valley Indicative Returns 8/8ths Basis 2004 Planned Wells 50 - 54 Avg. Well Cost $0.4 Million Avg. Initial Production 75 BOEPD Avg. Reserves 100,000 BOE Avg. Pre Tax IRR 40% Note: Projected results. Based on flat reference prices of $25/Bbl NYMEX WTI and $4.50/MMBTU Henry Hub
Slide 83: Onshore Strategy
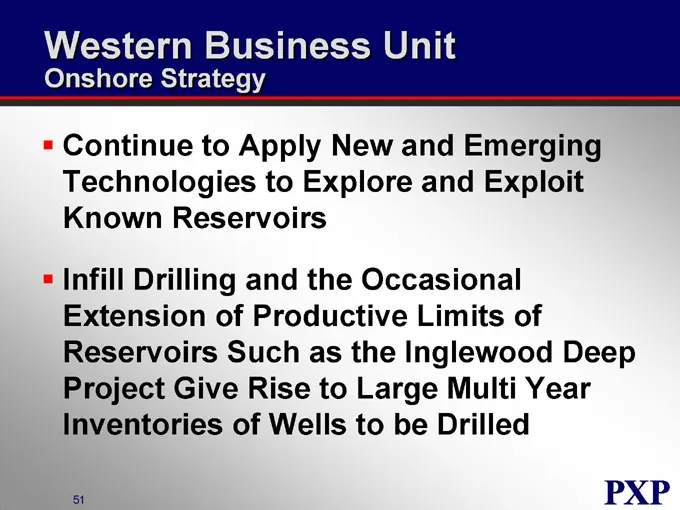
Western Business Unit Onshore Strategy Continue to Apply New and Emerging Technologies to Explore and Exploit Known Reservoirs Infill Drilling and the Occasional Extension of Productive Limits of Reservoirs Such as the Inglewood Deep Project Give Rise to Large Multi Year Inventories of Wells to be D
Slide 84: Plains Exploration & Production Company
PLAINS EXPLORATION & PRODUCTION COMPANY NYSE:PXP www.plainsxp.com
Slide 85: Western Business Unit Offshore California
PLAINS EXPLORATION & PRODUCTION COMPANY Western Business Unit Offshore California Bob Huguenard Vice President NYSE: PXP www.plainsxp.com
Slide 86: Offshore - Who We Are
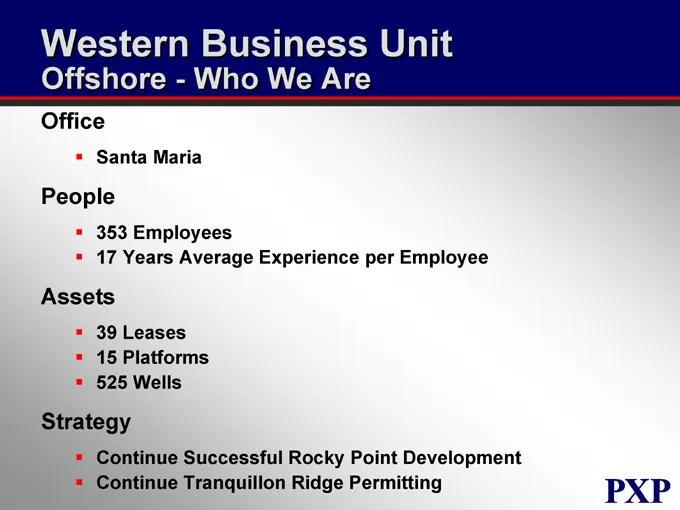
Western Business Unit Offshore - Who We Are Office Santa Maria People Employees 17 Years Average Experience per Employee Assets Leases 15 Platforms 525 Wells Strategy Continue Successful Rocky Point Development Continue Tranquillon Ridge Permitting
Slide 87: Offshore Production and Reserves
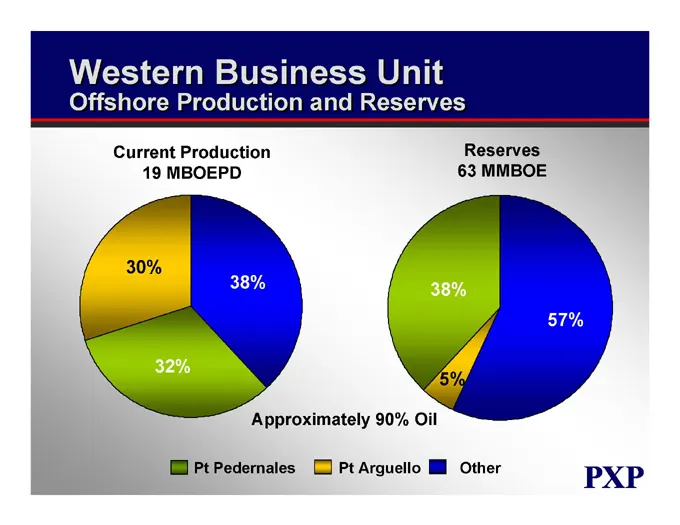
Western Business Unit Offshore Production and Reserves Current Production 19 MBOEPD 30% 38% 32% Reserves 63 MMBOE 38% 57% 5% Approximately 90% Oil Pt Pedernales Pt Arguello Other
Slide 88: Tranquillon Ridge & Rocky Point Project Areas
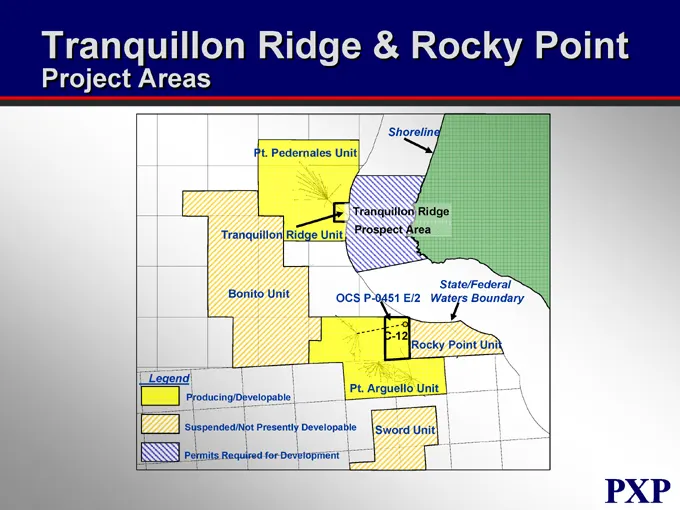
Tranquillon Ridge & Rocky Point Project Areas Pt. Pedernales Unit Shoreline Tranquillon Ridge Prospect Area Tranquillon Ridge Unit Bonito Unit OCS P-0451 E/2 State/Federal Waters Boundary C-12 Rocky Point Unit Pt. Arguello Unit Sword Unit Legend Producing/Developable Suspended/Not Presently Developa
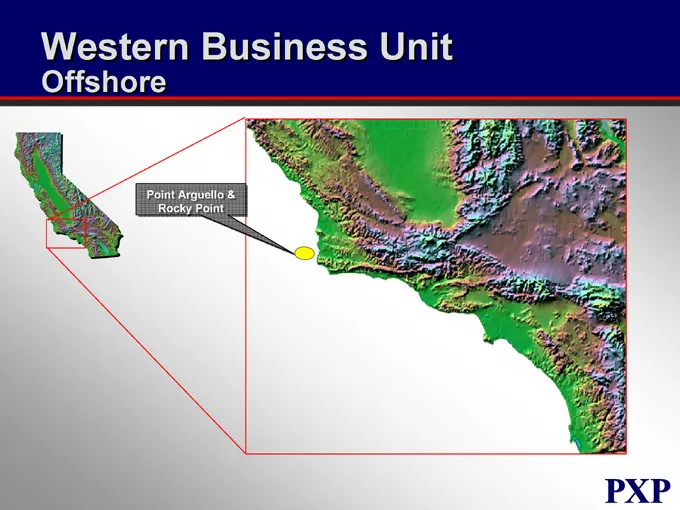
Slide 89: Point Arguello & Rocky Point
Western Business Unit Offshore Point Arguello & Rocky Point
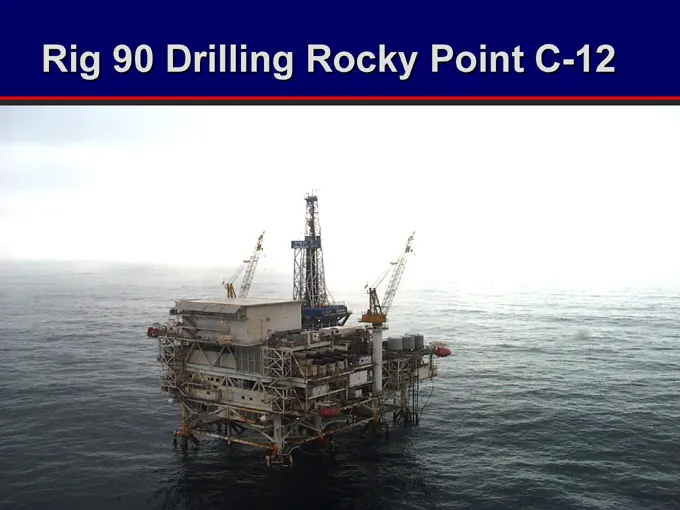
Slide 90: Rig Drilling Rocky Point C-12
Rig 90 Drilling Rocky Point C-12
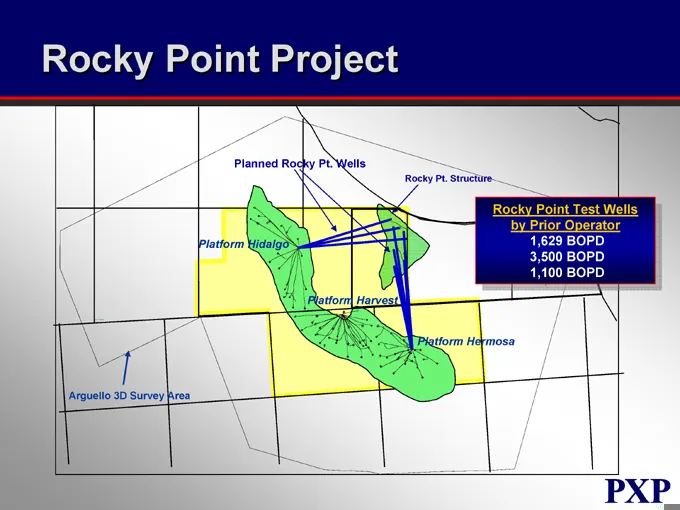
Slide 91: Rocky Point Project
Rocky Point Project Planned Rocky Pt. Wells Rocky Pt. Structure Rocky Point Test Wells by Prior Operator 1,629 BOPD 3,500 BOPD 1,100 BOPD Platform Hidalgo Platform Harvest Platform Hermosa Arguello 3D Survey Area
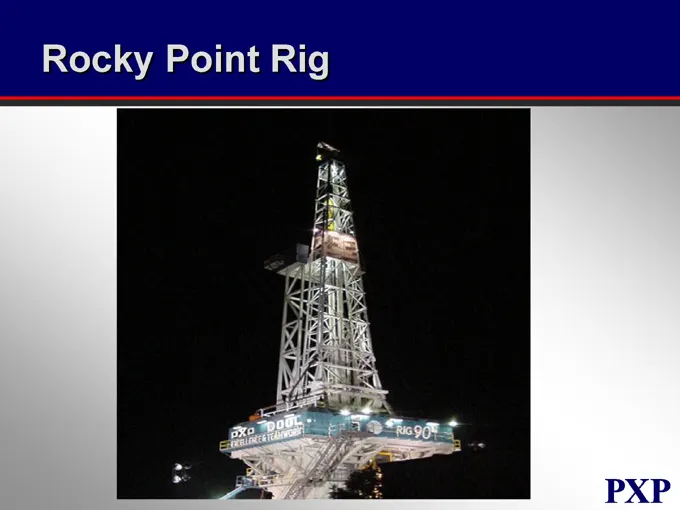
Slide 92: Rocky Point Rig
Rocky Point Rig
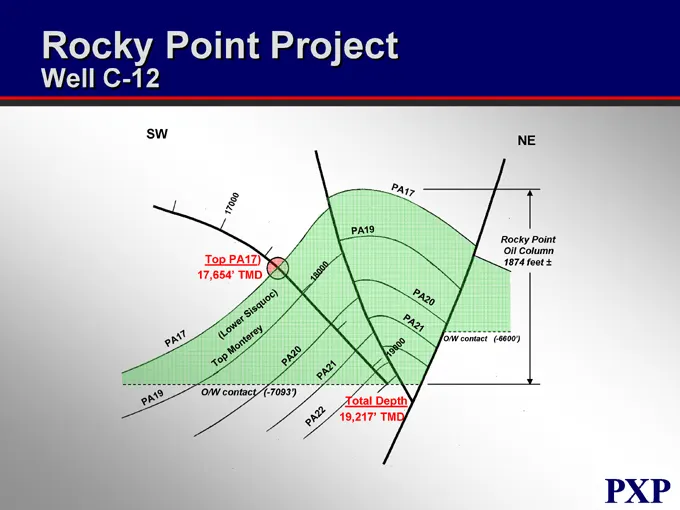
Slide 93: Rocky Point Project Well C-12
Rocky Point Project Well C-12 SW NE PA17 PA19 PA20 PA21 Top Monterey (Lower Sisquoc) Rocky Point Oil Column 1874 feet ± Total Depth 19,217’ TMD O/W contact (-7093’) O/W contact (-6600’) PA17 PA19 PA20 PA21
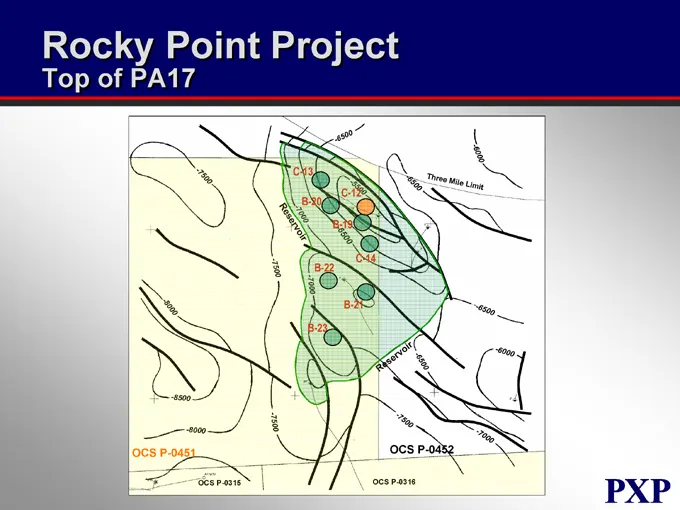
Slide 94: Rocky Point Project
Rocky Point Project Top of PA17 OCS P-0451 OCS P-0452 B-22 B-23 B-21 C-14 B-19 B-20 C-12 C-13 OCS P-0315 OCS P-0316 Three mile limit -6500 -6000 -7000 -7500 -8000 -8500 Reservoir
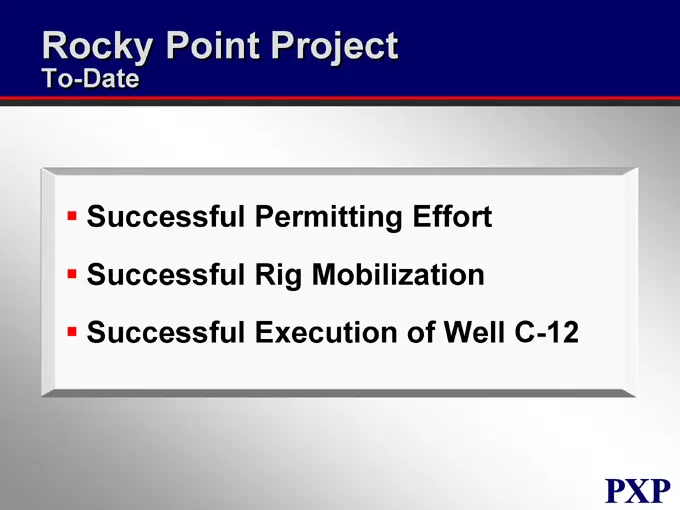
Slide 95: Rocky Point Project To-Date
Rocky Point Project To-Date Successful Permitting Effort Successful Rig Mobilization Successful Execution of Well C-12
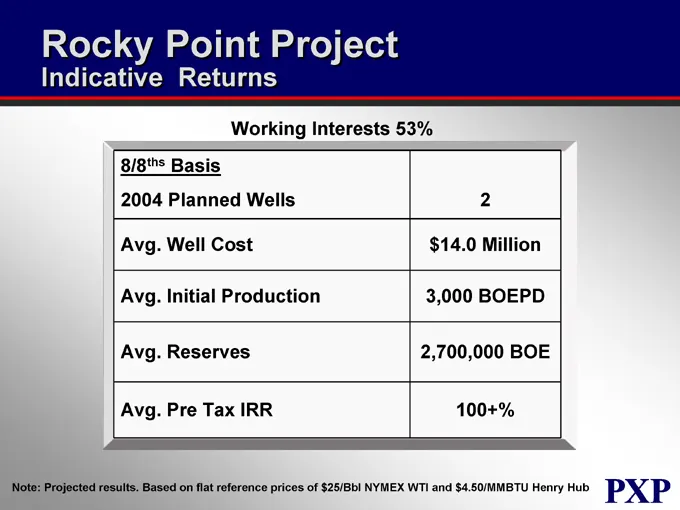
Slide 96: Rocky Point Project Indicative Returns
Rocky Point Project Indicative Returns Working Interests 53% 8/8ths Basis 2004 Planned Wells 2 Avg. Well Cost $14.0 Million Avg. Initial Production 3,000 BOEPD Avg. Reserves 2,700,000 BOE Avg. Pre Tax IRR 100+% Note: Projected results. Based on flat reference prices of $25/Bbl NYMEX WTI and $4.50/MM
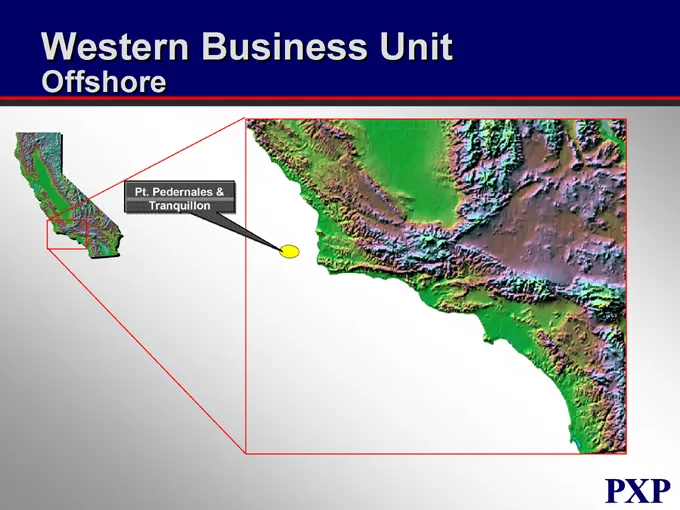
Slide 97: Pt. Pedernales & Tranquillon
Western Business Unit Offshore Pt. Pedernales & Tranquillon
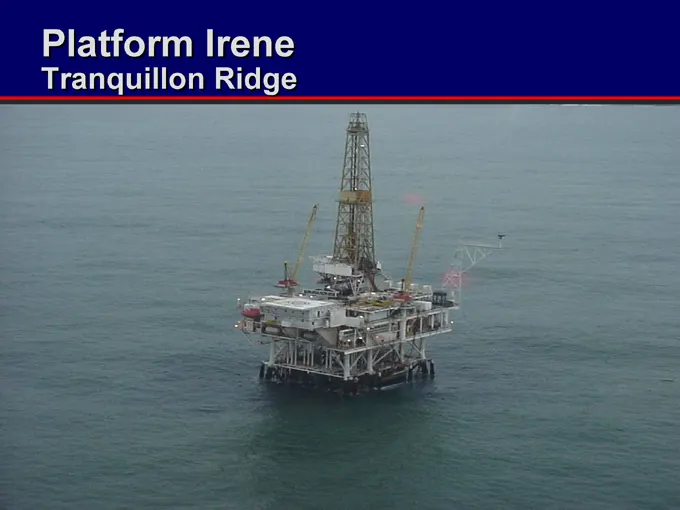
Slide 98: Platform Irene Tranquillon Ridge
Platform Irene Tranquillon Ridge
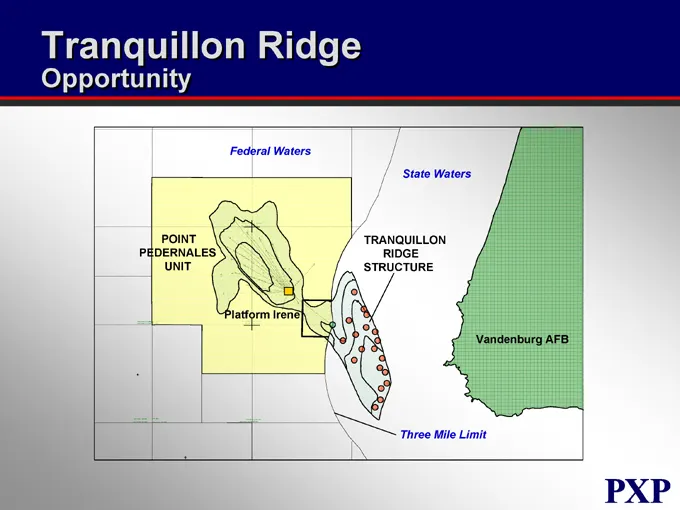
Slide 99: Tranquillon Ridge Opportunity
Tranquillon Ridge Opportunity Federal Waters POINT PEDERNALES UNIT Platform Irene TRANQUILLON RIDGE STRUCTURE State Waters Vandenburg AFB Three Mile Limit
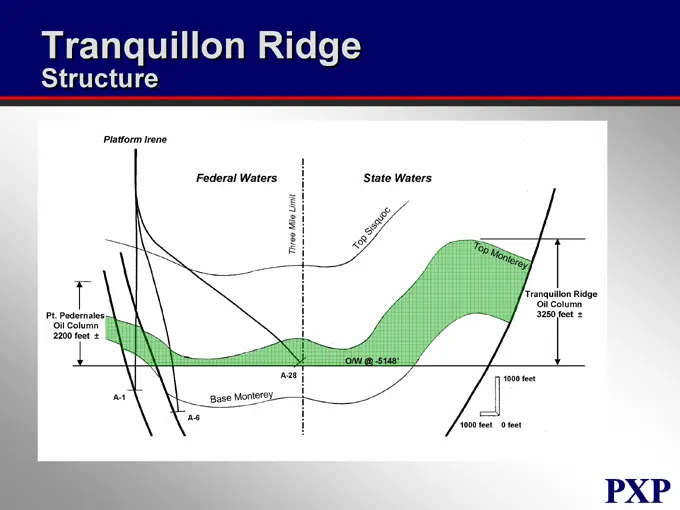
Slide 100: Tranquillon Ridge Structure
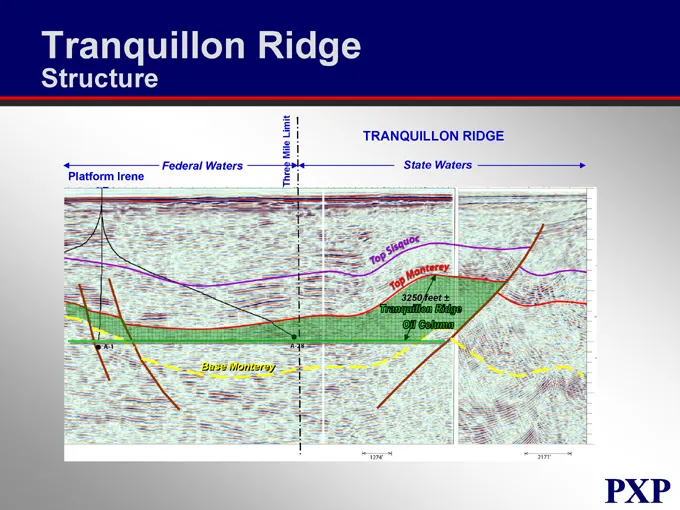
Tranquillon Ridge Structure Platform Irene Federal Waters State Waters Pt. Pedernales Oil Column 2200 feet ± A-1 A-6 Base Monterey A-28 O/W @ -5148’ Tranquillon Ridge Oil Column 3250 feet ± 1000 feet 1000 feet 0 feet Three Mile limit Top Sisquoc Top Monterey
Slide 101: Tranquillon Ridge Structure
Tranquillon Ridge Structure Platform Irene Federal Waters TRANQUILLON RIDGE State Waters Base Monterey Top Sisquoc Top Monterey Three Mile Limit 3250 feet ± A-1 A-28 Tranquillon Ridge Oil Column
Slide 102: Tranquillon Ridge Opportunity
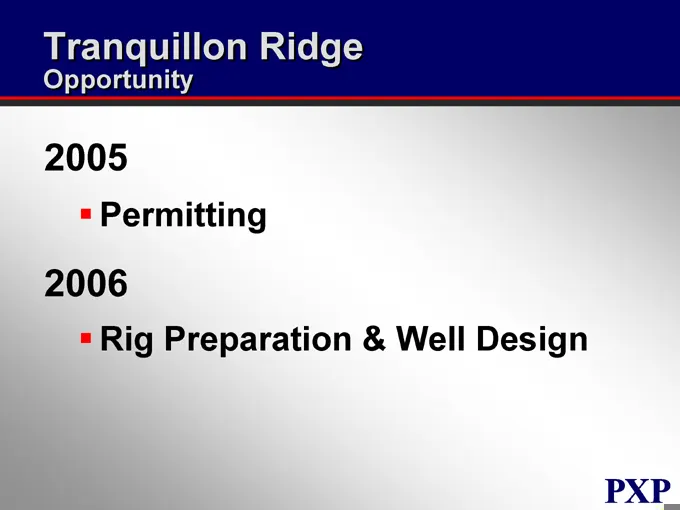
Tranquillon Ridge Opportunity Permitting Rig Preparation & Well Design
Slide 103: Tranquillon Ridge Opportunity
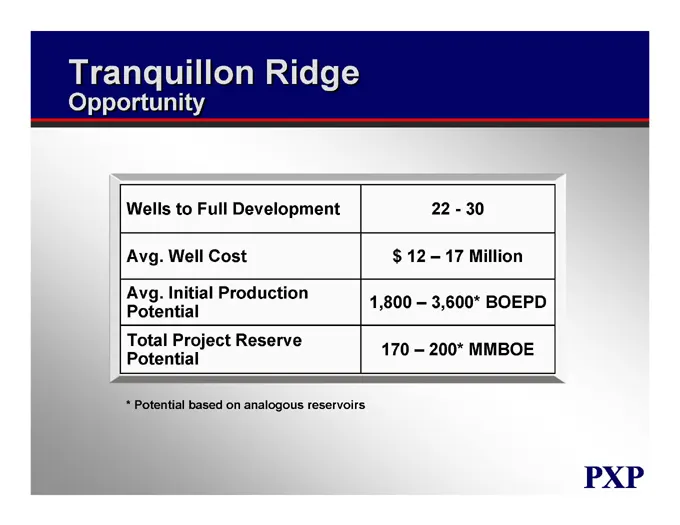
Tranquillon Ridge Opportunity Wells to Full Development 22 - 30 Avg. Well Cost $ 12 – 17 Million Avg. Initial Production Potential 1,800 – 3,600* BOEPD Total Project Reserve Potential 170 – 200* MMBOE * Potential based on analogous reservoirs
Slide 104: Offshore 2005 Strategy
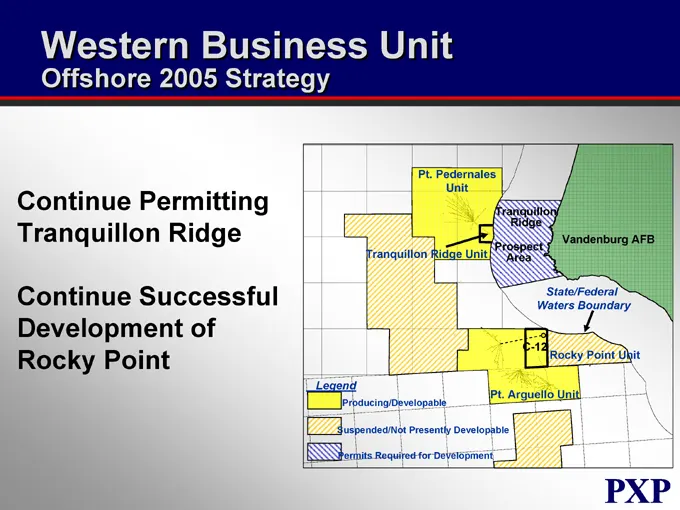
Western Business Unit Offshore 2005 Strategy Continue Permitting Tranquillon Ridge Continue Successful Development of Rocky Point Pt. Pedernales Unit Tranquillon Ridge Vandenburg AFB Prospect Area Tranquillon Ridge Unit State/Federal Waters Boundary C-12 Rocky Point Unit Legend Pt. Arguello Unit Pro
Slide 105: Plains Exploration & Production Company
PLAINS EXPLORATION & PRODUCTION COMPANY NYSE: PXP www.plainsxp.com
Slide 106: Regulatory Environment
PLAINS EXPLORATION & PRODUCTION COMPANY Regulatory Environment Steve Rusch Vice President – Environmental, Health, Safety, & Government Affairs NYSE : PXP www.plainsxp.com
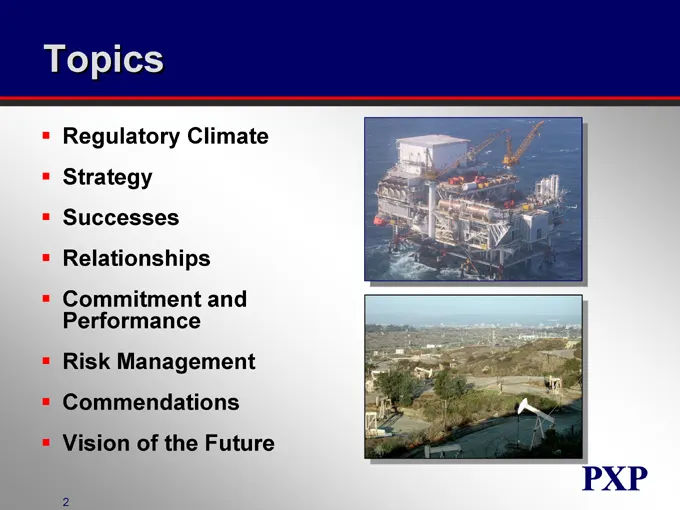
Slide 107: Topics
Topics Regulatory Climate Strategy Successes Relationships Commitment and Performance Risk Management Commendations Vision of the Future
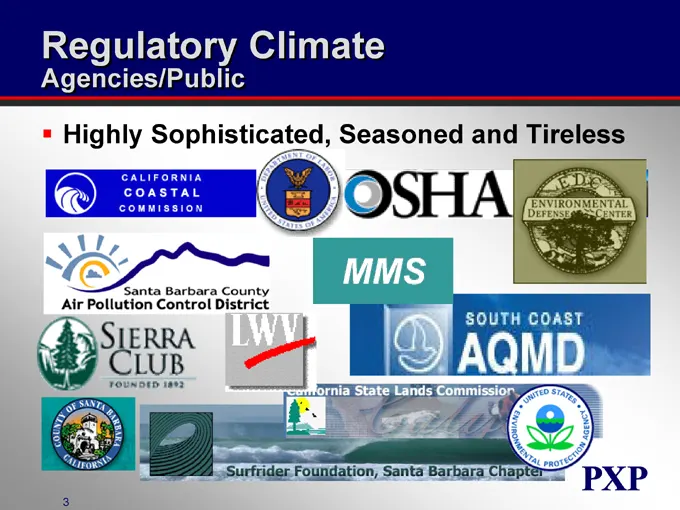
Slide 108: Regulatory Climate
Regulatory Climate Agencies/Public Highly Sophisticated, Seasoned and Tireless
Slide 109: Regulatory Climate Bottom Line
Regulatory Climate Bottom Line Path is Well Defined; May Not Like It, But It’s Clear Their Goal is to Mitigate Potential Environmental Impacts to Maximum Extent Feasible Regulations Require “Net Air Quality Benefit” They Do Recognize Corporate Commitment to Regulatory Compliance Excellence
Slide 110: Strategy
Strategy Build on Past Successes; Maintain Can-Do, Win-Win Philosophy Strengthen Existing Relationships and Cultivate New Ones With Key Regulatory and Political Officials Don’t Lose Site of Big Picture; Recognize Their Mission; Temper “Pride and Principles” Reaction
Slide 111: Successes
Successes Permitted Inglewood Deep 3-D Seismic 22 sq. Miles in Urban Los Angeles Multiple Jurisdictions Creative and Flexible Outreach to Key Officials, Local Newspapers, Neighborhood Associations No Delays, Minimal Impacts Permitted Rocky Point Expansion Distinguished Our Project From “New Offshore
Slide 112: Relationships - Leaders
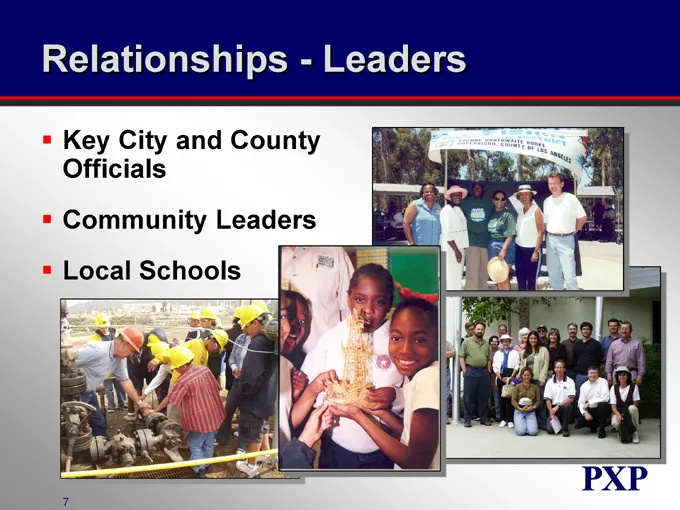
Relationships - Leaders Key City and County Officials Community Leaders Local Schools
Slide 113: Relationships - Media
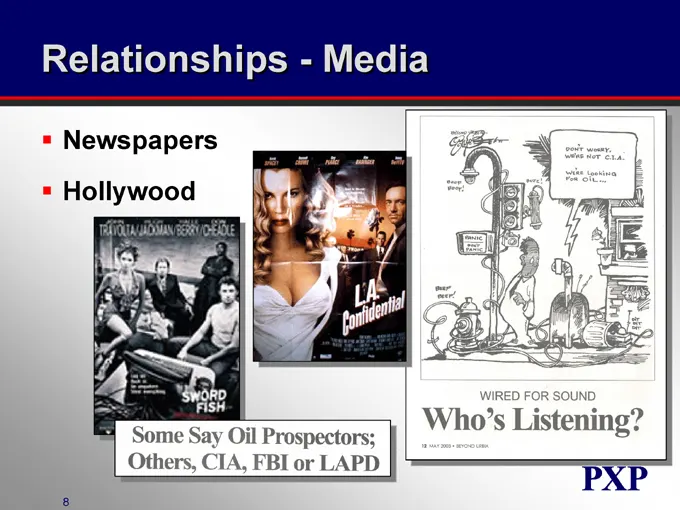
Relationships - Media Newspapers Hollywood
Slide 114: Commitment and Performance
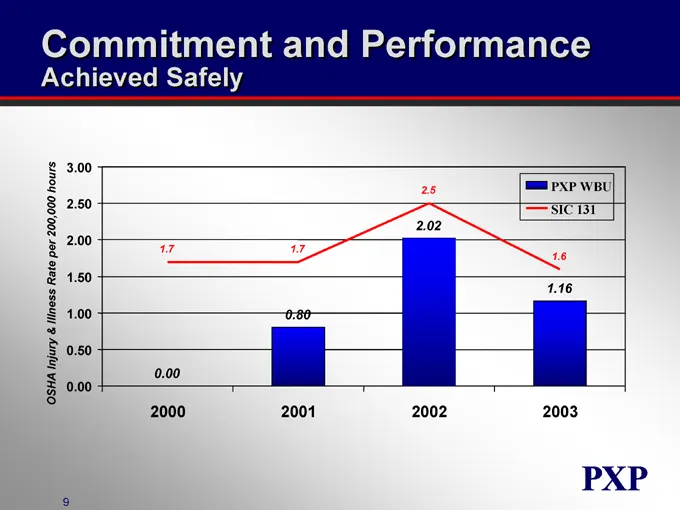
Commitment and Performance Achieved Safely OSHA Injury & Illness Rate per 200,000 hours 3.00 2.50 2.00 1.50 1.00 0.50 0.00 2000 2001 2002 2003 PXP WBU SIC 131 0.00 0.80 2.02 1.16 1.7 1.7 2.5 1.6
Slide 115: Risk Management - Spill Prevention and Response
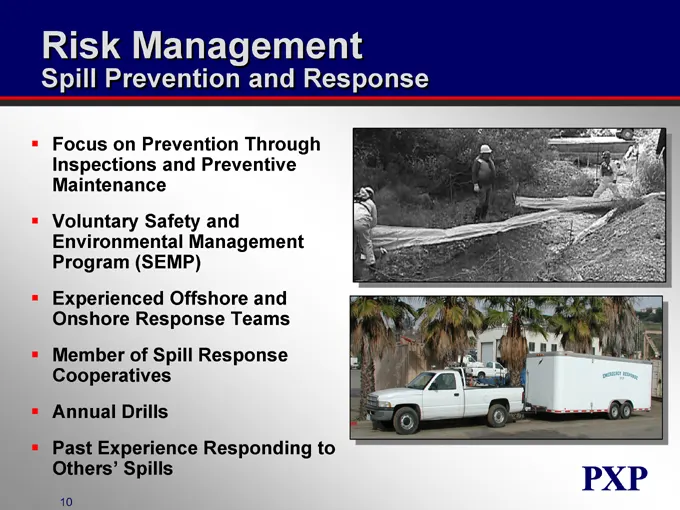
Risk Management Spill Prevention and Response Focus on Prevention Through Inspections and Preventive Maintenance Voluntary Safety and Environmental Management Program (SEMP) Experienced Offshore and Onshore Response Teams Member of Spill Response Cooperatives Annual Drills Past Experience Responding
Slide 116: Risk Management - Fire Protection
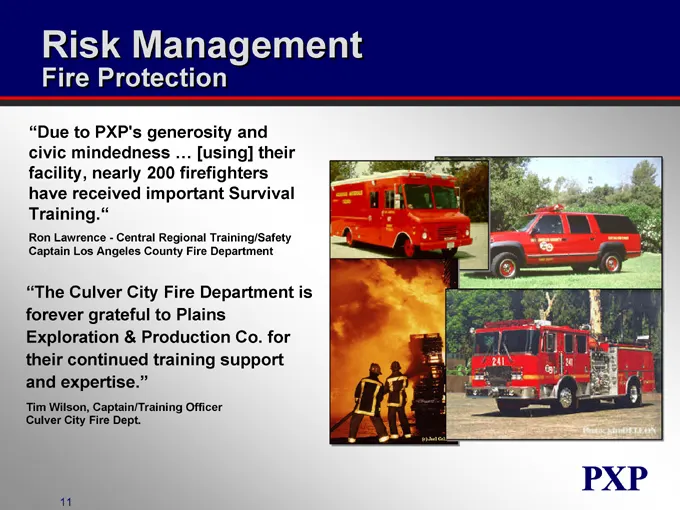
Risk Management Fire Protection “Due to PXP’s generosity and civic mindedness … [using] their facility, nearly 200 firefighters have received important Survival Training.” Ron Lawrence - Central Regional Training/Safety Captain Los Angeles County Fire Department “The Culver City Fire Department is f
Slide 117: Commendations - California Offshore
Commendations California Offshore Ranked MMS’s Best Operator in the Pacific OCS for Safety of Platform and Pipeline Operations in Three of the Last Four Years MMS Recognized PXP Executive V.P., Tom Gladney, in 2001 for His Efforts in Assisting Them Manage the Nation’s Resources in a Safe, Environmen
Slide 118: Commendations - California Onshore
Commendations California Onshore Unprecedented Two Commendations From the Air Pollution Control District for Emissions Reductions and Use of Innovative Emissions Control Technology at the Arroyo Grande Oil Field Division of Oil, Gas and Geothermal Resources (DOGGR) Lease Maintenance Awards for Outst
Slide 119: What's Next
What’s Next Successful Permitting of Tranquillon Ridge Support Development Opportunities Created by 3-D Seismic Data Evaluation Facilitate Real Estate Development Opportunities
Slide 120: Successful Execution Takes Vision
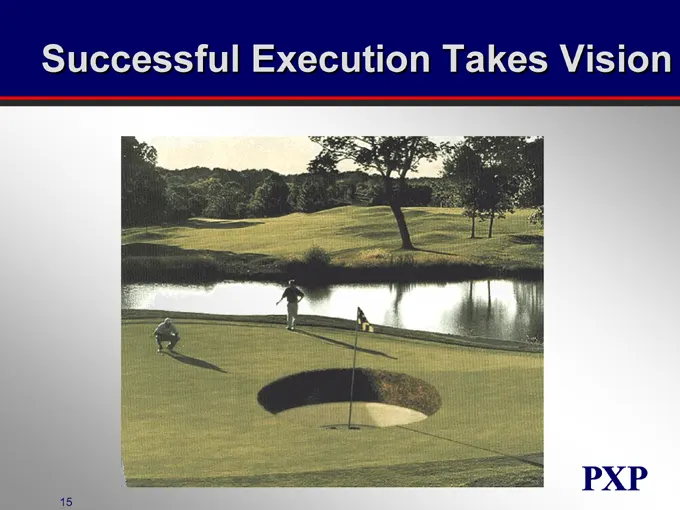
Successful Execution Takes Vision
Slide 121: California Republic
CALIFORNIA REPUBLIC Producing California Oil To Meet California’s Energy Needs
Slide 122: Central Business Unit
PLAINS EXPLORATION & PRODUCTION COMPANY Central Business Unit Richard Pendleton Vice President NYSE: PXP www.plainsxp.com
Slide 123: Central Business Unit Who We Are
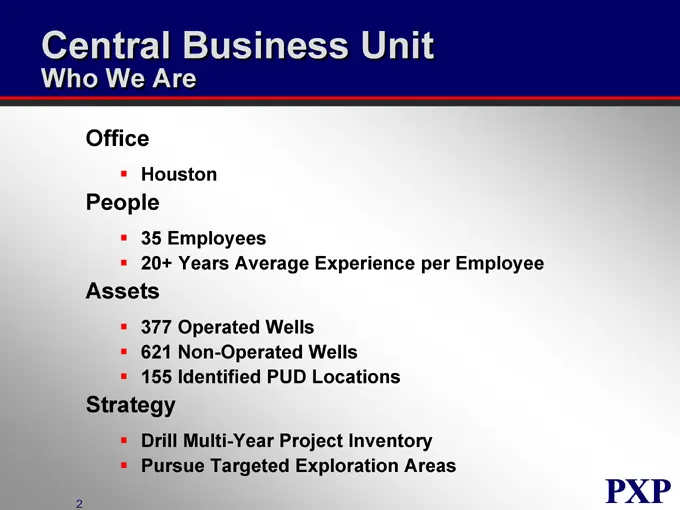
Central Business Unit Who We Are Office Houston People 35 Employees 20+ Years Average Experience per Employee Assets 377 Operated Wells 621 Non-Operated Wells 155 Identified PUD Locations Strategy Drill Multi-Year Project Inventory Pursue Targeted Exploration Areas
Slide 124: Central Business Unit Overview
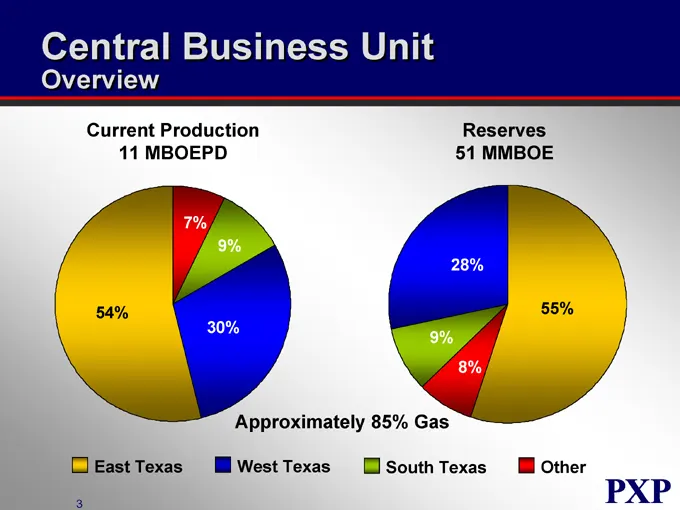
Central Business Unit Overview Current Production 11 MBOEPD Reserves 51 MMBOE 7% 9% 54% 30% 28% 55% 9% 8% Approximately 85% Gas East Texas West Texas South Texas Other
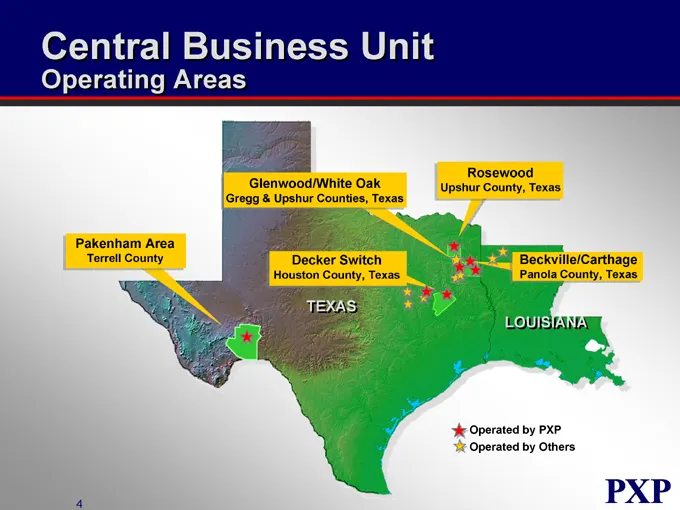
Slide 125: Central Business Unit Operating Areas
Central Business Unit Operating Areas Pakenham Area Terrell County Glenwood/White Oak Gregg & Upshur Counties, Texas Decker Switch Houston County, Texas Rosewood Upshur County, Texas Beckville/Carthage Panola County, Texas LOUISIANA TEXAS Operated by PXP Operated by Others
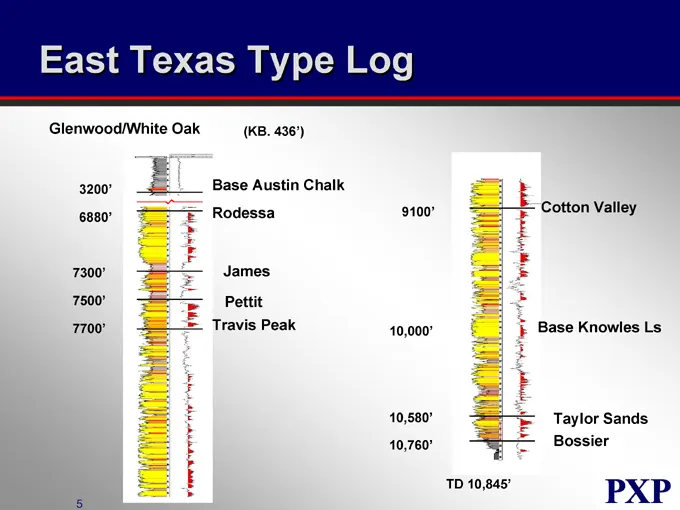
Slide 126: East Texas Type Log
East Texas Type Log Glenwood/White Oak (KB. 436’) 3200’ 6880’ 7300’ 7500’ 7700’ Base Austin Chalk Rodessa James Pettit Travis Peak 9100’ 10,000’ 10,580’ 10,760’ Cotton Valley Base Knowles Ls Taylor Sands Bossier TD 10,845’
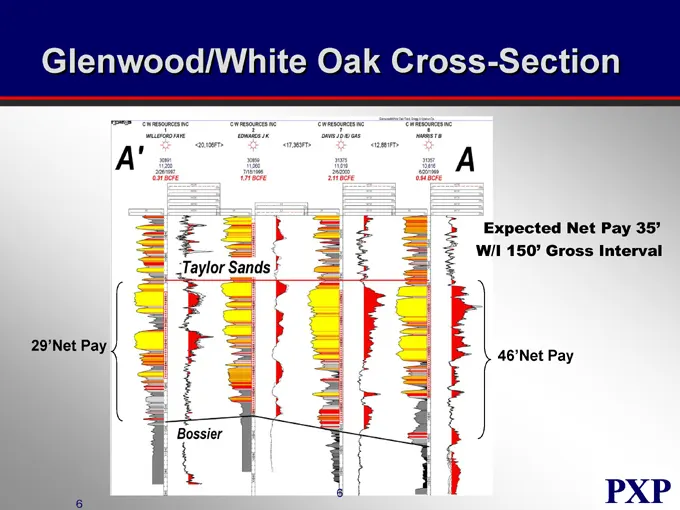
Slide 127: Glenwood/White Oak Cross-Section
Glenwood/White Oak Cross-Section 29’Net Pay Expected Net Pay 35’ W/I 150’ Gross Interval 46’Net Pay Taylor Sands Bossier C W RESOURCES INC 1 WILLEFORD FAYE C W RESOURCES INC 2 EDWARDS J K C W RESOURCES INC 7 DAVIS J D /E/GAS C W RESOURCES INC 8 HARRIS T B <20,106FT> <17,363FT> <12,881FT> 30891 11,20
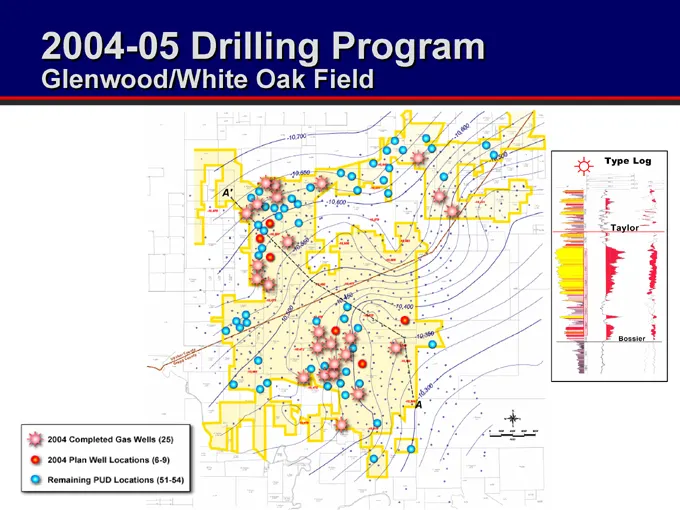
Slide 128: 2004-05 Drilling Program Glenwood/White Oak Field
2004-05 Drilling Program Glenwood/White Oak Field Type Log Taylor Bossier Completed Gas Wells (25) 2004 Plan Well Locations (6-9) Remaining PUD Locations (51-54)
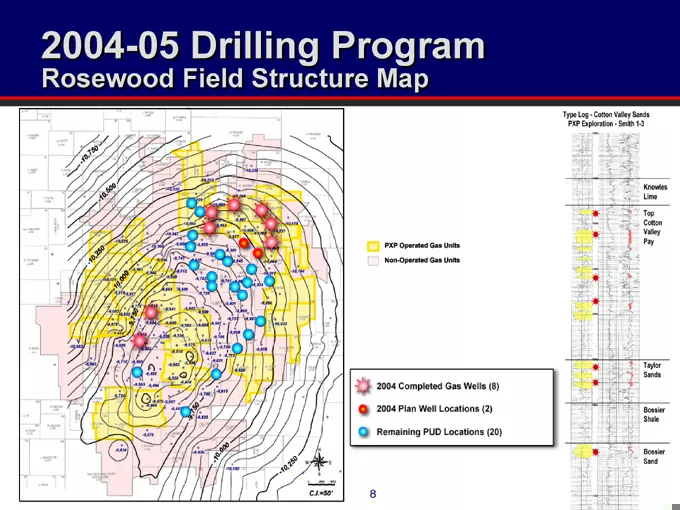
Slide 129: 2004-05 Drilling Program Rosewood Field
2004-05 Drilling Program Roseweed Field Structure Map PXP Operated Gas Units Non-Operated Gas Units Type Log – Ctton Valley Sands PXP Exploration – Smith 1-3 Knowles Lime Top Cotton Valley Pay 2004 Completed Gas Wells (8) 2004 Plan Well Locations (2) Remaining PUD Locations (20) Taylor Sands Bossier
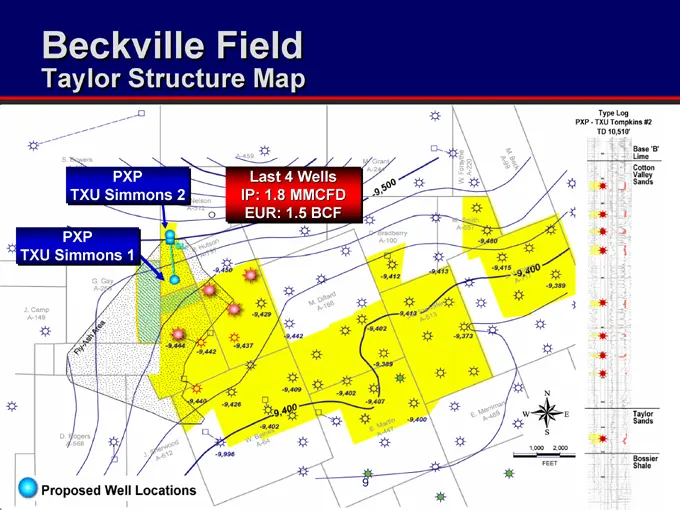
Slide 130: Beckville Field
Beckville Field Taylor Structure Map PXP TXU Simmons 2 PXP TXU Simmons 1 Last 4 Wells IP: 1.8 MMCFD EUR: 1.5 BCF Type Log PXP - TXU Tompkins #2 TD 10,510’ Base ‘B’ Lime Cotton Valley Sands Taylor Sands Bossier Shale Proposed Well Locations FEET
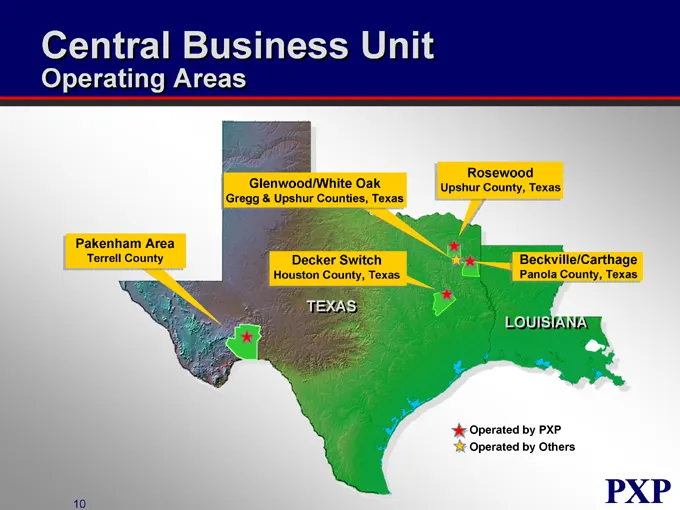
Slide 131: Central Business Unit Operating Areas
Central Business Unit Operating Areas Pakenham Area Terrell County Glenwood/White Oak Gregg & Upshur Counties, Texas Rosewood Upshur County, Texas Decker Switch Houston County, Texas Beckvelle/Carthage Panola County, Texas TEXAS LOUISIANA Operated by PXP Operated by Others PXP
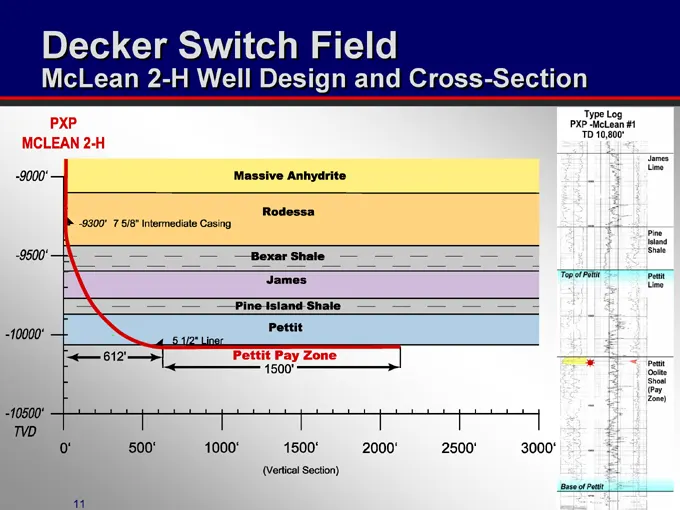
Slide 132: Decker Switch Field McLean 2-H Well Design
Decker Switch Field McLean 2-H Well Design and Cross-Section PXP MCLEAN 2-H -9000’ -9500’ -10000’ -10500’ TVD 0’ 500’ 1000’ 1500’ 2000’ 2500’ 3000’ (Vertical Section) -9300’ 7 5/8 Intermediate Casing 5 ½” Liner 612’ Massive Anhydrite Rodessa Bexar Shale James Pine Island Shale Pettit Pettit Pay Zone
Slide 133: East Texas Indicative Returns
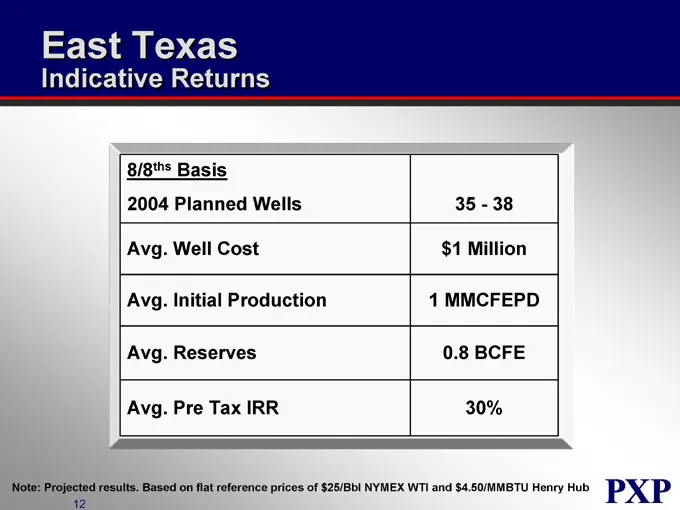
East Texas Indicative Returns 8/8ths Basis 2004 Planned Wells 35-38 Avg. Well Cost $1 Million Avg. Initial Production 1 MMCFEPD Avg. Reserves 0.8 BCFE Avg. Pre Tax IRR 30% Note: Projected results. Based on flat reference prices of $25/Bbl NYMEX WTI and $4.50/MMBTU Henry Hub PXP
Slide 134: Central Business Unit Operating Areas
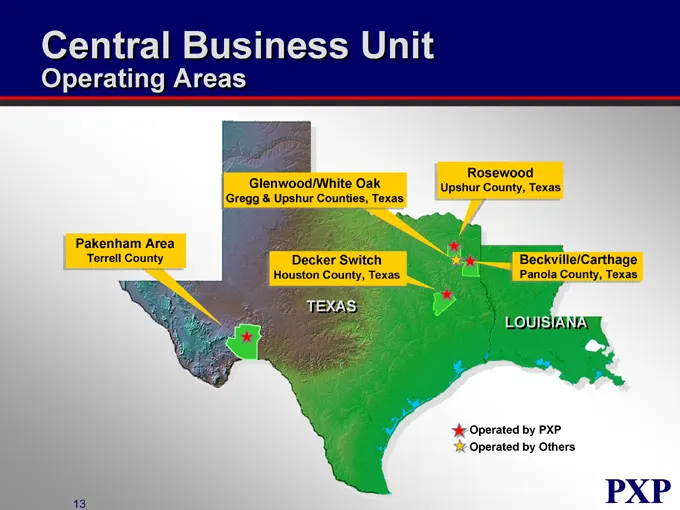
Central Business Unit Operating Areas Glenwood/White Oak Gregg & Upshur Counties, Texas Rosewood Upshur County, Texas Pakenham Area Terrell County Decker Switch Houston County, Texas Beckville/Carthage Panola County, Texas TEXAS LOUISIANA Operated by PXP Operated by Others PXP
Slide 135: Pakenham Area
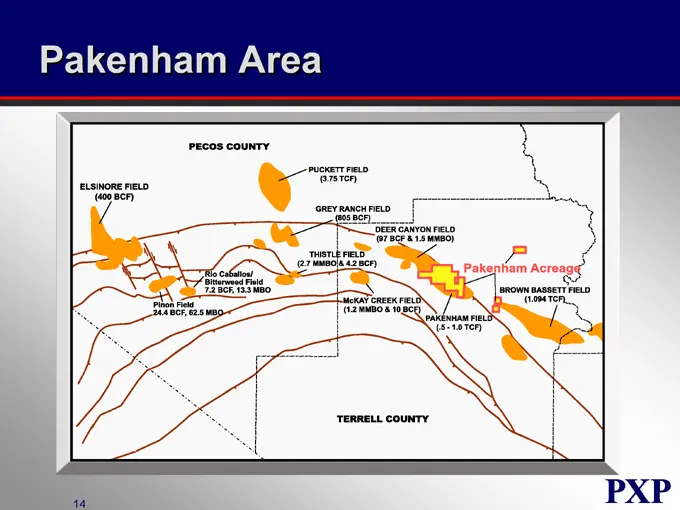
Pakenham Area PECOS COUNTY ELSINORE FIELD(400 BCF) PUCKETT FIELD(3.75 TCF) GREY RANCH FIELD(805 BCF) DEER CANYON FIELD(97 BCF & 1.5 MMBO) THISTLE FIELD(2.7 MMBO & 4.2 BCF) Rio Caballos/ Bitterweed Field 7.2 BCF, 13.3 MBO Pinon Field 24.4 BCF, 62.5 MBO McKAY CREEK FIELD (1.2 MMBO & 10 BCF) PAKENHAM F
Slide 136: Pakenham Area Cross-Section
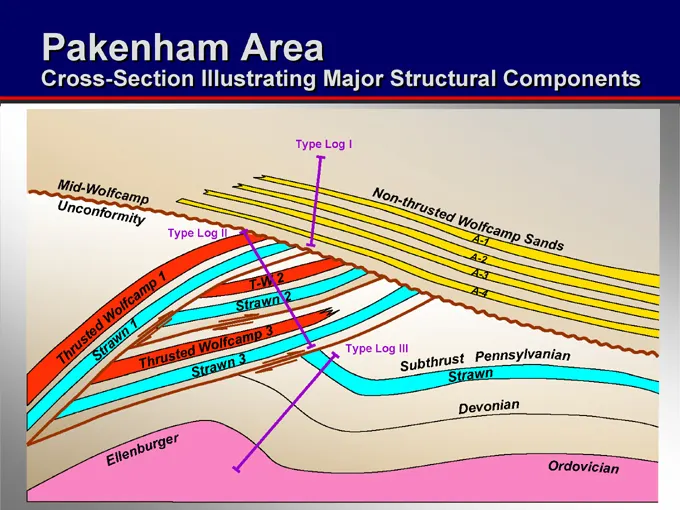
Pakenham Area Cross-Section Illustrating Major Structural Components Type Log I Type Log II Type Log III Mid-Wolfcamp Unconformity Non-thrusted Wolfcamp Sands A-1 A-2 A-3 A-4 Thrusted Wolfcamp 1 Strawn 1 T-W 2 Strawn 2 Thrusted Wolfcamp 3 Strawn 3 Subthrust Pennsylvanian Strawn Devonian Ellenburger
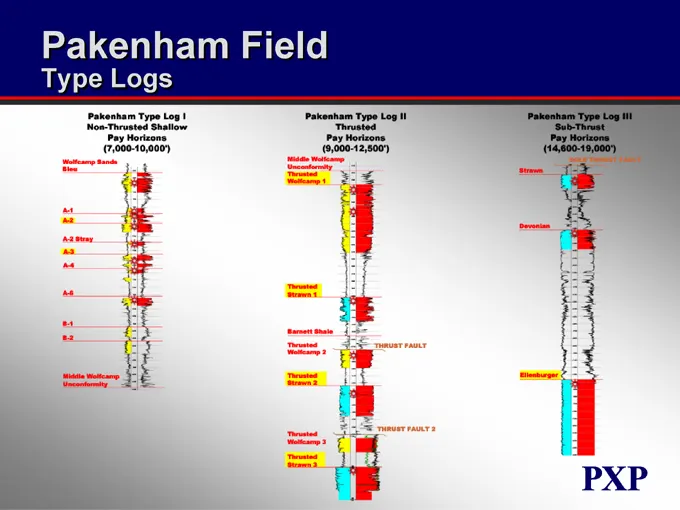
Slide 137: Pakenham Field Type Logs
Pakenham Field Type Logs Pakenham Type Log I Non-Thrusted Shallow Pay Horizons (7,000-10,000’) Pakenham Type Log II Thrusted Pay Horizons (9,000-12,500’) Pakenham Type Log III Sub-Thrust Pay Horizons (14,600-19,000’) Wolfcamp Sands Bleu A-1 A-2 A-2 Stray A-3 A-4 A-6 B-1 B-2 Middle Wolfcamp Unconform
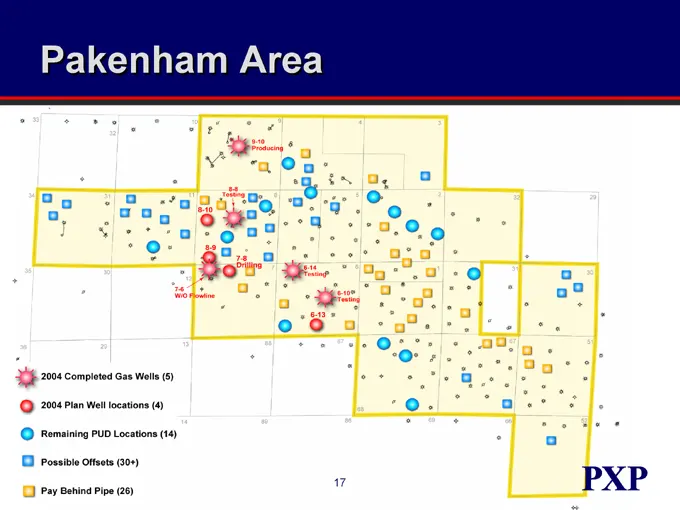
Slide 138: Pakenham Area
Pakenham Area 9-10 Producing 8-8 Testing 8-10 8-9 7-8 Drilling 7-6 W/O Flowline 6-14 Testing 6-10 Testing 6-13 2004 Completed Gas Wells (5) 2004 Plan Well locations (4) Remaining PUD Locations (14) Possible Offsets (30+) Pay Behind Pipe (26) PXP
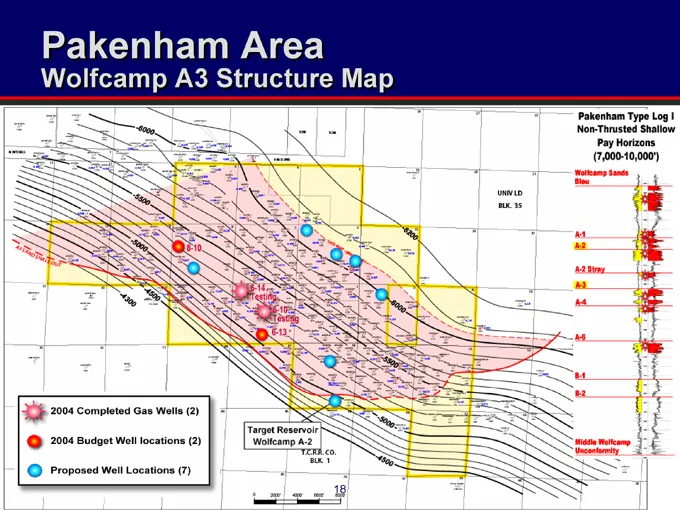
Slide 139: Pakenham Area Wolfcamp A3 Structure Map
Pakenham Area Wolfcamp A3 Structure Map Pakenham Type Log I Non-Thrusted Shallow Pay Horizons(7,000-10,000’) UNIV LD BLK. 35 Wolfcamp Sands Bleu A-1 A-2 A-2 Stray A-3 A-4 A-6 B-1 B-2 Middle Wolfcamp Unconformity 2004 Completed Gas Well (2) 2004 Budget Well locations (2) Proposed Well Locations (7) T
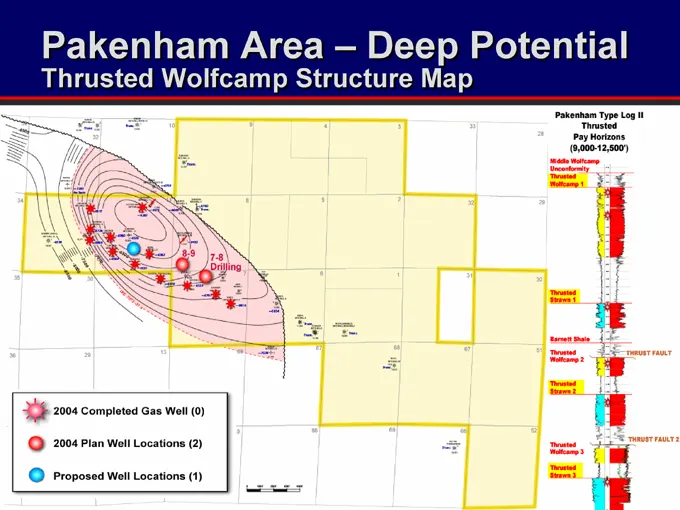
Slide 140: Pakenham Area - Deep Potential
Pakenham Area - Deep Potential Thrusted Wolfcamp Structure Map Pakenham Type Log II Thrusted Pay Horizons (9,000-12,500’) Middle Wolfcamp Unconformity Thrusted Wolfcamp 1 8-9 7-8 Drilling Thrusted Strawn 1 Barnett Shale Thrusted Wolfcamp 2 Thrusted Strawn 2 THRUST FAULT THRUST FAULT 2 Thrusted Wolfc
Slide 141: Pakenham Area Deep Potential Strawn Structure Map
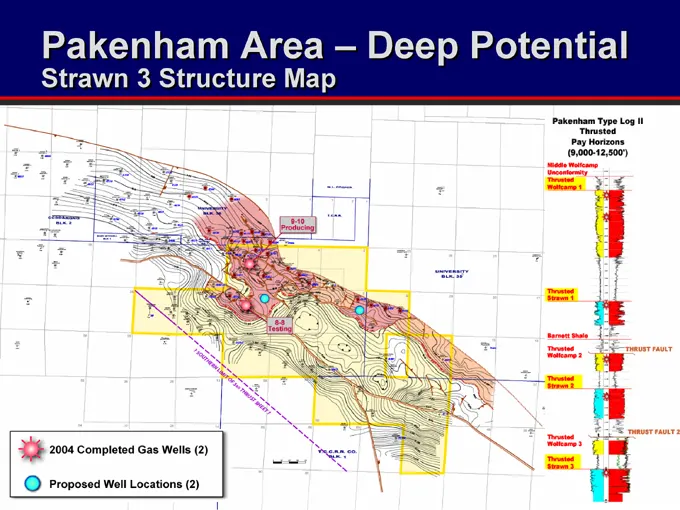
Pakenham Area – Deep Potential Strawn 3 Structure Map Pakenham Type Log II Thrusted Pay Horizons (9,000-12,500’) Middle Wolfcamp Unconfermity Thrusted Wolfcamp 1 Thrusted Strawn 1 Barnett Shale Thrusted Wolfcamp 2 Thrusted Strawn 2 Thrusted Wolfcamp 3 Thrusted Strawn 3 THRUST FAULT THRUST FAULT 2 20
Slide 142: Pakenham Area Top of Ellenburger Structure Map
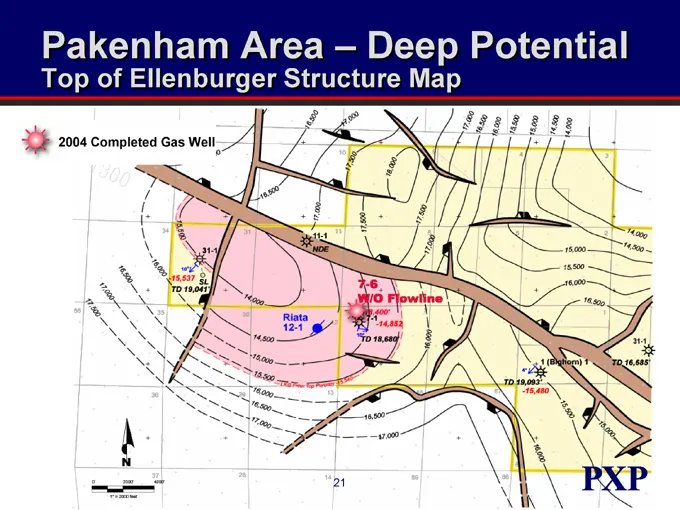
Pakenham Area – Deep Potential Top of Ellenburger Structure Map 2004 Completed Gas Well 17,000 16,500 16,000 15,500 15,000 14,500 14,000 31-1 15,537 TD 19,041’ SL 11-1 NDE 7-6 W/O Flowline Riata 12-1 TD 18,680’ 1 (Bighorn) 1 TD 16,685’ TD 19,093’ -15,480 18,400’ 7-1
Slide 143: Pakenham Area Indicative Returns
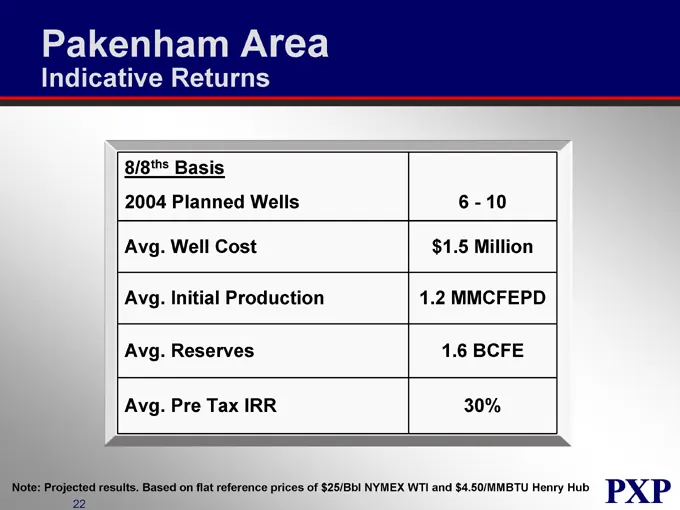
Pakenham Area Indicative Returns 8/8ths Basis 2004 Planned Wells 6 - 10 Avg. Well Cost $1.5 Million Avg. Initial Production 1.2 MMCFEPD Avg. Reserves 1.6 BCFE Avg. Pre Tax IRR 30% Note: Projected results. Based on flat reference prices of $25/Bbl NYMEX WTI and $4.50/MMBTU Henry Hub
Slide 144: Central Business Unit Strategy
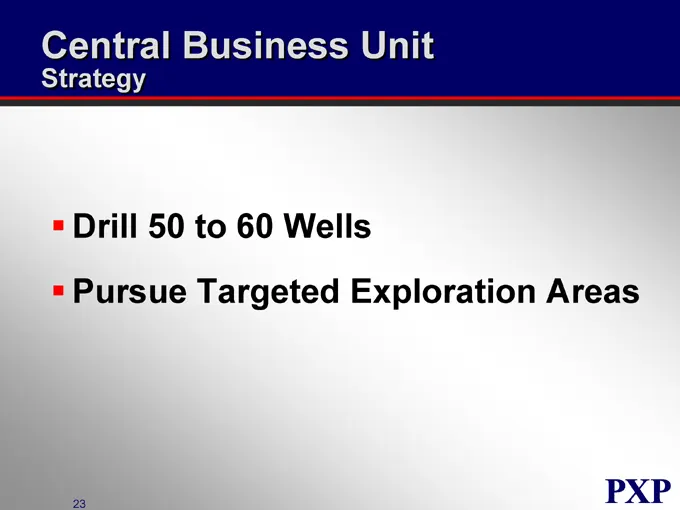
Central Business Unit Strategy Drill 50 to 60 Wells Pursue Targeted Exploration Areas
Slide 145: Plains Exploration & Production Company
PLAINS EXPLORATION & PRODUCTION COMPANY NYSE: PXP www.plainsxp.com
Slide 146: Eastern Business Unit
PLAINS EXPLORATION & PRODUCTION COMPANY Eastern Business Unit Doss Bourgeois Vice President NYSE : PXP www.plainsxp.com
Slide 147: Eastern Business Unit Who We Are
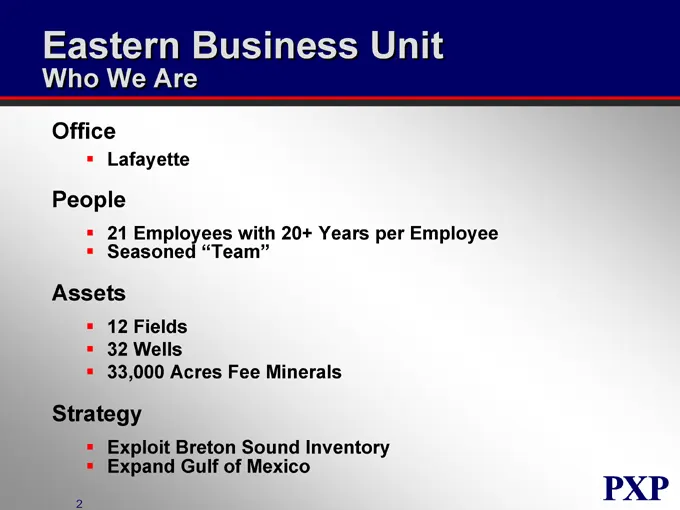
Eastern Business Unit Who We Are Office Lafayette People 21 Employees with 20+ Years per Employee Seasoned “Team” Assets 12 Fields 32 Wells 33,000 Acres Fee Minerals Strategy Exploit Breton Sound Inventory Expand Gulf of Mexico
Slide 148: Eastern Business Unit Overview
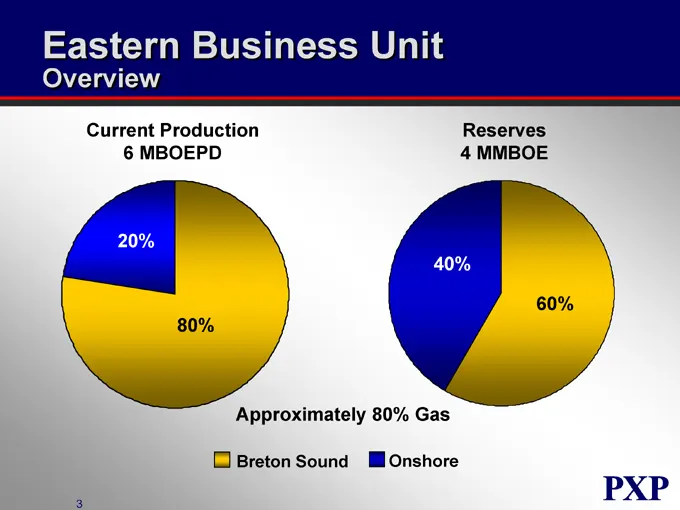
Eastern Business Unit Overview Current Production 6 MBOEPD 20% 80% Reserves 4 MMBOE 40% 60% Approximately 80% Gas Breton Sound Onshore
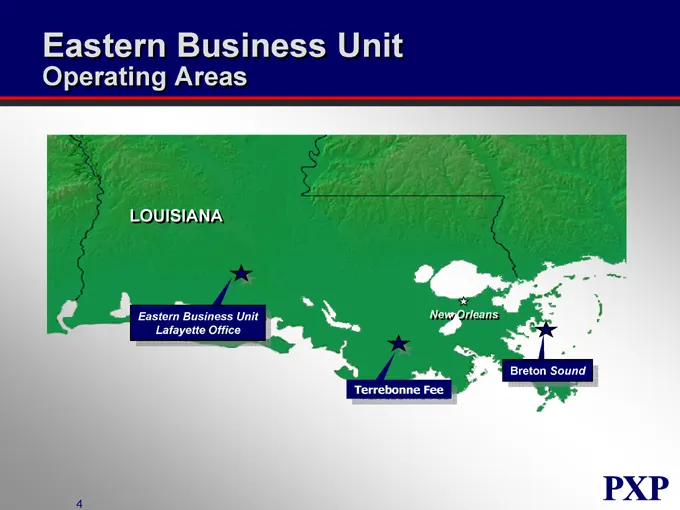
Slide 149: Eastern Business Unit Operating Areas
Eastern Business Unit Operating Areas LOUISIANA Eastern Business Unit Lafayette Office Terrebonne Fee New Orleans Breton Sound
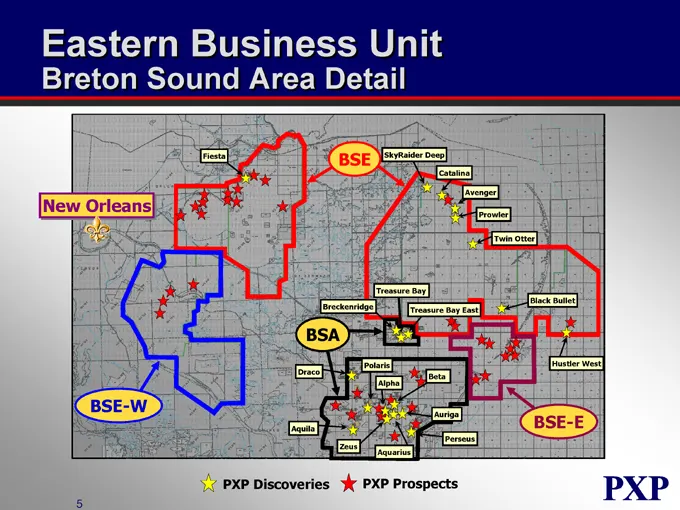
Slide 150: Breton Sound Area Detail
Eastern Business Unit Breton Sound Area Detail New Orleans Fiesta BSE SkyRaider Deep Avenger Catalina Prowler Twin Otter Black Bullet Treasure Bay Breckenridge Treasure Bay East Hustler West BSA Draco Polaris Alpha Beta Aquila Zeus Aquarius Auriga Perseus BSE-E BSE-W PXP Discoveries PXP Prospects
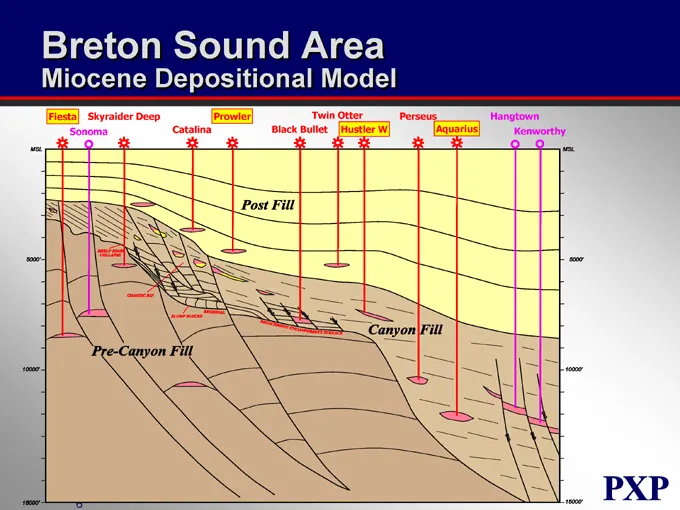
Slide 151: Breton Sound Area Miocene Depositional Model
Breton Sound Area Miocene Depositional Model Fiesta Skyraider Deep Prowler Twin Otter Perseus Hangtown Sonoma Catalina Black Bullet Hustler W Aquarius Kenworthy Post Fill Pre-Canyon Fill Canyon Fill Msl 5000’ 10000’ 15000’ 5000’ 10000’ 15000’ SHELF EDGE COLLAPSE CHAOTIC DIP SLUMP BLOCKS REGIONAL DET
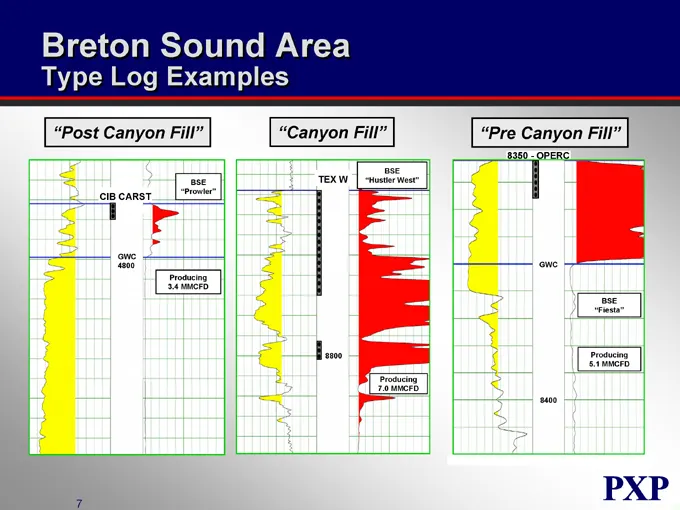
Slide 152: Breton Sound Area Type Log Examples
Breton Sound Area Type Log Examples “Post Canyon Fill” “Canyon Fill” “Pre Canyon Fill” CIB CARST BSE “Prowler” TEX W BSE “Hustler West” 8350—OPERC GWC 4800 Producing 3.4 MMCFD GWC Producing 7.0 MMCFD BSE “Fiesta” Producing 5.1 MMCFD
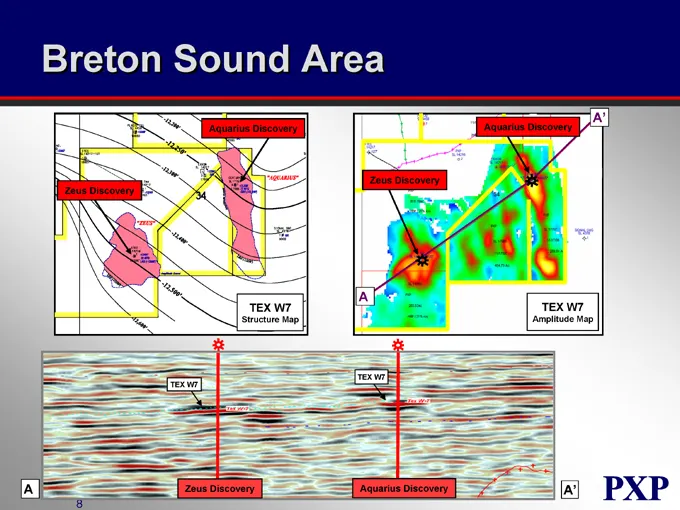
Slide 153: Breton Sound Area
Breton Sound Area A’ Aquarius Discovery Aquarius Discovery Zeus Discovery Zeus Discovery A TEX W7 TEX W7 Structure Map Amplitude Map TEX W7 TEX W7 A Zeus Discovery Aquarius Discovery A’
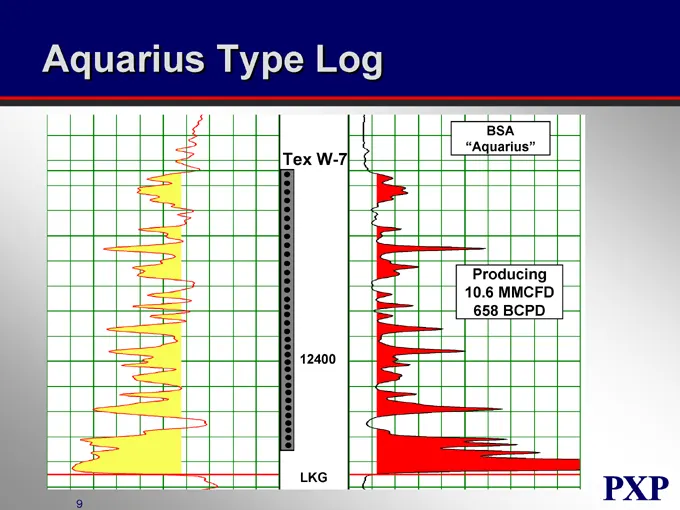
Slide 154: Aquarius Type Log
Aquarius Type Log Tex W-7 BSA “Aquarius” Producing 10.6 MMCFD 658 BCPD LKG
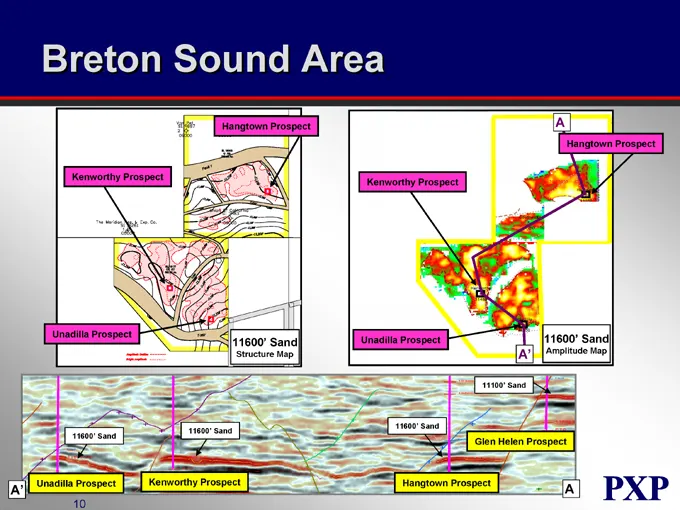
Slide 155: Breton Sound Area Hangtown Prospect
Breton Sound Area Hangtown Prospect A Hangtown Prospect Kenworthy Prospect Kenworthy Prospect Unadilla Prospect 11600’ Sand Structure Map Unadilla Prospect 11600’ Sand A’ Amplitude Map 11100’ Sand 11600’ Sand 11600’ Sand 11600’ Sand Glen Helen Prospect Unadilla Prospect A’ Kenworthy Prospect Hangtow
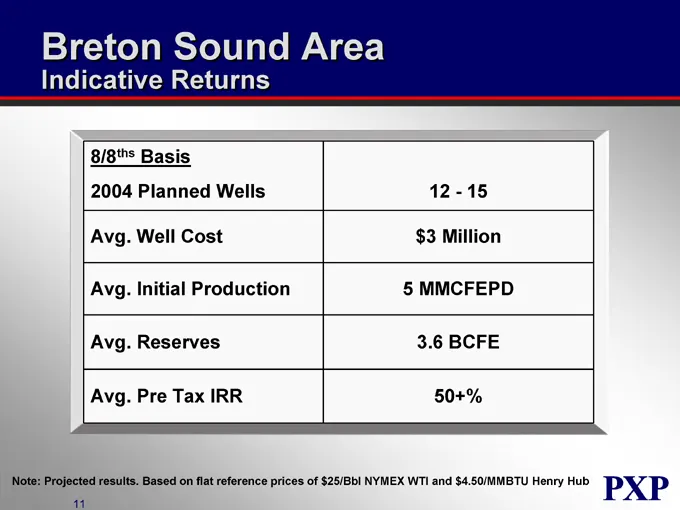
Slide 156: Breton Sound Area Indicative Returns
Breton Sound Area Indicative Returns 8/8ths Basis 2004 Planned Wells 12 - 15 Avg. Well Cost $3 Million Avg. Initial Production 5 MMCFEPD Avg. Reserves 3.6 BCFE Avg. Pre Tax IRR 50+% Note: Projected results. Based on flat reference prices of $25/Bbl NYMEX WTI and $4.50/MMBTU Henry Hub
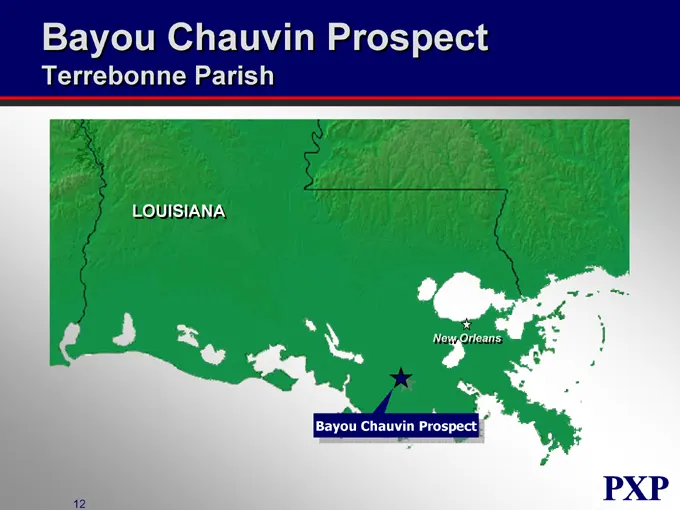
Slide 157: Bayou Chauvin Prospect
Bayou Chauvin Prospect Terrebonne Parish LOUISIANA New Orleans Bayou Chauvin Prospect
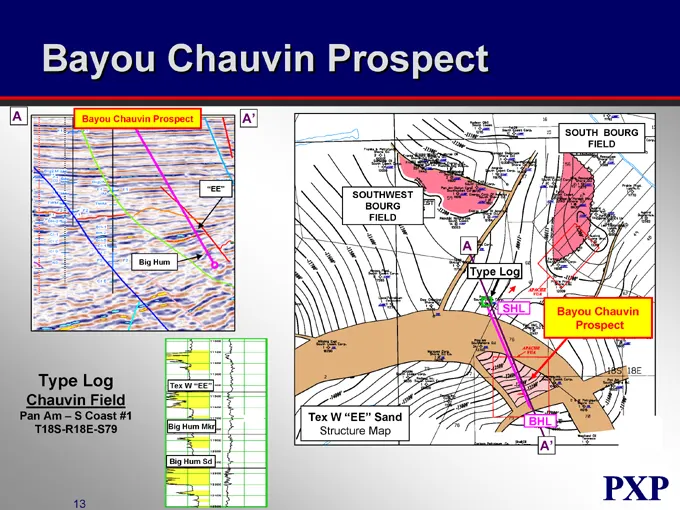
Slide 158: Bayou Chauvin Prospect
Bayou Chauvin Prospect A Bayou Chauvin Prospect A’ SOUTH BOURG FIELD “EE” SOUTHWEST BOURG FIELD Big Hum A Type Log SHL Bayou Chauvin Prospect Tex W “EE” Big Hum Mkr Big Hum Sd Tex W “EE” Sand Structure Map BHL A’ Type Log Chauvin Field Pan Am – S Coast #1 T18S-R18E-S79
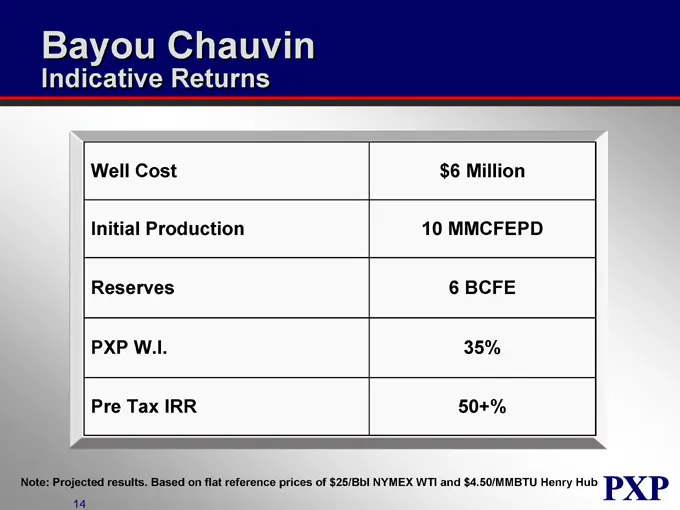
Slide 159: Bayou Chauvin Indicative Returns
Bayou Chauvin Indicative Returns Well Cost $6 Million Initial Production 10 MMCFEPD Reserves 6 BCFE PXP W.I. 35% Pre Tax IRR 50+% Note: Projected results. Based on flat reference prices of $25/Bbl NYMEX WTI and $4.50/MMBTU Henry Hub
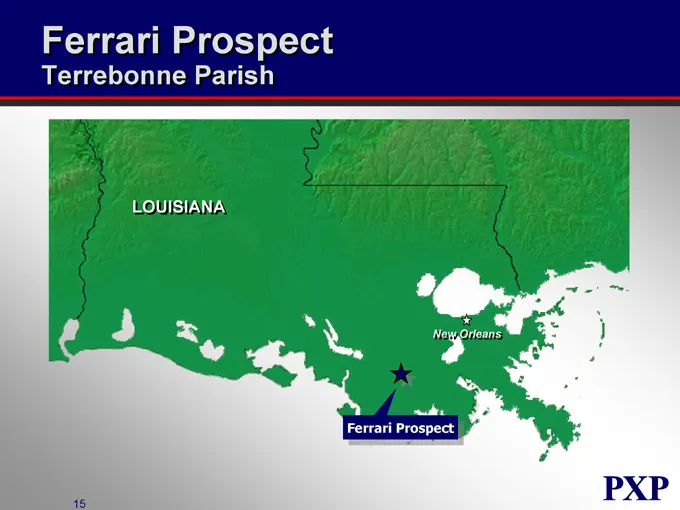
Slide 160: Ferrari Prospect
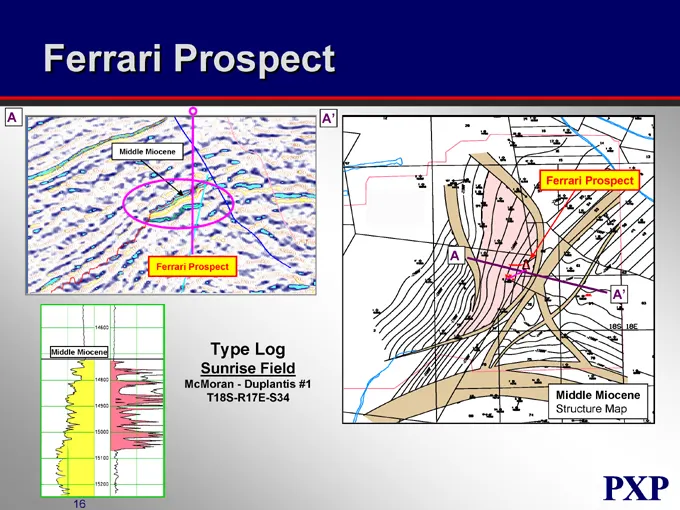
Ferrari Prospect Terrebonne Parish LOUISIANA New Orleans Ferrari Prospect
Slide 161: Ferrari Prospect
Ferrari Prospect A A’ Middle Miocene Ferrari Prospect Ferrari Prospect Middle Miocene A A’ Middle Miocene Structure Map Type Log Sunrise Field McMoran—Duplantis #1 T18S-R17E-S34
Slide 162: Ferrari Indicative Returns
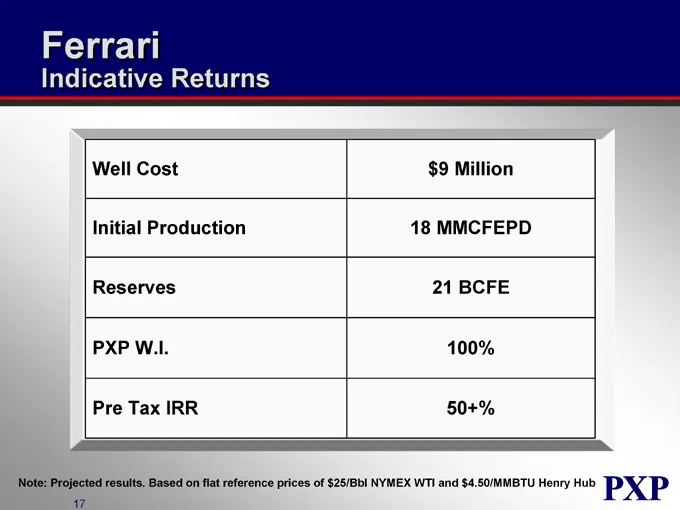
Ferrari Indicative Returns Well Cost $9 Million Initial Production 18 MMCFEPD Reserves 21 BCFE PXP W.I. 100% Pre Tax IRR 50+% Note: Projected results. Based on flat reference prices of $25/Bbl NYMEX WTI and $4.50/MMBTU Henry Hub
Slide 163: Eastern Business Unit Project Inventory
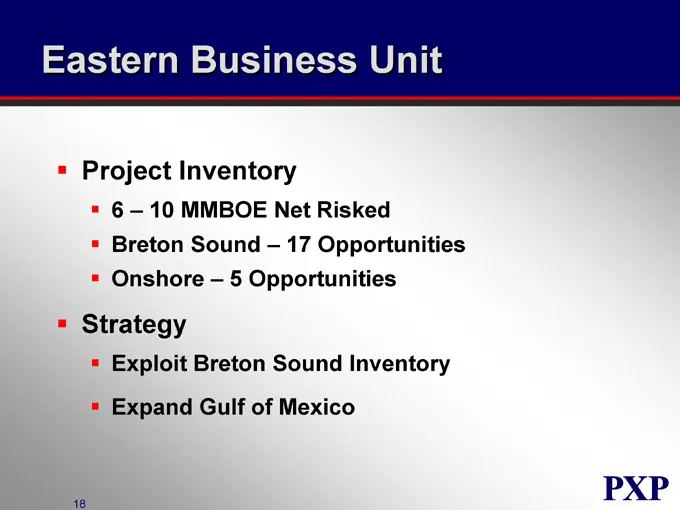
Eastern Business Unit Project Inventory 6 – 10 MMBOE Net Risked Breton Sound – 17 Opportunities Onshore – 5 Opportunities Strategy Exploit Breton Sound Inventory Expand Gulf of Mexico
Slide 164: Plains Exploration & Production Company
PLAINS EXPLORATION & PRODUCTION COMPANY NYSE : PXP www.plainsxp.com
Slide 165: Real Estate Activities
PLAINS EXPLORATION & PRODUCTION COMPANY Real Estate Activities Tom Gladney Executive Vice President Exploration & Production NYSE:PXP www.plainsxp.com
Slide 166: Real Estate Activities Overview
Real Estate Activities Overview Maximize Present Value of PXP Surface Holdings Determine Relative Oilfield vs. Sales Values Sell “Excess” Acreage Pursue Entitlements to Maximize Sales Value Apply PXP Experience in Dealing with Relevant Government and Environmental Groups
Slide 167: California Locator Map
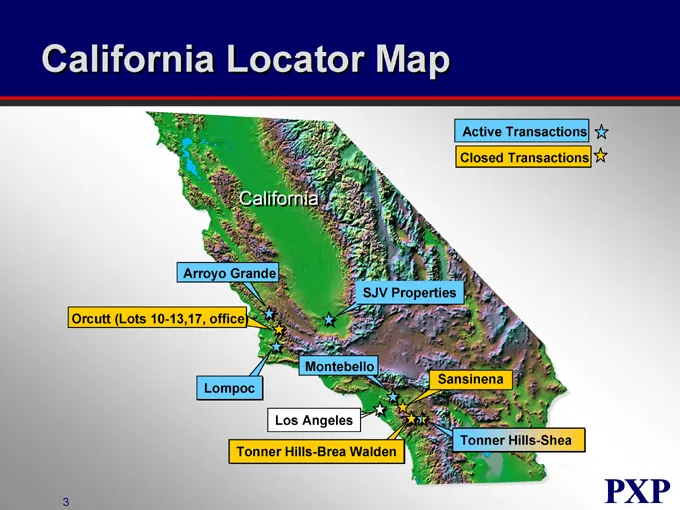
California Locator Map Active Transactions Closed Transactions California Arroyo Grande Orcutt (Lots 10-13,17, office) SJV Properties Lompoc Montebello Sansinena Los Angeles Tonner Hills-Brea Walden Tonner Hills-Shea
Slide 168: Tonner Hills
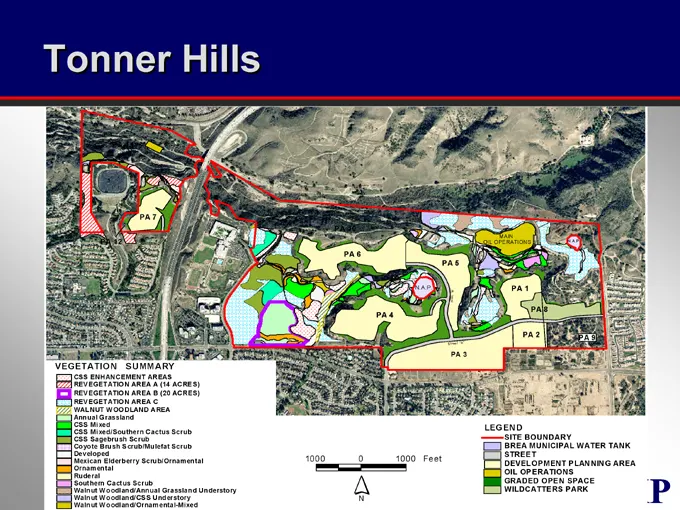
Tonner Hills Example of Prior Oilfield Sale 797 Acres Located within the City of Brea in Orange County, CA Entitled 180 Acres for Residential Developments of 795 Dwelling Units Property Sold in November, 2003 for $47 MM $41 MM of Proceeds Received to Date Remaining Proceeds to be Collected by Mid 20
Slide 169: Tonner Hills
Tonner Hills PA 7 PA 6 PA 4 PA 5 MAIN OIL OPERATIONS PA 1 PA 8 PA 2 PA 3 VEGETATION SUMMARY CSS ENHANCEMENT AREAS REVEGETATION AREA A (14 ACRES) REVEGETATION AREA B (20 ACRES) REV EGETATION AREA C WALNUT WOODLAND AREA Annual Grassland CSS Mixed CSS Mixed/Southern Cactus Scrub CSS Sagebrush Scrub Coy
Slide 170: Montebello
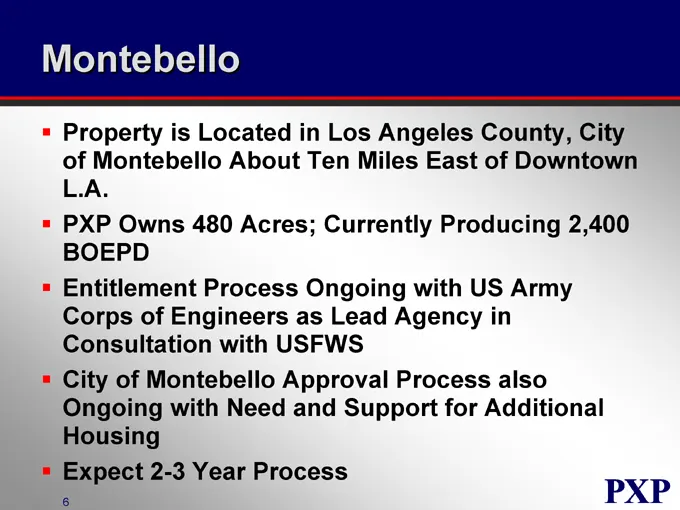
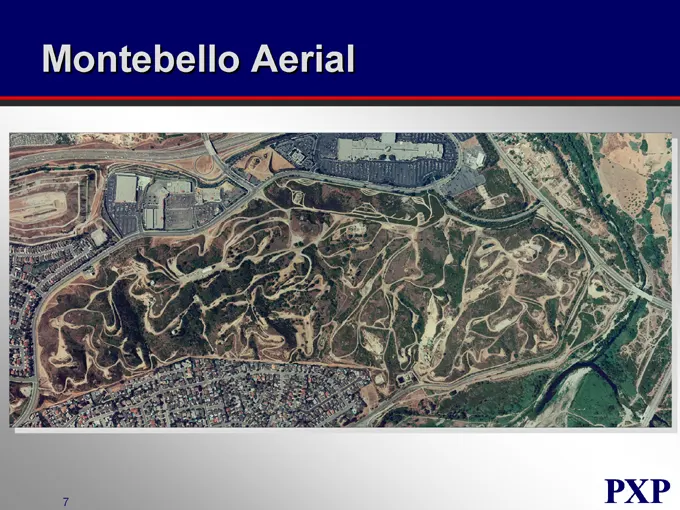
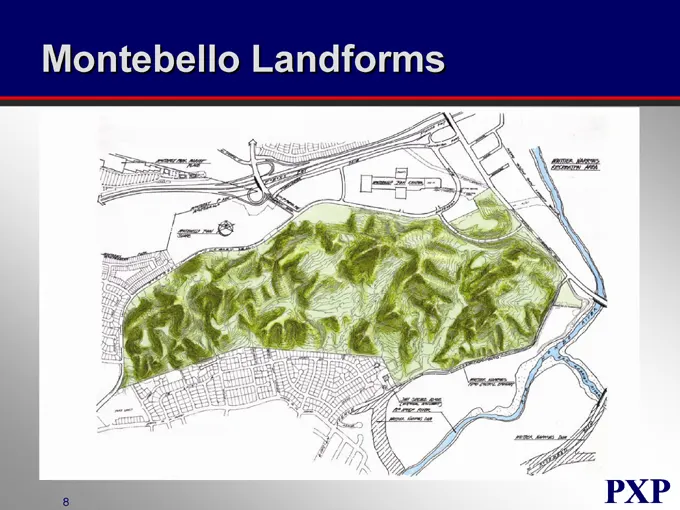
Montebello Property is Located in Los Angeles County, City of Montebello About Ten Miles East of Downtown L.A. PXP Owns 480 Acres; Currently Producing 2,400 BOEPD Entitlement Process Ongoing with US Army Corps of Engineers as Lead Agency in Consultation with USFWS City of Montebello Approval Process
Slide 171: Montebello Aerial
Montebello Aerial
Slide 172: Montebello Landforms
Montebello Landforms PXP
Slide 173: Lompoc
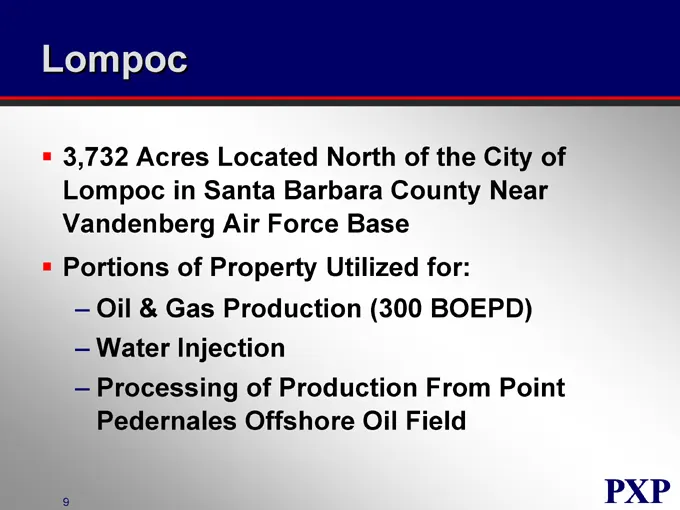
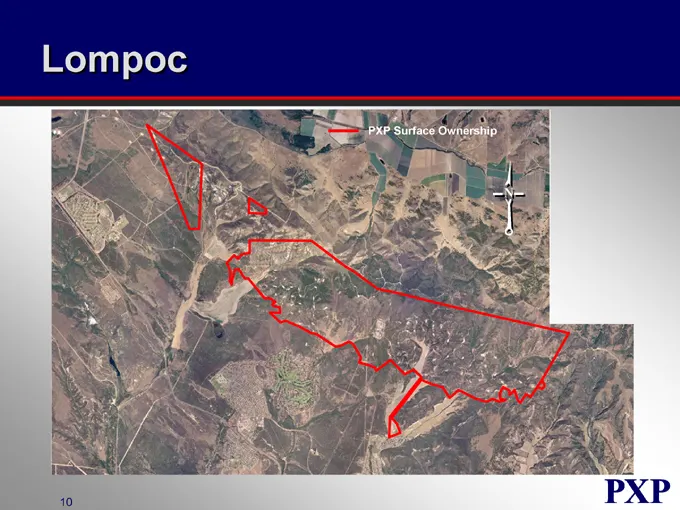
Lompoc 3,732 Acres Located North of the City of Lompoc in Santa Barbara County Near Vandenberg Air Force Base Portions of Property Utilized for: Oil & Gas Production (300 BOEPD) Water Injection Processing of Production From Point Pedernales Offshore Oil Field
Slide 174: Lompoc PXP Surface Ownership
Lompoc PXP Surface Ownership
Slide 175: Development Activities
Development Activities Filed Applications for Certificates of Compliance with SB County to Enable Sales of Individual Surface Parcels Evaluating Feasibility of Entitlements for Portions of the Property Will Continue Operation of Point Pedernales Processing Plant
Slide 176: Arroyo Grande
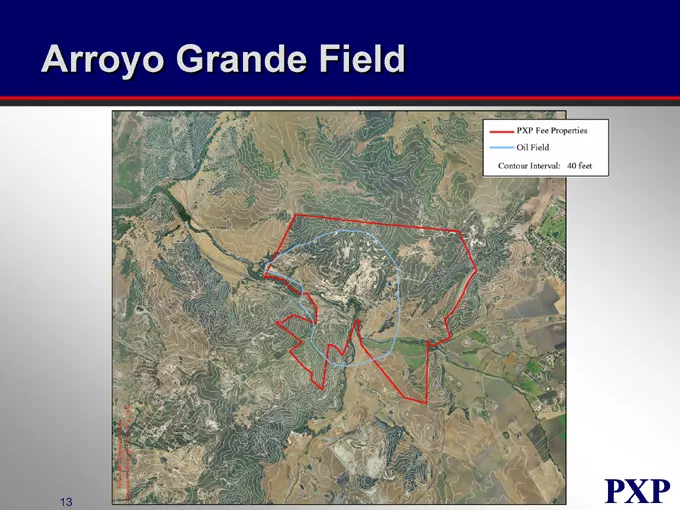
Arroyo Grande Property Located in San Luis Obispo County Three Miles Inland From Pismo Beach Surface Ownership Consists of About 1,040 Acres Approximately 350 Acres Falls Outside Current or Future Oil Field Operations Evaluating Alternatives to Maximize Value
Slide 177: Arroyo Grande Field PXP Fee Properties
Arroyo Grande Field PXP Fee Properties Oil Field Contour Interval: 40 feet
Slide 178: Other
Other San Joaquin Valley Pursuing Divestiture of 20 Surface Parcels Adjacent to Oil Properties Non-California Pursuing Divestiture of 40 Acre Non-Oil Field Property in Granite City, IL Pursuing Sale of 340 Acre Surface Parcel in Brazoria County, TX
Slide 179: Summary
Summary California Real Estate Market Provides Unique Non-Oil & Gas Value Opportunities for PXP Surface Holdings PXP-NEV Closed $48 MM of Real Estate Transactions in 2003 and YTD 2004 Proactive Effort by PXP to Capture Value Entitlements for Development Can Provide Significant Value Uplift with Effo
Slide 180: Plains Exploration & Production Company
PLAINS EXPLORATION & PRODUCTION COMPANY NYSE:PXP www.plainsxp.com
Slide 181: Financial Review
PLAINS EXPLORATION & PRODUCTION COMPANY Financial Review Steve Thorington Executive Vice President and Chief Financial Officer NYSE : PXP www.plainsxp.com
Slide 182: Financial Review
Financial Review Hedge Restructure Balance Sheet Guidance
Slide 183: Hedge Restructuring Strategy
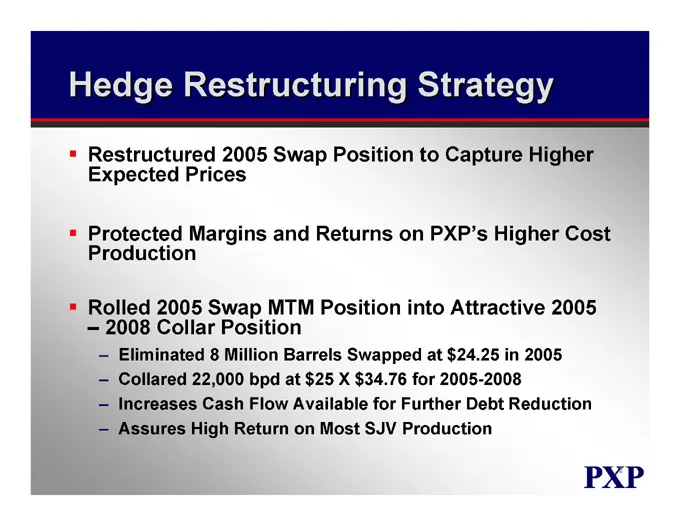
Hedge Restructuring Strategy Restructured 2005 Swap Position to Capture Higher Expected Prices Protected Margins and Returns on PXP’s Higher Cost Production Rolled 2005 Swap MTM Position into Attractive 2005-2008 Collar Position Eliminated 8 Million Barrels Swapped at $24.25 in 2005 Collared 22,000
Slide 184: Accounting Issues
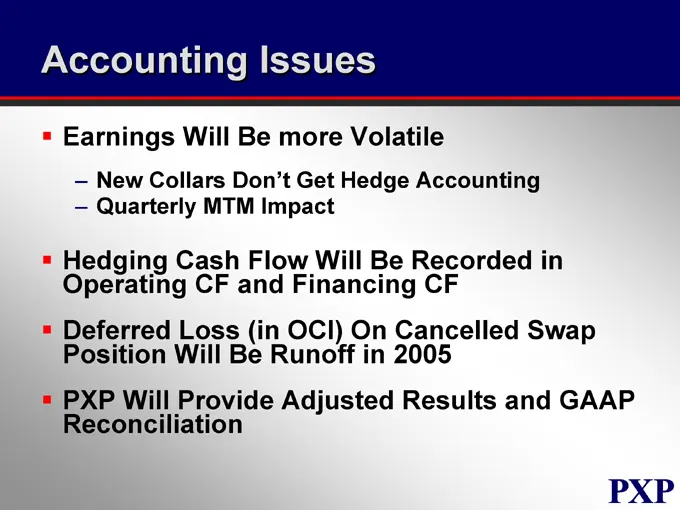
Accounting Issues Earnings Will Be more Volatile New Collars Don’t Get Hedge Accounting Quarterly MTM Impact Hedging Cash Flow Will Be Recorded in Operating CF and Financing CF Deferred Loss (in OCI) On Cancelled Swap Position Will Be Runoff in 2005 PXP Will Provide Adjusted Results and GAAP Reconci
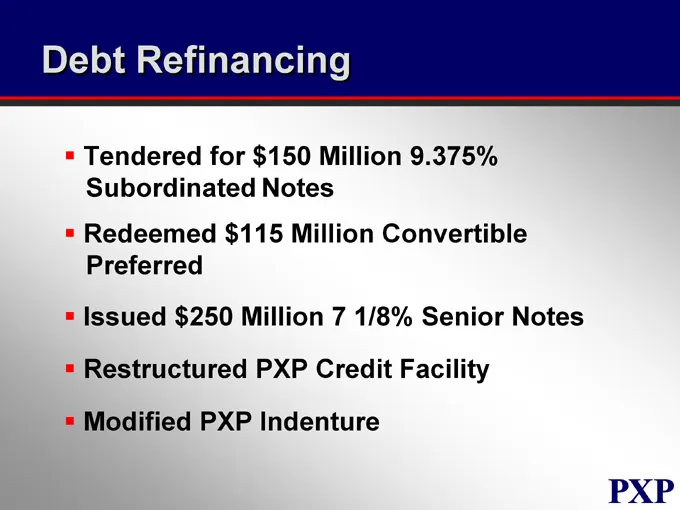
Slide 185: Debt Refinancing
Debt Refinancing Tendered for $150 Million 9.375% Subordinated Notes Redeemed $115 Million Convertible Preferred Issued $250 Million 7 1/8% Senior Notes Restructured PXP Credit Facility Modified PXP Indenture
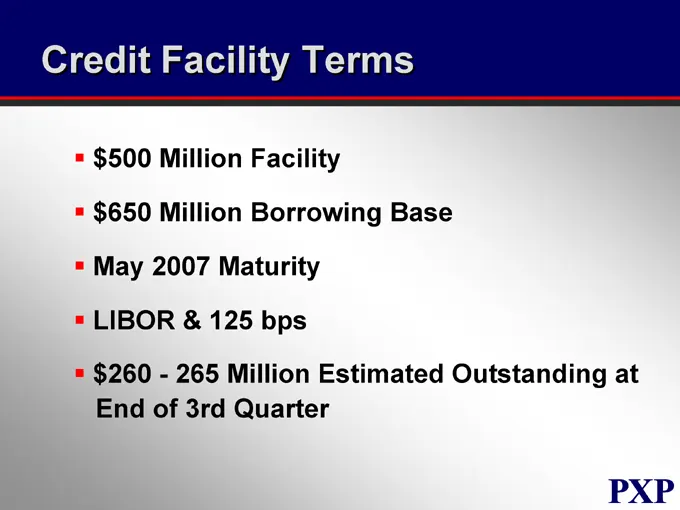
Slide 186: Credit Facility Terms
Credit Facility Terms $500 Million Facility $650 Million Borrowing Base May 2007 Maturity LIBOR & 125 bps $260—265 Million Estimated Outstanding at End of 3rd Quarter
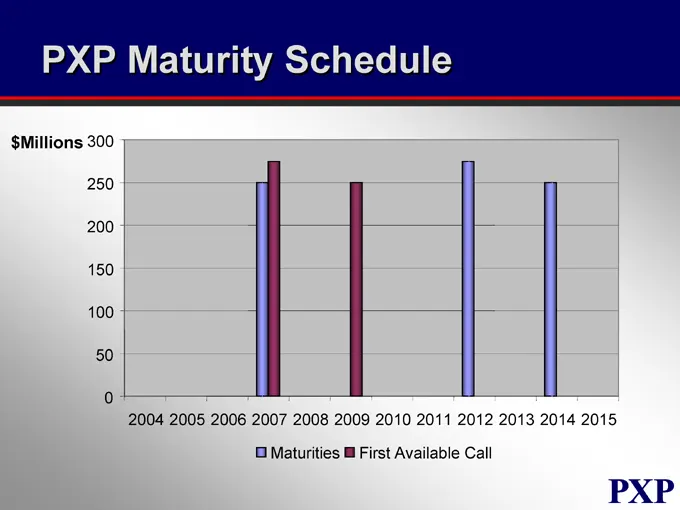
Slide 187: PXP Maturity Schedule
PXP Maturity Schedule $Millions 300 250 200 150 100 50 0 2004 2005 2006 2007 2008 2009 2010 2011 2012 2013 2014 2015 Maturities First Available Call
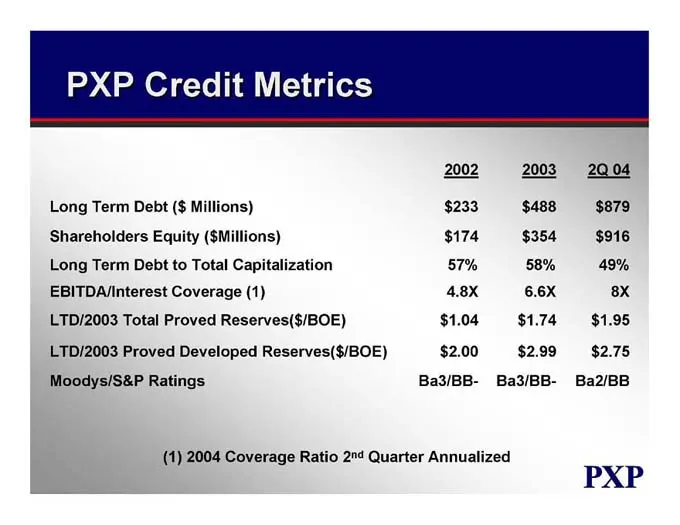
Slide 188: PXP Credit Metrics
PXP Credit Metrics 2002 2003 2Q 04 Long Term Debt ($ Millions) $233 $488 $879 Shareholders Equity ($Millions) $174 $354 $916 Long Term Debt to Total Capitalization 57% 58% 49% EBITDA/Interest Coverage (1) 4.8X 6.6X 8X LTD/2003 Total Proved Reserves($/BOE) $1.04 $1.74 $1.95 LTD/2003 Proved Developed
Slide 189: Plains Exploration & Production Company
PLAINS EXPLORATION & PRODUCTION COMPANY NYSE : PXP www.plainsxp.com
Source: SEC EDGAR · 8-K filed Oct 5, 2004
More decks from Plains Exploration & Production Company
 Global Metals, Mining & Steel Conference 201333 slides · May 14, 2013
 Q1 2013 Earnings Presentation46 slides · Apr 19, 2013
 Merger or Acquisition (February 2013)35 slides · Feb 25, 2013
 2013 Credit Suisse Energy Summit10 slides · Feb 5, 2013
 Merger or Acquisition (January 2013)30 slides · Jan 17, 2013
 Credit Suisse 2012 Energy Summit32 slides · Feb 7, 2012