Great Western Bancorp — Q1 FY2021 Earnings Presentation
38 slides from Great Western Bancorp's earnings presentation, Jan 27, 2021
Slide 1: Quarterly Investor Relations Presentation
Great Western Bancorp, Inc. Quarterly Investor Relations Presentation At and for the three months ended December 31, 2020
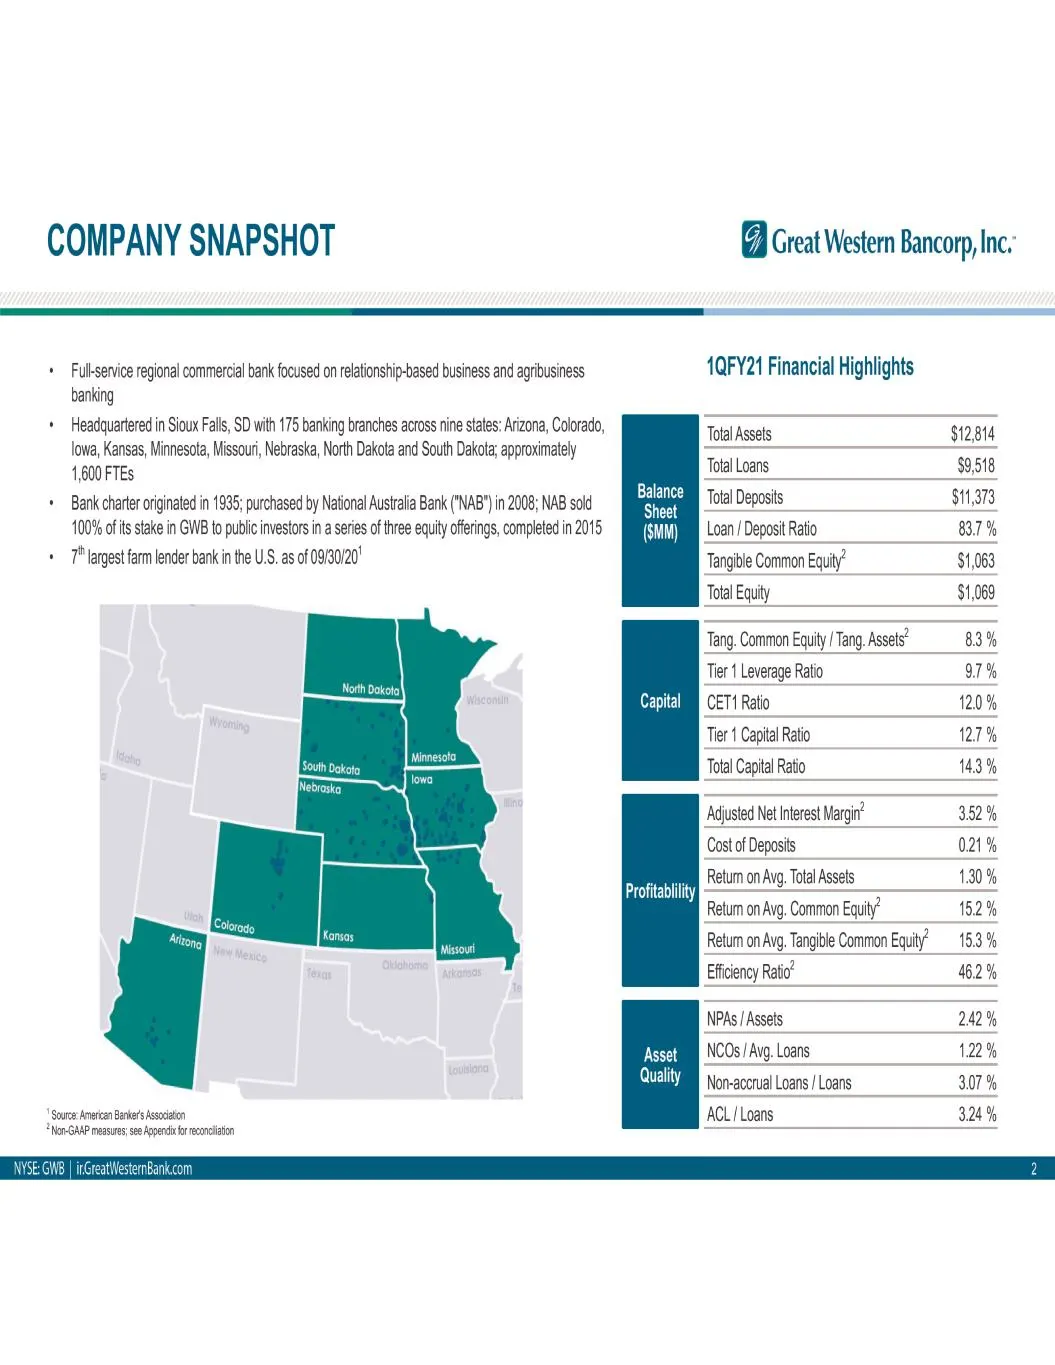
Slide 2: Company Snapshot
COMPANY SNAPSHOT + Full-service regional commercial bank focused on relationship-based business and agribusiness banking + Headquartered in Sioux Falls, SD with 175 banking branches across nine states: Arizona, Colorado, lowa, Kansas, Minnesota, Missouri, Nebraska, North Dakota and South Dakota; app
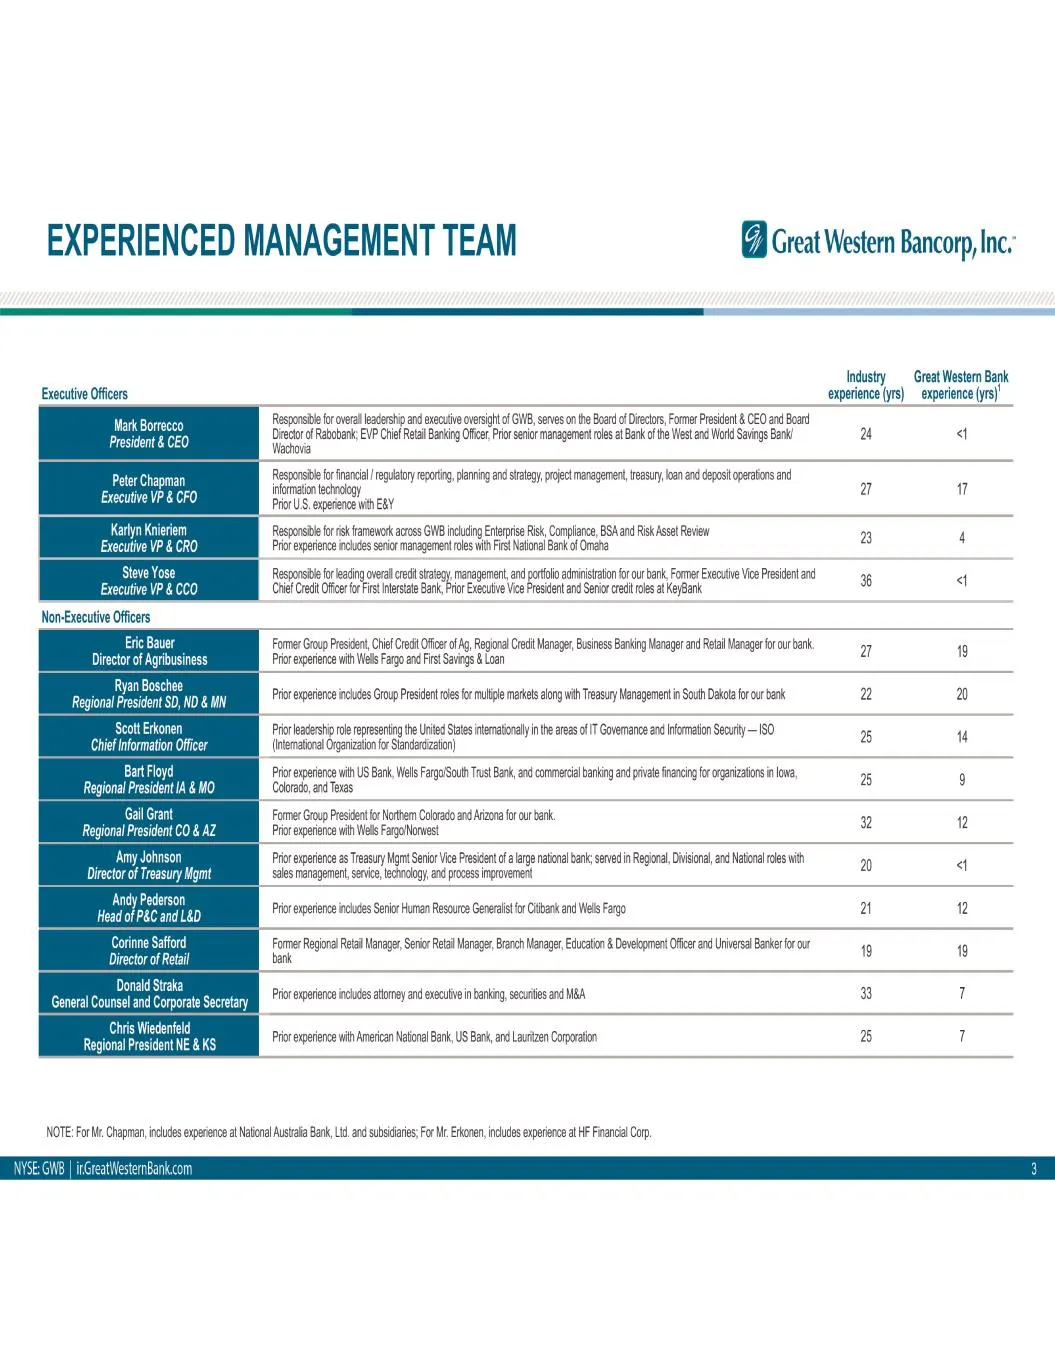
Slide 3: Experienced Management Team
EXPERIENCED MANAGEMENT TEAM (2) Great Western Bancorp, Inc. Industry Great Western Bank Executive Officers experience (yrs) experience (yrs) Responsible or veal leadership and executive oversight of GNB, serves onthe Board of Direct, Former President & CEO and Board ee Dredr of Rabobank EVP Chil Rta
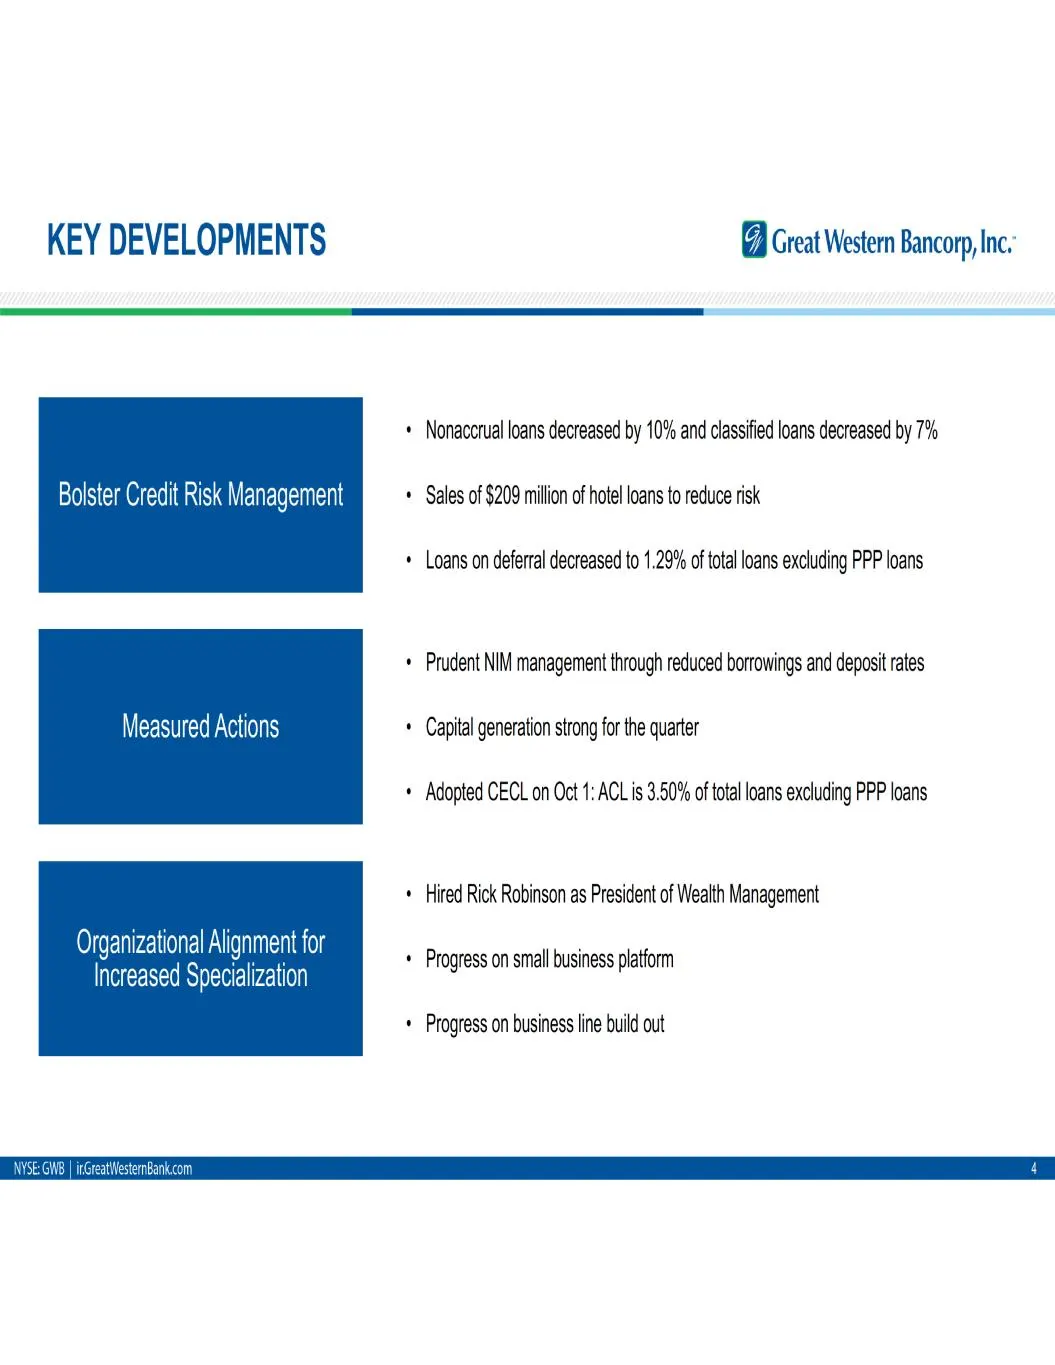
Slide 4: Key Developments
KEY DEVELOPMENTS Great Western Bancorp, Inc. Nonacerual loans decreased by 10% and classified loans decreased by 7% Bolster Credit Risk Management Sales of $209 million of hotel loans to reduce risk Loans on deferral decreased to 1.29% of total loans excluding PPP loans Prudent NIM management throug
Slide 5: Loan Portfolio Composition
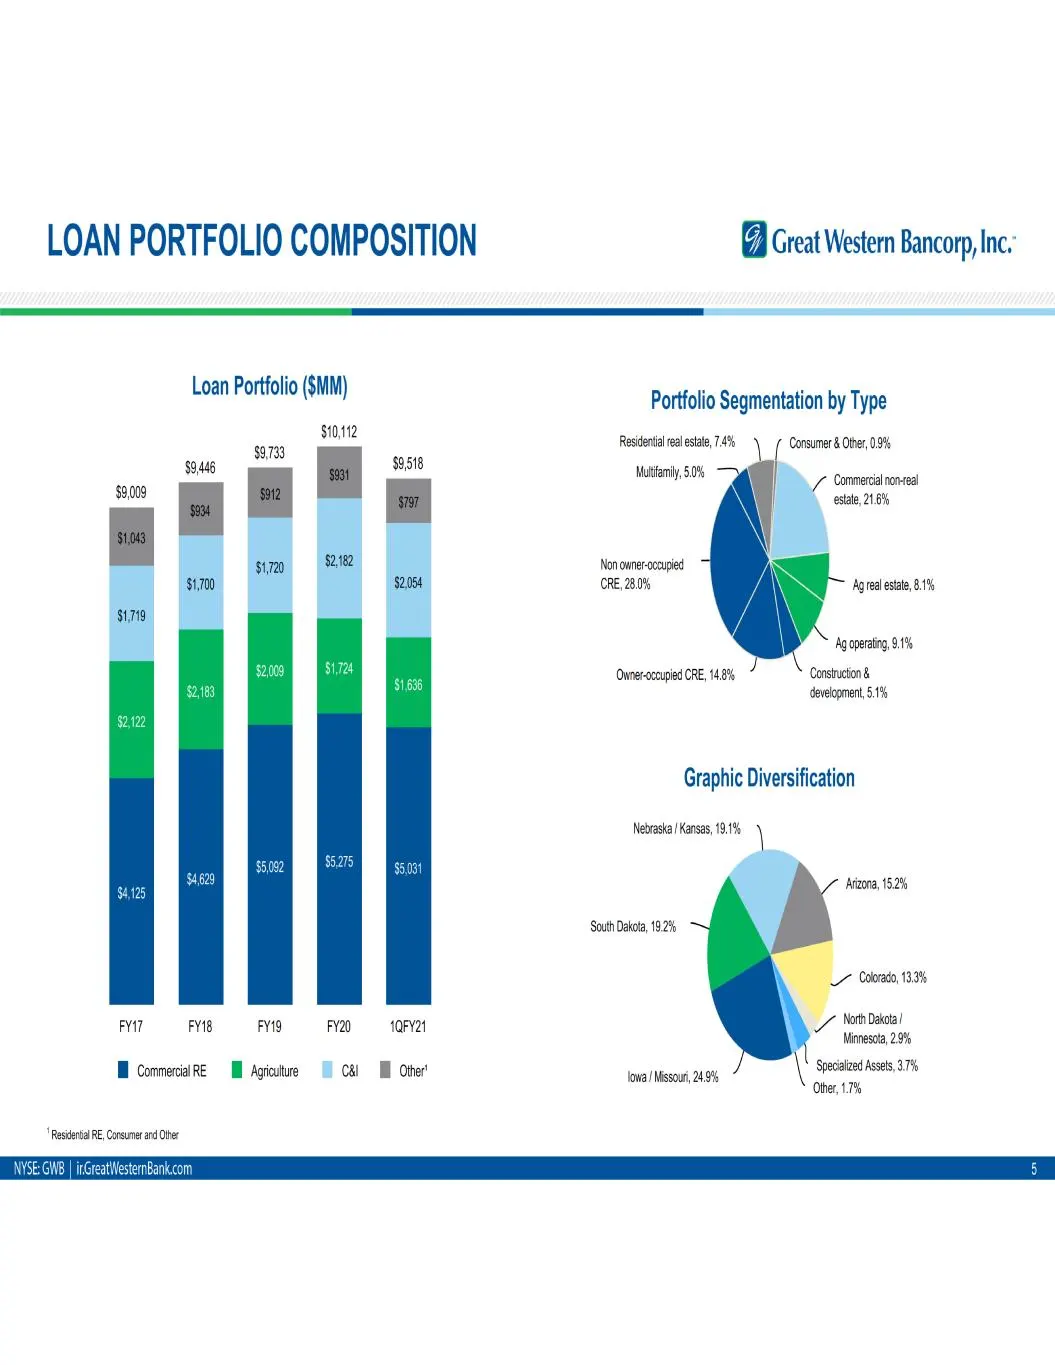
LOAN PORTFOLIO COMPOSITION 2 Great Western Bancorp, Inc. Loan Portfolio (SMM) $10,112 Ze $9,518 a ~ we $170 $2,182 $1,700 $2,054 $1719 FYI7 FYI8 FYIg FY20 1QFY21 HE Commercial RE I Agicuttre cal HE Otter * Resental RE, Consume ard Othe Portfolio Segmentation by Type Residential real estate, 7.4% ‘Co
Slide 6: Commercial Loans
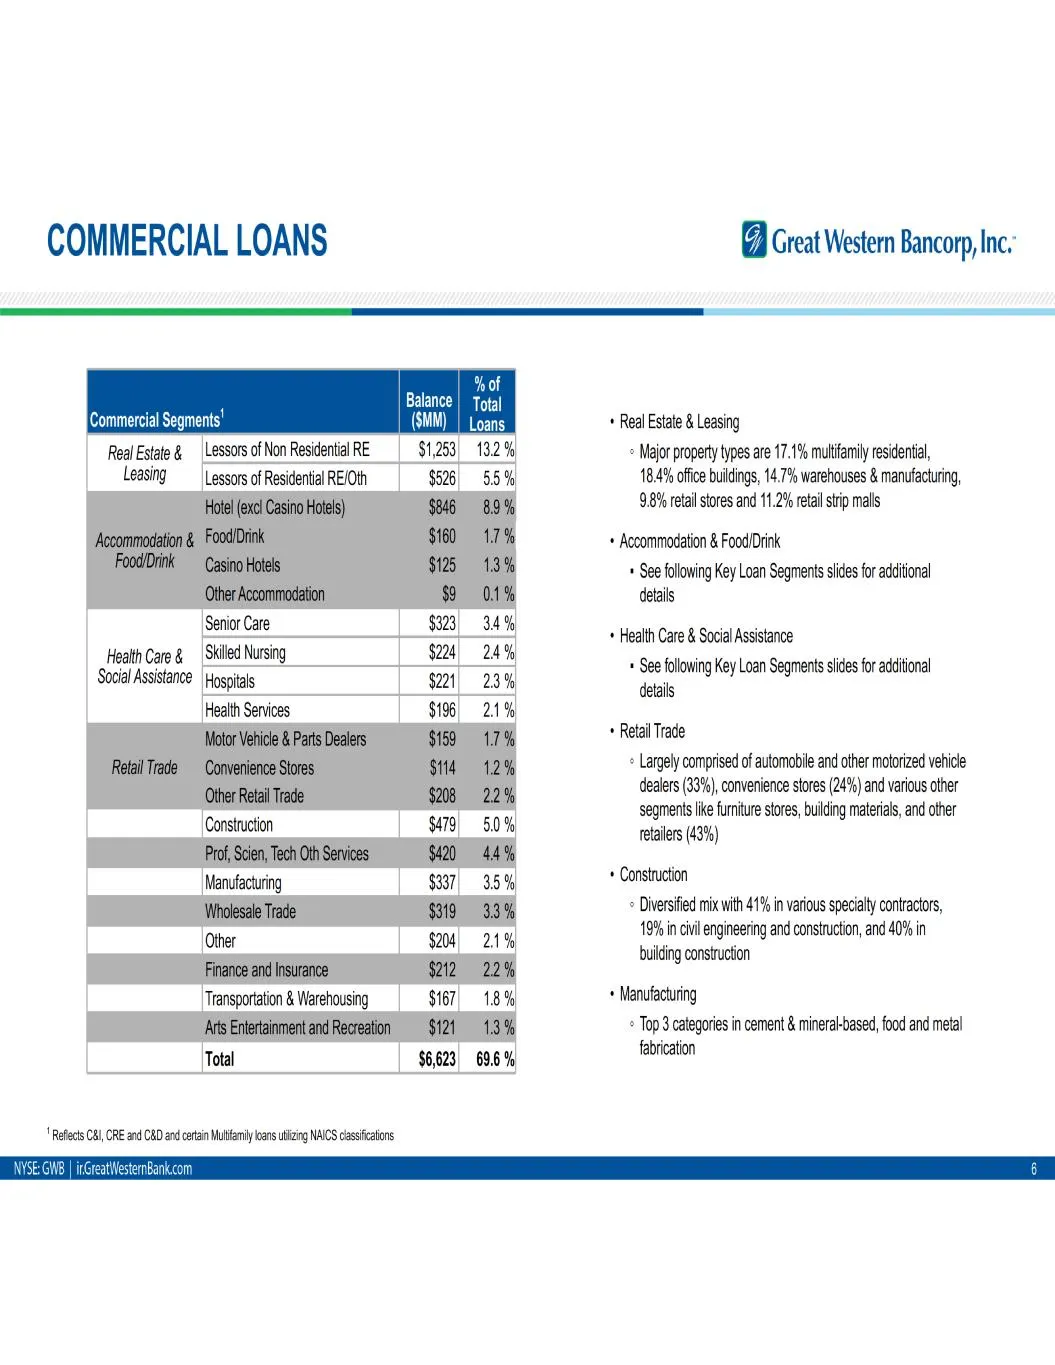
COMMERCIAL LOANS Commercial Segments’ Lessors of Non Residential RE Lessors of Residential RE/Oth Senior Care Stiled Nursing Hospitals Health Services Transportation & Warehousing Total $6,623, " Reflects C8, CRE and CBD and certain Multa loans ubliing NAICS classifications mBank.com ZA Great Wester
Slide 7: Key Loan Segments
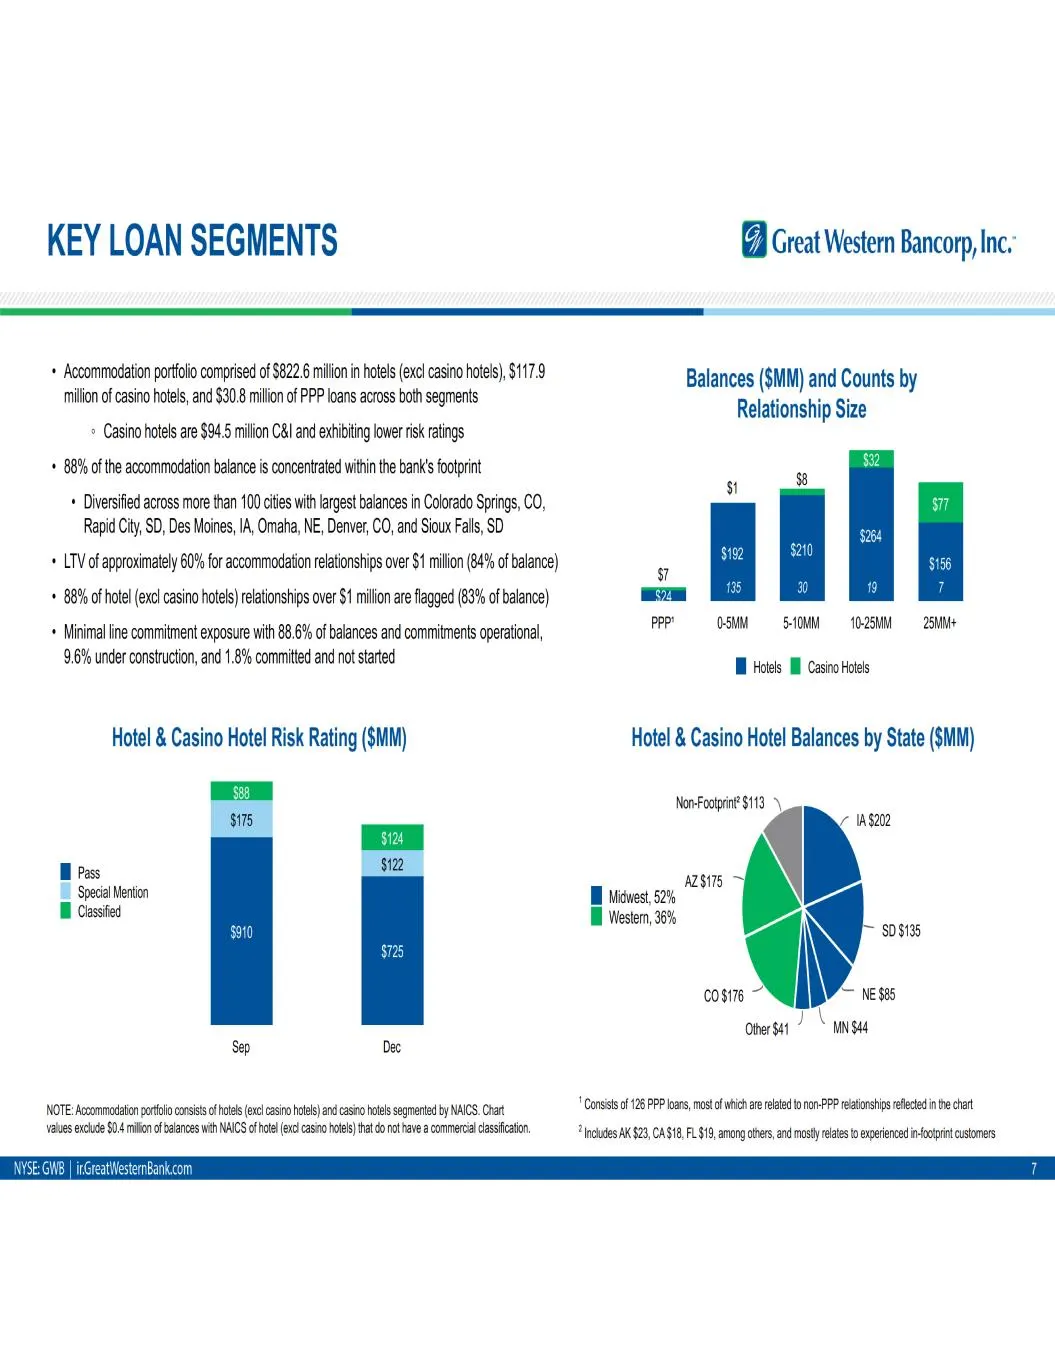
KEY LOAN SEGMENTS Great Western Bancorp, Inc. + Accommodation portfolio comprised of $822.6 milion in hotels (excl casino hotels), $117.9 milion of casino hotels, and $30.8 milion of PPP loans across both segments » Casino hotels are $94.5 milion C&l and exhibiting lower risk ratings + 88% of the ac
Slide 8: Key Loan Segments (cont'd)
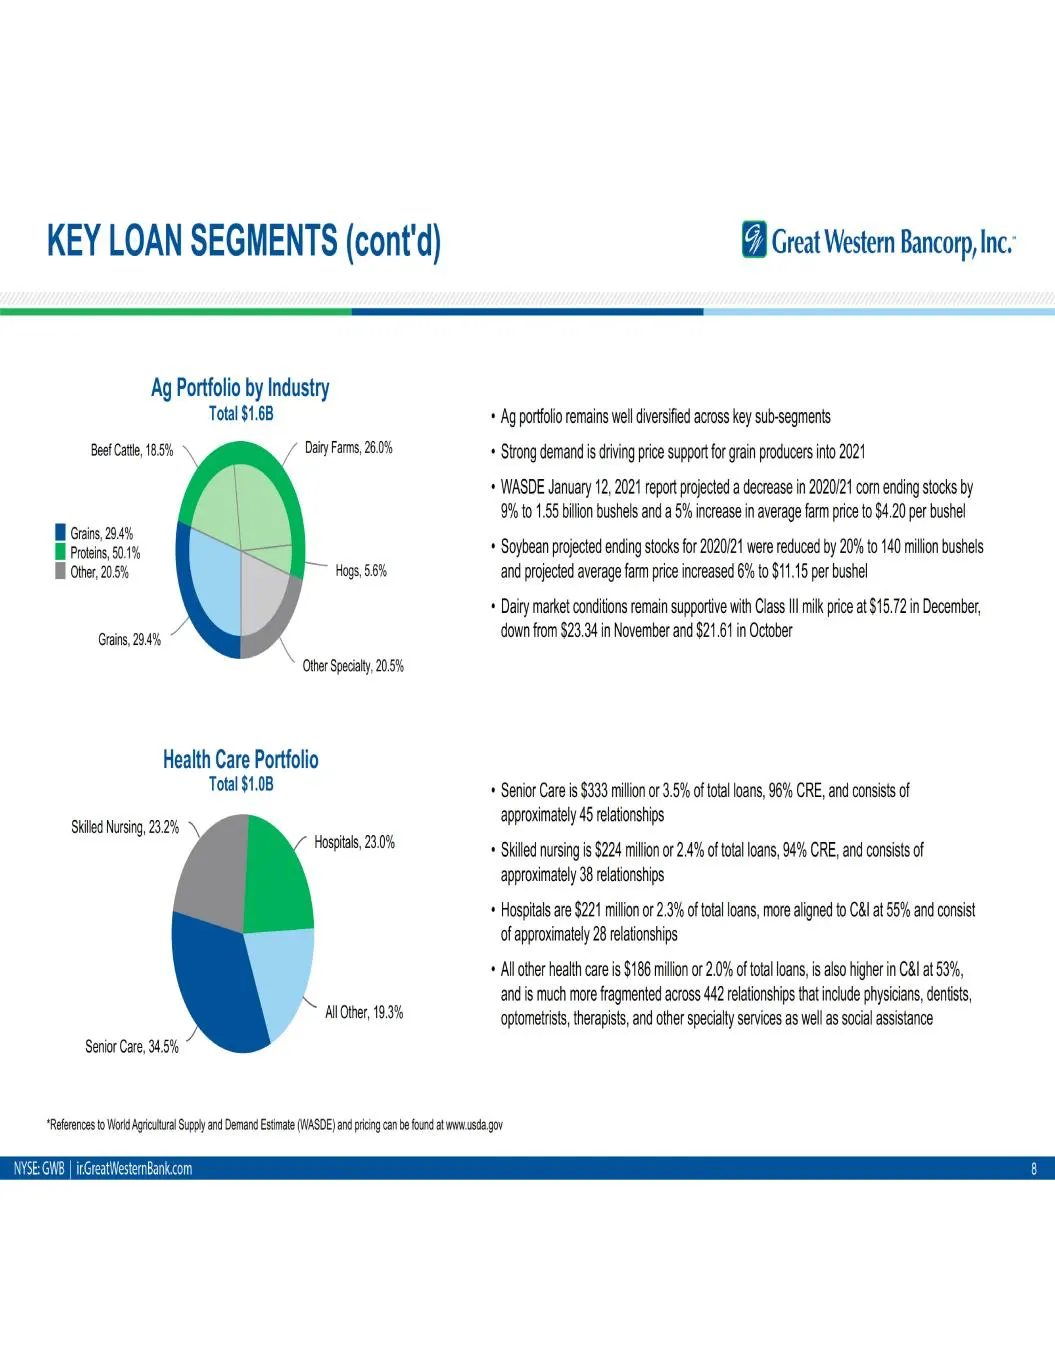
KEY LOAN SEGMENTS (cont'd) Ag Portfolio by Industry Total $1.68 Bee Cte, 18.5% / Deity ams, 260% Wi Grains, 204% Bi Proteins, 50.1% Bi Otter, 20.5% Hogs, 56% Grains, 29.4% Other Specialty, 205% Health Care Portfolio Total $1.08 Stiled Nursing, 23.2% aa Hospital, 23.0% ; — Alloter, 193% Senior Care,
Slide 9: Asset Quality Metrics
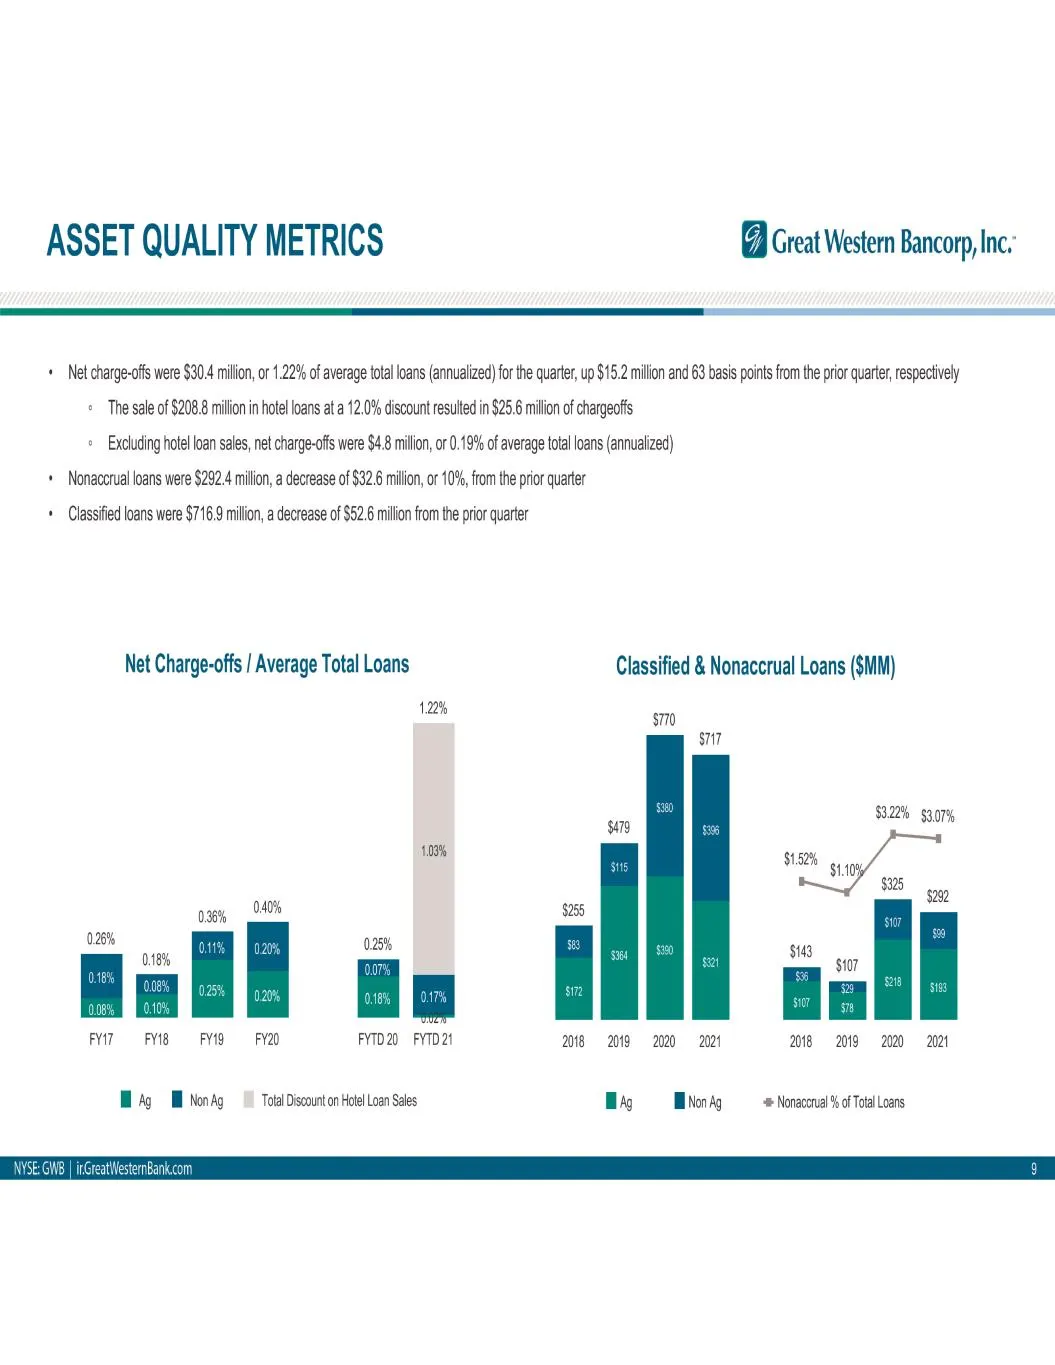
ASSET QUALITY METRICS @ Great Western Bancorp, Inc. + Net charge-offs were $30.4 milion, or 1.22% of average total loans (annualized) for the quarter, up $15.2 milion and 63 basis points from the prior quarter, respectively * The sale of $208.8 million in hotel loans at a 12.0% discount resulted in
Slide 10: Credit Initiatives
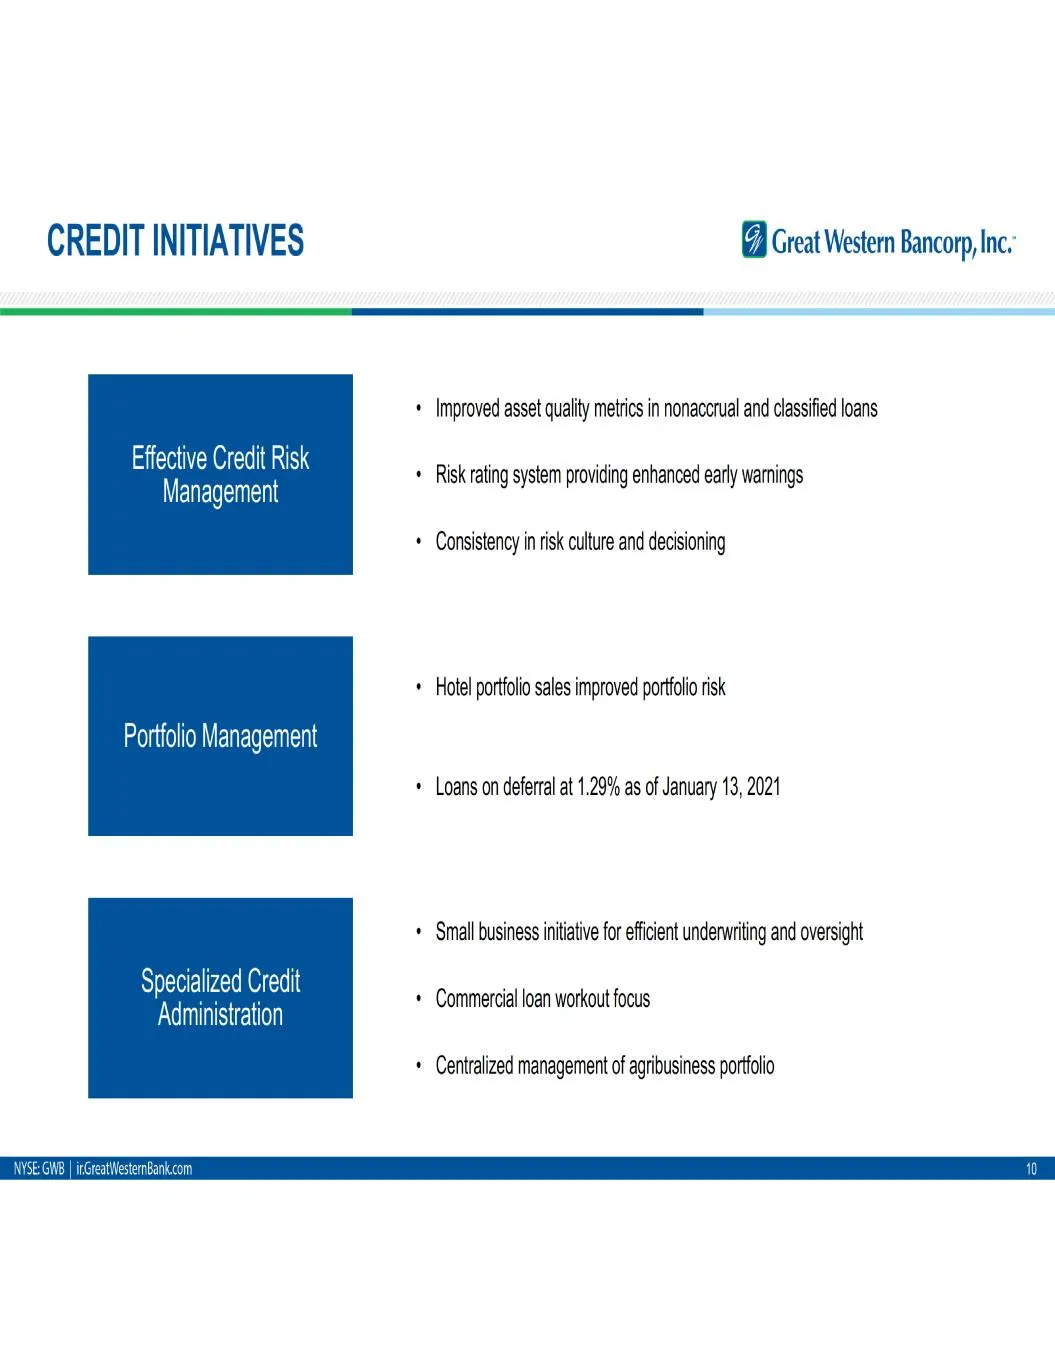
CREDIT INITIATIVES Great Western Bancorp, Inc. Improved asset quality metrics in nonaccrual and classified loans Risk rating system providing enhanced early warnings Consistency in risk culture and decisioning Hotel portfolio sales improved portfolio risk Portfolio Management Loans on deferral at 1.
Slide 11: Hotel Sales & Loan Deferrals
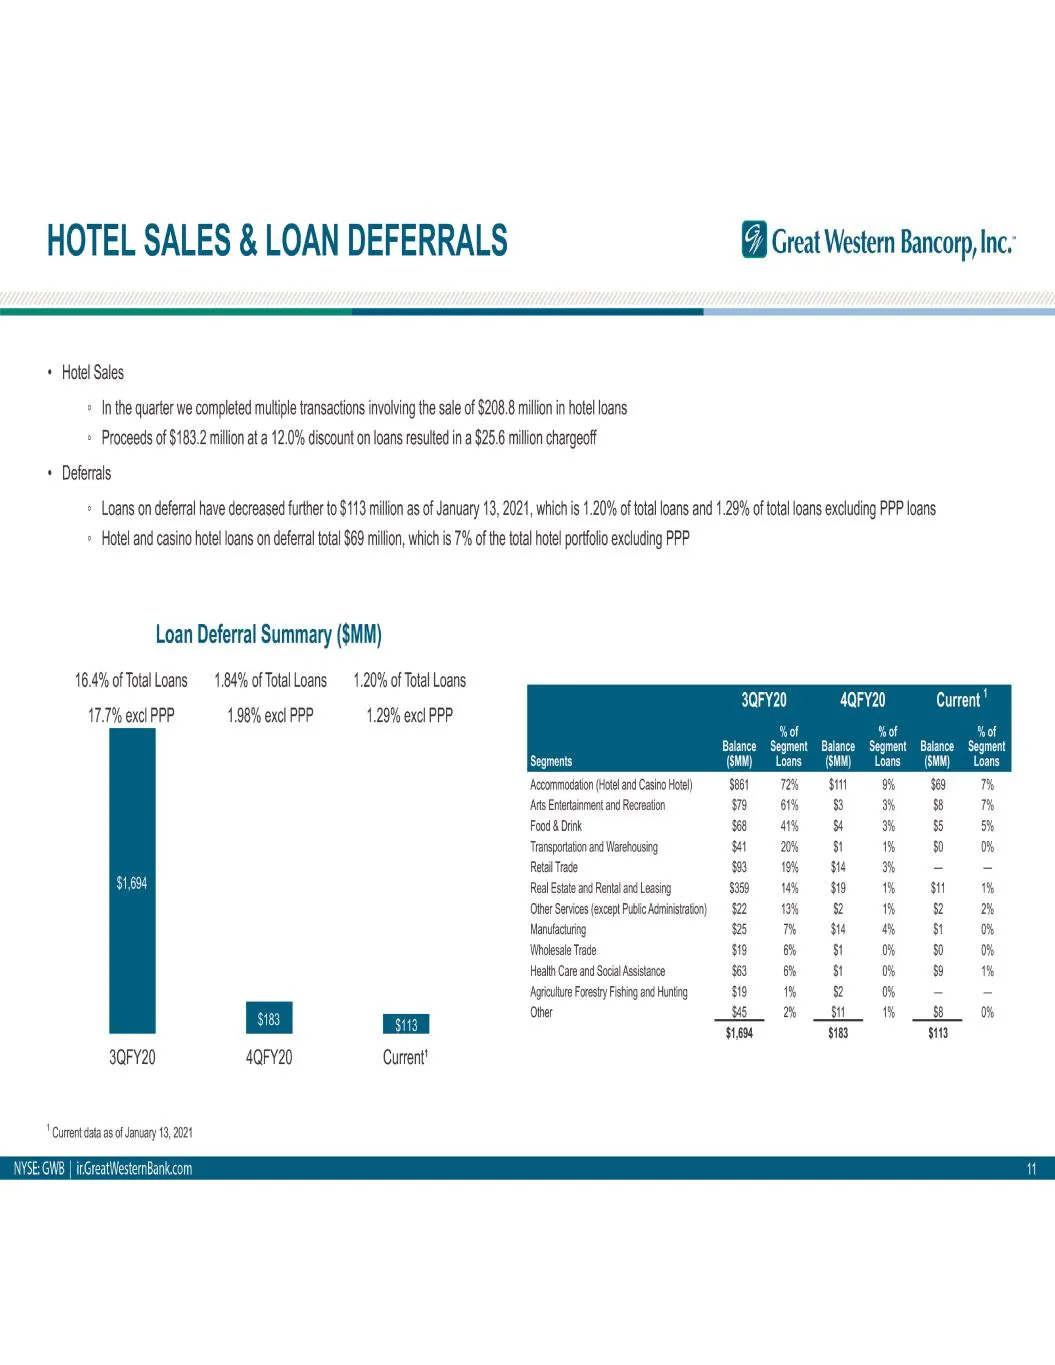
HOTEL SALES & LOAN DEFERRALS (2) Great Western Bancorp, Inc. + Hotel Sales » In the quarter we completed multiple transactions involving the sale of $208.8 million in hotel loans © Proceeds of $183.2 million at a 12.0% discount on loans resulted in a $25.6 milion chargeoff * Deferals » Loans on defe
Slide 12: Credit Coverage & CECL
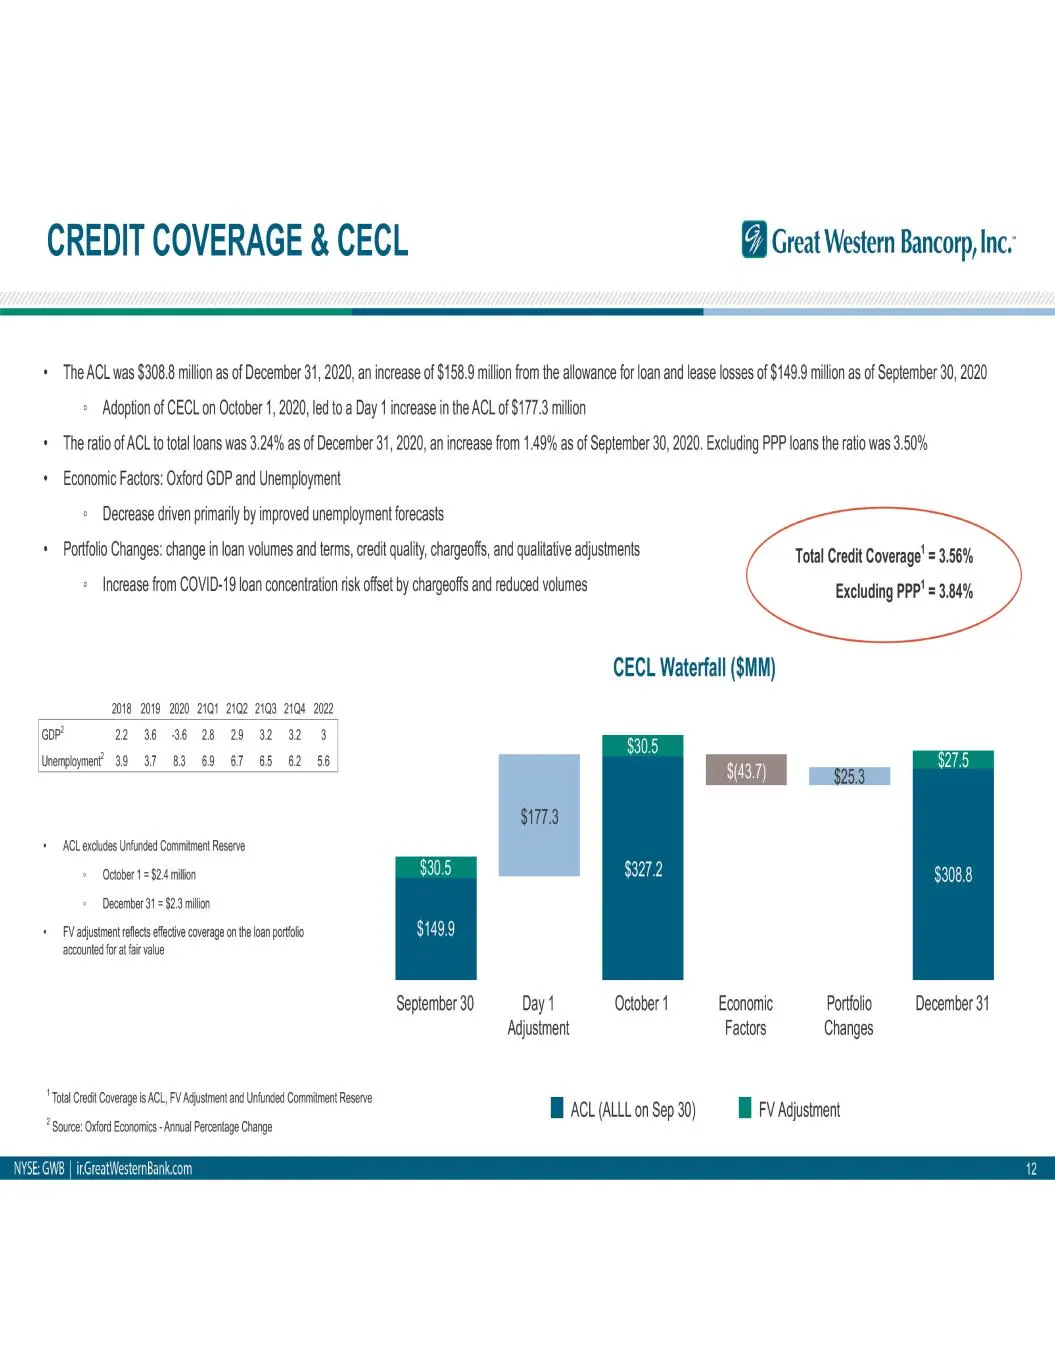
CREDIT COVERAGE & CECL (2 Great Western Bancorp, Inc. ‘The ACL was $308.8 million as of December 31, 2020, an increase of $158.9 milion from the allowance for loan and lease losses of $149.9 million as of September 30, 2020 * Adoption of CECL on October 1, 2020, led to a Day 1 increase in the ACL of
Slide 13: Ag Loan Asset Quality
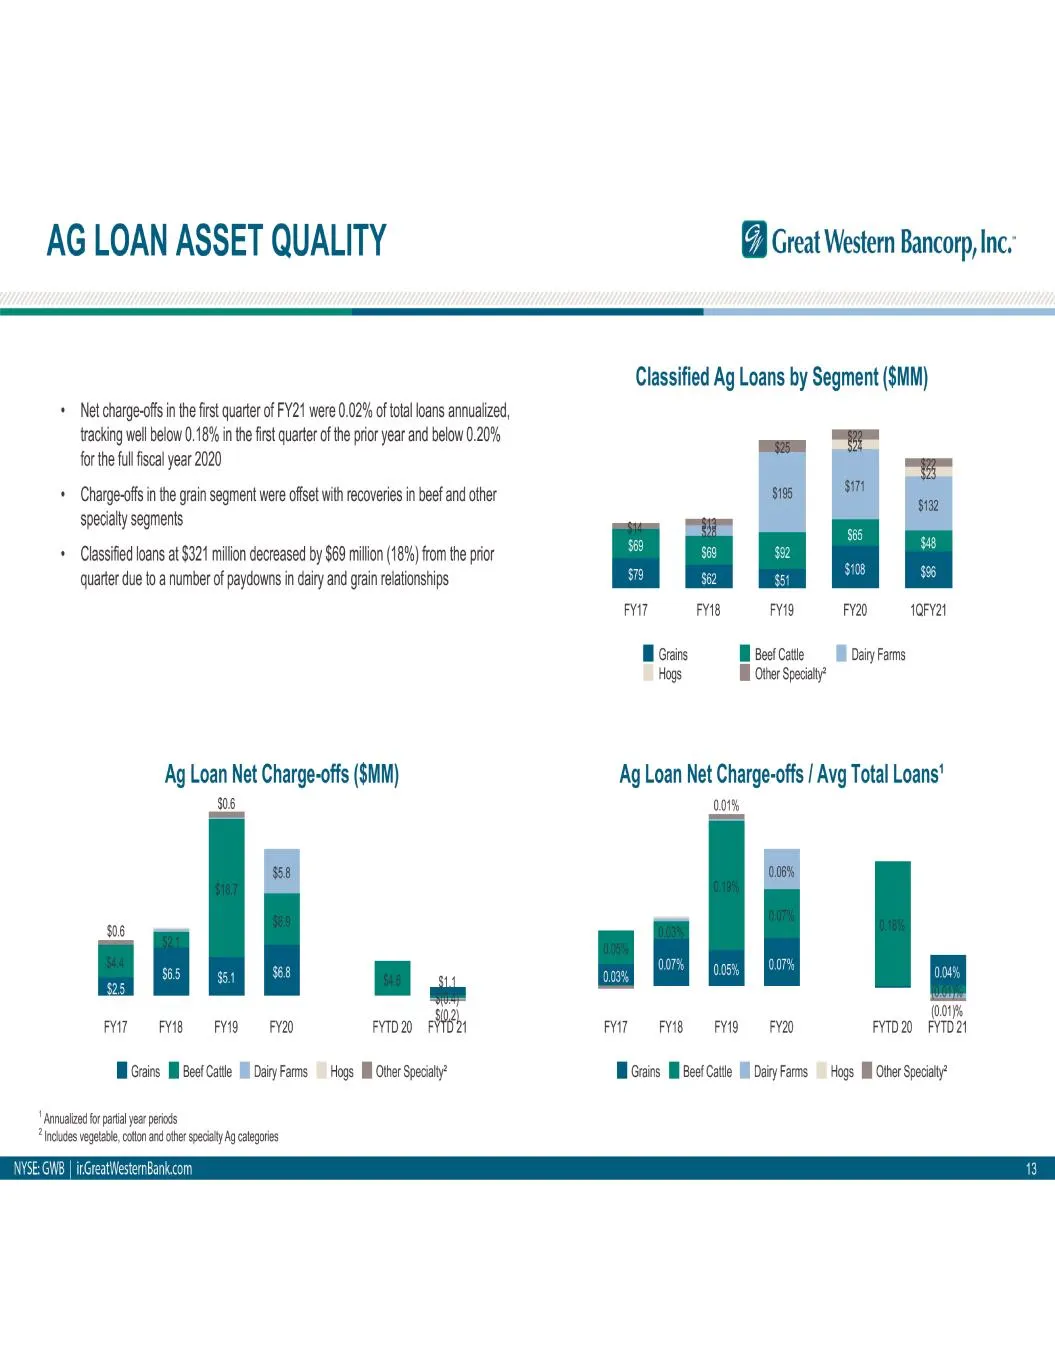
AG LOAN ASSET QUALITY @ Great Western Bancorp, Inc. Classified Ag Loans by Segment ($MM) + Net charge-offs in the first quarter of FY21 were 0.02% of total loans annualized, tracking well below 0.18% in the first quarter of the prior year and below 0.20% for the full fiscal year 2020 + Charge-offs i
Slide 14: Investments & Borrowings
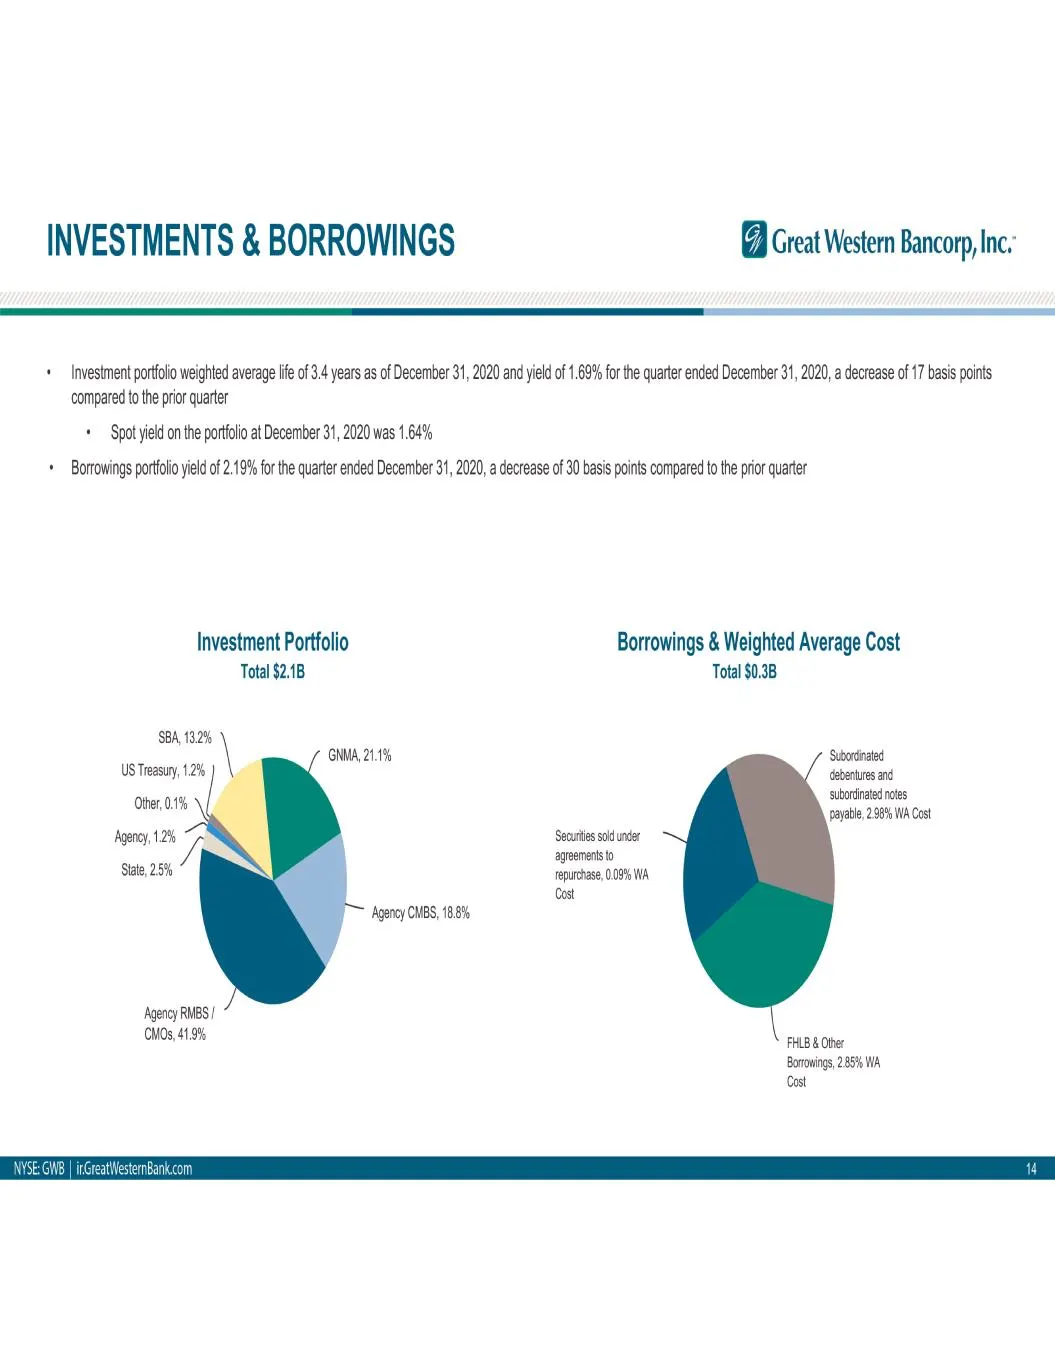
INVESTMENTS & BORROWINGS (2) Great Western Bancorp, Inc. + Investment portfolio weighted average life of 3.4 years as of December 31, 2020 and yield of 1.69% for the quarter ended December 31, 2020, a decrease of 17 basis points compared to the prior quarter + Spot yield on the portfolio at December
Slide 15: Liquidity Detail
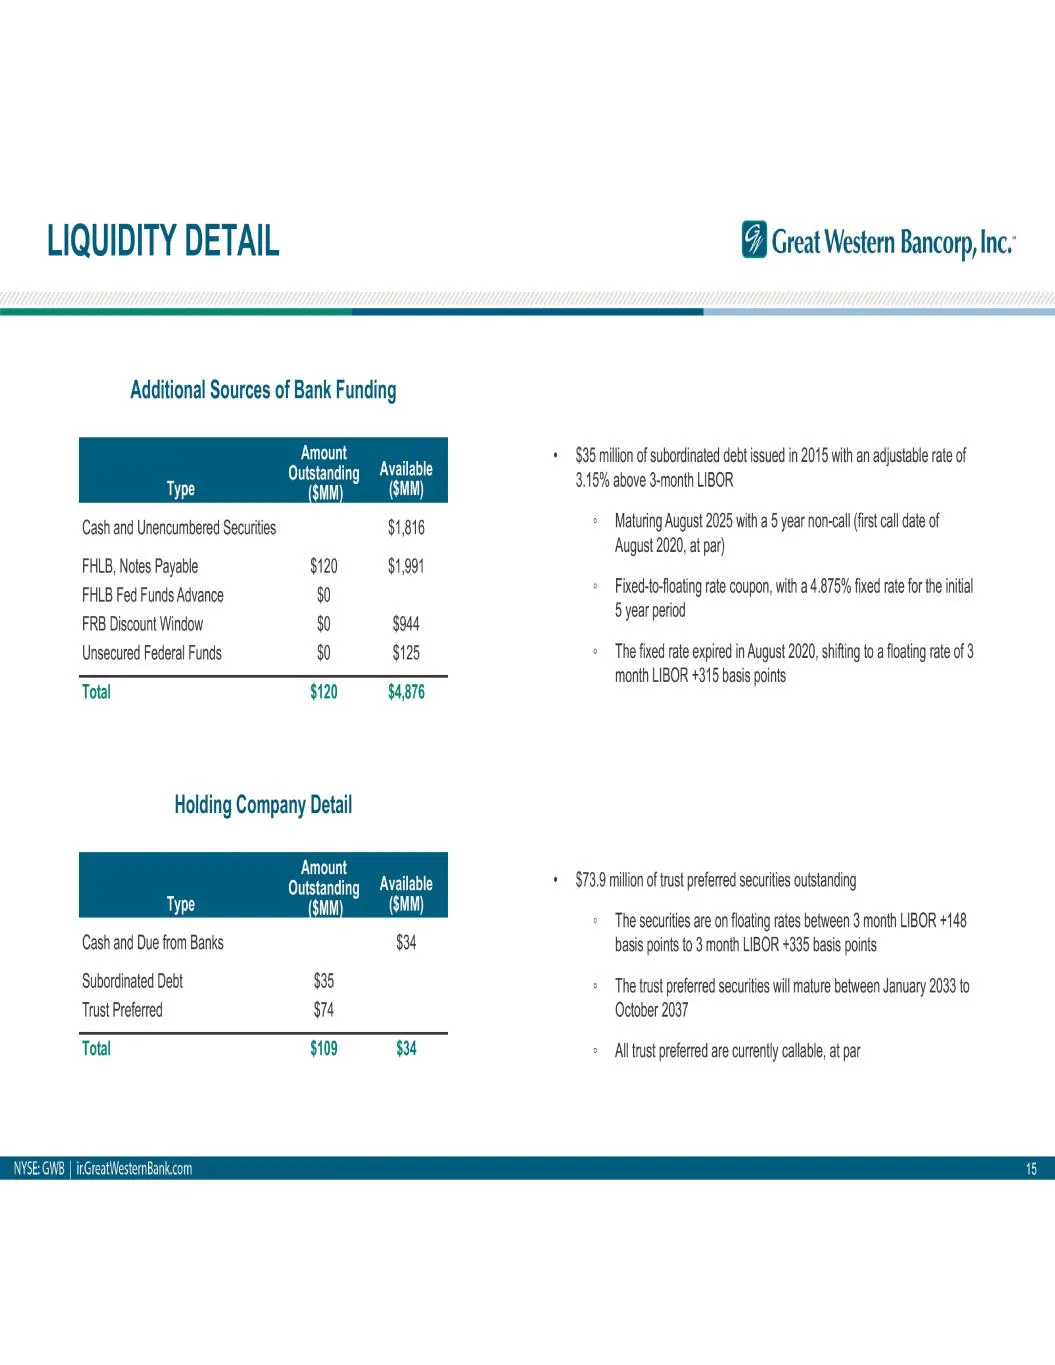
LIQUIDITY DETAIL @ Great Western Bancorp, Inc. Additional Sources of Bank Funding ao Available + $35 millon of subordinated debt issued in 2015 with an adjustable rate of jutstandin Type (SMM) d (SMM) 3.15% above 3-month LIBOR Cash and Unencumbered Securities $1816 ® Maturing August 2025 with a 5 ye
Slide 16: Deposits
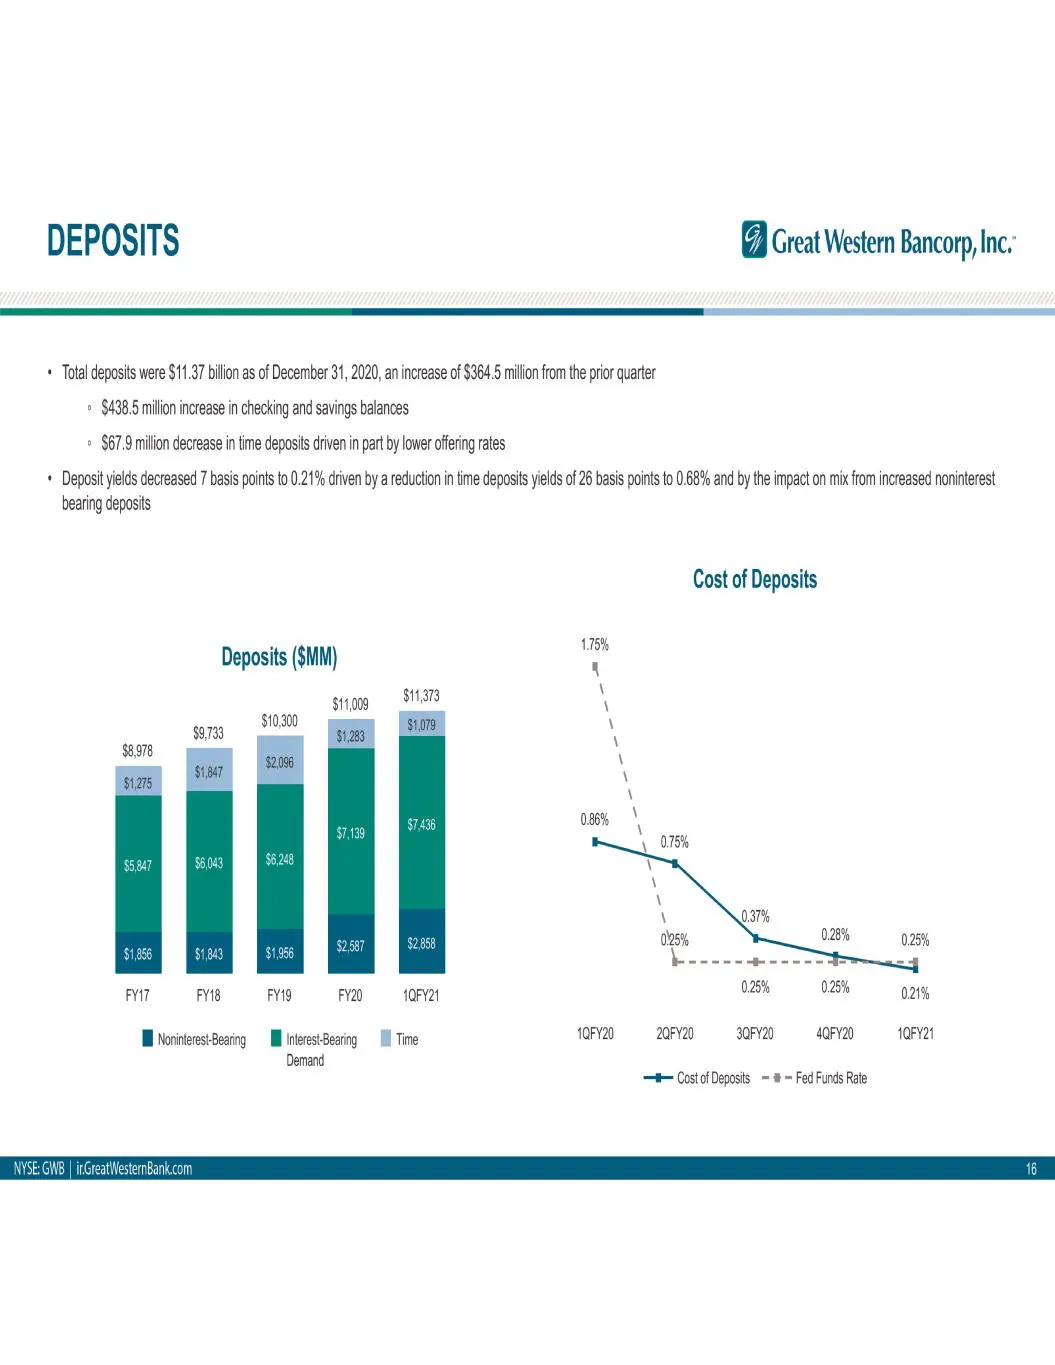
DEPOSITS (A Great Western Bancorp, Inc. * Total deposits were $11.37 bilion as of December 31, 2020, an increase of $364.5 milion from the prior quarter » $438.5 million increase in checking and savings balances © $67.9 million decrease in time deposits driven in part by lower offering rates + Depos
Slide 17: Growth - Metro vs Rural
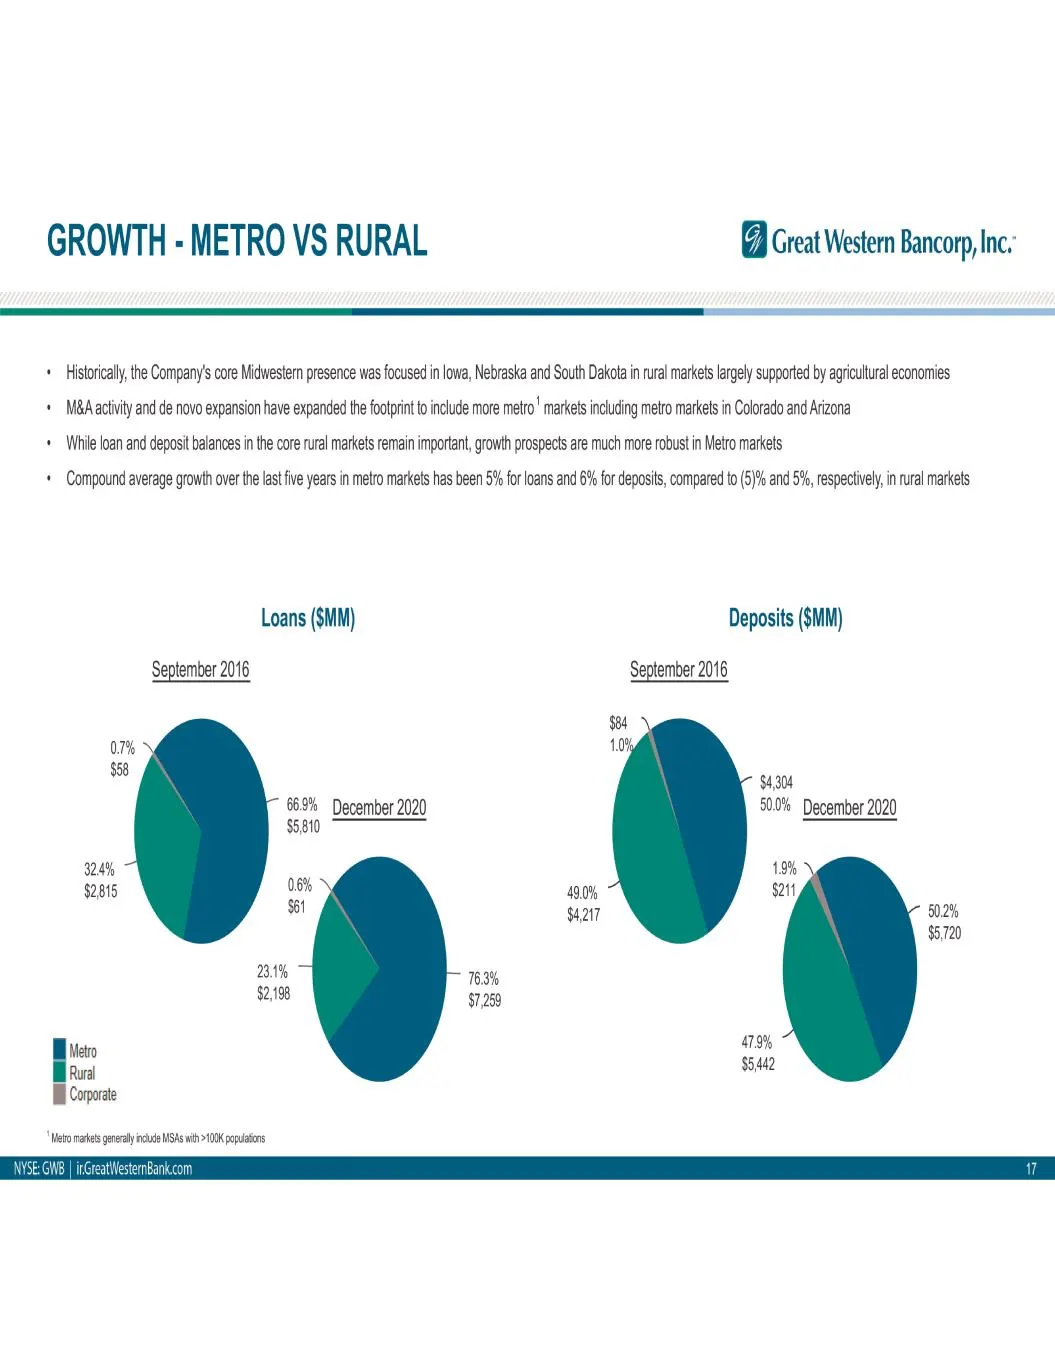
GROWTH - METRO VS RURAL @ Great Western Bancorp, Inc. Historically, the Company's core Midwestern presence was focused in lowa, Nebraska and South Dakota in rural markets largely supported by agricultural economies + MéAactivity and de novo expansion have expanded the footprint to include more metro
Slide 18: Capital
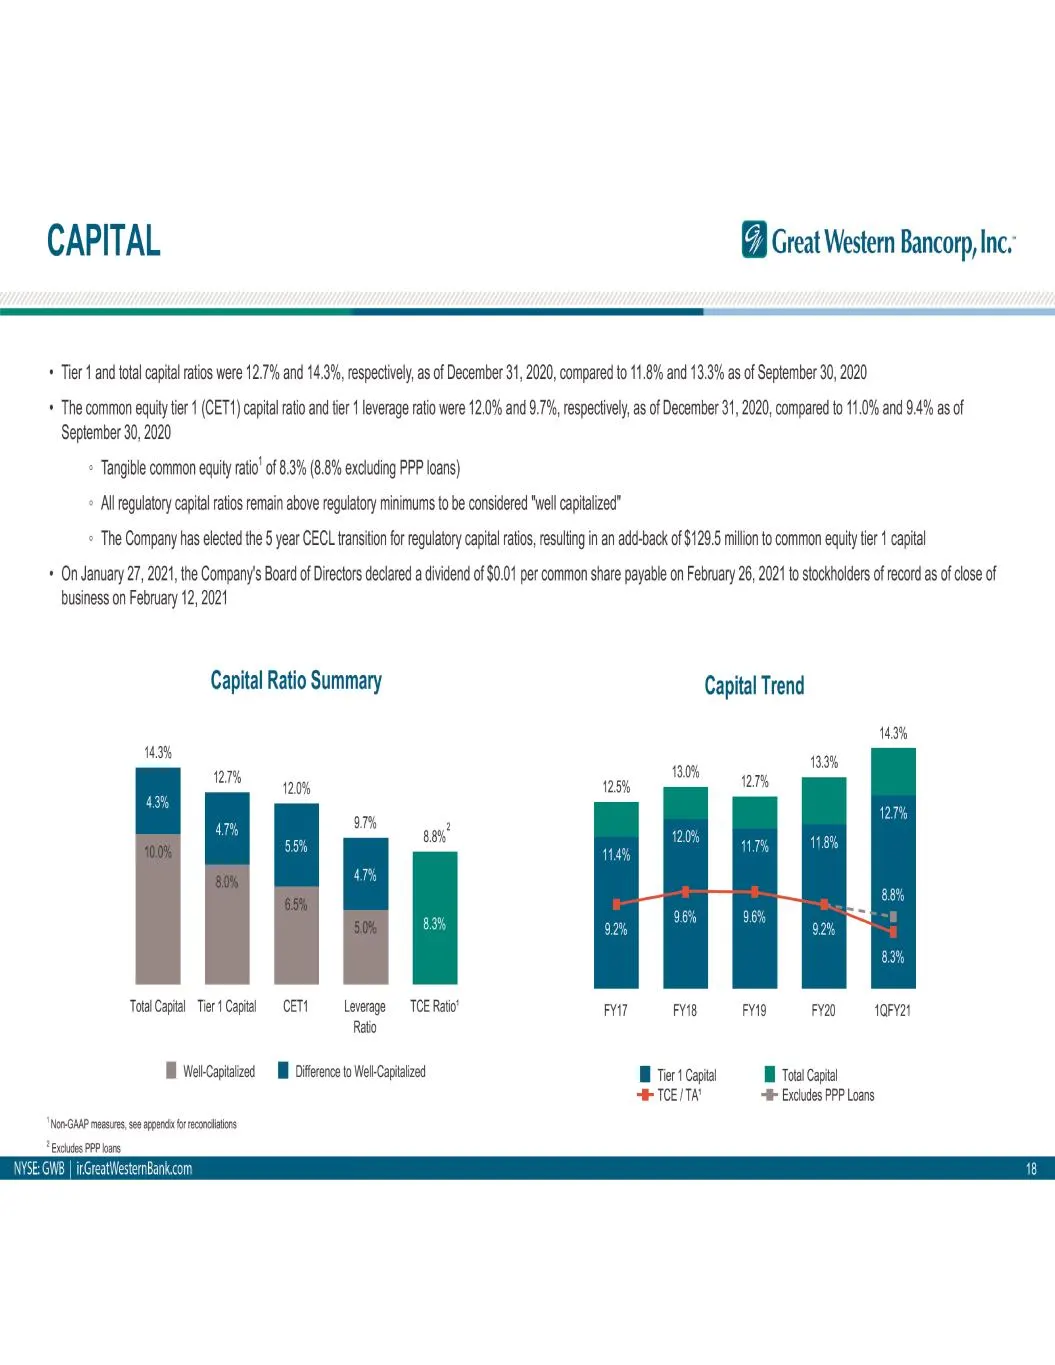
CAPITAL (A Great Western Bancorp, Inc. * Tier 1 and total capital ratios were 12.7% and 14.3%, respectively, as of December 31, 2020, compared to 11.8% and 13.3% as of September 30, 2020 + The common equity tier 1 (CET4) capital ratio and tier 1 leverage ratio were 12.0% and 9.7%, respectively, as o
Slide 19: Interest Rate Sensitivity
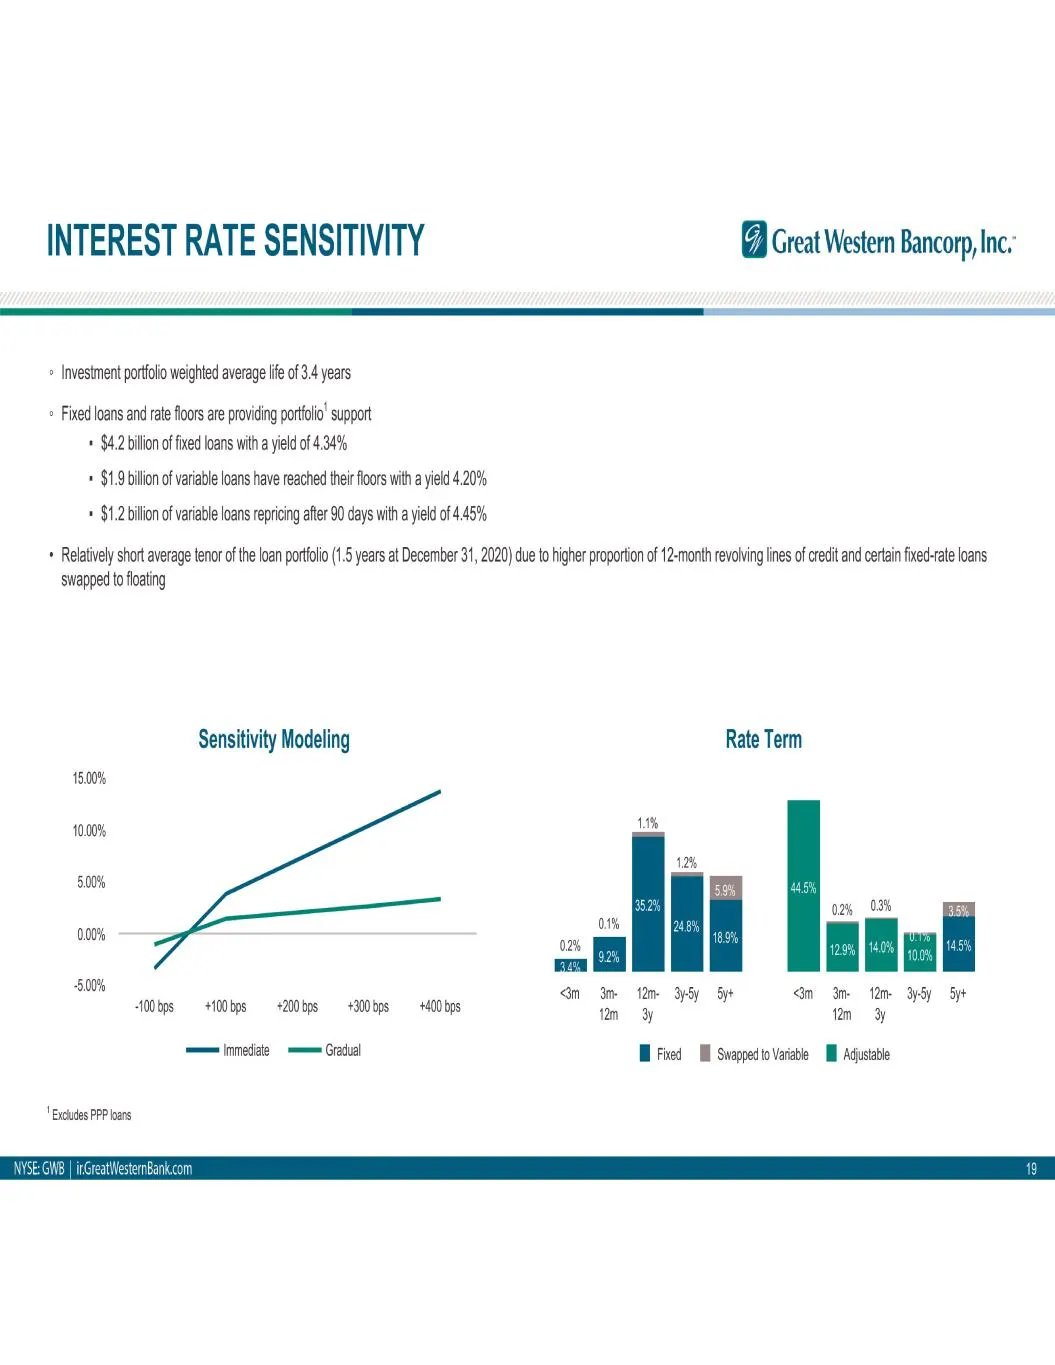
INTEREST RATE SENSITIVITY @ Great Western Bancorp, Inc. * Investment portfolio weighted average life of 3.4 years » Fixed loans and rate floors are providing portfolio’ support + $4.2 billion of fixed loans with a yield of 4.34% + $1.9 billion of variable loans have reached their floors with a yield
Slide 20: Income Statement Summary
Great Western Bancorp, Inc. Income Statement Summary
Slide 21: Earnings Overview
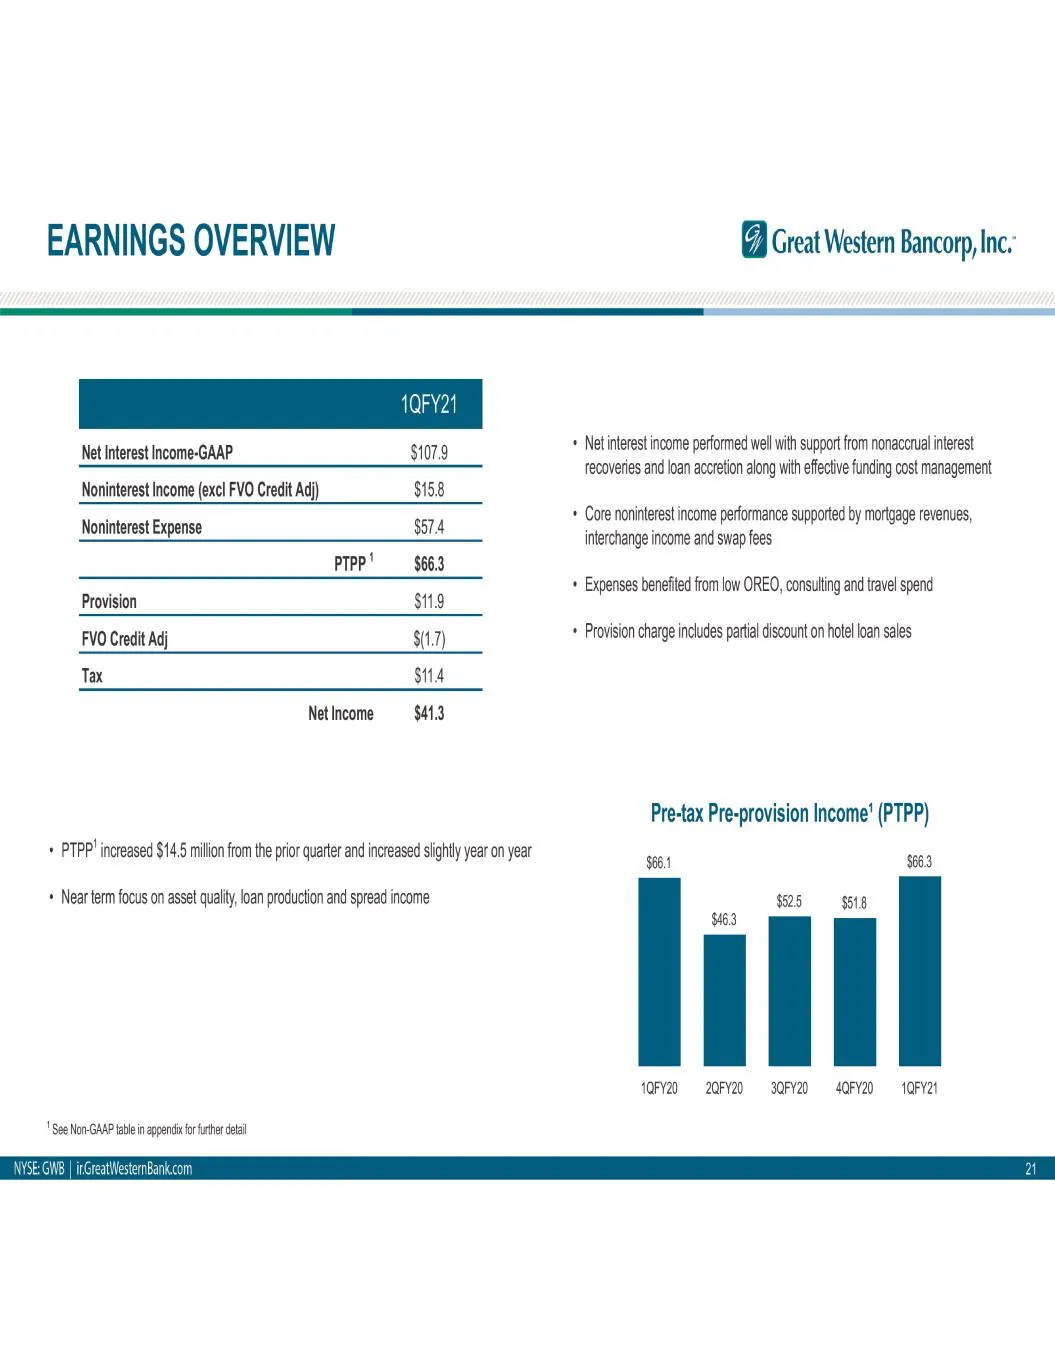
EARNINGS OVERVIEW (A Great Western Bancorp, Inc. Net Interest Income-GAAP $107.9 * Net interest income performed well wih Support from nonaccrual interest ———— ey recoveries and loan accretion along with effective funding cost management Noninterest Income (excl FVO Credit Adj) $15.8 E + Core nonint
Slide 22: Net Interest Income
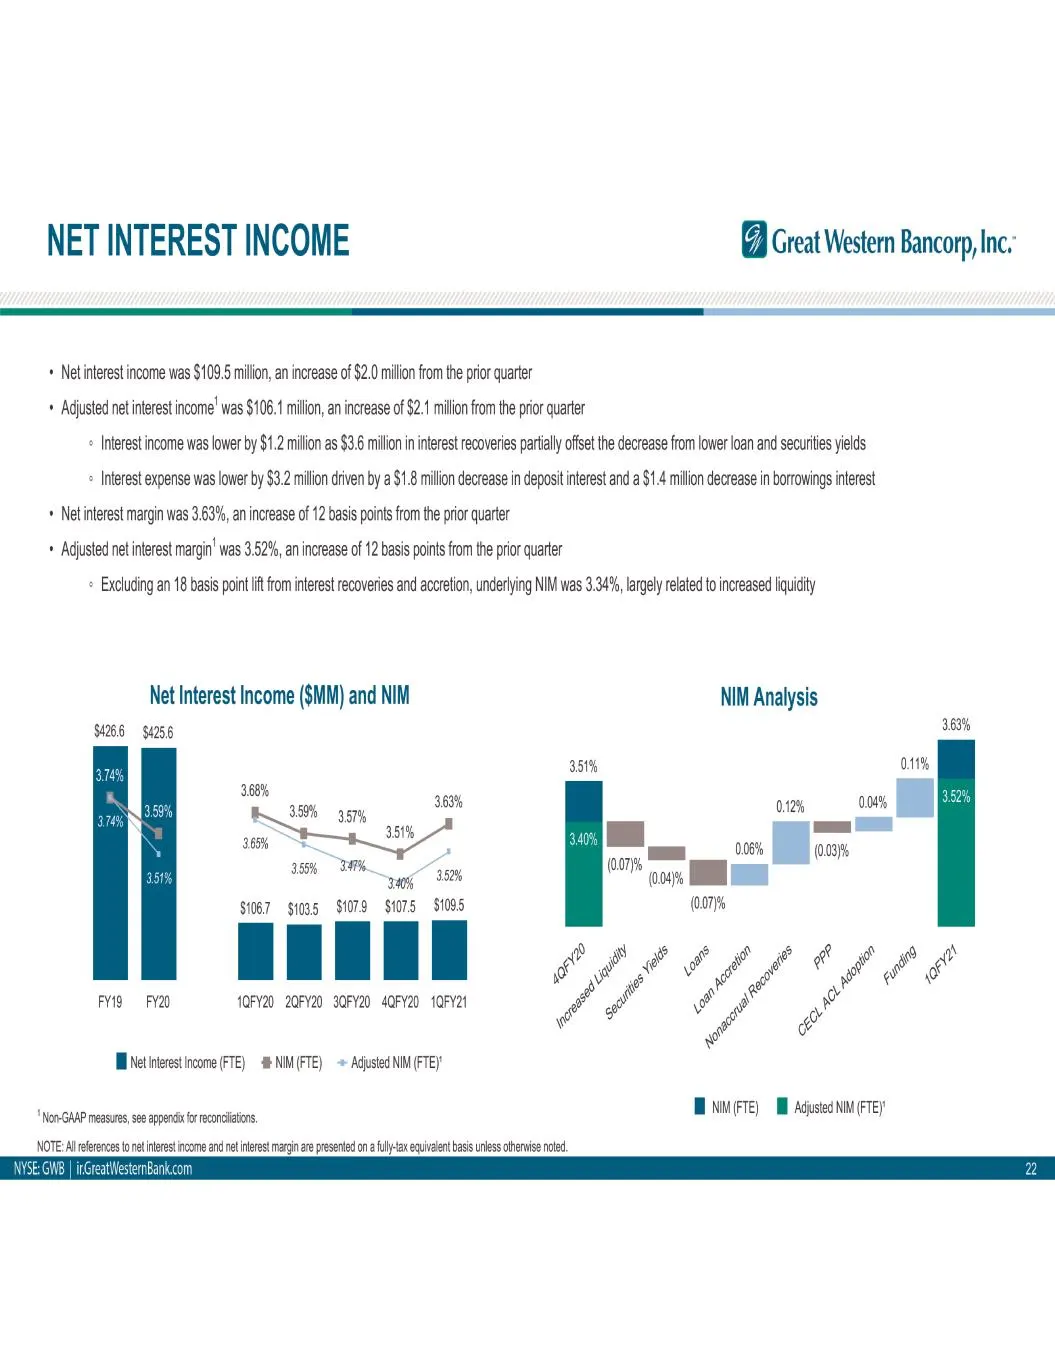
NET INTEREST INCOME Great Western Bancorp, Inc. + Net interest income was $109.5 milion, an increase of $2.0 milion from the prior quarter + Adjusted net interest income! was $106.1 milion, an increase of $2.1 milion from the prior quarter « Interest income was lower by $1.2 milion as $3.6 millon in
Slide 23: Net Interest Income (cont'd)
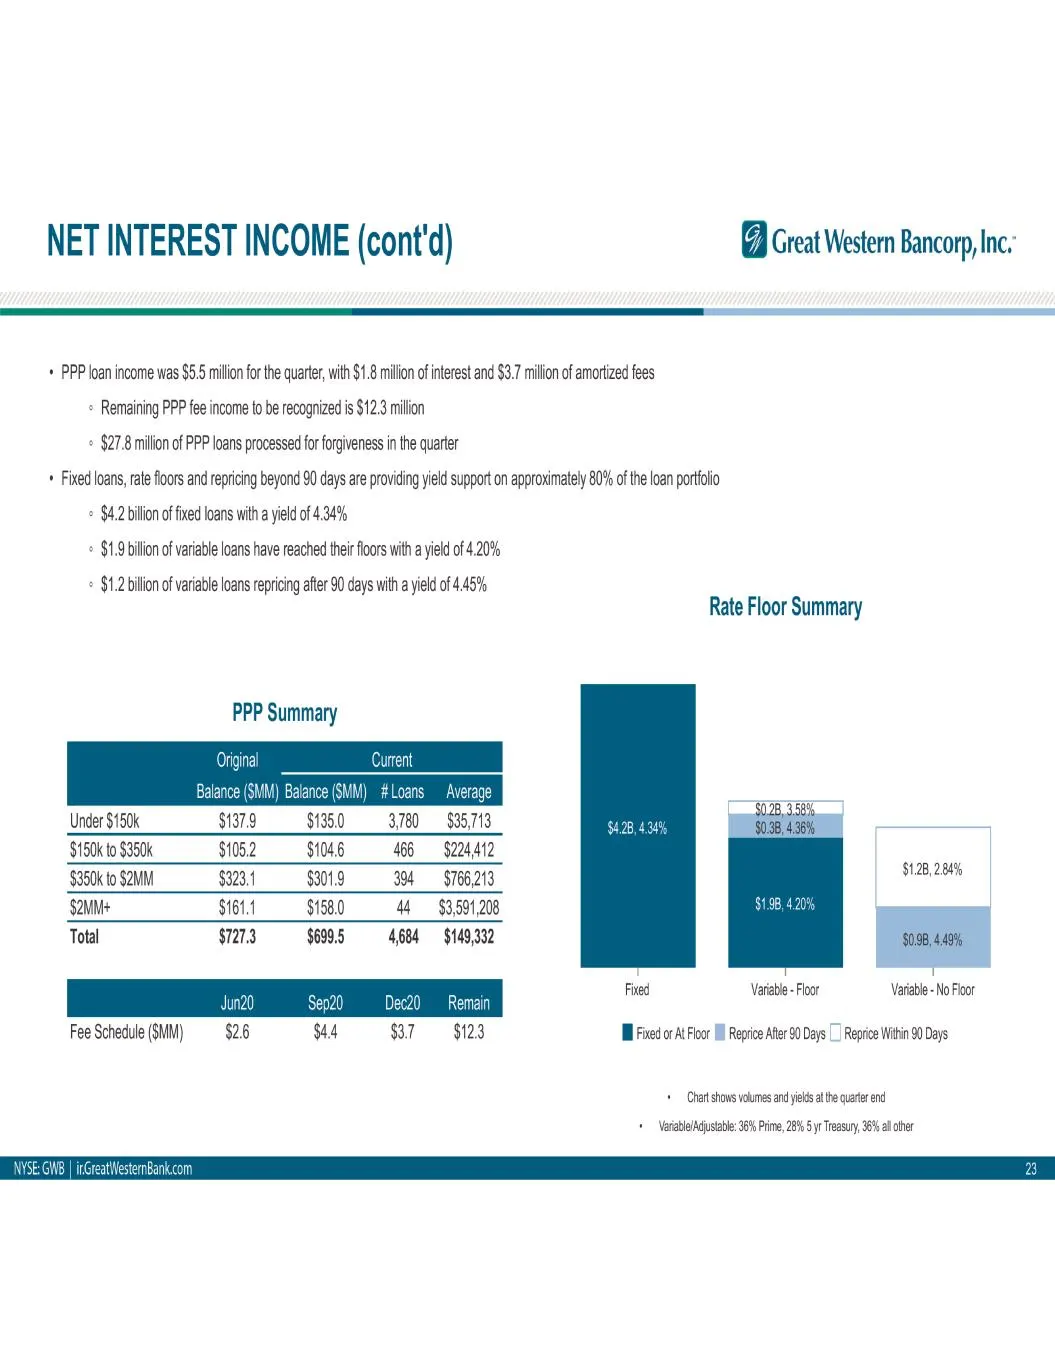
NET INTEREST INCOME (cont'd) (A Great Western Bancorp, Inc. + PPP Joan income was $5.5 milion for the quarter, with $1.8 milion of interest and $3.7 million of amortized fees © Remaining PPP fee income to be recognized is $12.3 milion © $27.8 milion of PPP loans processed for forgiveness in the quar
Slide 24: Noninterest Income
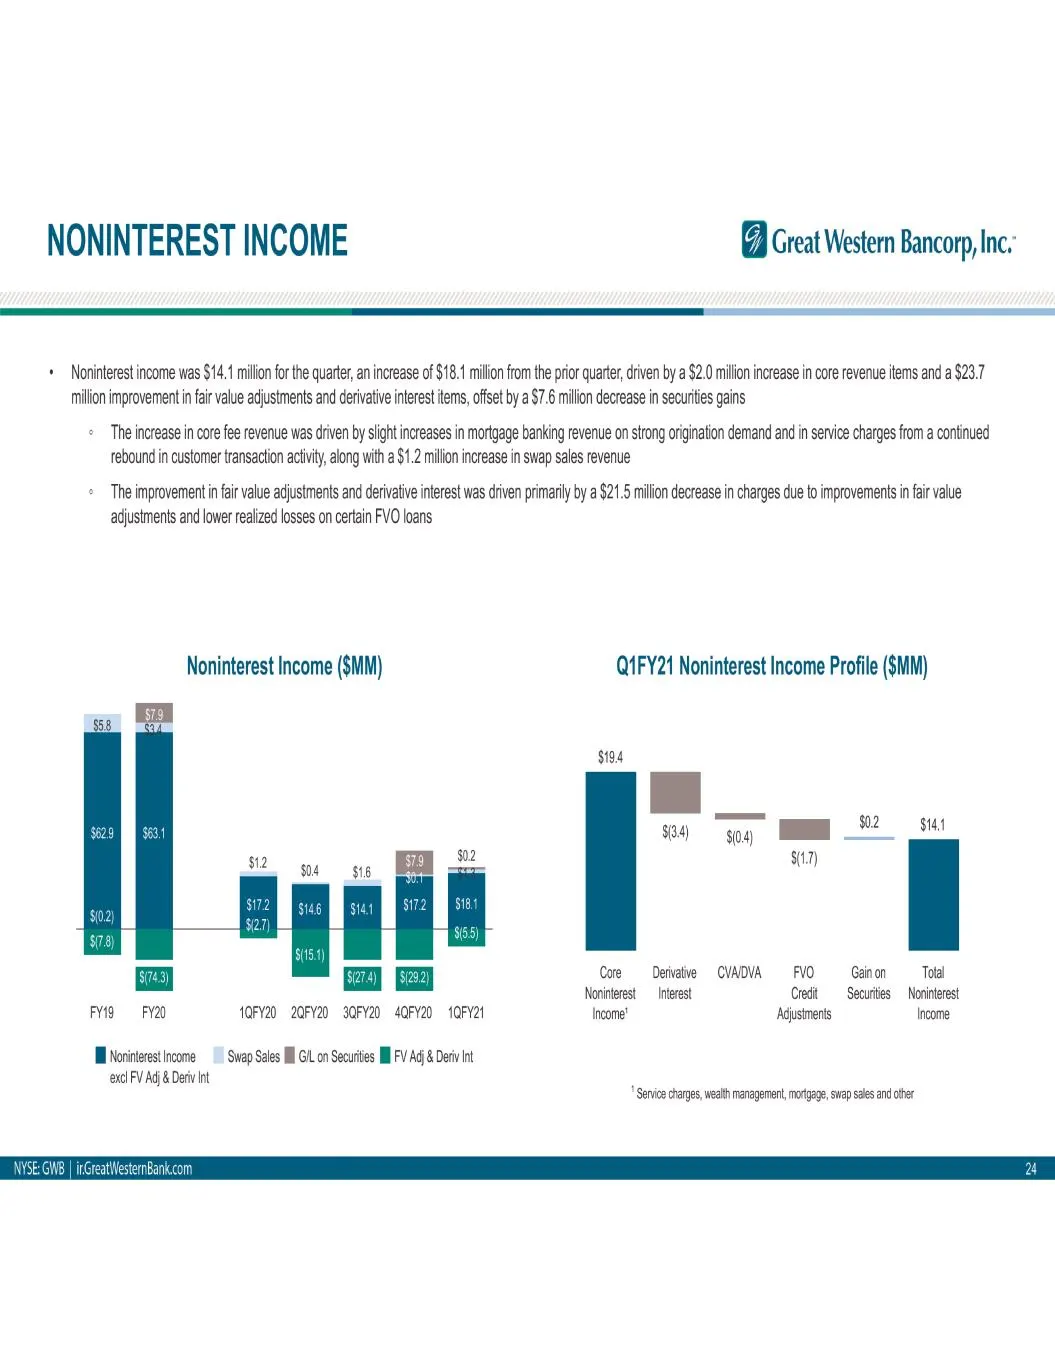
NONINTEREST INCOME (2 Great Western Bancorp, Inc. + Noninterest income was $14.1 milion for the quarter, an increase of $18.1 million from the prior quarter, driven by a $2.0 milion increase in core revenue items and a $23.7 million improvement in fair value adjustments and derivative interest items
Slide 25: Expenses & Provision
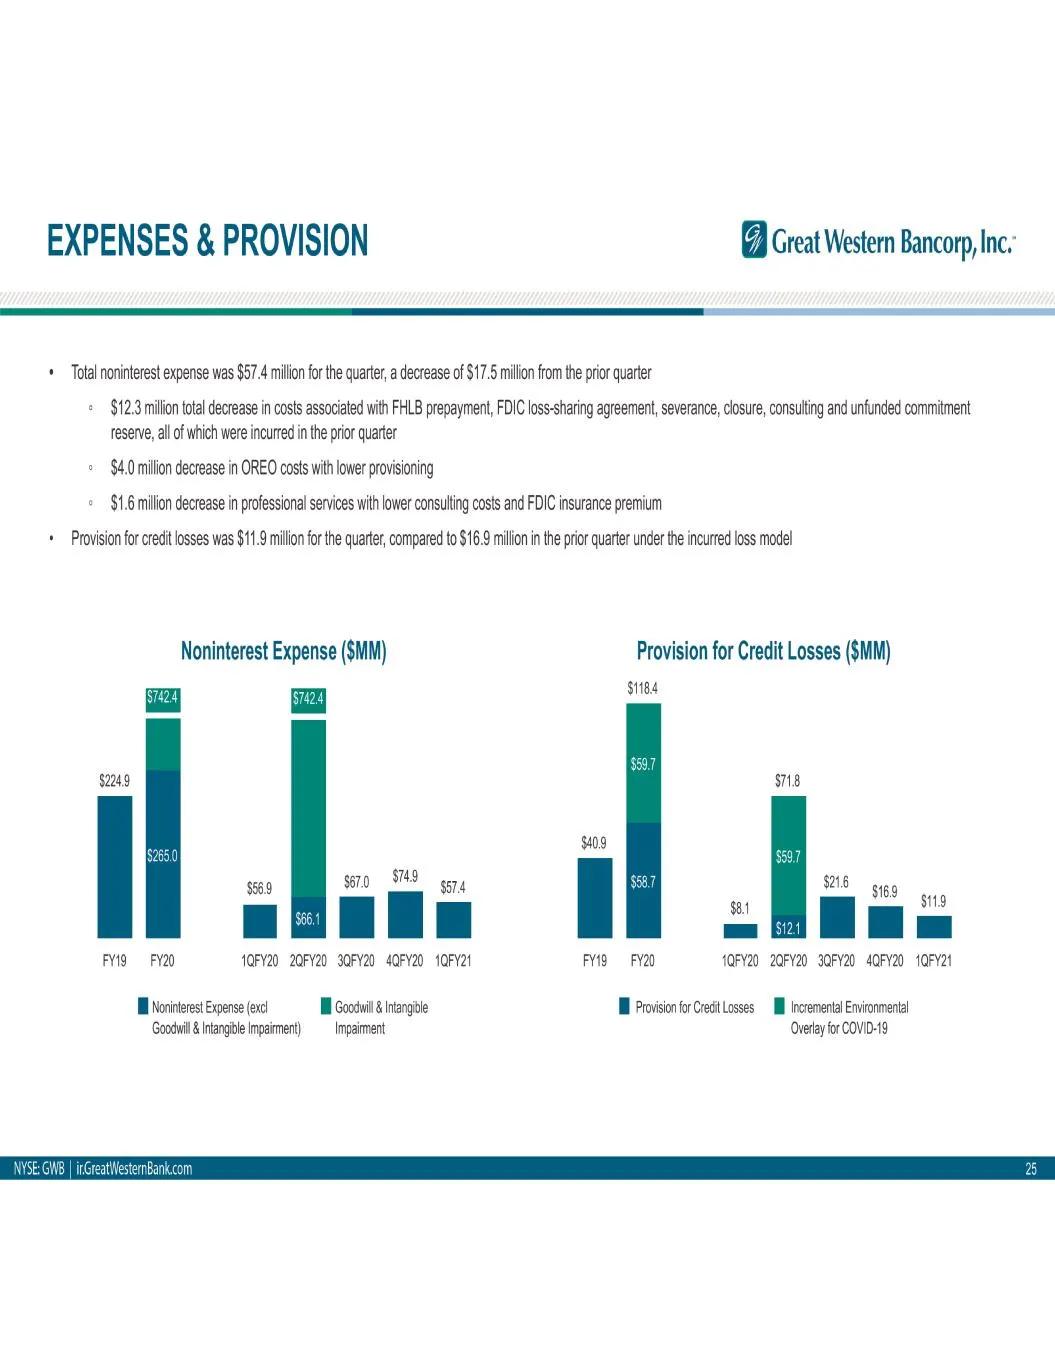
EXPENSES & PROVISION (2 Great Western Bancorp, Inc. + Total noninterest expense was $57.4 milion for the quarter, a decrease of $17.5 million from the prior quarter + $12.3 million total decrease in costs associated with FHLB prepayment, FDIC loss-sharing agreement, severance, closure, consulting an
Slide 26: Disclosures
DISCLOSURES ZA Great Western Bancorp, Inc. Forward Looking Statements: This press release contains forward-looking statements within the meaning of the Private Securities Litigation Reform Act of 1995. Statements about Great Western Bancorp, Inc.'s expectations, beliefs, plans, strategies, predictio
Slide 27: Appendix: Non-GAAP Measures
Great Western Bancorp, Inc. Appendix 1 Non-GAAP Measures
Slide 28: Non-GAAP Measures
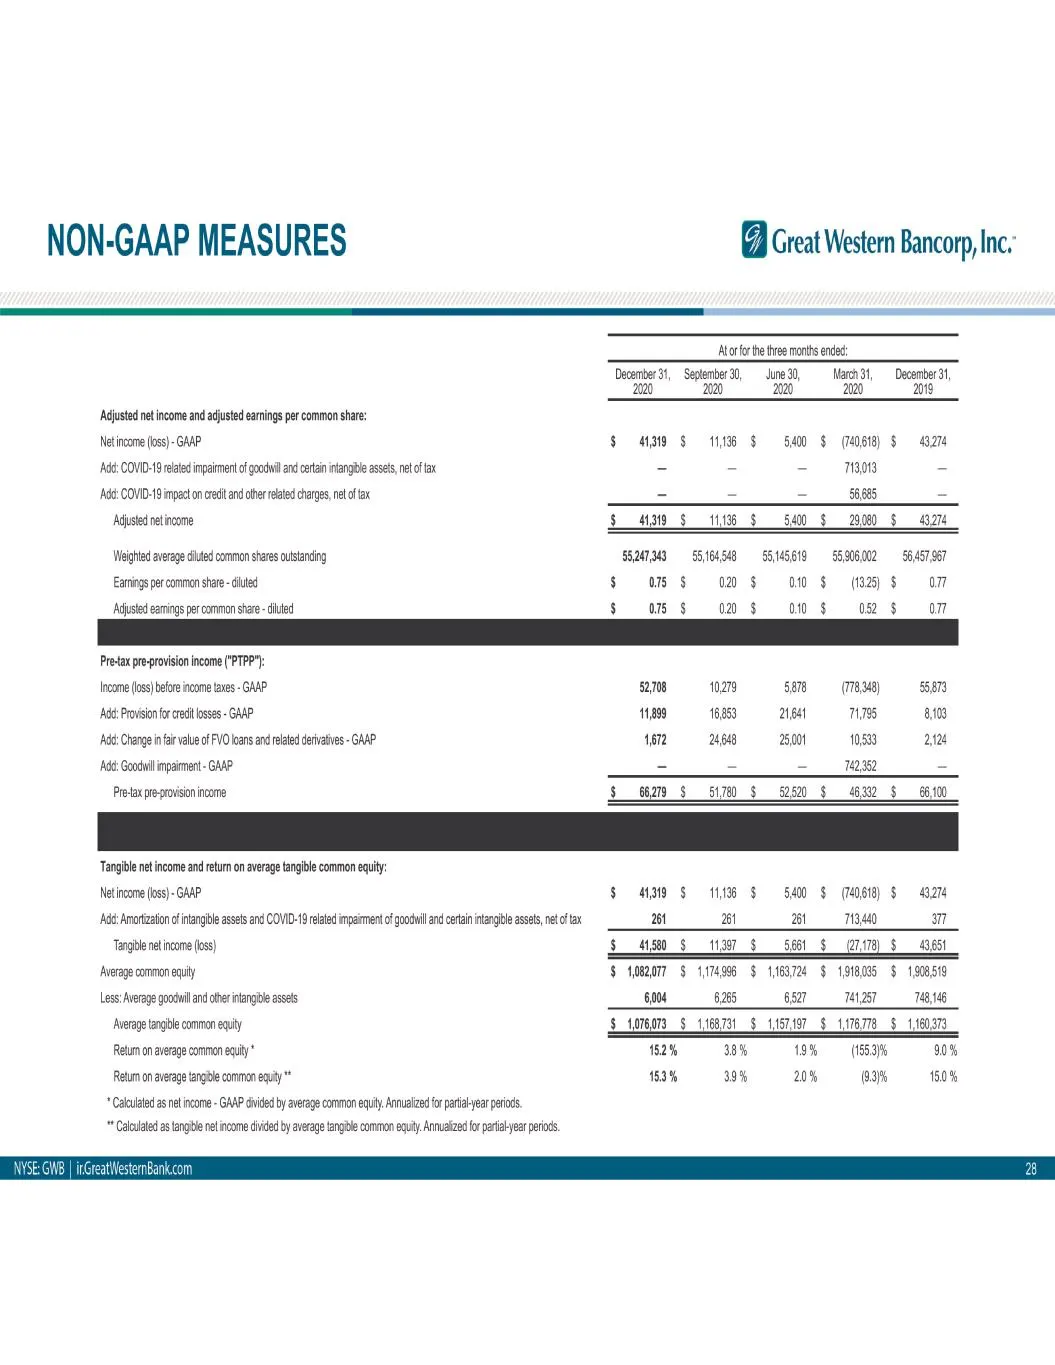
NON-GAAP MEASURES Great Western Bancorp, Inc. Ator forthe three months ended December 31, Seplember30, June 30, arch 31, December 3, 2000 Ei EY 2 20 ‘Adjusted net income and adjusted earings per common share: Netincome (ss) - GAAP $ MBO S$ 1116 $ 5400 § (MOpI8) $ 43274 ‘Add COVID-19 related impeimen
Slide 29: Non-GAAP Measures
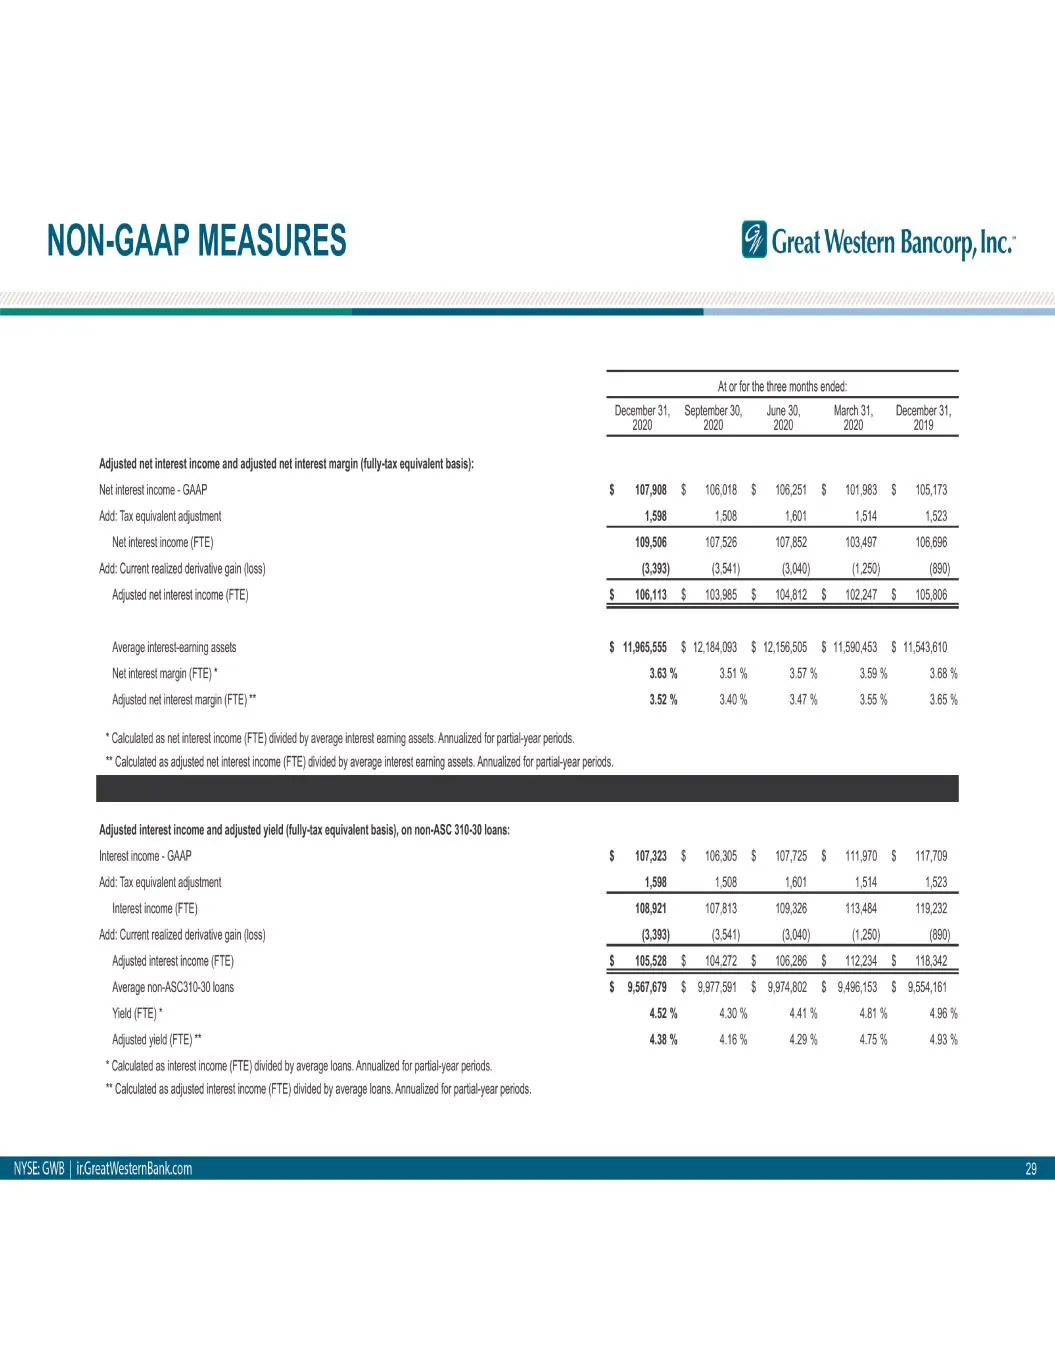
NON-GAAP MEASURES Great Western Bancorp, Inc. Atrforthe tee mons nde: December3t, Seplember 0, Jone30,—March31, Deventer 2000 2020 2000 2000 2019 ‘Adjusted net inerestincome and ajusted net interest margin uly ax equivalent basis): Netinerstincome - GAAP $ 107908 $ 105018 § 05251 $ 101983 §105173 ‘T
Slide 30: Non-GAAP Measures
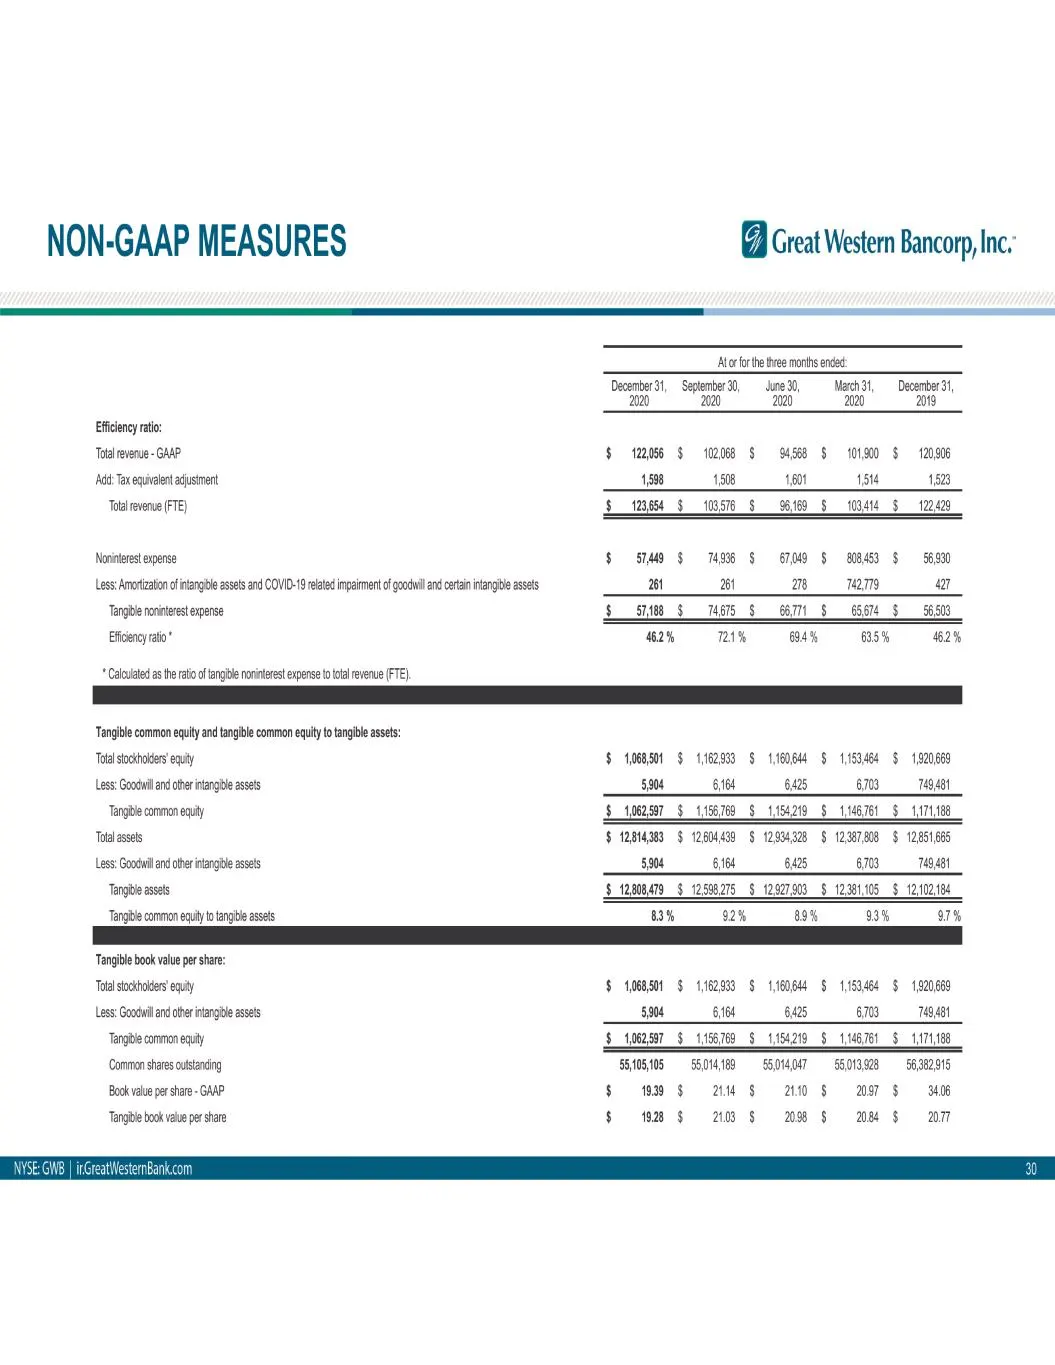
NON-GAAP MEASURES Great Western Bancorp, Inc. ‘Mc forthe tree months ended December 31, Septenber30, une30,—Mach31, December 31, 200 20 200 2000 219 ficiency rai: Tolalrverue- GAAP $ 122086 $0206 $9458 § 01900 § 120908 At Tax iva ausiment 1588 1508 901 1514 152 Tal revere (FTE) $ 123954 $3576 $9669
Slide 31: Appendix: Supplemental Ag & Hotel Portfolio Characteristics
Great Western Bancorp, Inc. Appendix 2 Supplemental Ag & Hotel Portfolio Characteristics
Slide 32: Ag Loan Portfolio
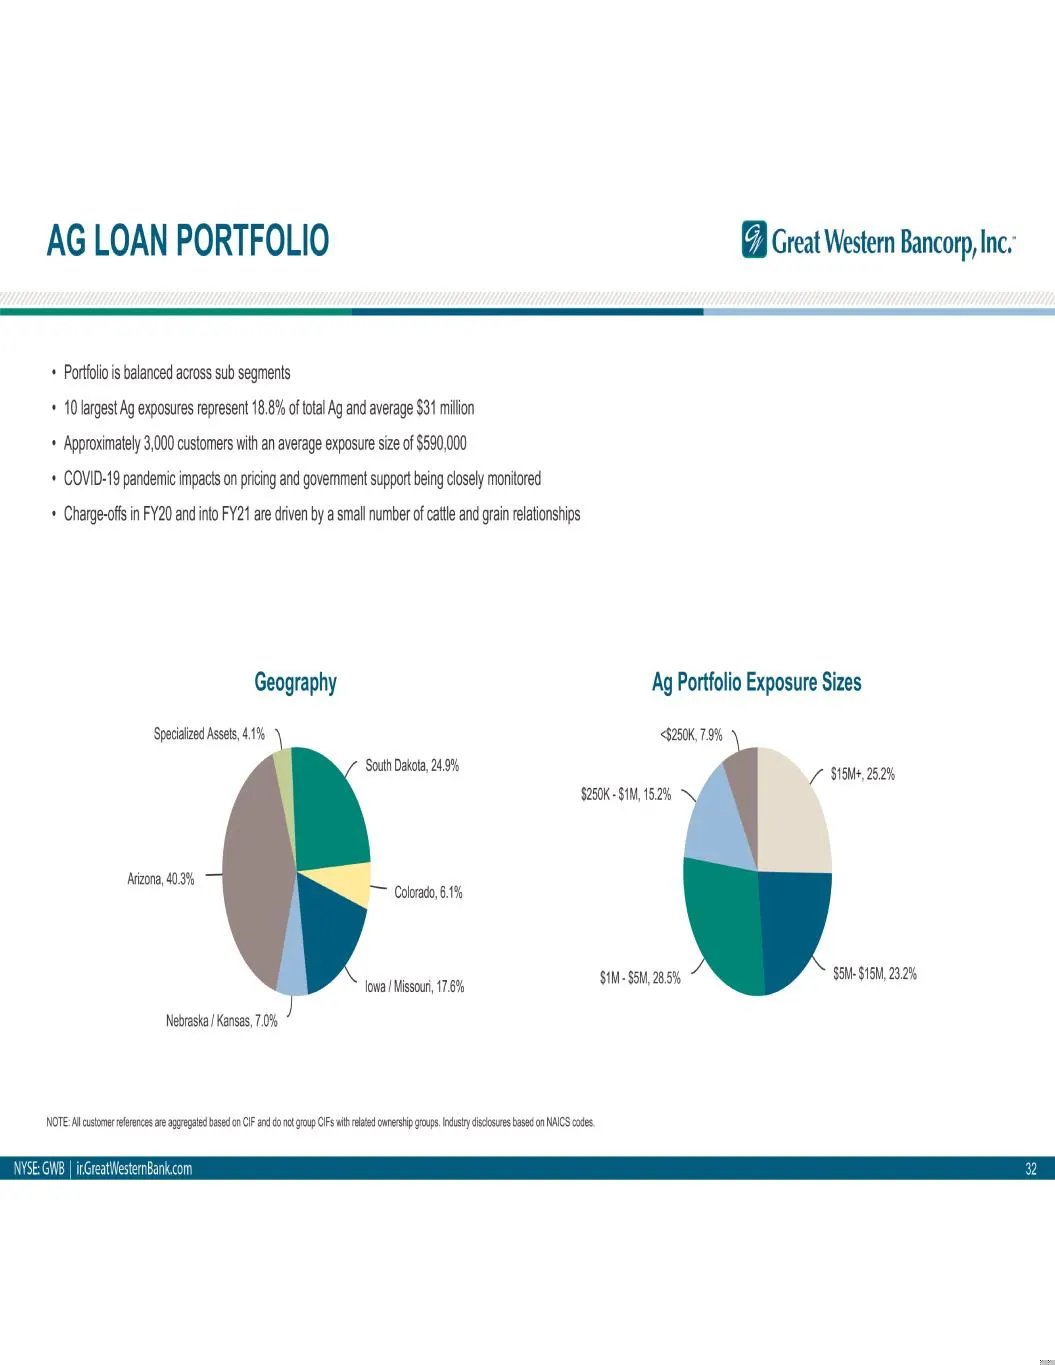
AG LOAN PORTFOLIO (A Great Western Bancorp, Inc. + Portfolio is balanced across sub segments + 10 largest Ag exposures represent 18.8% of total Ag and average $31 milion + Approximately 3,000 customers with an average exposure size of $590,000 + COVID-19 pandemic impacts on pricing and government su
Slide 33: More on Hotels
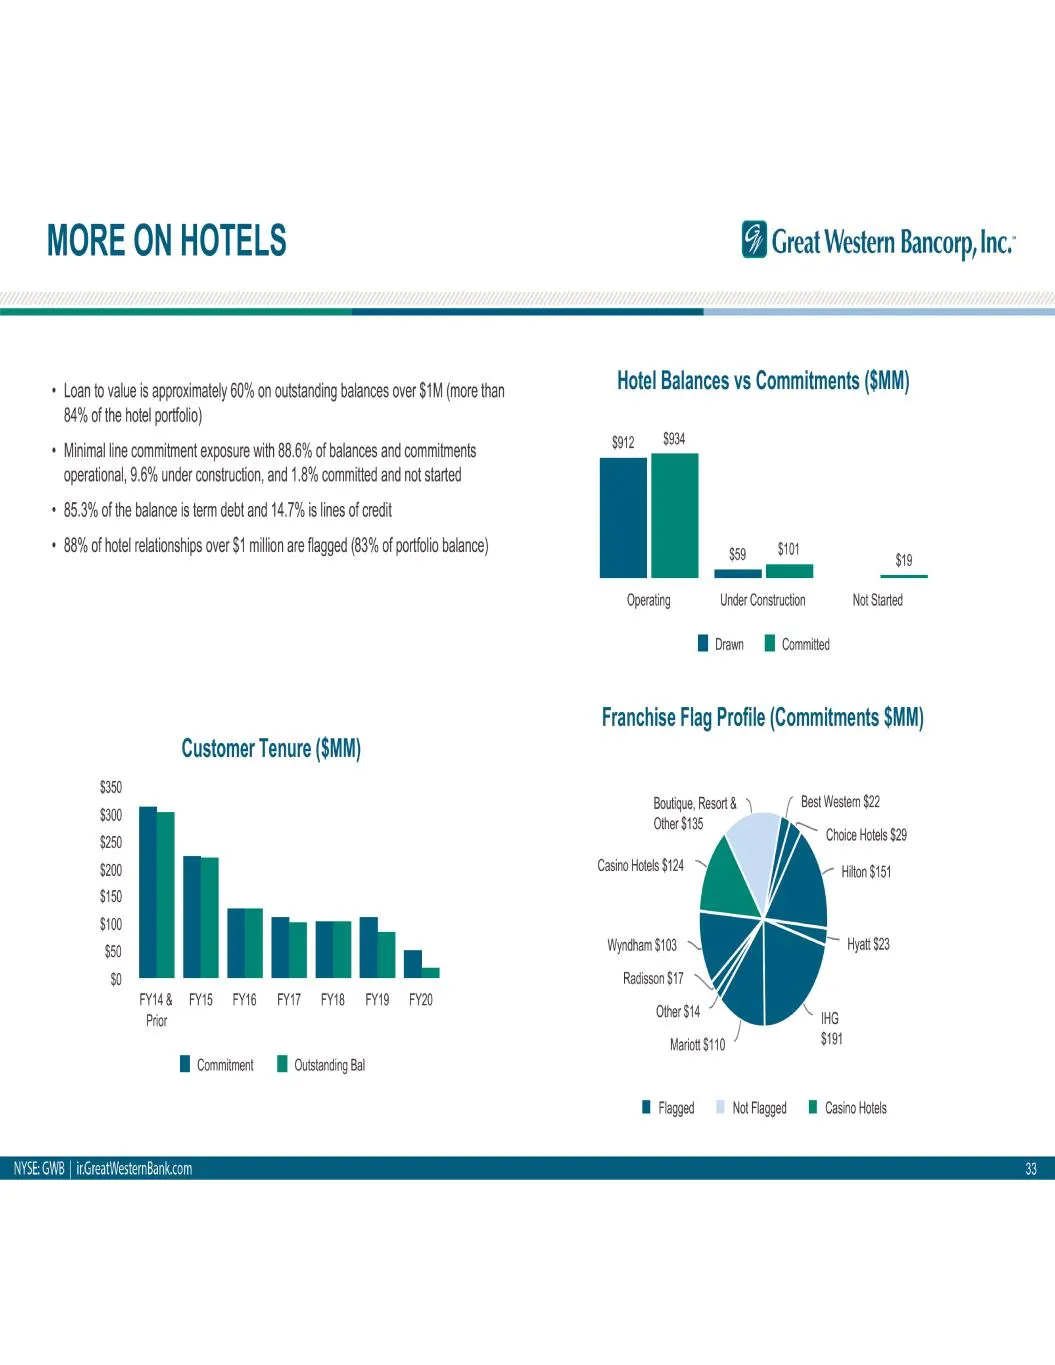
MORE ON HOTELS (A Great Western Bancorp, Inc. + Loan to value i approximately 60% on outstanding balances over $M (more than Hotel Balances vs Commitments ($MM) 84% of the hotel portfolio) + Minimal ine commitment exposure with 88.6% of balances and commitments soz $934 operational, 9.6% under const
Slide 34: Appendix: Agriculture Lending & Economy
Great Western Bancorp, Inc. Appendix 3 Agriculture Lending & Economy
Slide 35: Farm Income
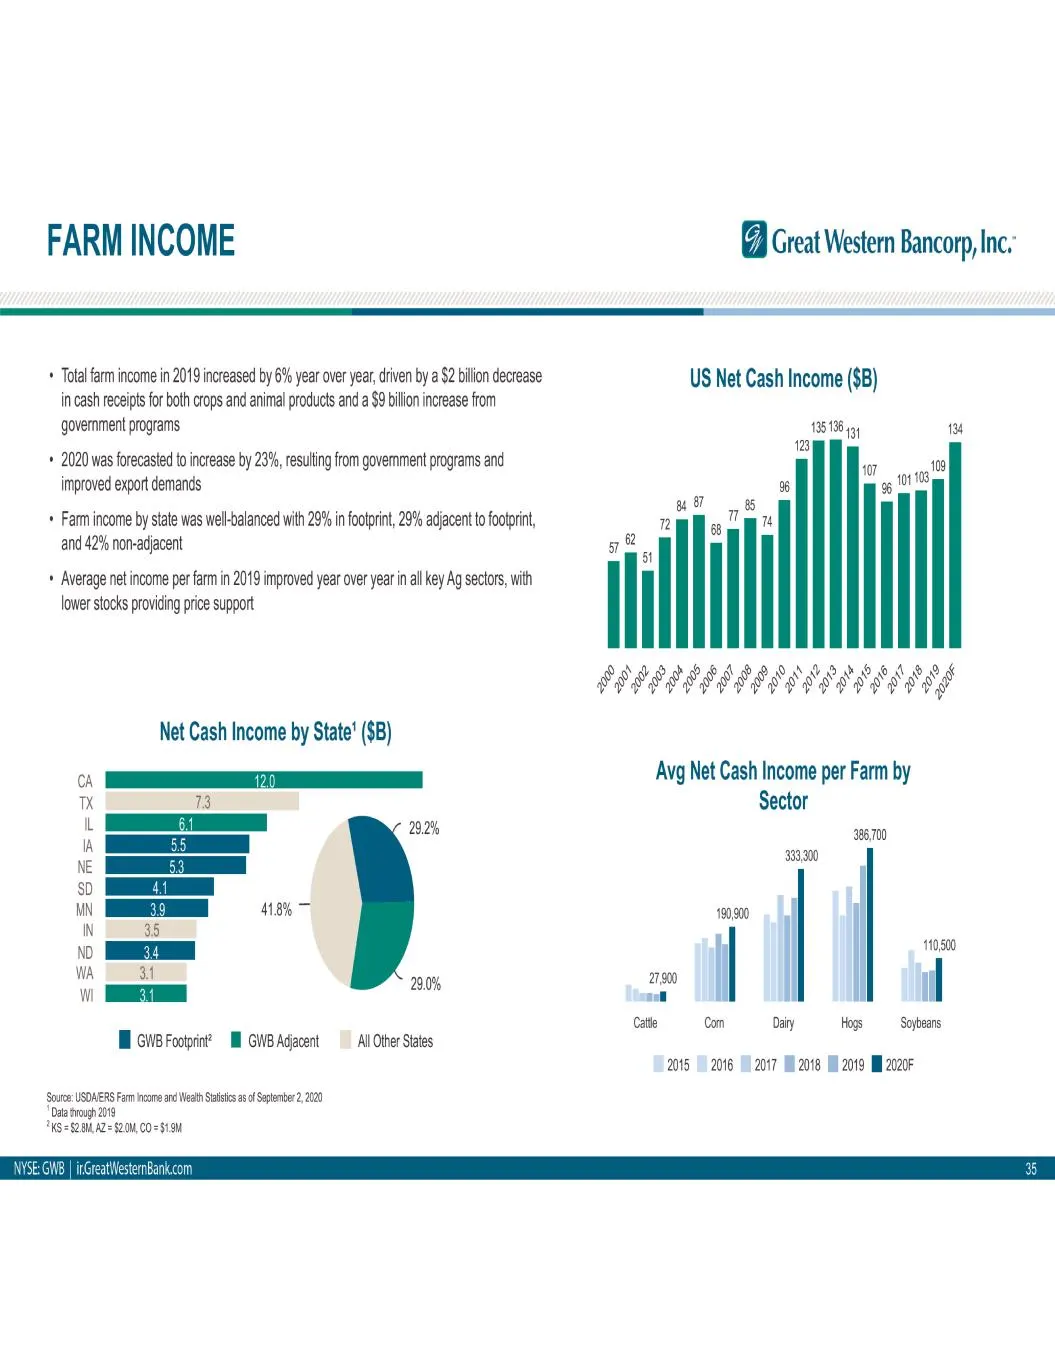
FARM INCOME * Total farm income in 2019 increased by 6% year over year, driven by a $2 billion decrease in cash receipts for both crops and animal products and a $9 billion increase from government programs + 2020 was forecasted to increase by 23%, resulting from government programs and improved exp
Slide 36: Farm Balance Sheets
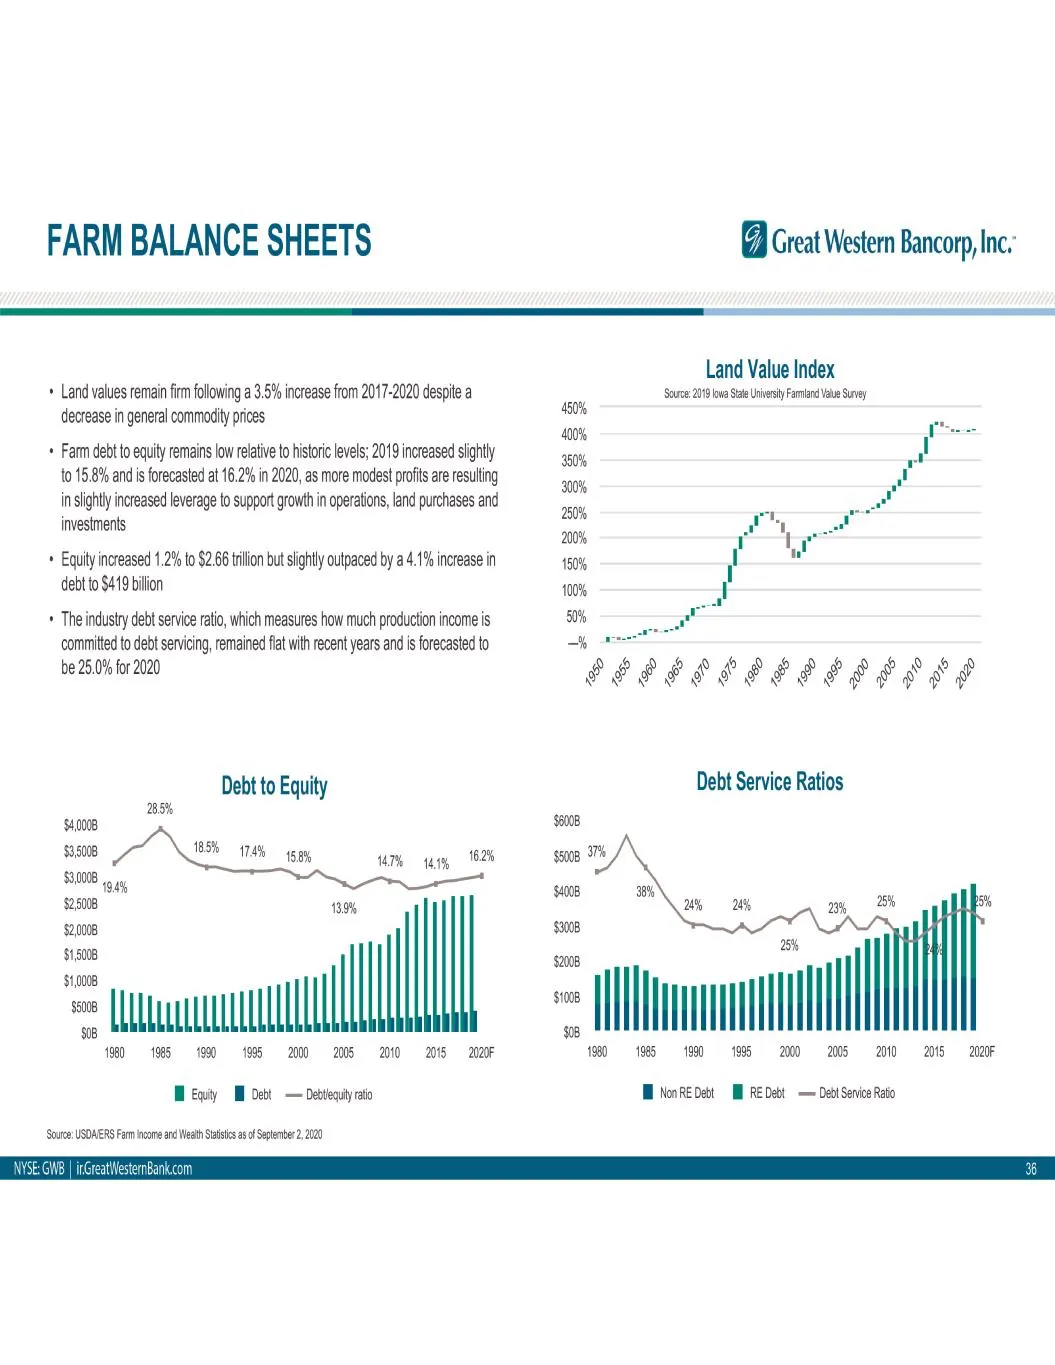
FARM BALANCE SHEETS + Land values remain firm following a 3.5% increase from 2017-2020 despite a decrease in general commodity prices + Farm debt to equity remains low relative to historic levels; 2019 increased slightly to 15.8% and is forecasted at 16.2% in 2020, as more modest profits are resulti
Slide 37: Appendix: Peer Group
Great Western Bancorp, Inc. Appendix 4 Peer Group
Slide 38: Peer Group
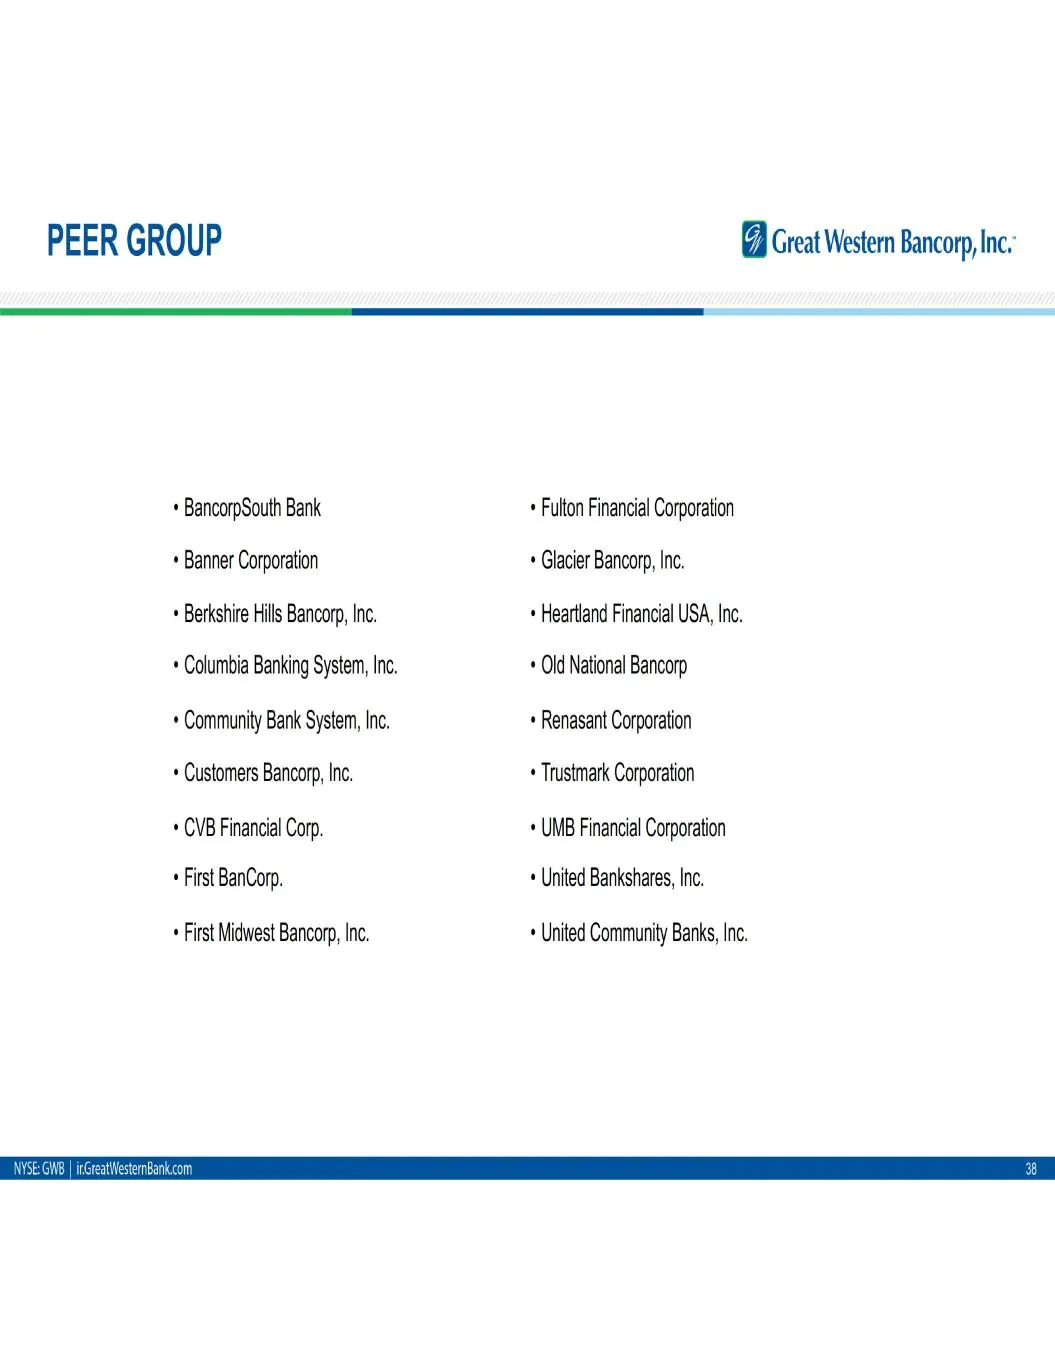
PEER GROUP + BancorpSouth Bank + Banner Corporation + Berkshire Hills Bancorp, Inc. * Columbia Banking System, Inc. + Community Bank System, Inc. * Customers Bancorp, Inc. * CVB Financial Corp. + First BanCorp. + First Midwest Bancorp, Inc. Great Western Bancorp, Inc. * Fulton Financial Corporation
Source: SEC EDGAR · 8-K filed Jan 27, 2021
More decks from Great Western Bancorp Inc
 Q1 FY2022 Earnings Presentation27 slides · Jan 27, 2022
 Merger or Acquisition (October 2021)55 slides · Oct 29, 2021
 Q4 2021 Earnings Presentation28 slides · Oct 26, 2021
 Merger or Acquisition (September 2021)14 slides · Sep 21, 2021
 Merger or Acquisition (September 2021)28 slides · Sep 16, 2021
 Q3 FY2021 Earnings Presentation32 slides · Jul 29, 2021