Great Western Bancorp — Q3 FY2021 Earnings Presentation
32 slides from Great Western Bancorp's earnings presentation, Jul 29, 2021
Slide 1: Investor Presentation | June 30, 2021
Investor Presentation | June 30, 2021
Slide 2: Key Developments
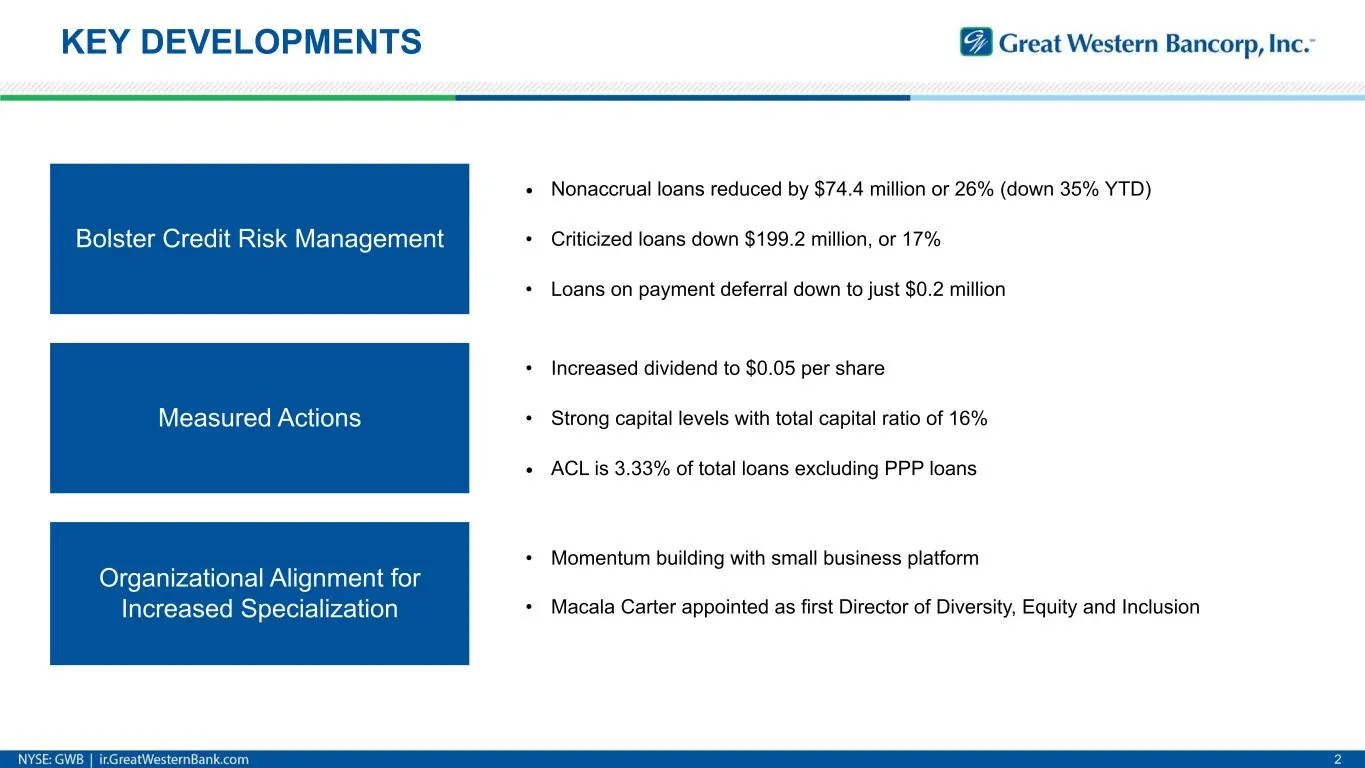
KEY DEVELOPMENTS 2 Bolster Credit Risk Management • Nonaccrual loans reduced by $74.4 million or 26% (down 35% YTD) • Criticized loans down $199.2 million, or 17% • Loans on payment deferral down to just $0.2 million Measured Actions • Increased dividend to $0.05 per share • Strong capital levels wi
Slide 3: Earnings Overview
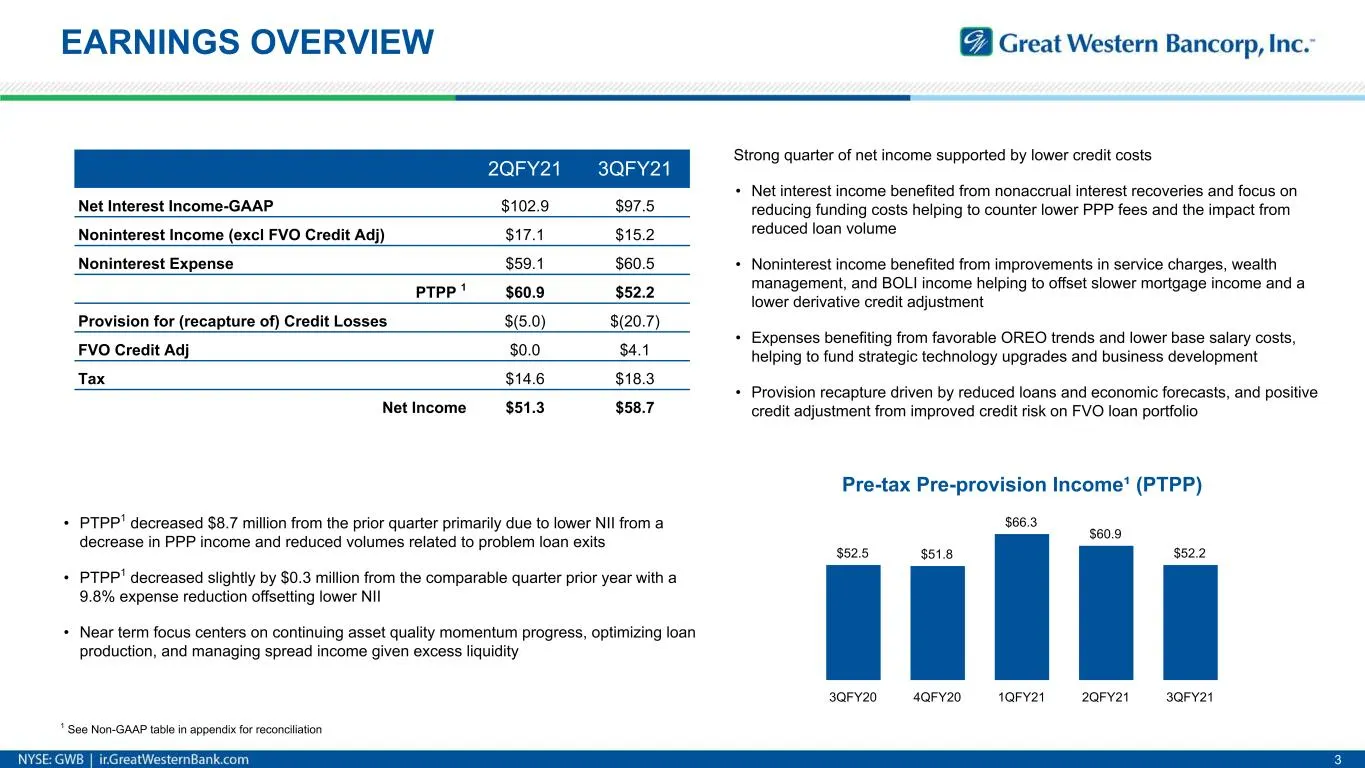
EARNINGS OVERVIEW 3 2QFY21 3QFY21 Net Interest Income-GAAP $102.9 $97.5 Noninterest Income (excl FVO Credit Adj) $17.1 $15.2 Noninterest Expense $59.1 $60.5 PTPP 1 $60.9 $52.2 Provision for (recapture of) Credit Losses $(5.0) $(20.7) FVO Credit Adj $0.0 $4.1 Tax $14.6 $18.3 Net Income $51.3 $58.7 St
Slide 4: Net Interest Income and NIM Analysis
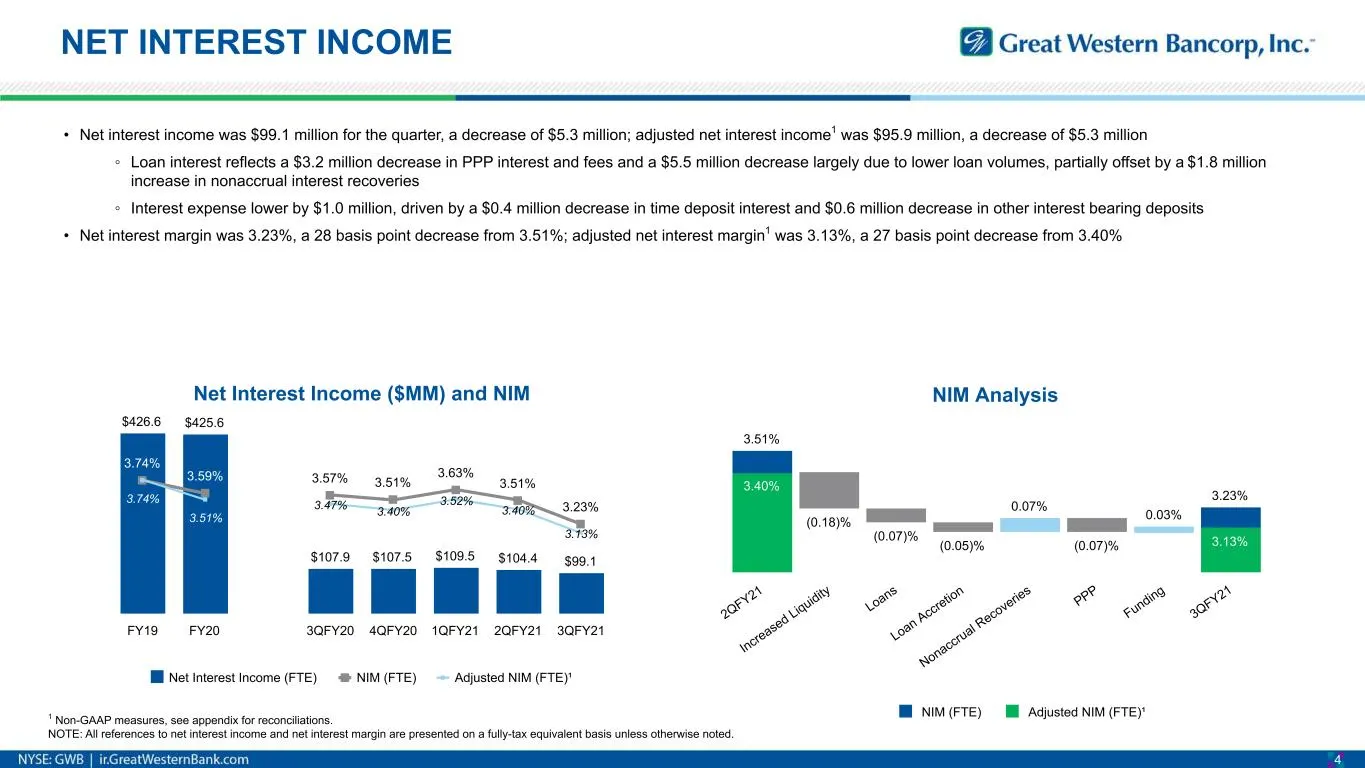
NIM Analysis 3.40% (0.18)% (0.07)% (0.05)% 0.07% (0.07)% 0.03% 3.13% 3.51% 3.23% NIM (FTE) Adjusted NIM (FTE)¹ 2QFY21 Incre ased Liquidity Loans Loan Accr etion Nonaccr ual R ecoveries PPP Funding 3QFY21 Net Interest Income ($MM) and NIM $426.6 $425.6 $107.9 $107.5 $109.5 $104.4 $99.1 3.74% 3.59% 3.
Slide 5: Net Interest Income (cont'd)
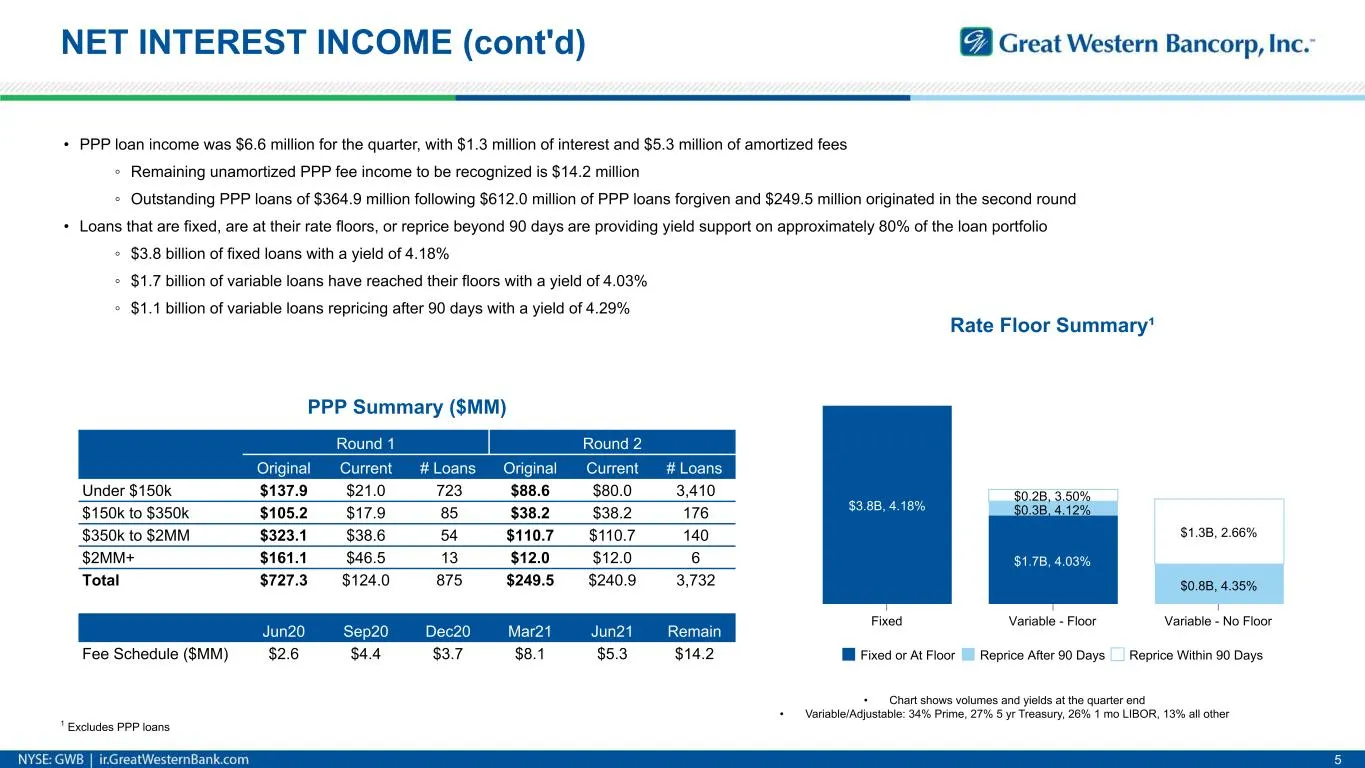
NET INTEREST INCOME (cont'd) 5 • PPP loan income was $6.6 million for the quarter, with $1.3 million of interest and $5.3 million of amortized fees ◦ Remaining unamortized PPP fee income to be recognized is $14.2 million ◦ Outstanding PPP loans of $364.9 million following $612.0 million of PPP loans
Slide 6: Noninterest Income
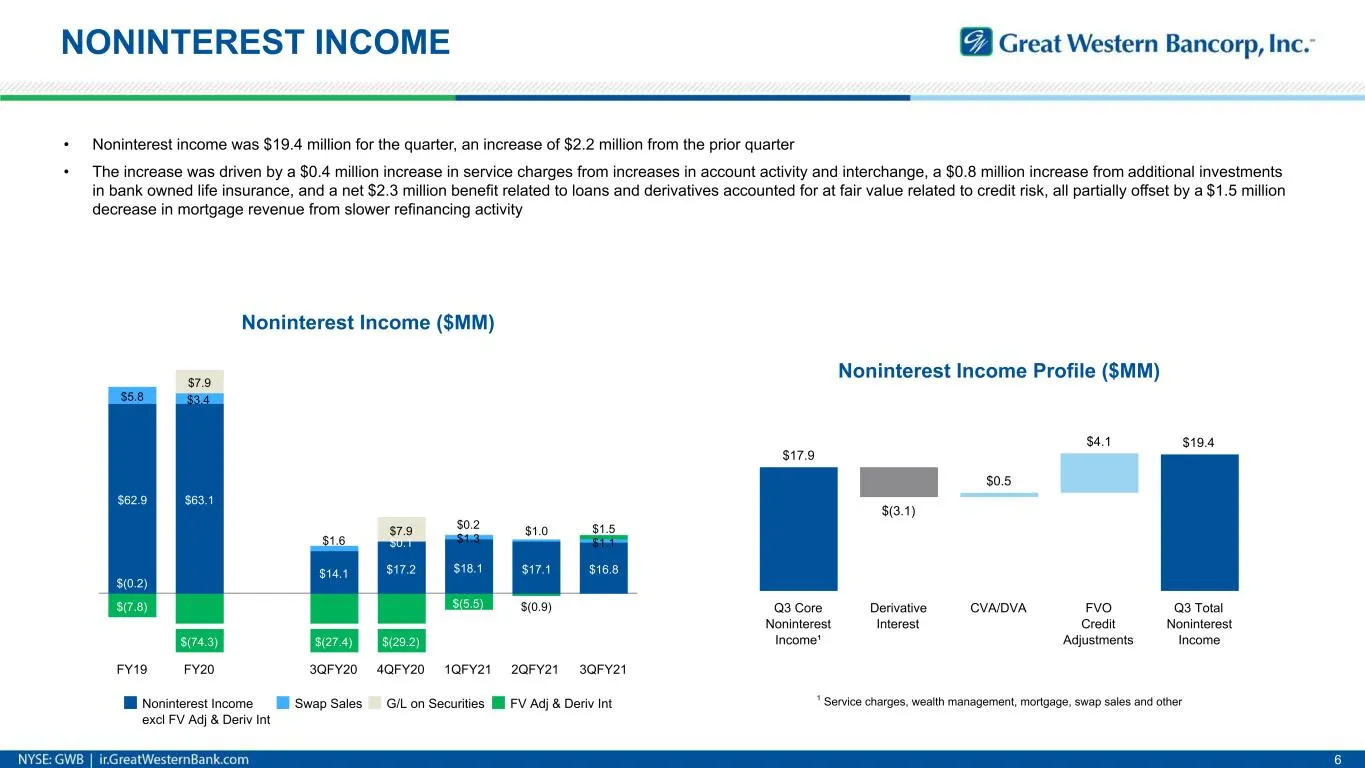
6 NONINTEREST INCOME • Noninterest income was $19.4 million for the quarter, an increase of $2.2 million from the prior quarter • The increase was driven by a $0.4 million increase in service charges from increases in account activity and interchange, a $0.8 million increase from additional investme
Slide 7: Expenses & Provision
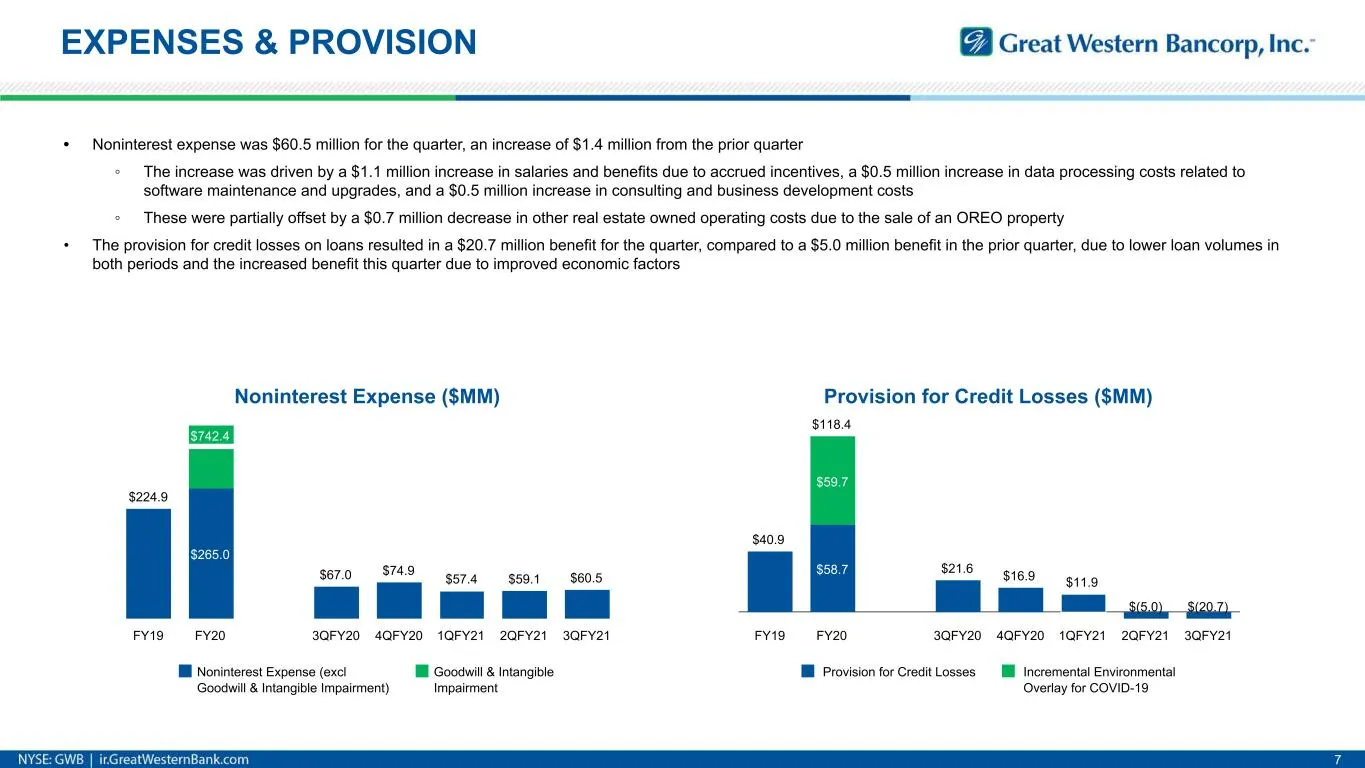
Provision for Credit Losses ($MM) $40.9 $118.4 $21.6 $16.9 $11.9 $58.7 $(5.0) $(20.7) $59.7 Provision for Credit Losses Incremental Environmental Overlay for COVID-19 FY19 FY20 3QFY20 4QFY20 1QFY21 2QFY21 3QFY21 7 EXPENSES & PROVISION • Noninterest expense was $60.5 million for the quarter, an incre
Slide 8: ACL & Credit Coverage
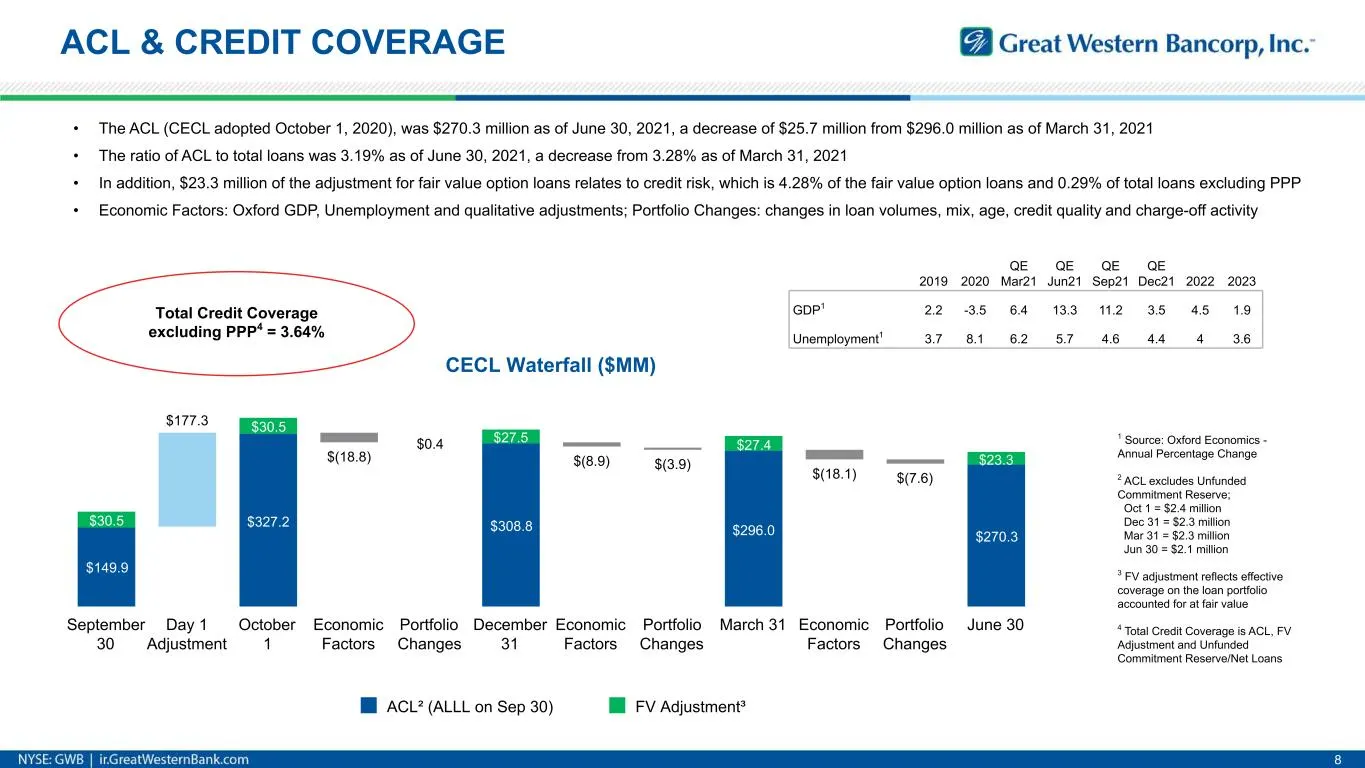
ACL & CREDIT COVERAGE 8 • The ACL (CECL adopted October 1, 2020), was $270.3 million as of June 30, 2021, a decrease of $25.7 million from $296.0 million as of March 31, 2021 • The ratio of ACL to total loans was 3.19% as of June 30, 2021, a decrease from 3.28% as of March 31, 2021 • In addition, $2
Slide 9: Capital
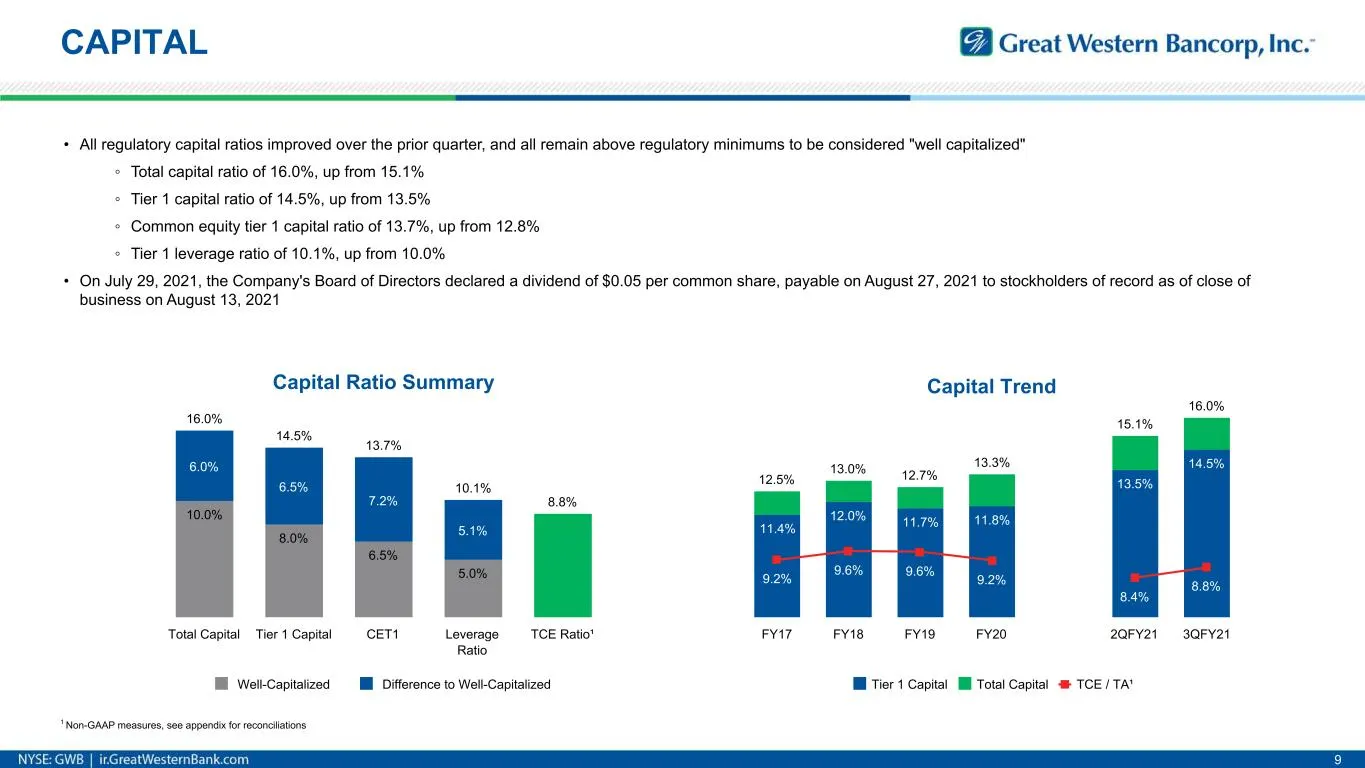
CAPITAL 9 • All regulatory capital ratios improved over the prior quarter, and all remain above regulatory minimums to be considered "well capitalized" ◦ Total capital ratio of 16.0%, up from 15.1% ◦ Tier 1 capital ratio of 14.5%, up from 13.5% ◦ Common equity tier 1 capital ratio of 13.7%, up from
Slide 10: Deposits
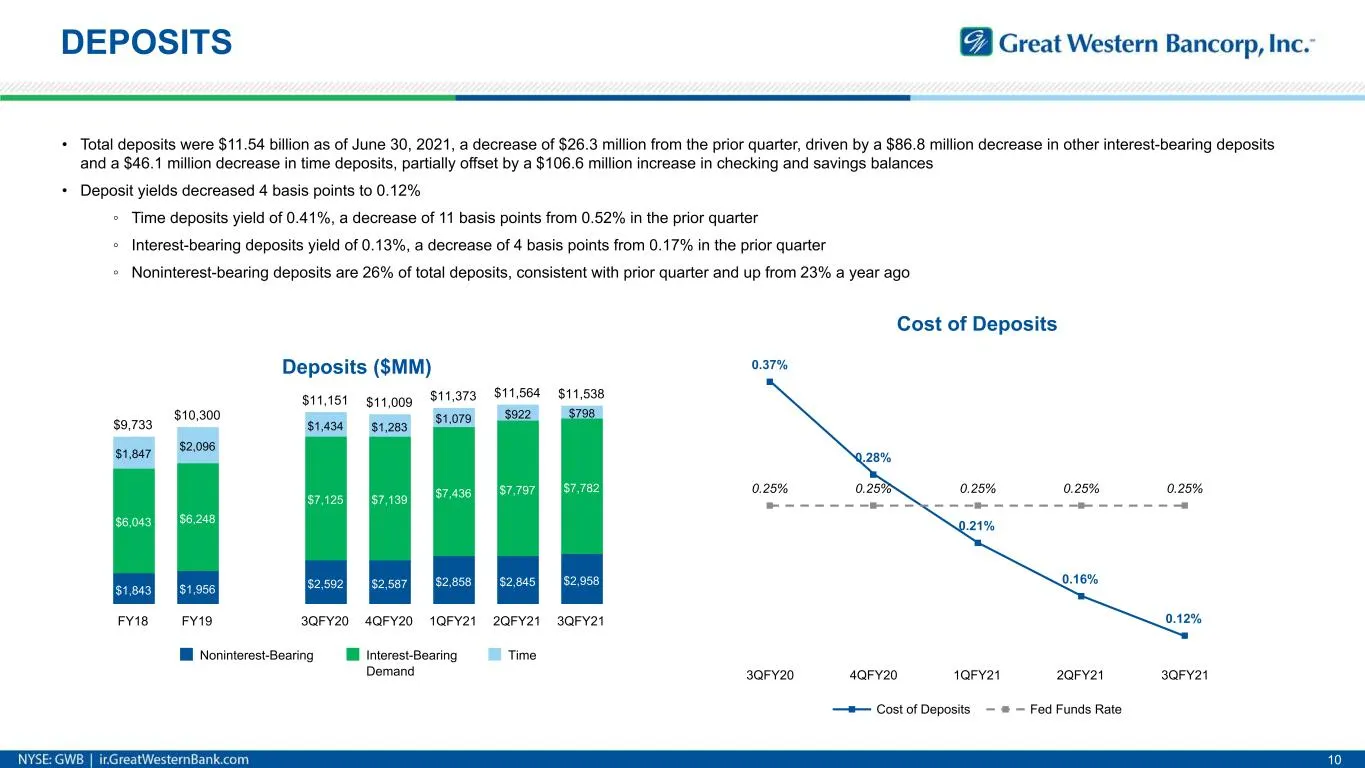
DEPOSITS 10 • Total deposits were $11.54 billion as of June 30, 2021, a decrease of $26.3 million from the prior quarter, driven by a $86.8 million decrease in other interest-bearing deposits and a $46.1 million decrease in time deposits, partially offset by a $106.6 million increase in checking and
Slide 11: Loan Overview
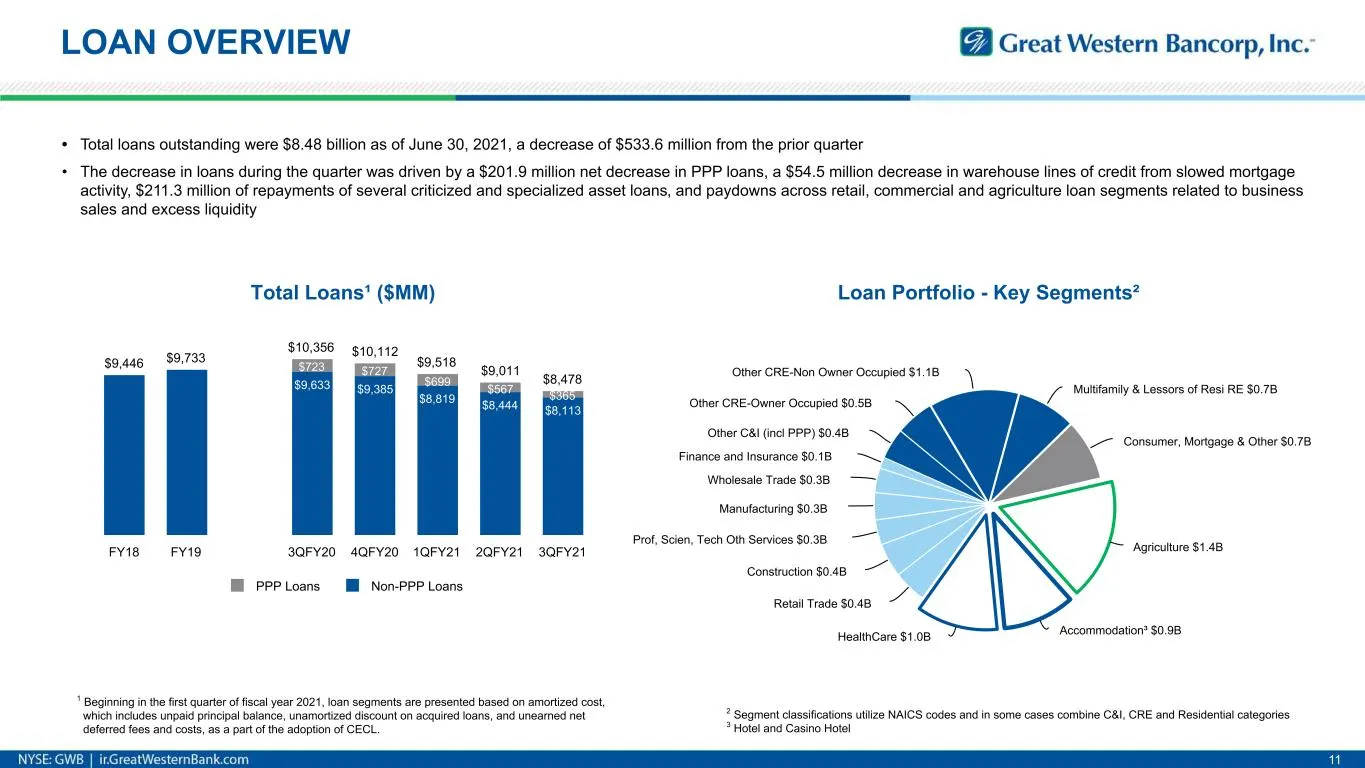
Loan Portfolio - Key Segments² Agriculture $1.4B Accommodation³ $0.9BHealthCare $1.0B Retail Trade $0.4B Construction $0.4B Prof, Scien, Tech Oth Services $0.3B Manufacturing $0.3B Wholesale Trade $0.3B Finance and Insurance $0.1B Other C&I (incl PPP) $0.4B Other CRE-Owner Occupied $0.5B Other CRE-N
Slide 12: Credit Overview
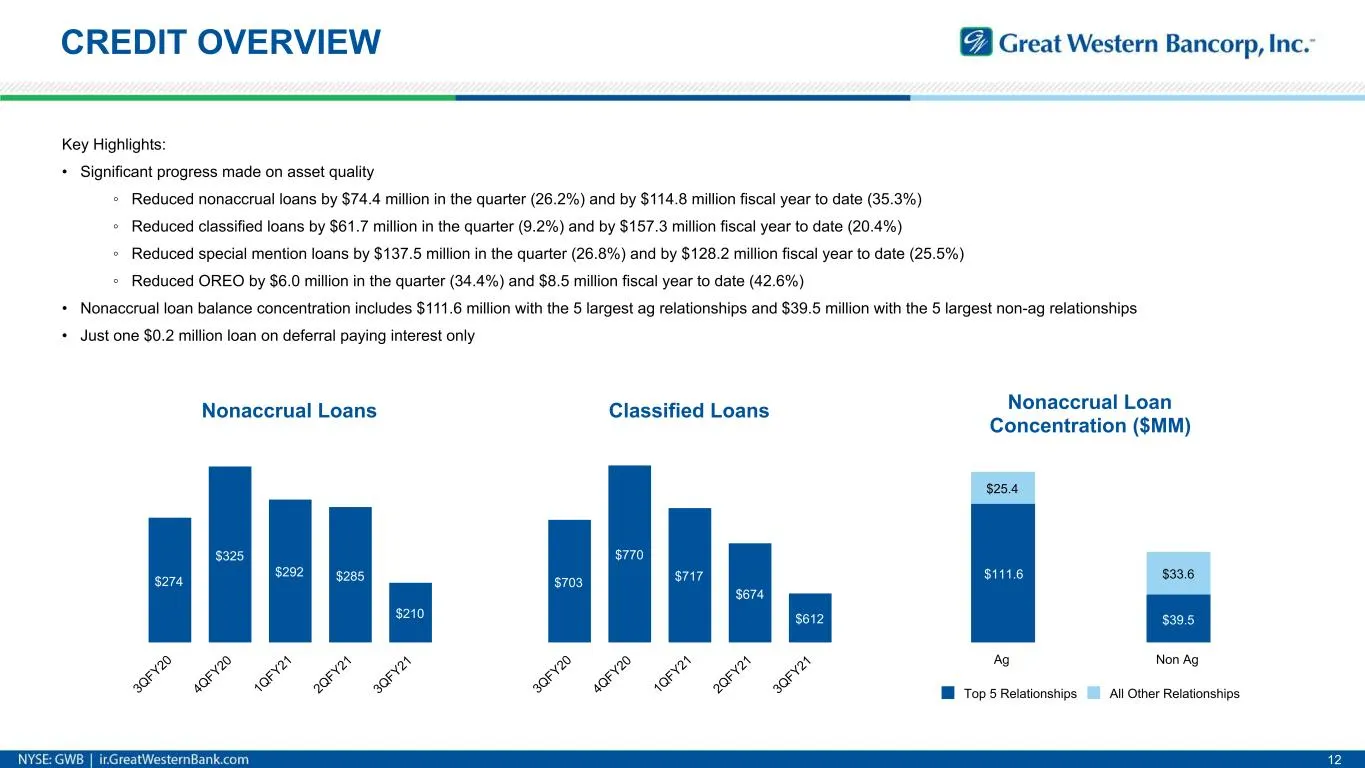
CREDIT OVERVIEW 12 Key Highlights: • Significant progress made on asset quality ◦ Reduced nonaccrual loans by $74.4 million in the quarter (26.2%) and by $114.8 million fiscal year to date (35.3%) ◦ Reduced classified loans by $61.7 million in the quarter (9.2%) and by $157.3 million fiscal year to
Slide 13: Asset Quality Metrics
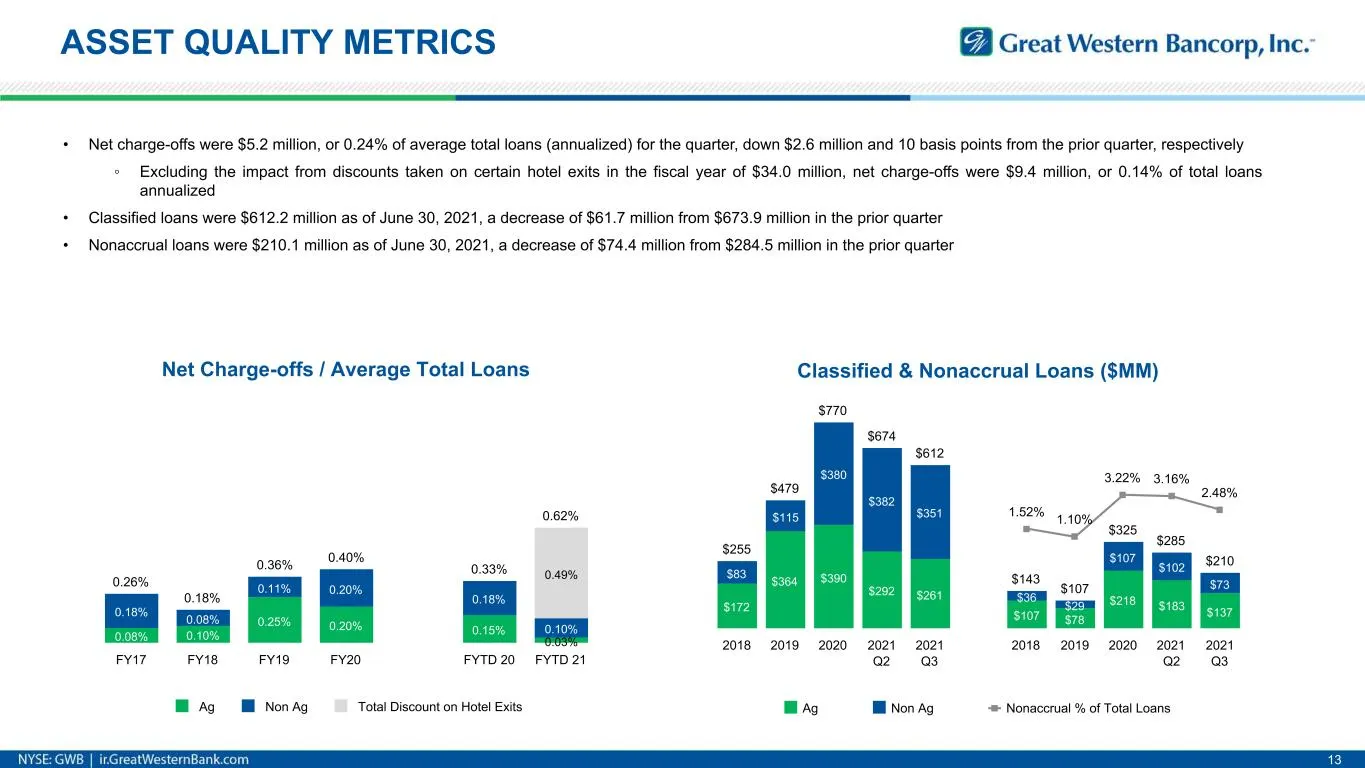
Net Charge-offs / Average Total Loans 0.08% 0.10% 0.25% 0.20% 0.15% 0.03% 0.18% 0.08% 0.11% 0.20% 0.18% 0.10% 0.49%0.26% 0.18% 0.36% 0.40% 0.33% 0.62% Ag Non Ag Total Discount on Hotel Exits FY17 FY18 FY19 FY20 FYTD 20 FYTD 21 ASSET QUALITY METRICS 13 • Net charge-offs were $5.2 million, or 0.24% of
Slide 14: Key Loan Segments
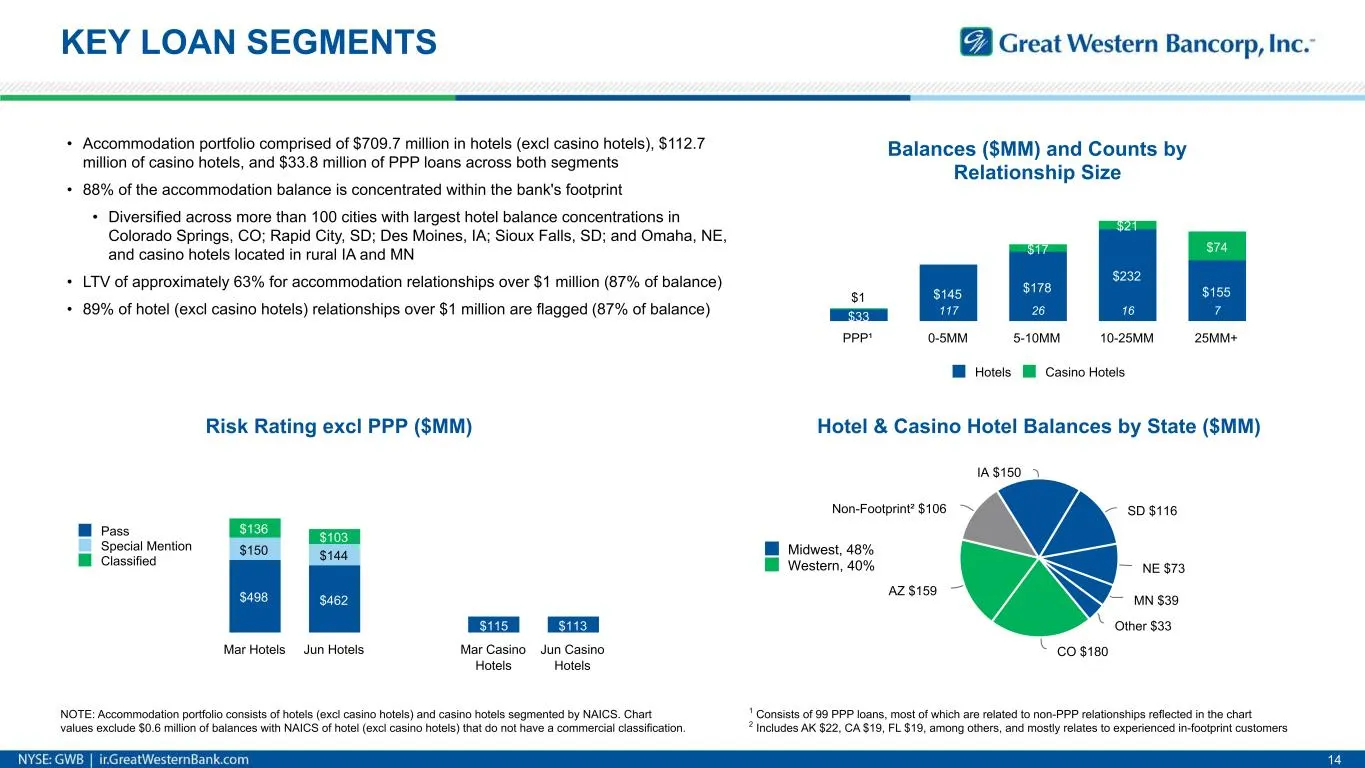
KEY LOAN SEGMENTS 14 Midwest, 48% Western, 40% Hotel & Casino Hotel Balances by State ($MM) IA $150 SD $116 NE $73 MN $39 Other $33 CO $180 AZ $159 Non-Footprint² $106 1 Consists of 99 PPP loans, most of which are related to non-PPP relationships reflected in the chart 2 Includes AK $22, CA $19, FL
Slide 15: Key Loan Segments (cont'd)
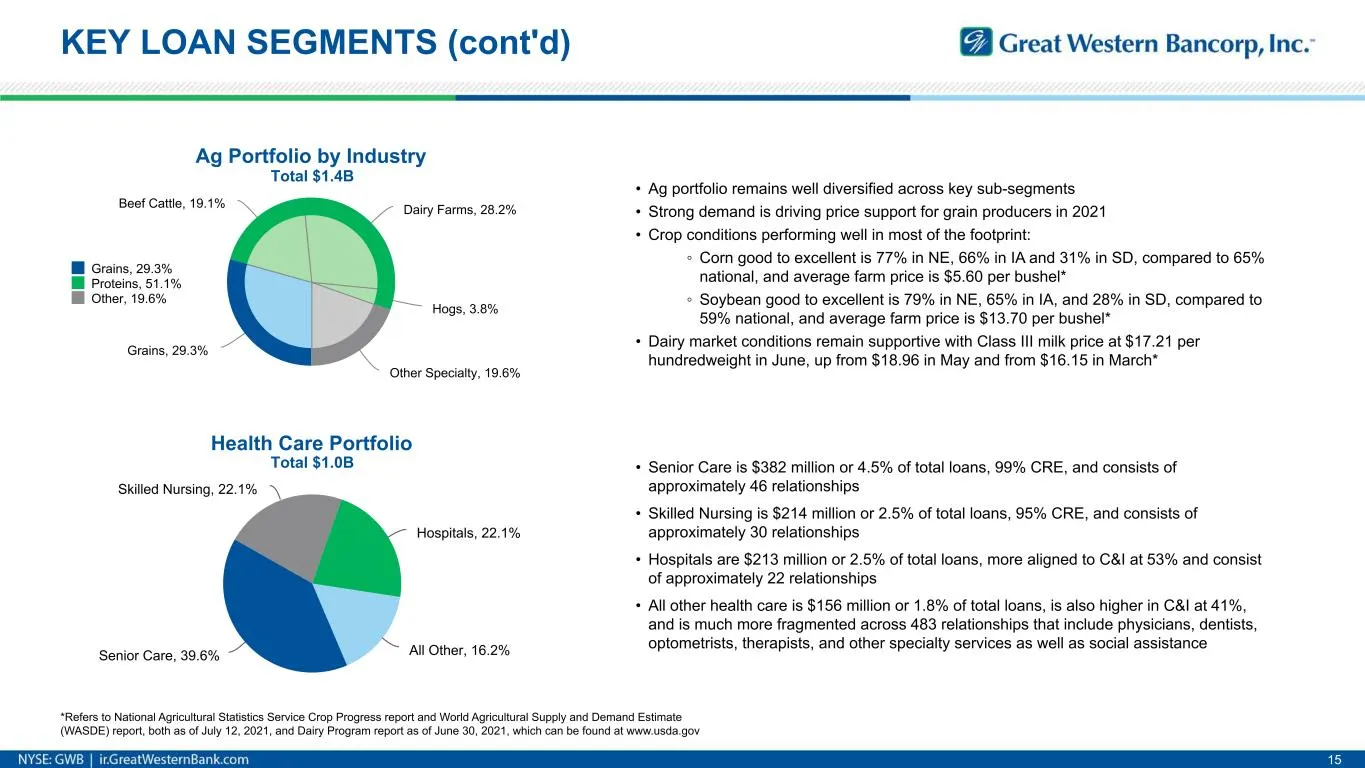
Ag Portfolio by Industry Grains, 29.3% Beef Cattle, 19.1% Dairy Farms, 28.2% Hogs, 3.8% Other Specialty, 19.6% Grains, 29.3% Proteins, 51.1% Other, 19.6% KEY LOAN SEGMENTS (cont'd) 15 Health Care Portfolio Senior Care, 39.6% Skilled Nursing, 22.1% Hospitals, 22.1% All Other, 16.2% • Senior Care is $
Slide 16: Forward Looking Statements
Forward Looking Statements: This press release contains forward-looking statements within the meaning of the Private Securities Litigation Reform Act of 1995. Statements about Great Western Bancorp, Inc.’s expectations, beliefs, plans, strategies, predictions, forecasts, objectives, assumptions or f
Slide 17: Appendix Supplemental Data
Appendix 1 Supplemental Data
Slide 18: Company Snapshot and Footprint
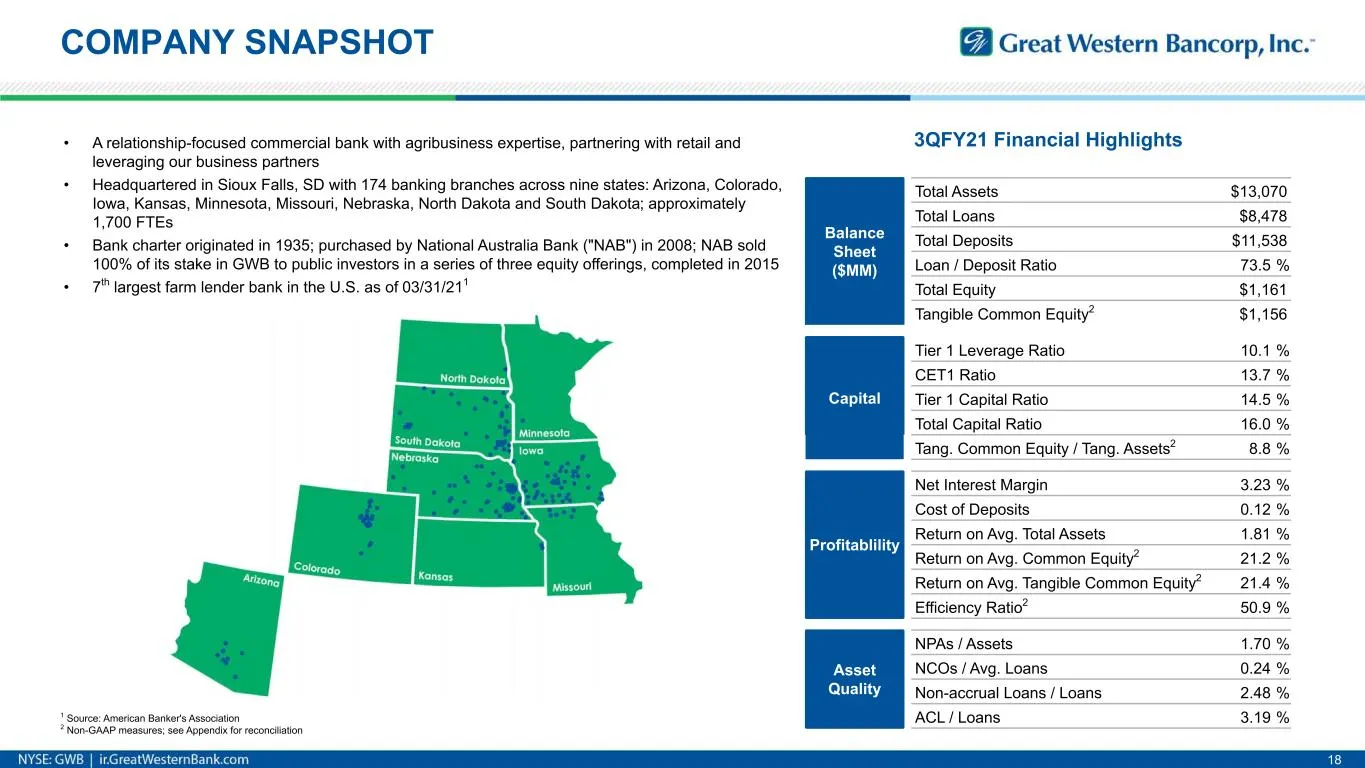
Footprint 18 COMPANY SNAPSHOT • A relationship-focused commercial bank with agribusiness expertise, partnering with retail and leveraging our business partners • Headquartered in Sioux Falls, SD with 174 banking branches across nine states: Arizona, Colorado, Iowa, Kansas, Minnesota, Missouri, Nebra
Slide 19: Experienced Management Team
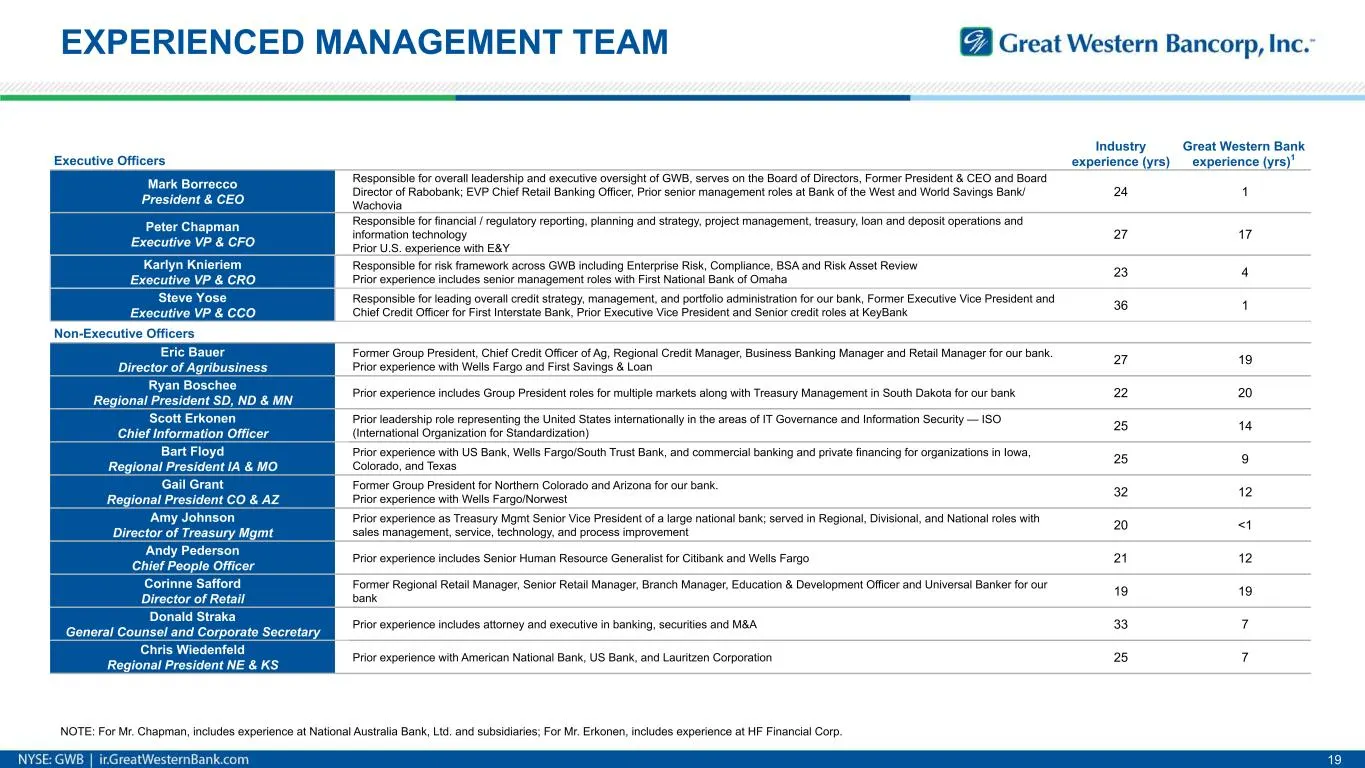
EXPERIENCED MANAGEMENT TEAM 19 Executive Officers x x Industry experience (yrs) Great Western Bank experience (yrs)1 Mark Borrecco President & CEO x Responsible for overall leadership and executive oversight of GWB, serves on the Board of Directors, Former President & CEO and Board Director of Rabob
Slide 20: Portfolio Footprint
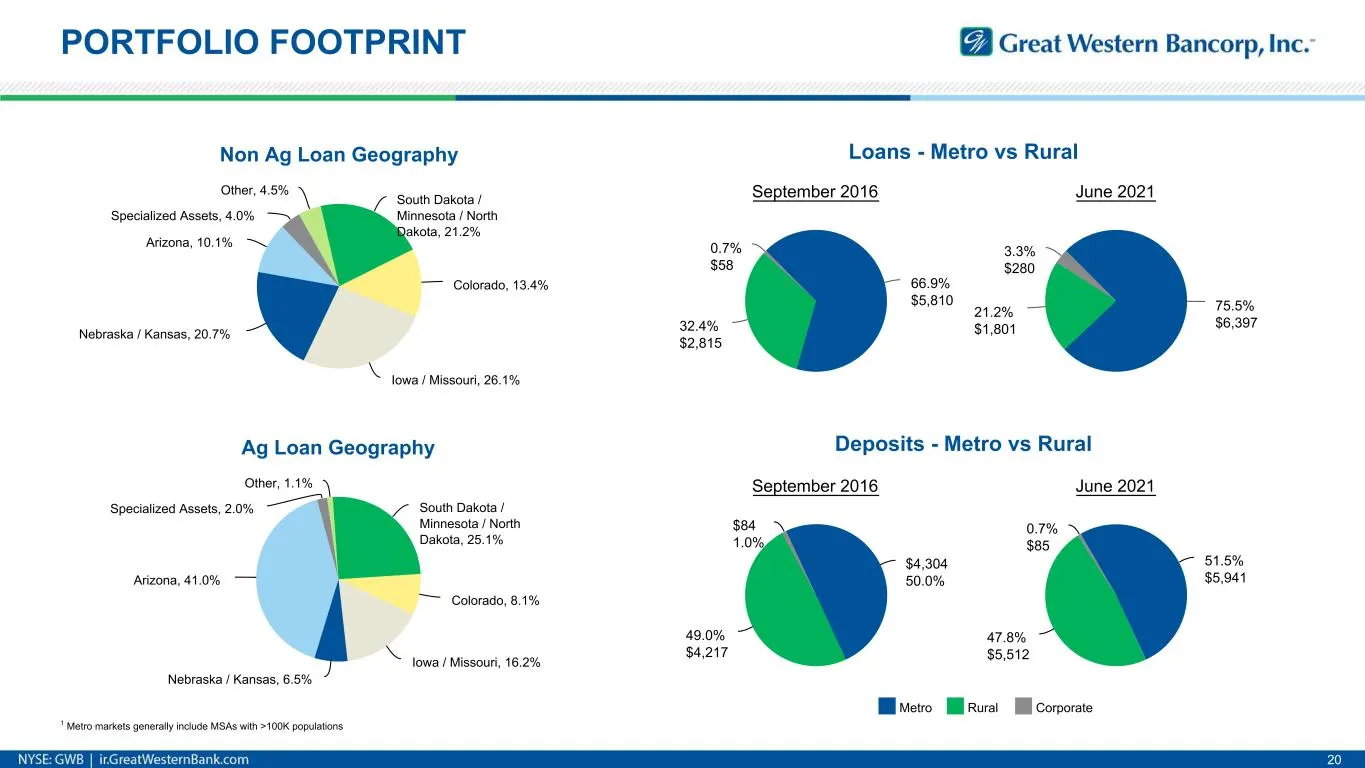
June 2021 75.5% $6,397 21.2% $1,801 3.3% $280 PORTFOLIO FOOTPRINT September 2016 $4,304 50.0% 49.0% $4,217 $84 1.0% June 2021 51.5% $5,941 47.8% $5,512 0.7% $85 1 Metro markets generally include MSAs with >100K populations 20 September 2016 66.9% $5,810 32.4% $2,815 0.7% $58 Ag Loan Geography South
Slide 21: Commercial Loans
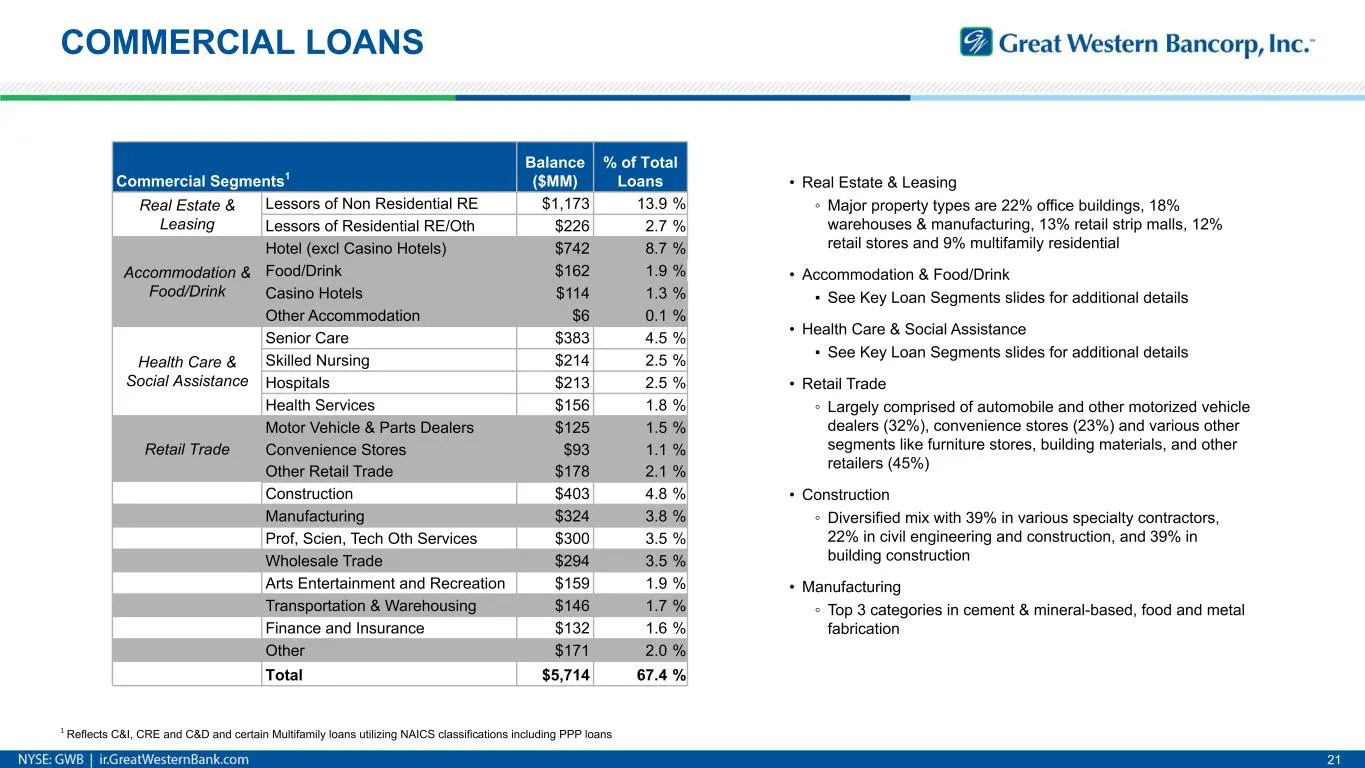
COMMERCIAL LOANS 21 Commercial Segments1 Balance ($MM) % of Total Loans Real Estate & Leasing Lessors of Non Residential RE $1,173 13.9 % Lessors of Residential RE/Oth $226 2.7 % Accommodation & Food/Drink Hotel (excl Casino Hotels) $742 8.7 % Food/Drink $162 1.9 % Casino Hotels $114 1.3 % Other Acc
Slide 22: More on Hotels
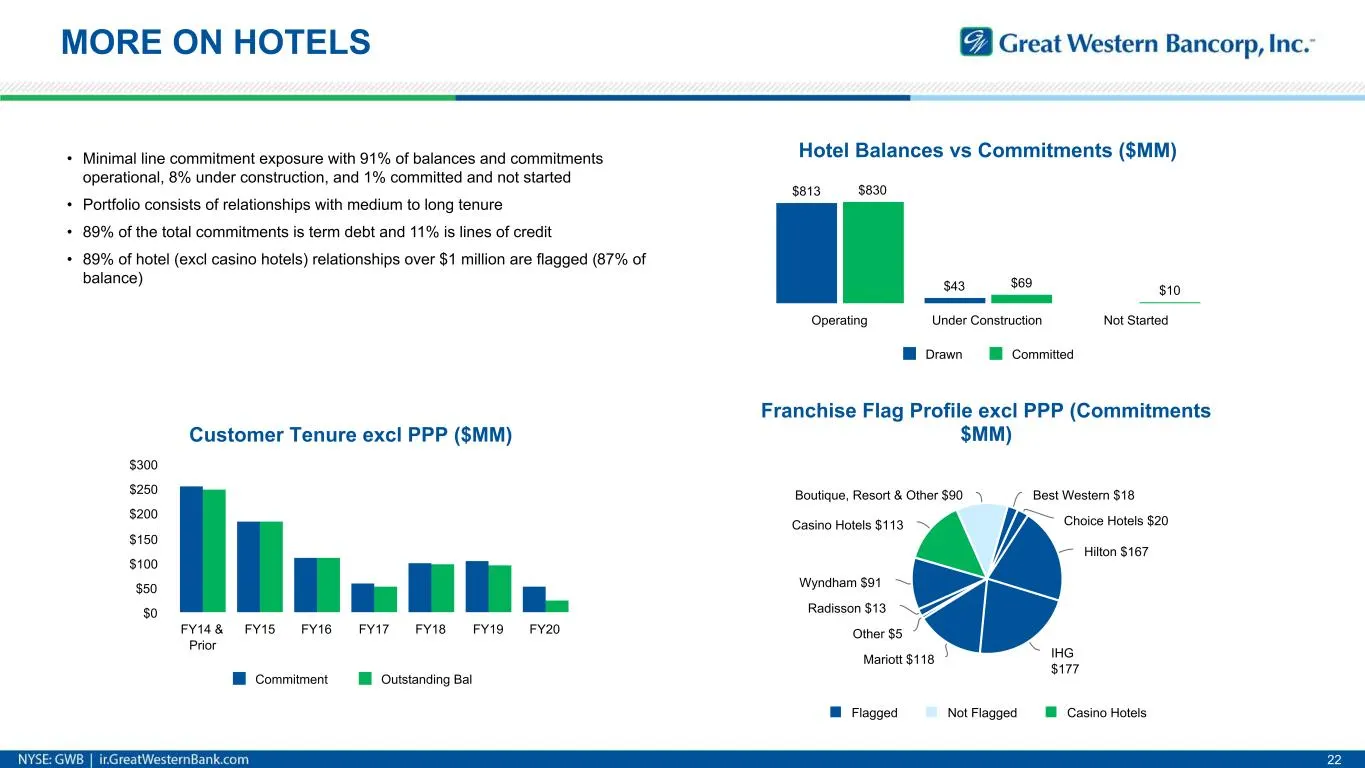
MORE ON HOTELS 22 Hotel Balances vs Commitments ($MM) $813 $43 $830 $69 $10 Drawn Committed Operating Under Construction Not Started Customer Tenure excl PPP ($MM) Commitment Outstanding Bal FY14 & Prior FY15 FY16 FY17 FY18 FY19 FY20 $0 $50 $100 $150 $200 $250 $300 • Minimal line commitment exposure
Slide 23: Ag Loan Asset Quality
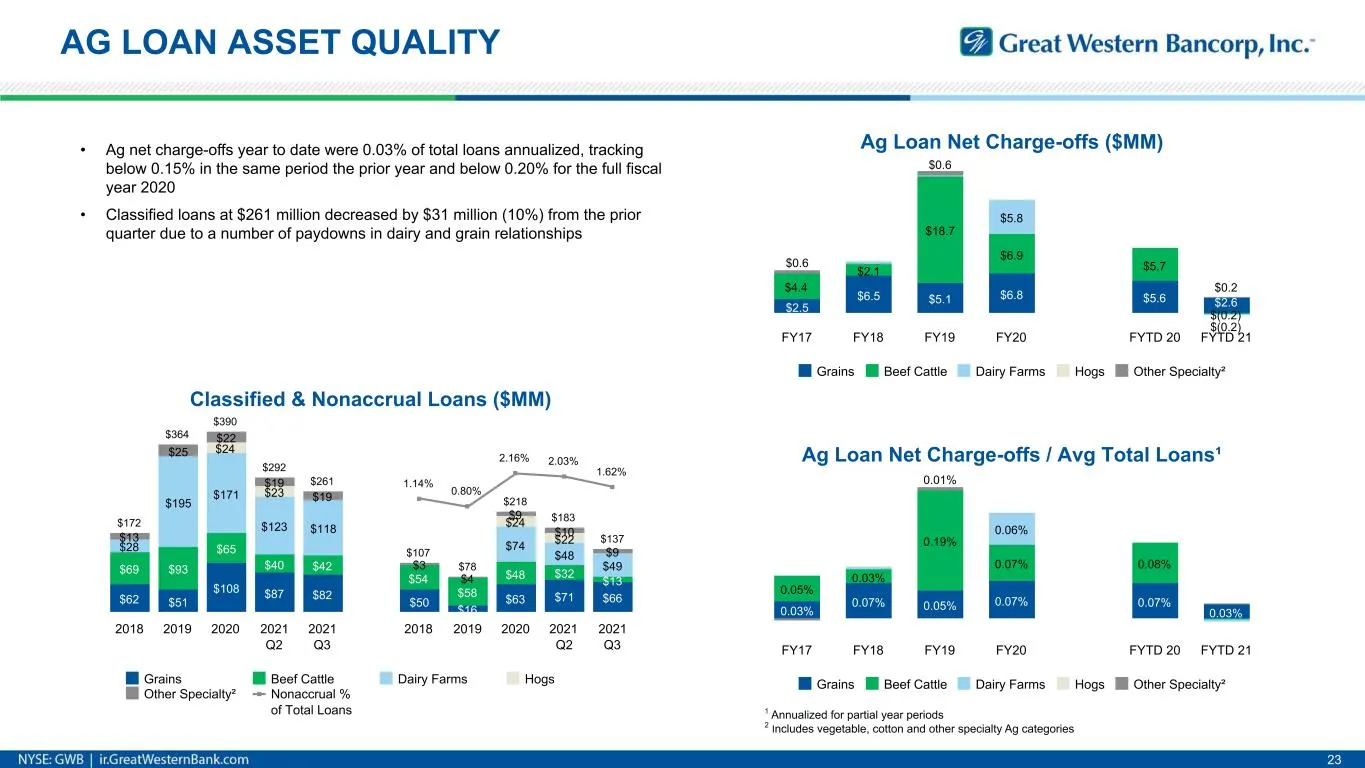
Ag Loan Net Charge-offs / Avg Total Loans¹ 0.03% 0.07% 0.05% 0.07% 0.07% 0.03% 0.05% 0.03% 0.19% 0.07% 0.08% 0.06% 0.01% Grains Beef Cattle Dairy Farms Hogs Other Specialty² FY17 FY18 FY19 FY20 FYTD 20 FYTD 21 AG LOAN ASSET QUALITY 23 Classified & Nonaccrual Loans ($MM) $62 $51 $108 $87 $82 $50 $16
Slide 24: Investments & Borrowings
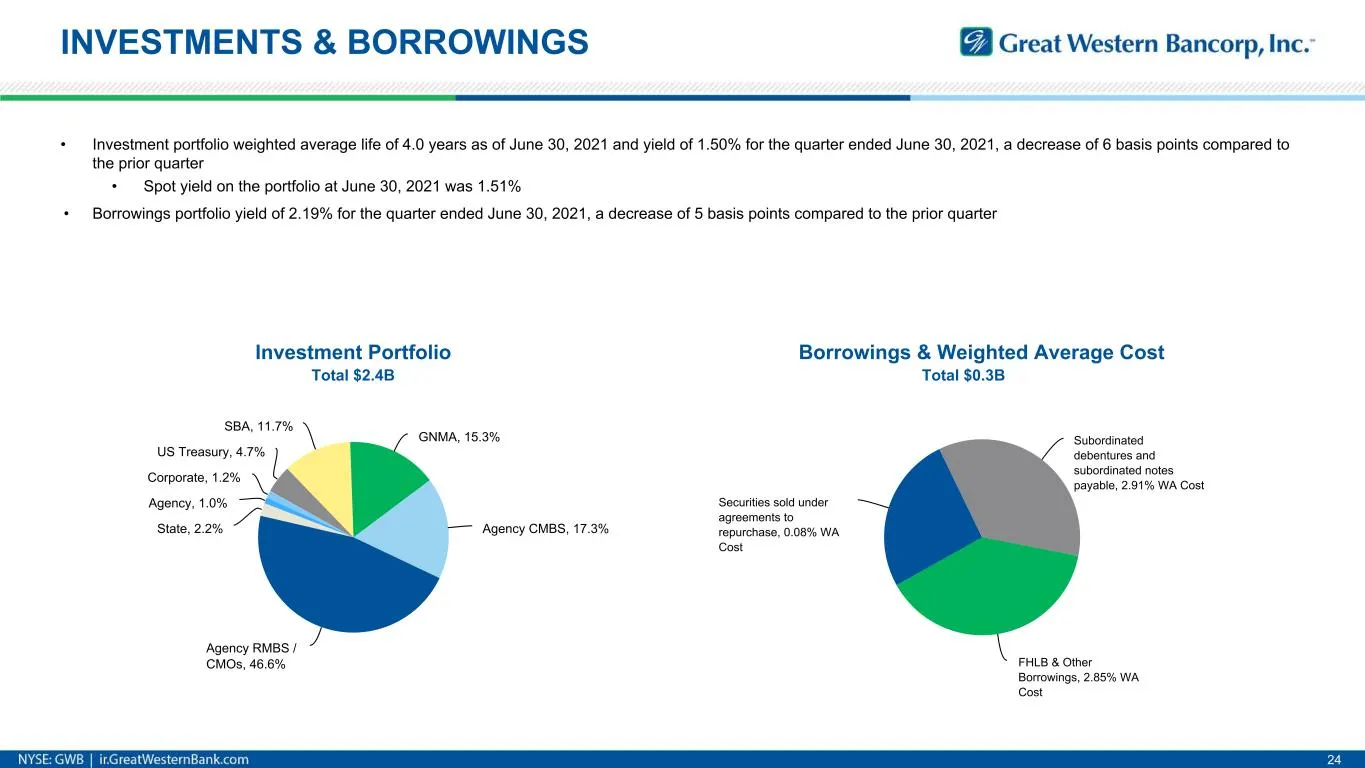
INVESTMENTS & BORROWINGS 24 • Investment portfolio weighted average life of 4.0 years as of June 30, 2021 and yield of 1.50% for the quarter ended June 30, 2021, a decrease of 6 basis points compared to the prior quarter • Spot yield on the portfolio at June 30, 2021 was 1.51% • Borrowings portfolio
Slide 25: Liquidity & Interest Rate Sensitivity
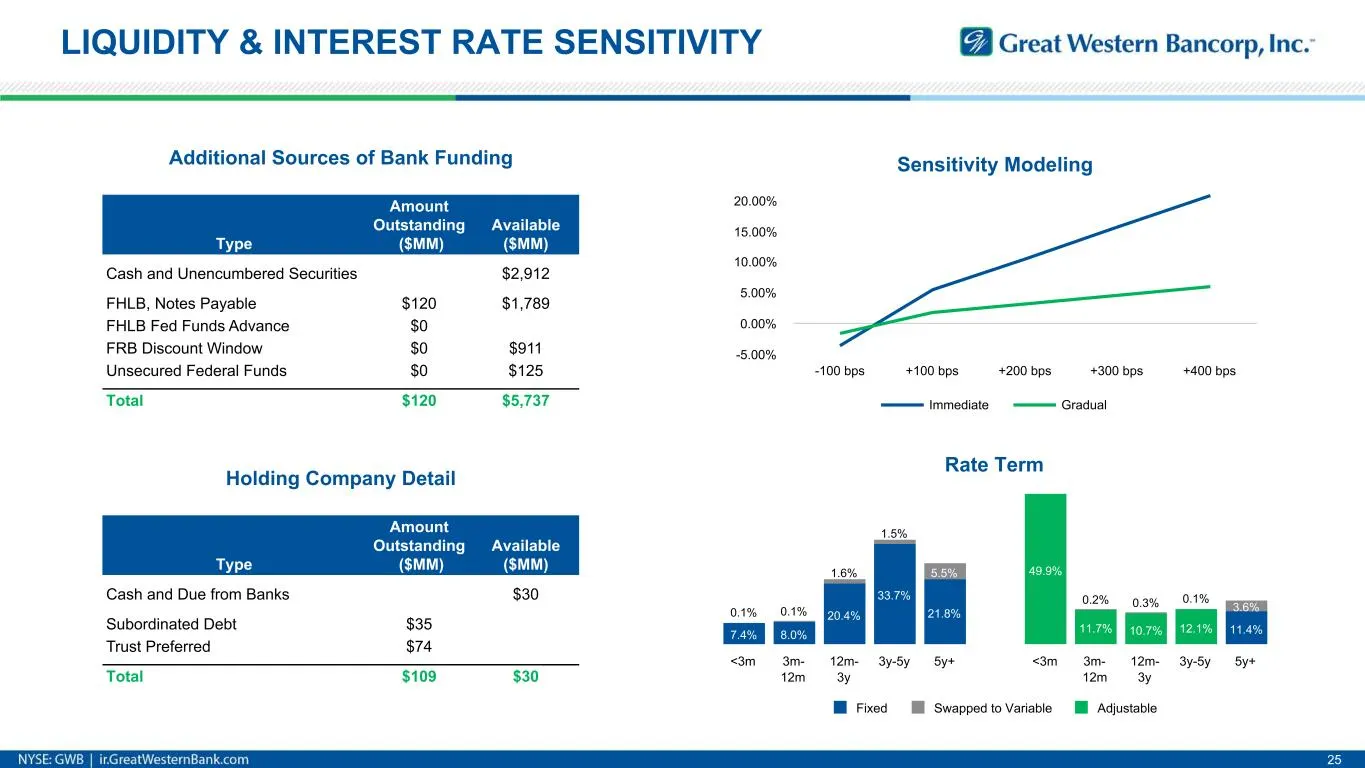
LIQUIDITY & INTEREST RATE SENSITIVITY 25 Rate Term 7.4% 8.0% 20.4% 33.7% 21.8% 49.9% 11.7% 10.7% 12.1% 11.4% 0.1% 0.1% 1.6% 1.5% 5.5% 0.2% 0.3% 0.1% 3.6% Fixed Swapped to Variable Adjustable <3m 3m- 12m 12m- 3y 3y-5y 5y+ <3m 3m- 12m 12m- 3y 3y-5y 5y+ Sensitivity Modeling Immediate Gradual -100 bps +
Slide 26: Farm Income
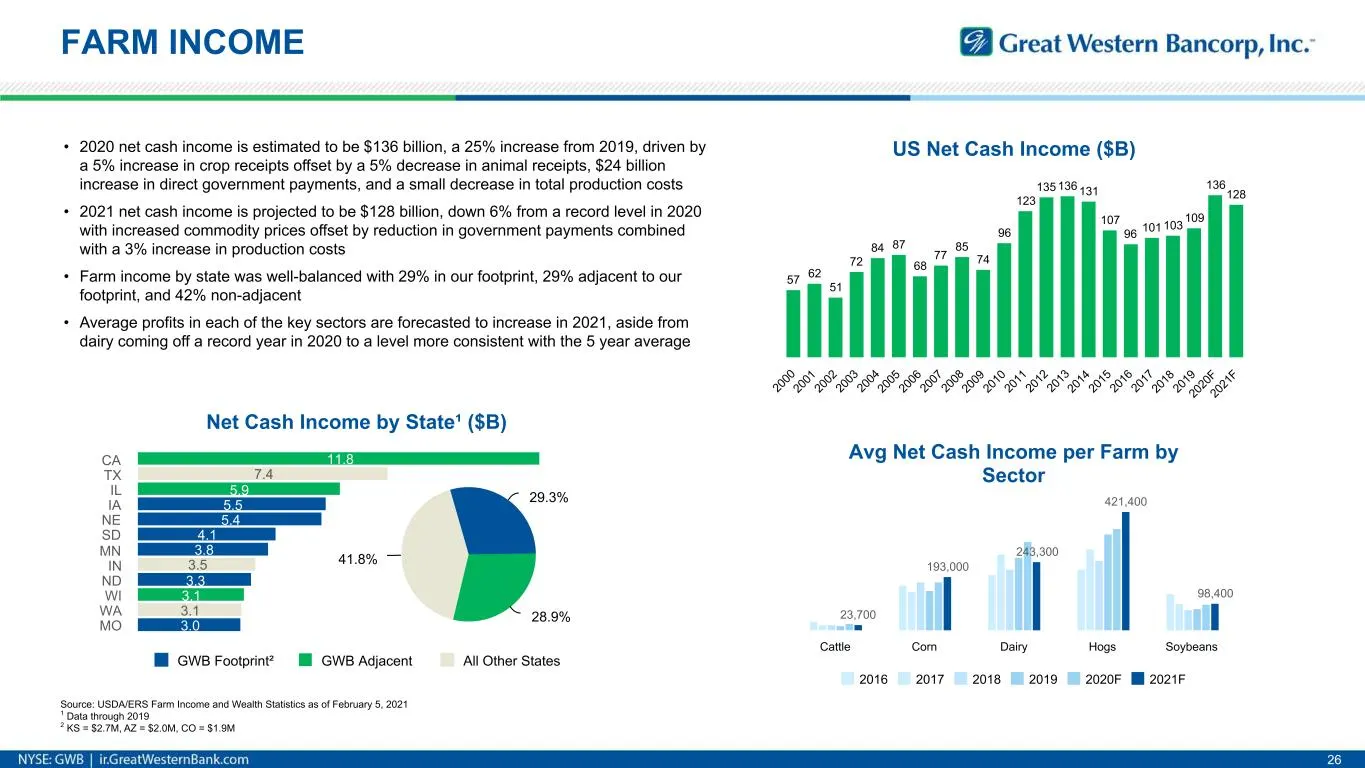
Net Cash Income by State¹ ($B) 5.5 5.4 4.1 3.8 3.3 3.0 11.8 5.9 3.1 7.4 3.5 3.1 GWB Footprint² GWB Adjacent All Other States CA TX IL IA NE SD MN IN ND WI WA MO FARM INCOME 26 • 2020 net cash income is estimated to be $136 billion, a 25% increase from 2019, driven by a 5% increase in crop receipts o
Slide 27: Farm Balance Sheets
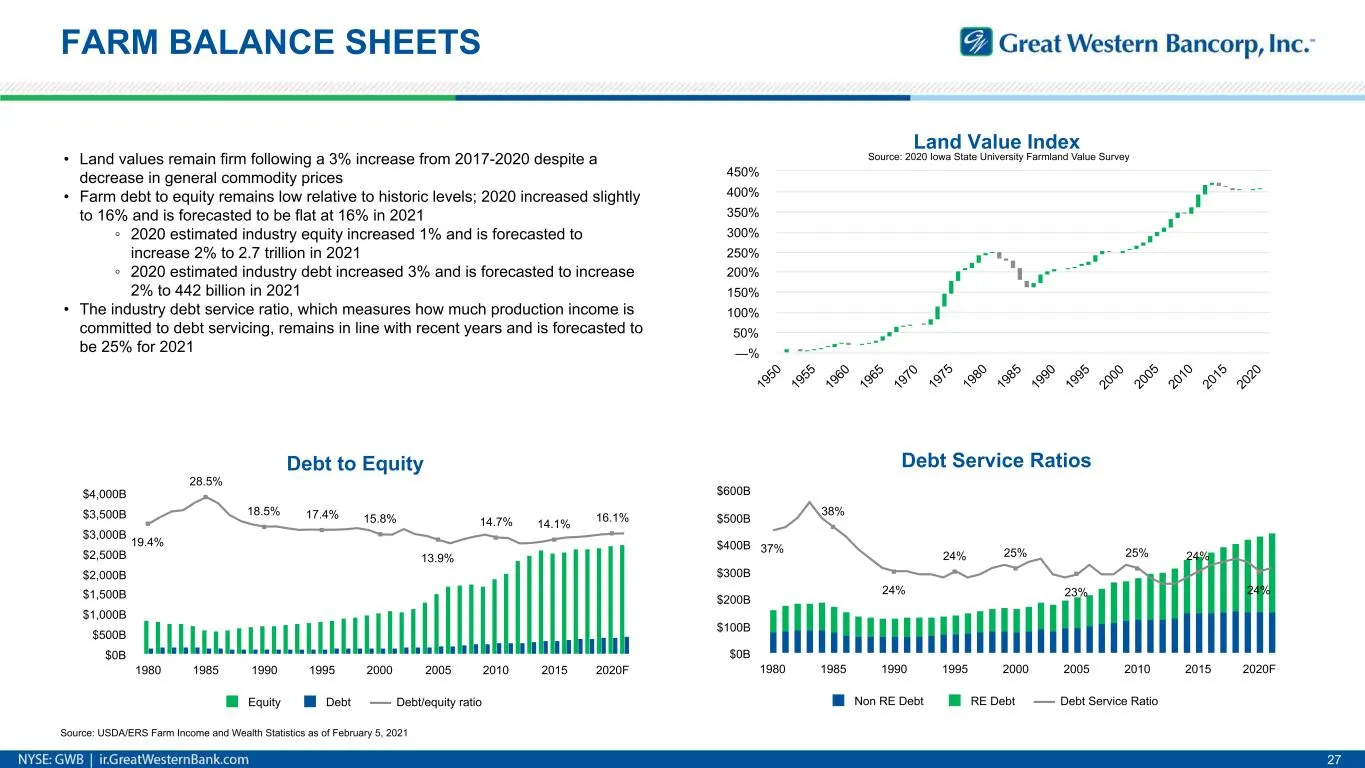
FARM BALANCE SHEETS 27 Debt to Equity 19.4% 28.5% 18.5% 17.4% 15.8% 13.9% 14.7% 14.1% 16.1% Equity Debt Debt/equity ratio 1980 1985 1990 1995 2000 2005 2010 2015 2020F $0B $500B $1,000B $1,500B $2,000B $2,500B $3,000B $3,500B $4,000B Debt Service Ratios 37% 38% 24% 24% 25% 23% 25% 24% 24% Non RE Deb
Slide 28: Peer Group
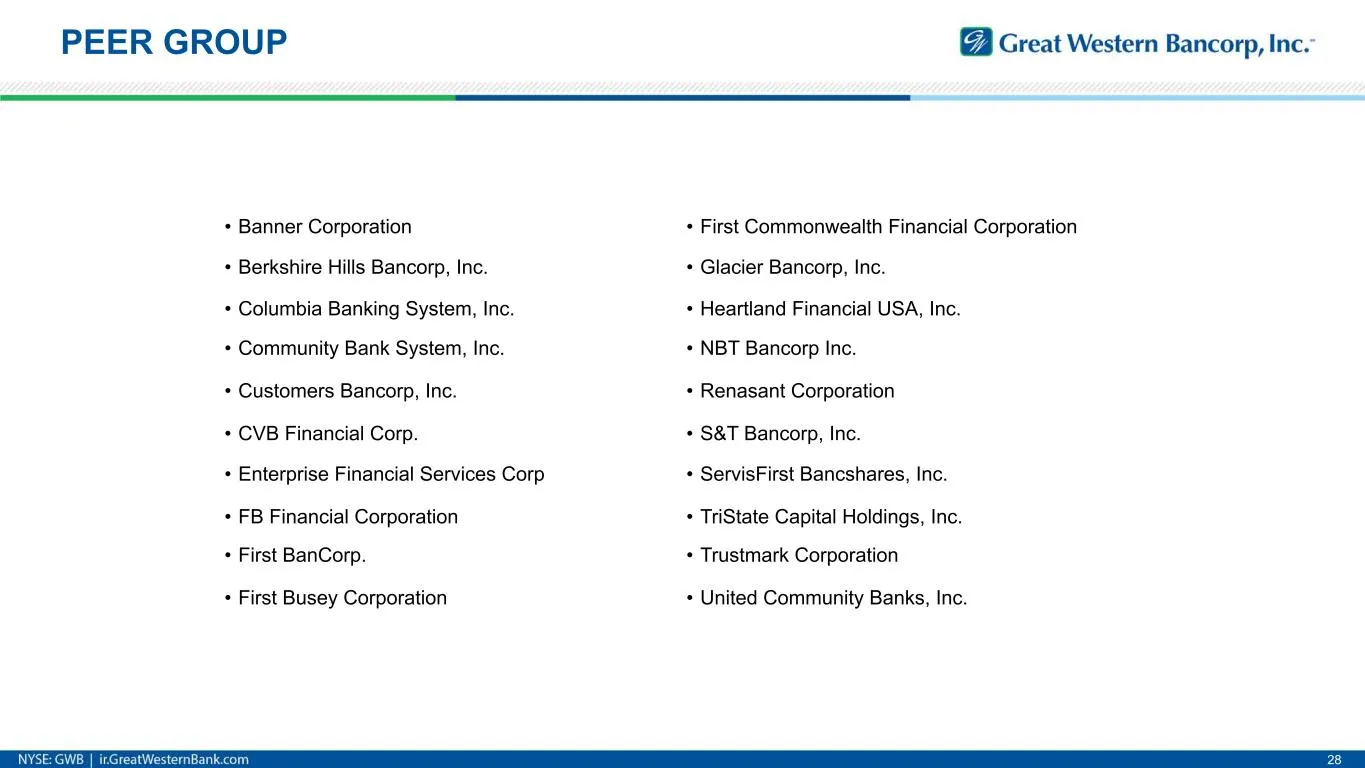
PEER GROUP 28 • Banner Corporation • First Commonwealth Financial Corporation • Berkshire Hills Bancorp, Inc. • Glacier Bancorp, Inc. • Columbia Banking System, Inc. • Heartland Financial USA, Inc. • Community Bank System, Inc. • NBT Bancorp Inc. • Customers Bancorp, Inc. • Renasant Corporation • CV
Slide 29: Appendix Non-GAAP Measures
Appendix 2 Non-GAAP Measures
Slide 30: Non-GAAP Measures
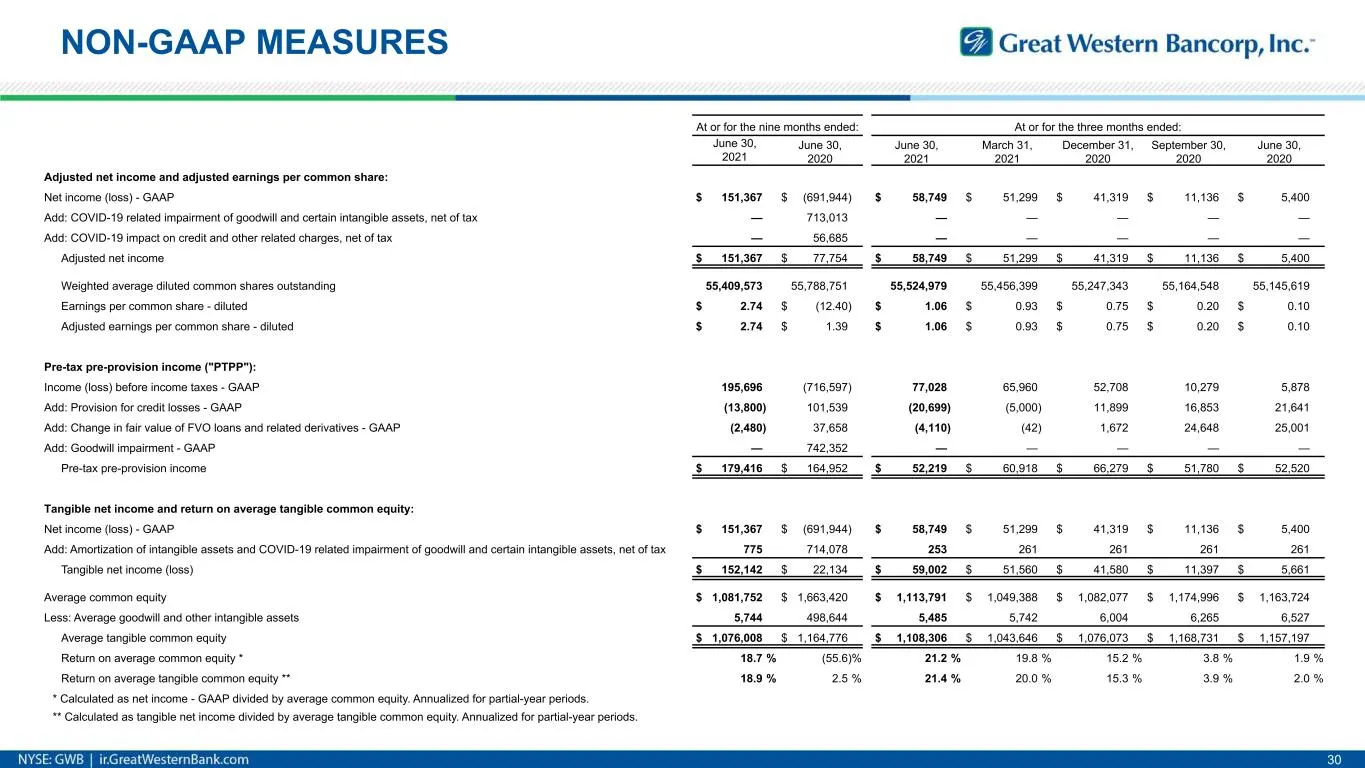
NON-GAAP MEASURES 30 At or for the nine months ended: At or for the three months ended: June 30, 2021 June 30, 2020 June 30, 2021 March 31, 2021 December 31, 2020 September 30, 2020 June 30, 2020 Adjusted net income and adjusted earnings per common share: Net income (loss) - GAAP $ 151,367 $ (691,94
Slide 31: Non-GAAP Measures
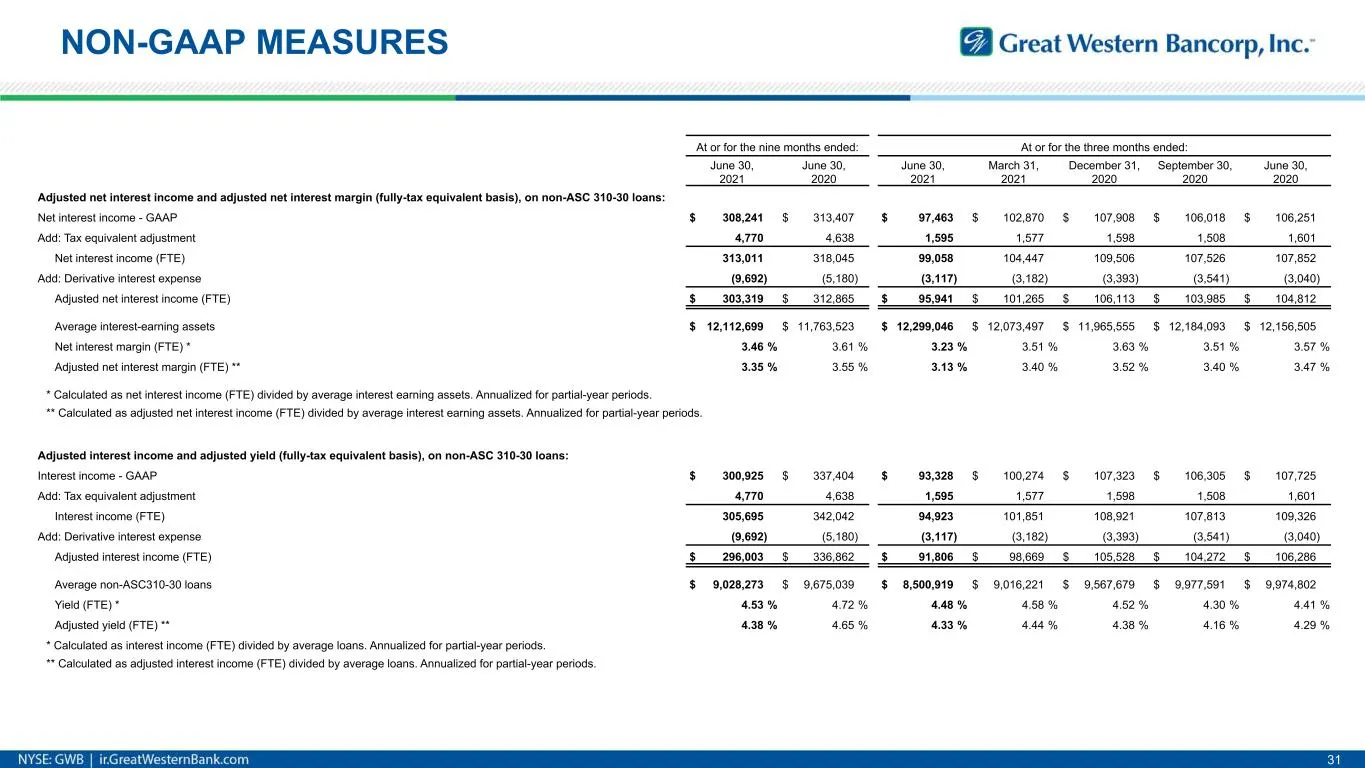
NON-GAAP MEASURES 31 At or for the nine months ended: At or for the three months ended: June 30, 2021 June 30, 2020 June 30, 2021 March 31, 2021 December 31, 2020 September 30, 2020 June 30, 2020 Adjusted net interest income and adjusted net interest margin (fully-tax equivalent basis), on non-ASC 3
Slide 32: Non-GAAP Measures
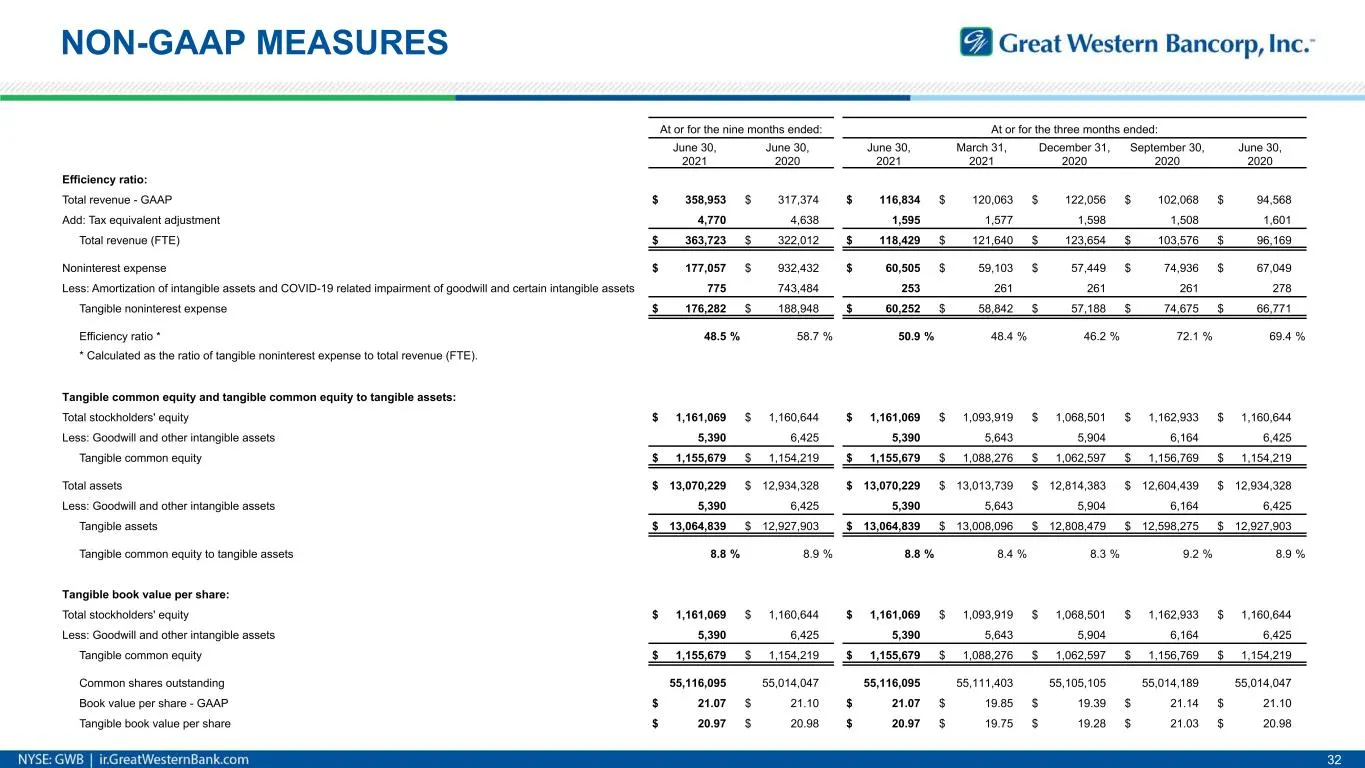
NON-GAAP MEASURES 32 At or for the nine months ended: At or for the three months ended: June 30, 2021 June 30, 2020 June 30, 2021 March 31, 2021 December 31, 2020 September 30, 2020 June 30, 2020 Efficiency ratio: Total revenue - GAAP $ 358,953 $ 317,374 $ 116,834 $ 120,063 $ 122,056 $ 102,068 $ 94,
Source: SEC EDGAR · 8-K filed Jul 29, 2021
More decks from Great Western Bancorp Inc
 Q1 FY2022 Earnings Presentation27 slides · Jan 27, 2022
 Merger or Acquisition (October 2021)55 slides · Oct 29, 2021
 Q4 2021 Earnings Presentation28 slides · Oct 26, 2021
 Merger or Acquisition (September 2021)14 slides · Sep 21, 2021
 Merger or Acquisition (September 2021)28 slides · Sep 16, 2021
 2QFY21 Earnings Presentation32 slides · Apr 29, 2021