Orascom Construction PLC · EGX:ORAS
Orascom Construction — Investor Presentation (June 2023)
31 slides from Orascom Construction's investor presentation, June 2023
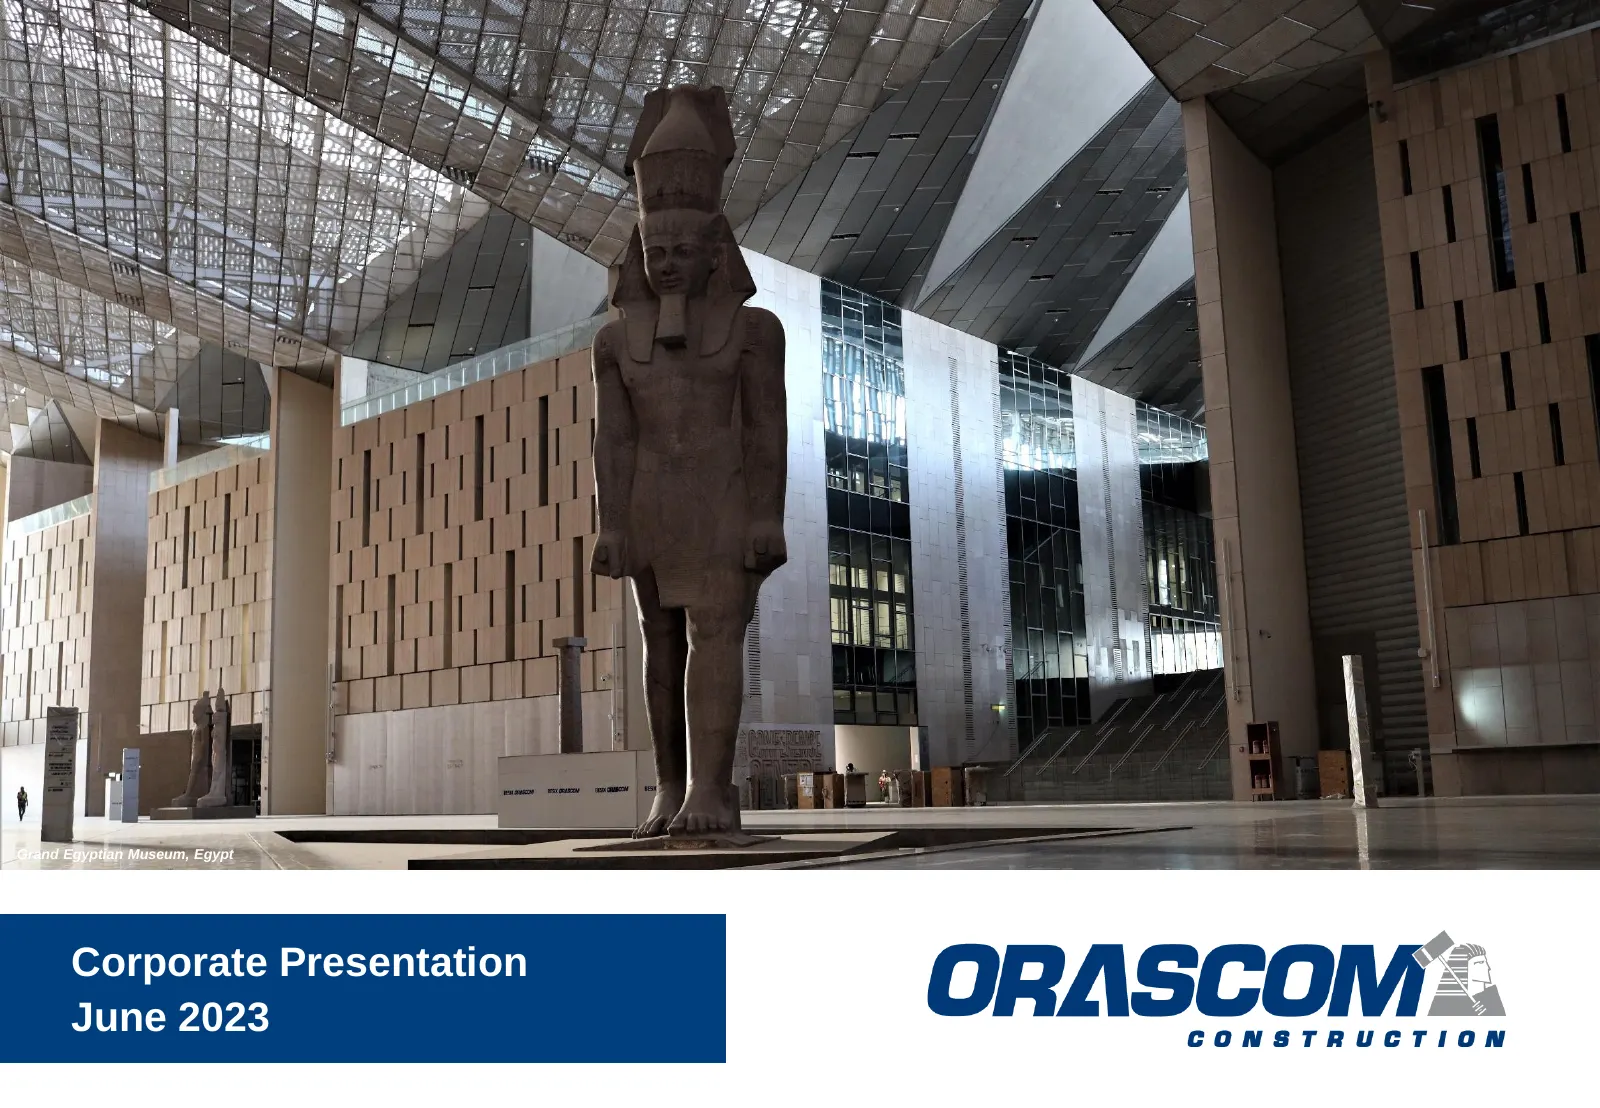
Slide 1: Corporate Presentation June 2023
Grand Egyptian Museum, Egypt Corporate Presentation June 2023
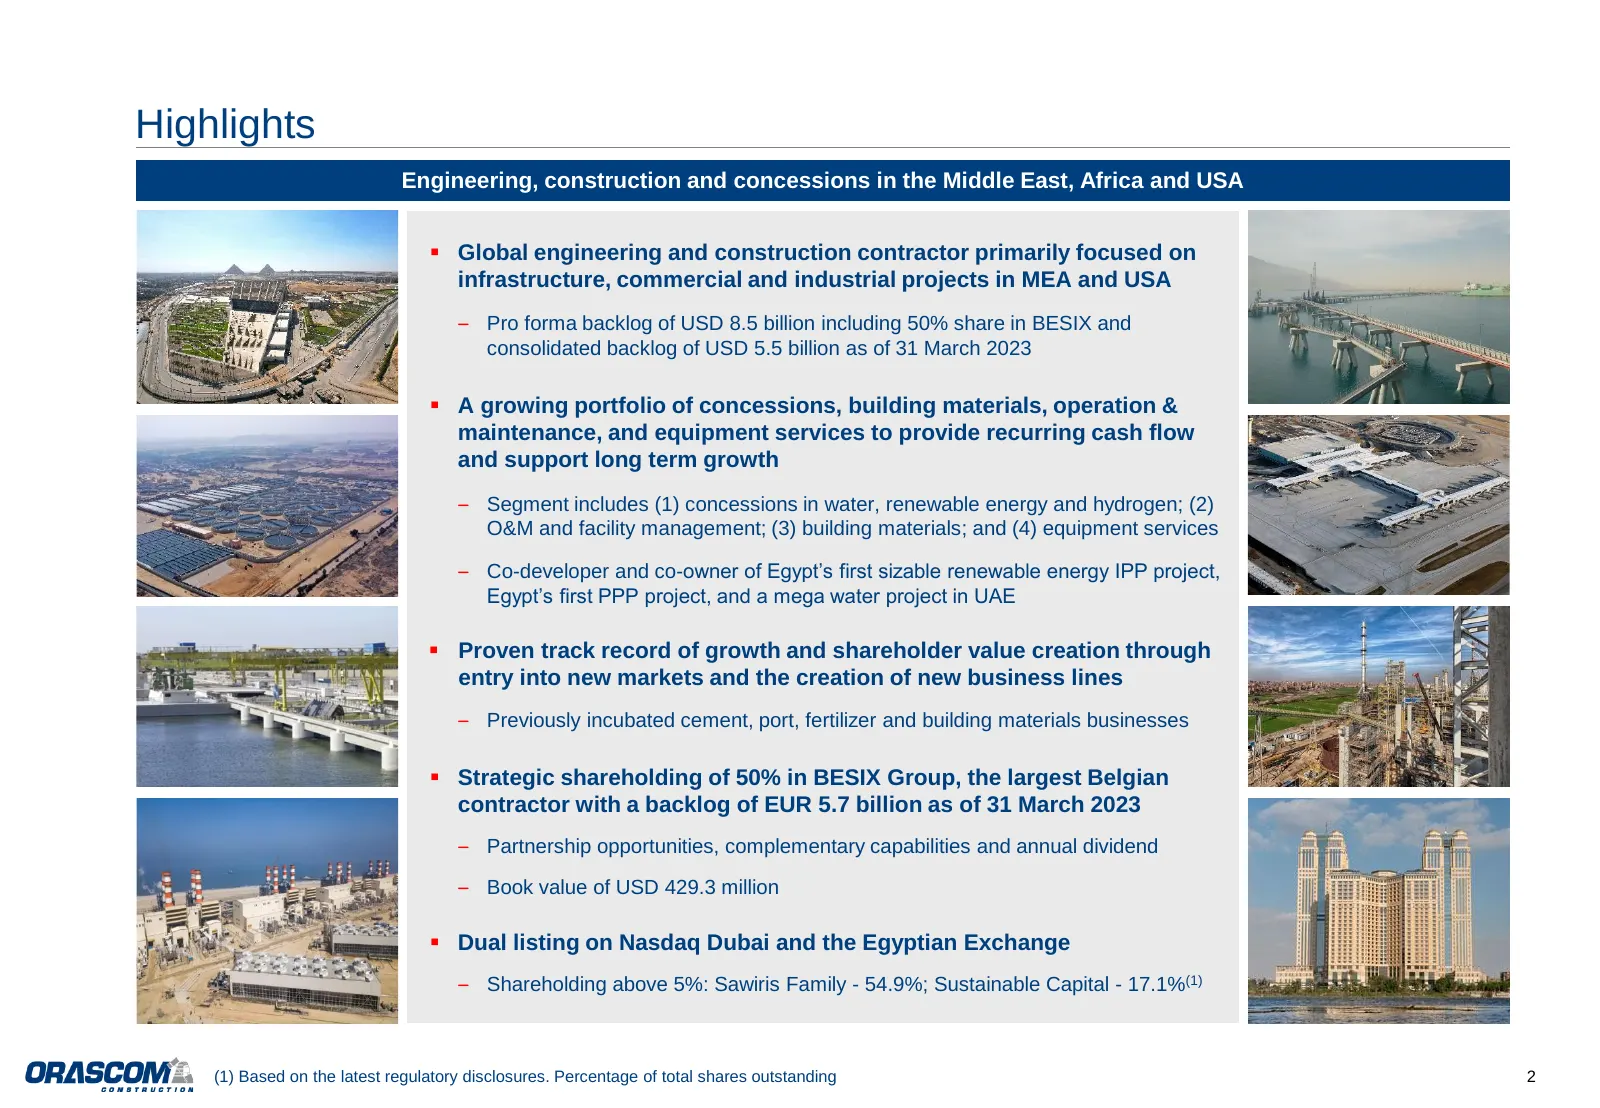
Slide 2: Highlights
Highlights Engineering, construction and concessions in the Middle East, Africa and USA ▪ Global engineering and construction contractor primarily focused on infrastructure, commercial and industrial projects in MEA and USA – Pro forma backlog of USD 8.5 billion including 50% share in BESIX and cons
Slide 3: Recent Developments: Executing Our Long-Term Strategy
Recent Developments: Executing Our Long-Term Strategy • Backlog at a healthy level of USD 5.5 billion as of 31 March 2023 • Focus in Egypt is on foreign funded work such as key infrastructure projects, with approximately 66% of the Group’s Quality Backlog backlog in Egypt is paid or priced in foreig
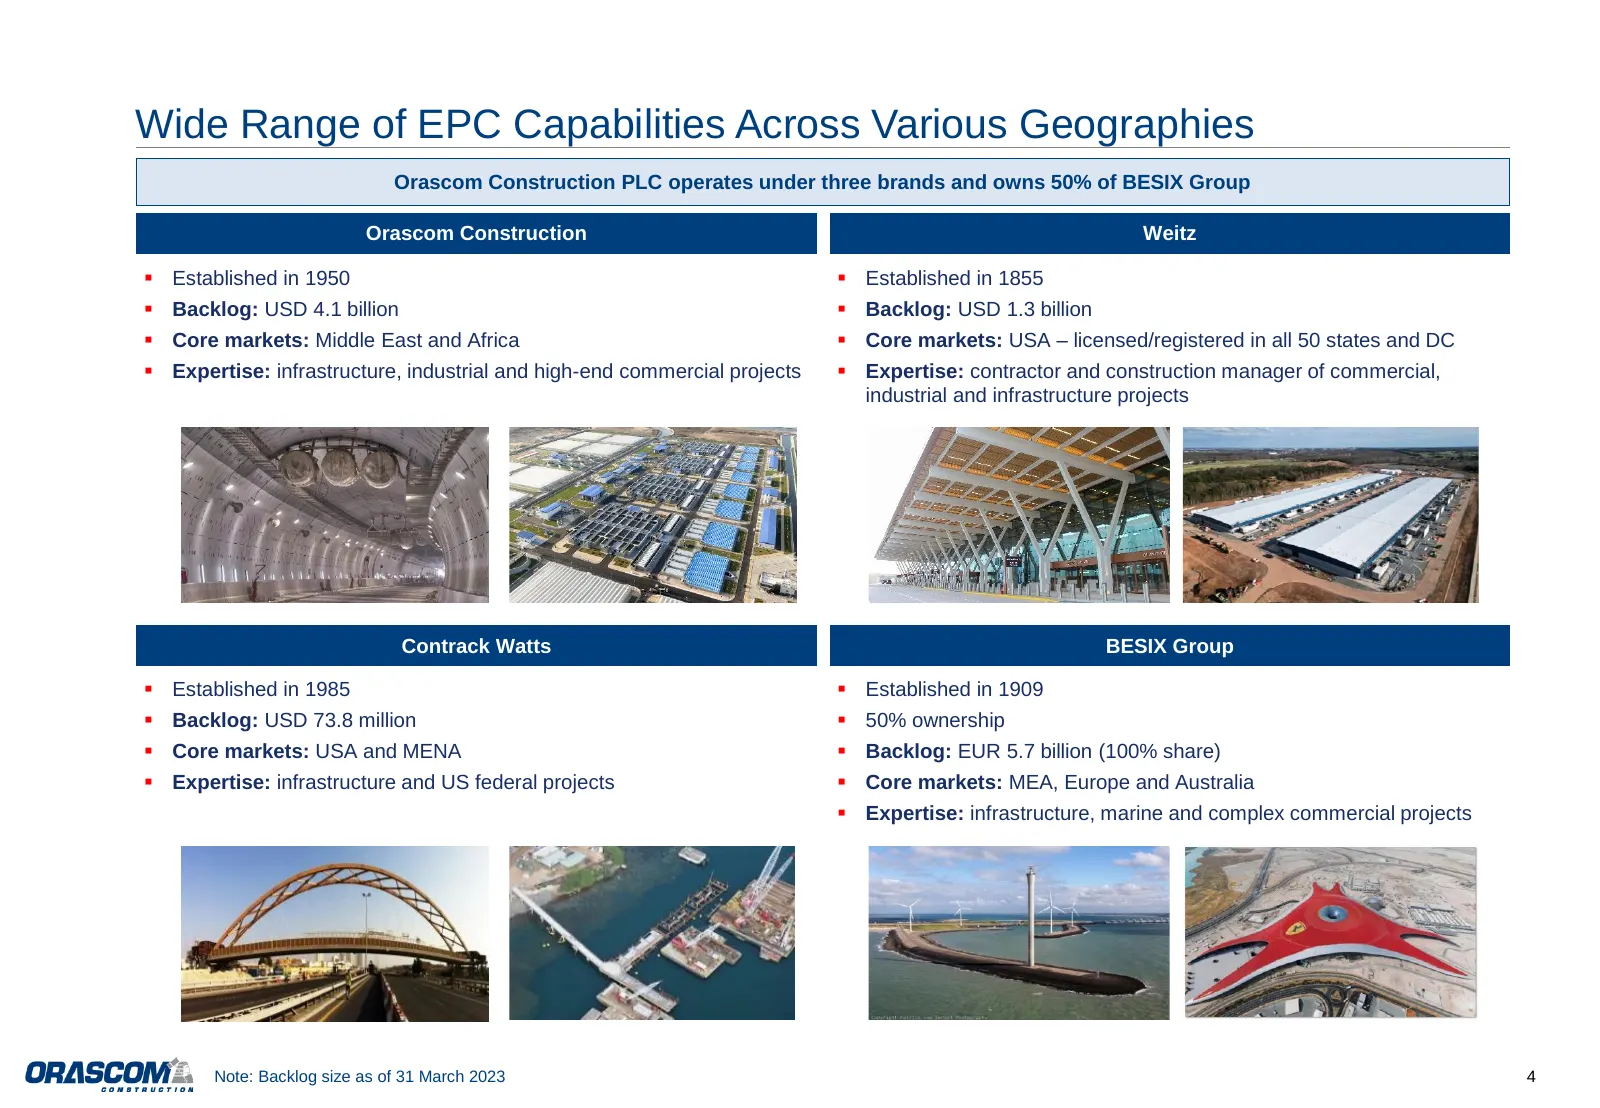
Slide 4: Wide Range of EPC Capabilities Across Various Geographies
Wide Range of EPC Capabilities Across Various Geographies Orascom Construction PLC operates under three brands and owns 50% of BESIX Group Orascom Construction Weitz ▪ Established in 1950 ▪ Established in 1855 ▪ Backlog: USD 4.1 billion ▪ Backlog: USD 1.3 billion ▪ Core markets: Middle East and Afri
Slide 5: Growing Concessions Portfolio
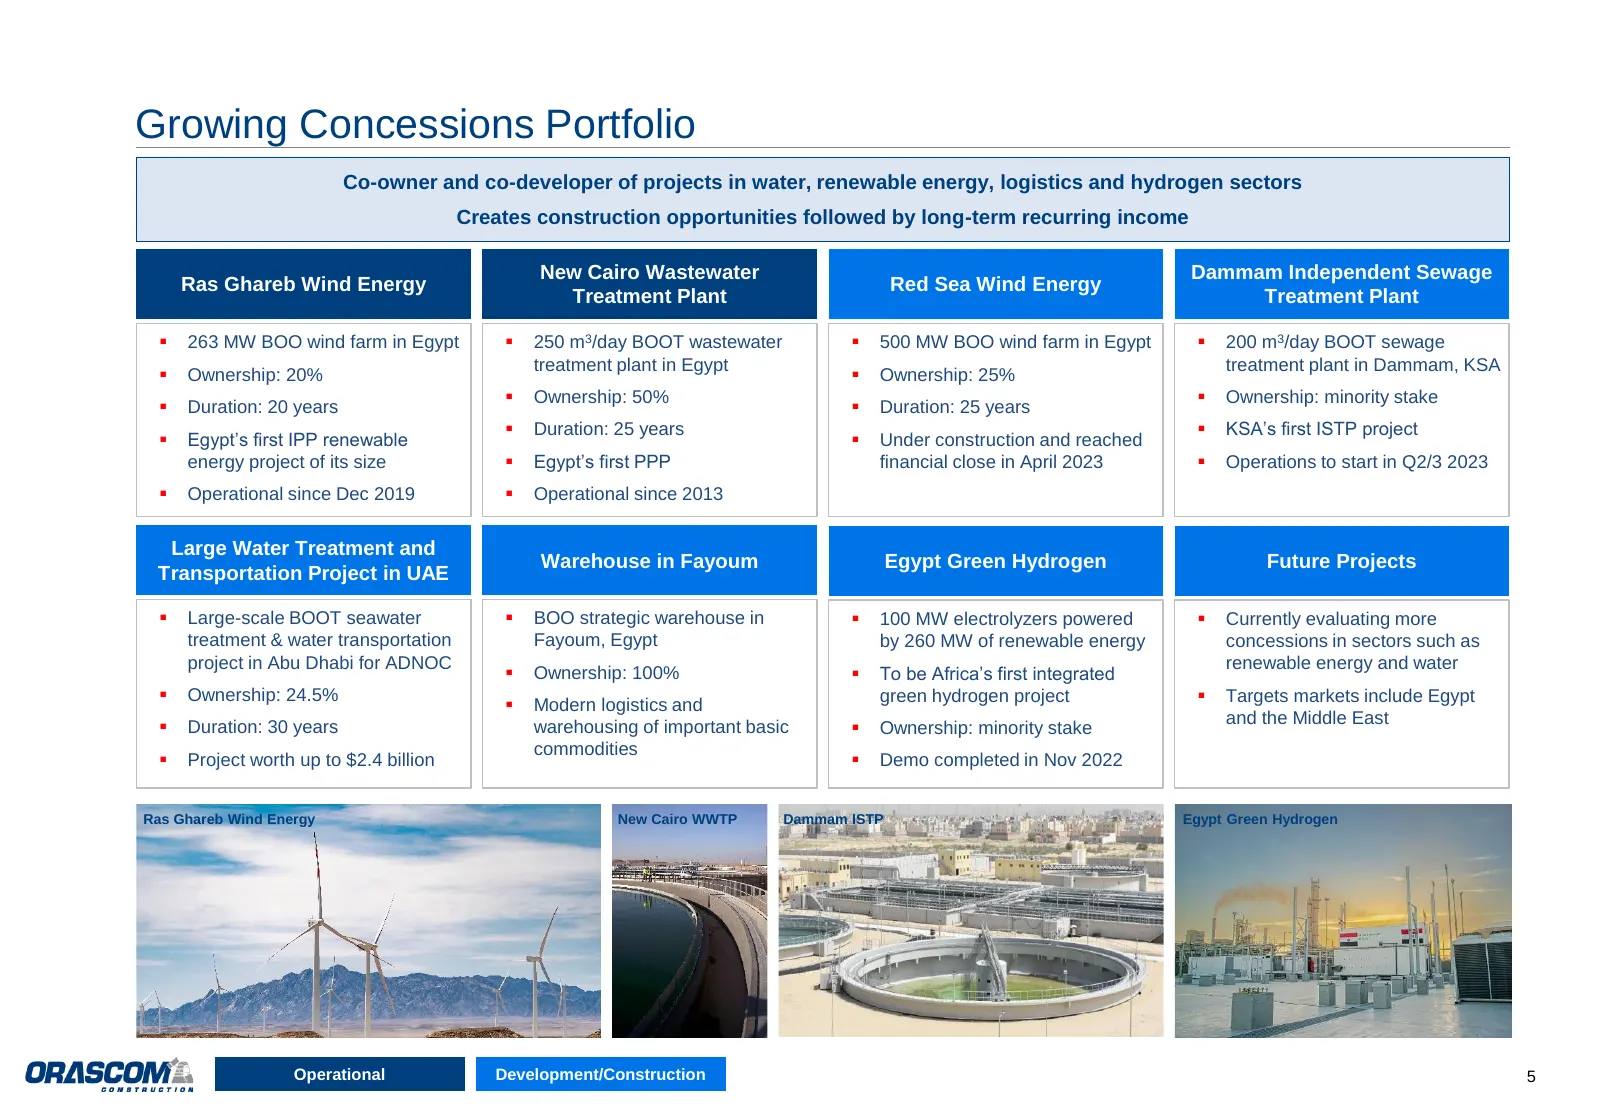
Growing Concessions Portfolio Co-owner and co-developer of projects in water, renewable energy, logistics and hydrogen sectors Creates construction opportunities followed by long-term recurring income New Cairo Wastewater Dammam Independent Sewage Ras Ghareb Wind Energy Red Sea Wind Energy Treatment
Slide 6: Equipment Services and Building Materials
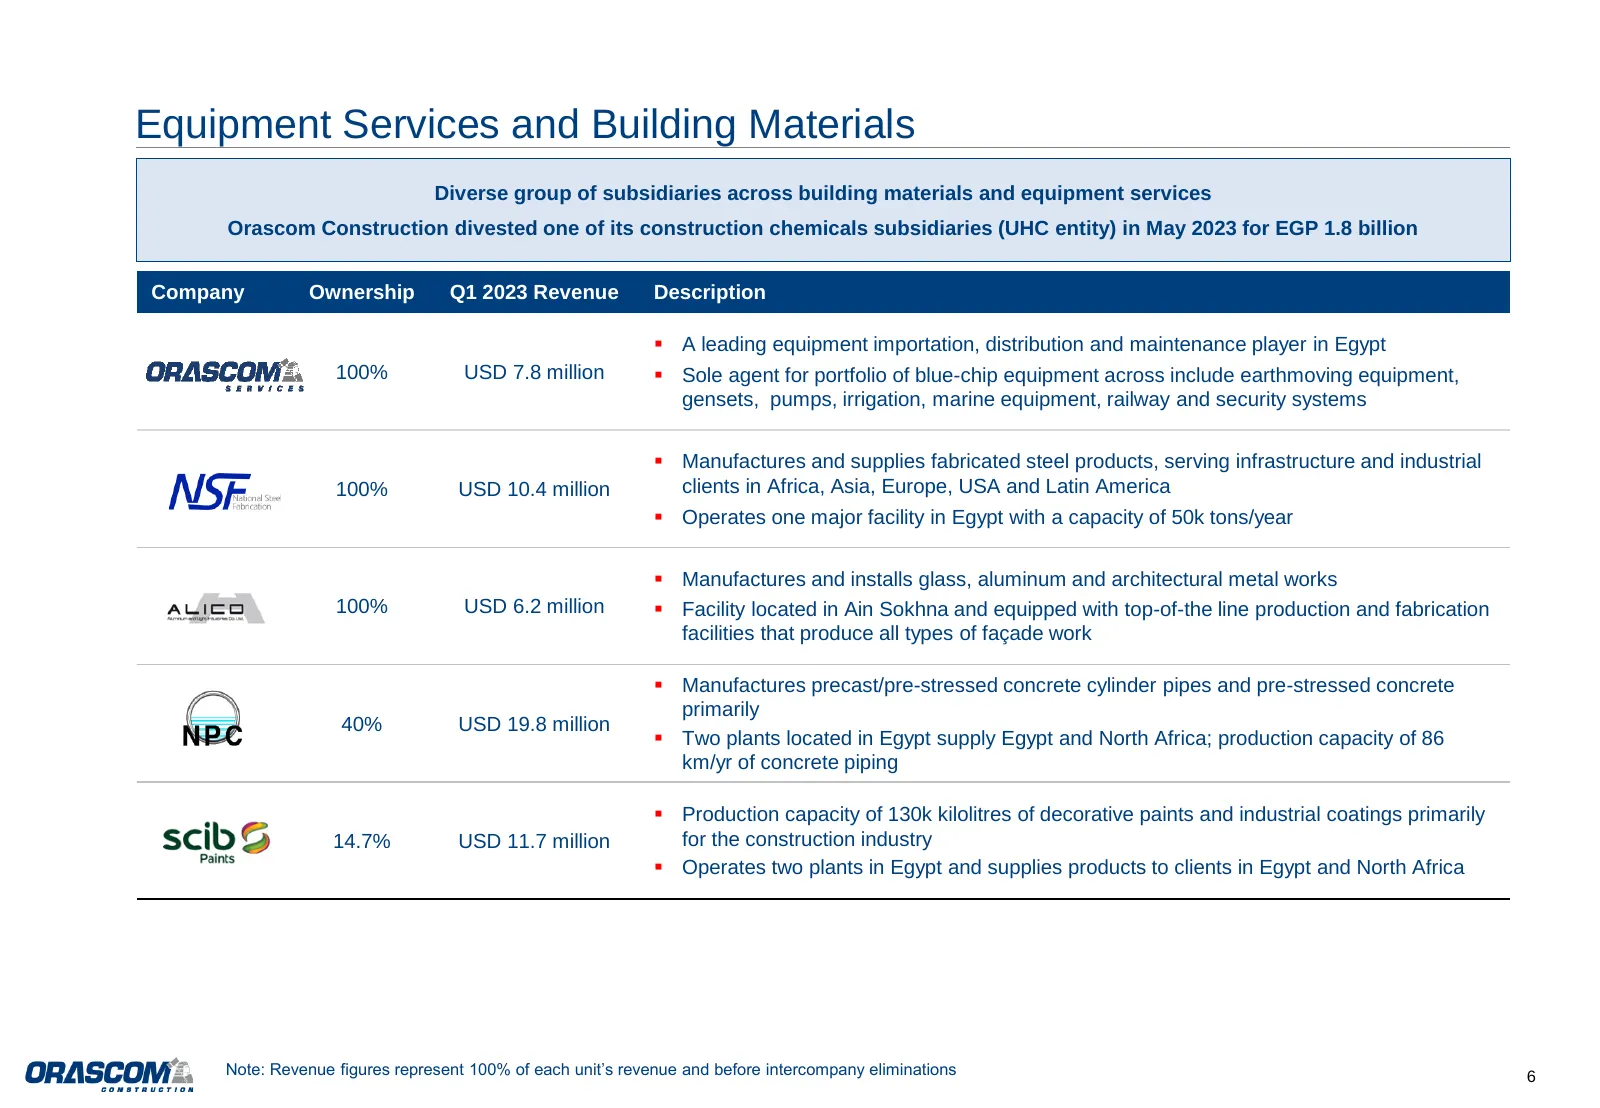
Equipment Services and Building Materials Diverse group of subsidiaries across building materials and equipment services Orascom Construction divested one of its construction chemicals subsidiaries (UHC entity) in May 2023 for EGP 1.8 billion Company Ownership Q1 2023 Revenue Description ▪ A leading
Slide 7: O&M, Facility Management and Industrial Parks
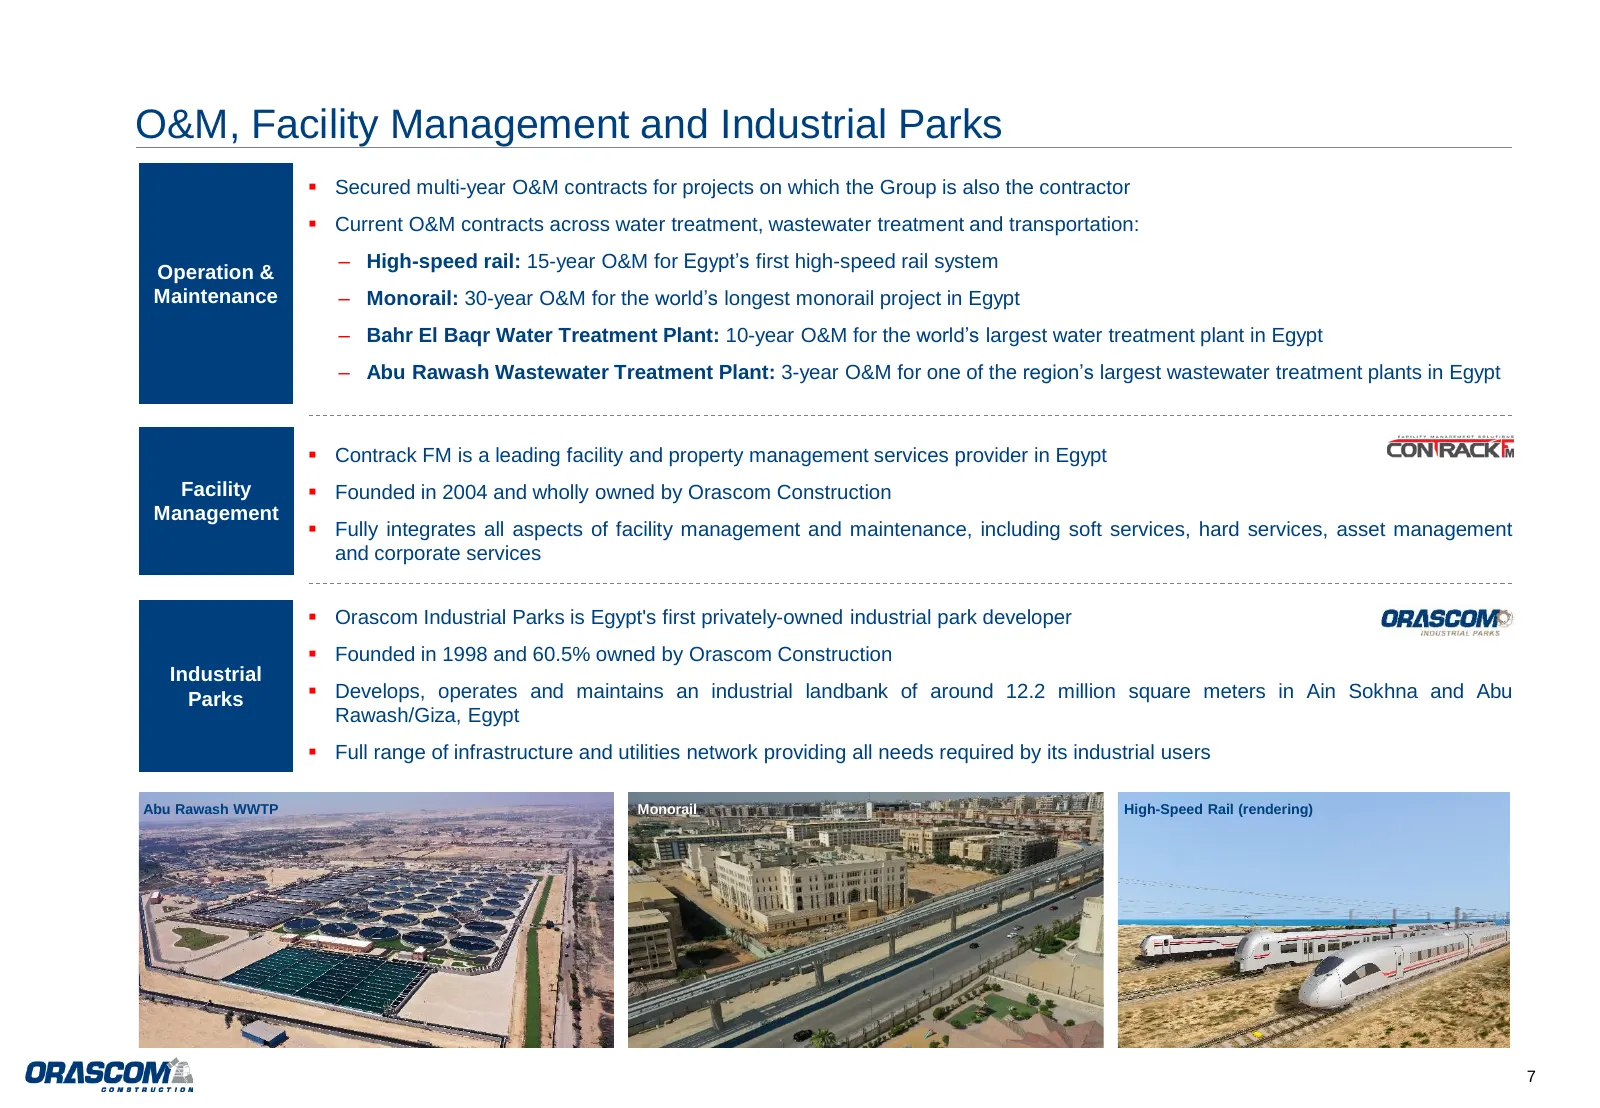
O&M, Facility Management and Industrial Parks ▪ Secured multi-year O&M contracts for projects on which the Group is also the contractor ▪ Current O&M contracts across water treatment, wastewater treatment and transportation: – High-speed rail: 15-year O&M for Egypt’s first high-speed rail system Ope
Slide 8: Leading EPC Track Record Across Several Industries and Geographies
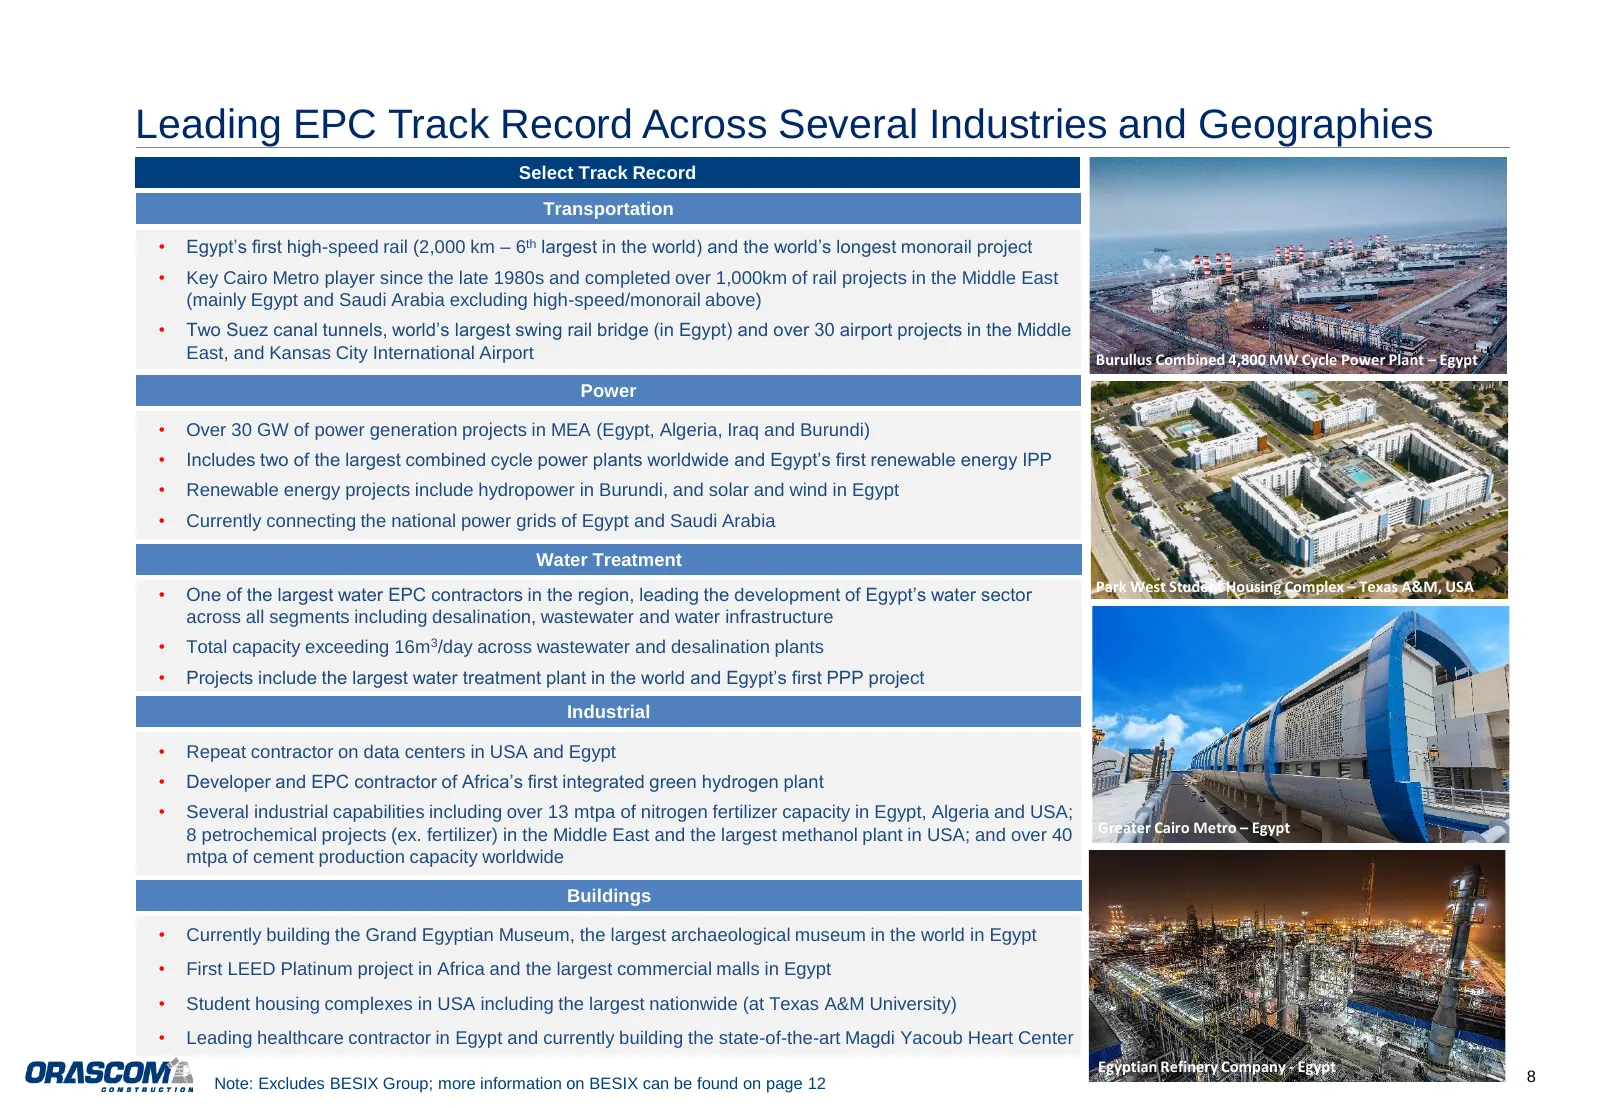
Leading EPC Track Record Across Several Industries and Geographies Select Track Record Transportation • Egypt’s first high-speed rail (2,000 km – 6th largest in the world) and the world’s longest monorail project • Key Cairo Metro player since the late 1980s and completed over 1,000km of rail projec
Slide 9: Consolidated Backlog
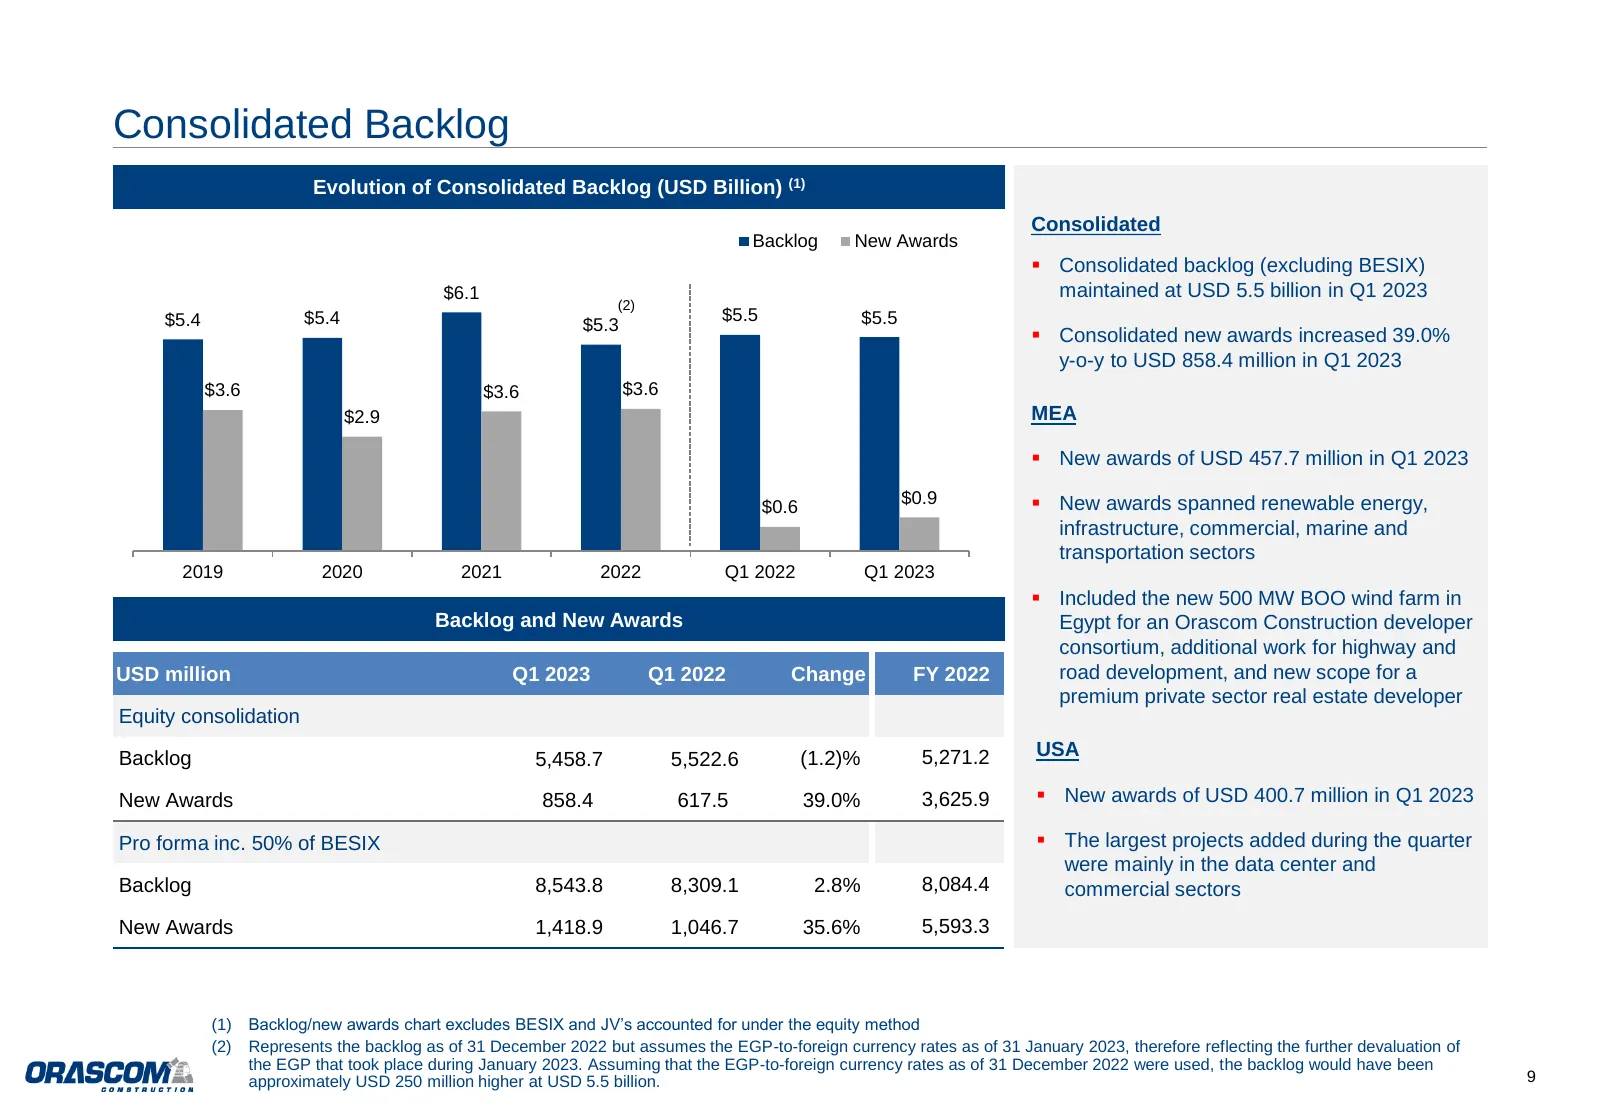
Consolidated Backlog Evolution of Consolidated Backlog (USD Billion) (1) Consolidated Backlog New Awards ▪ Consolidated backlog (excluding BESIX) $6.1 maintained at USD 5.5 billion in Q1 2023 (2) $5.4 $5.4 $5.5 $5.5 $5.3 ▪ Consolidated new awards increased 39.0% y-o-y to USD 858.4 million in Q1 2023
Slide 10: Consolidated Backlog Breakdown – March 2023
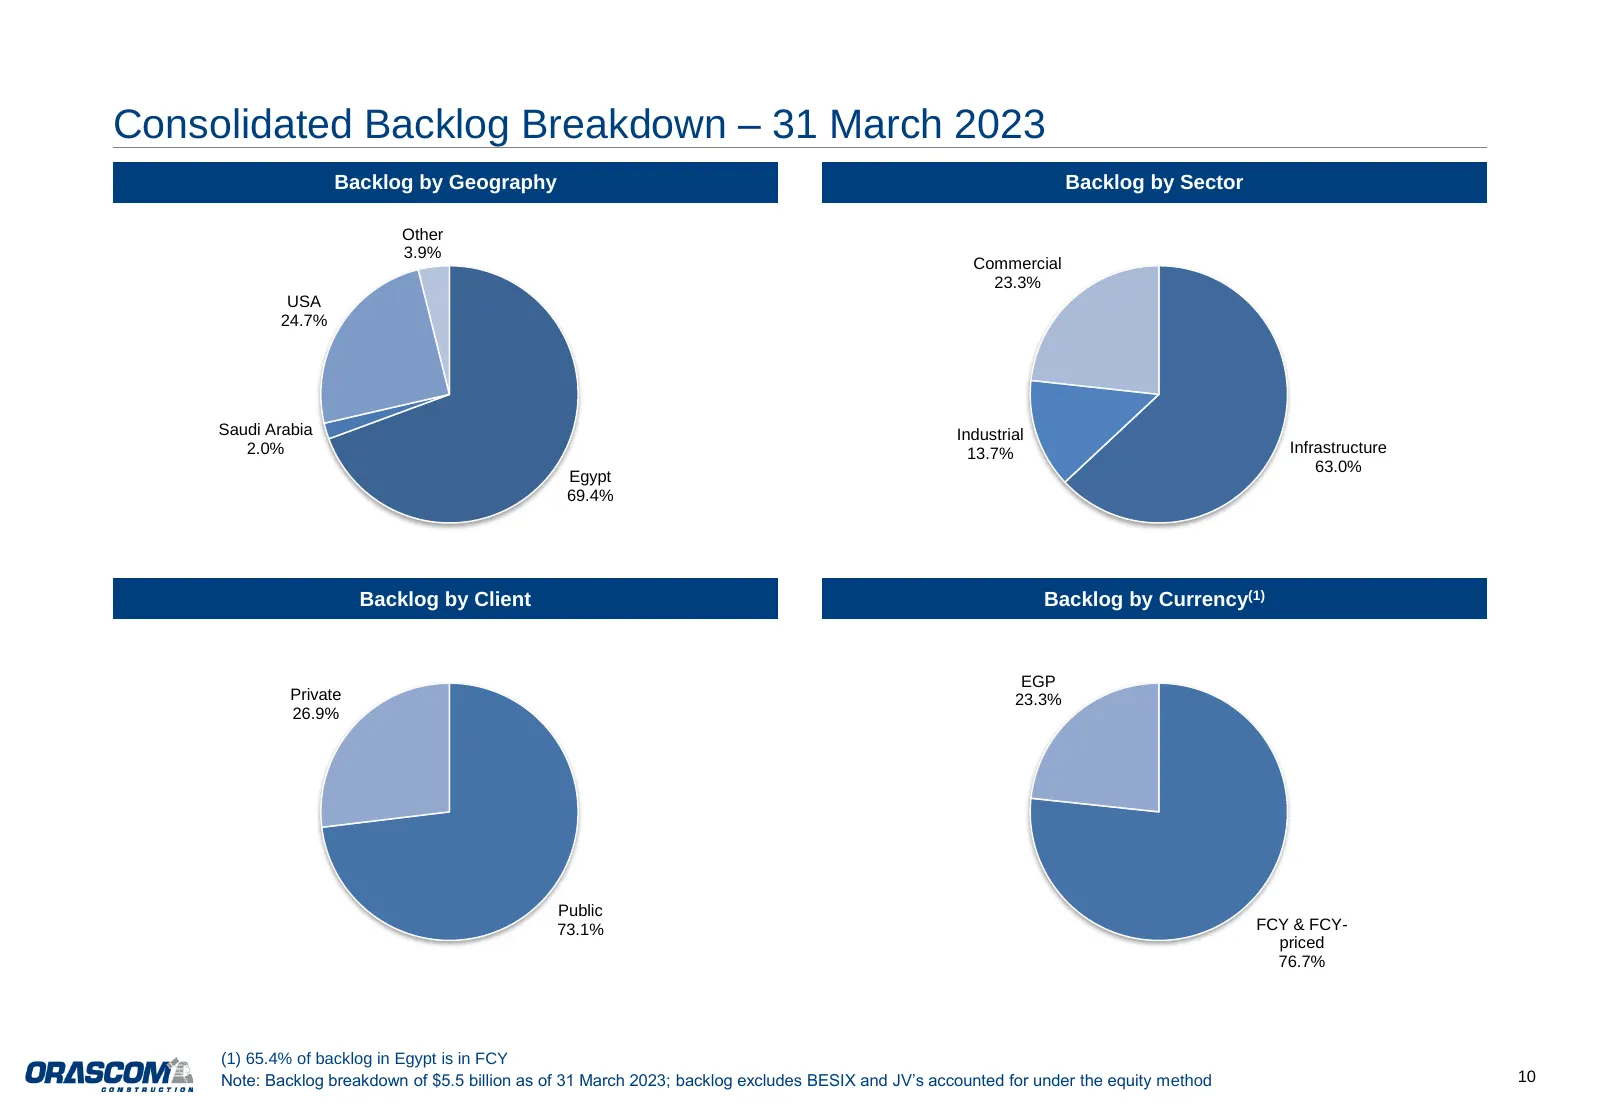
Consolidated Backlog Breakdown – 31 March 2023 Backlog by Geography Backlog by Sector Other 3.9% Commercial 23.3% USA 24.7% Saudi Arabia Industrial 2.0% 13.7% Infrastructure 63.0% Egypt 69.4% Backlog by Client Backlog by Currency(1) EGP Private 23.3% 26.9% Public 73.1% FCY & FCY- priced 76.7% (1) 65
Slide 11: Evolution of Backlog by Geography
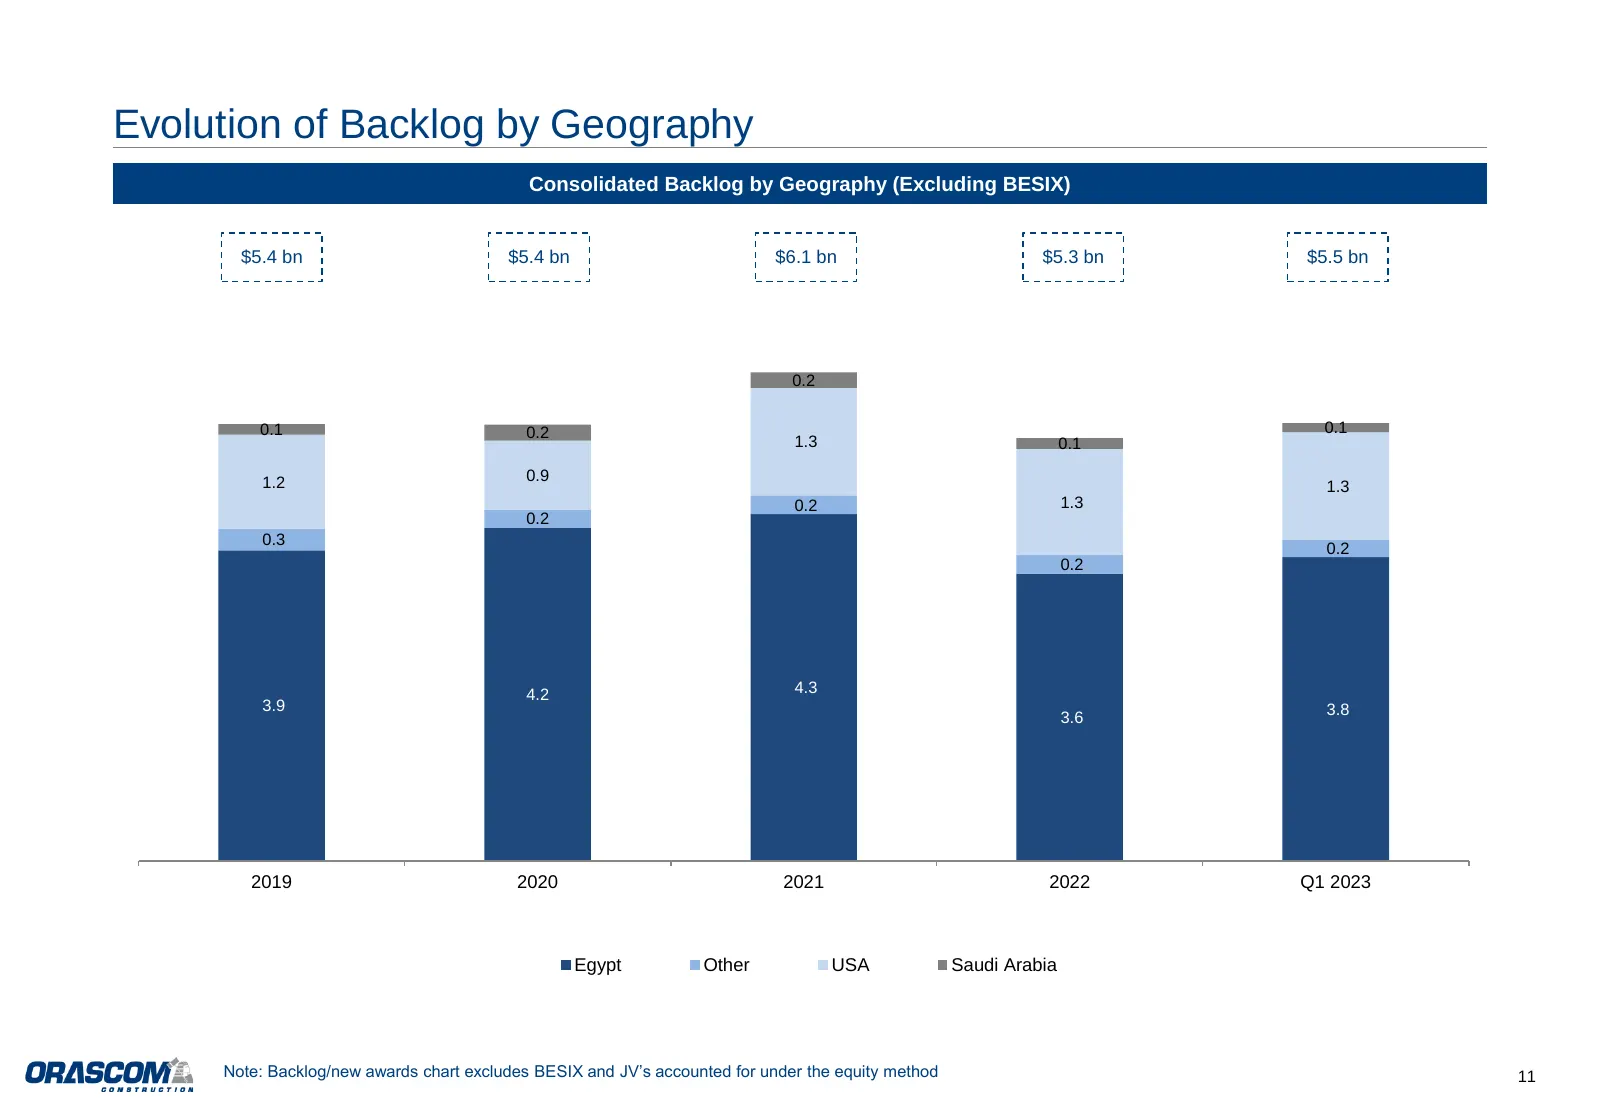
Evolution of Backlog by Geography Consolidated Backlog by Geography (Excluding BESIX) $5.4 bn $5.4 bn $6.1 bn $5.3 bn $5.5 bn 0.2 0.1 0.2 0.1 1.3 0.1 1.2 0.9 1.3 0.2 1.3 0.2 0.3 0.2 0.2 4.2 4.3 3.9 3.8 3.6 2019 2020 2021 2022 Q1 2023 Egypt Other USA Saudi Arabia Note: Backlog/new awards chart exclud
Slide 12: Investment in BESIX Group
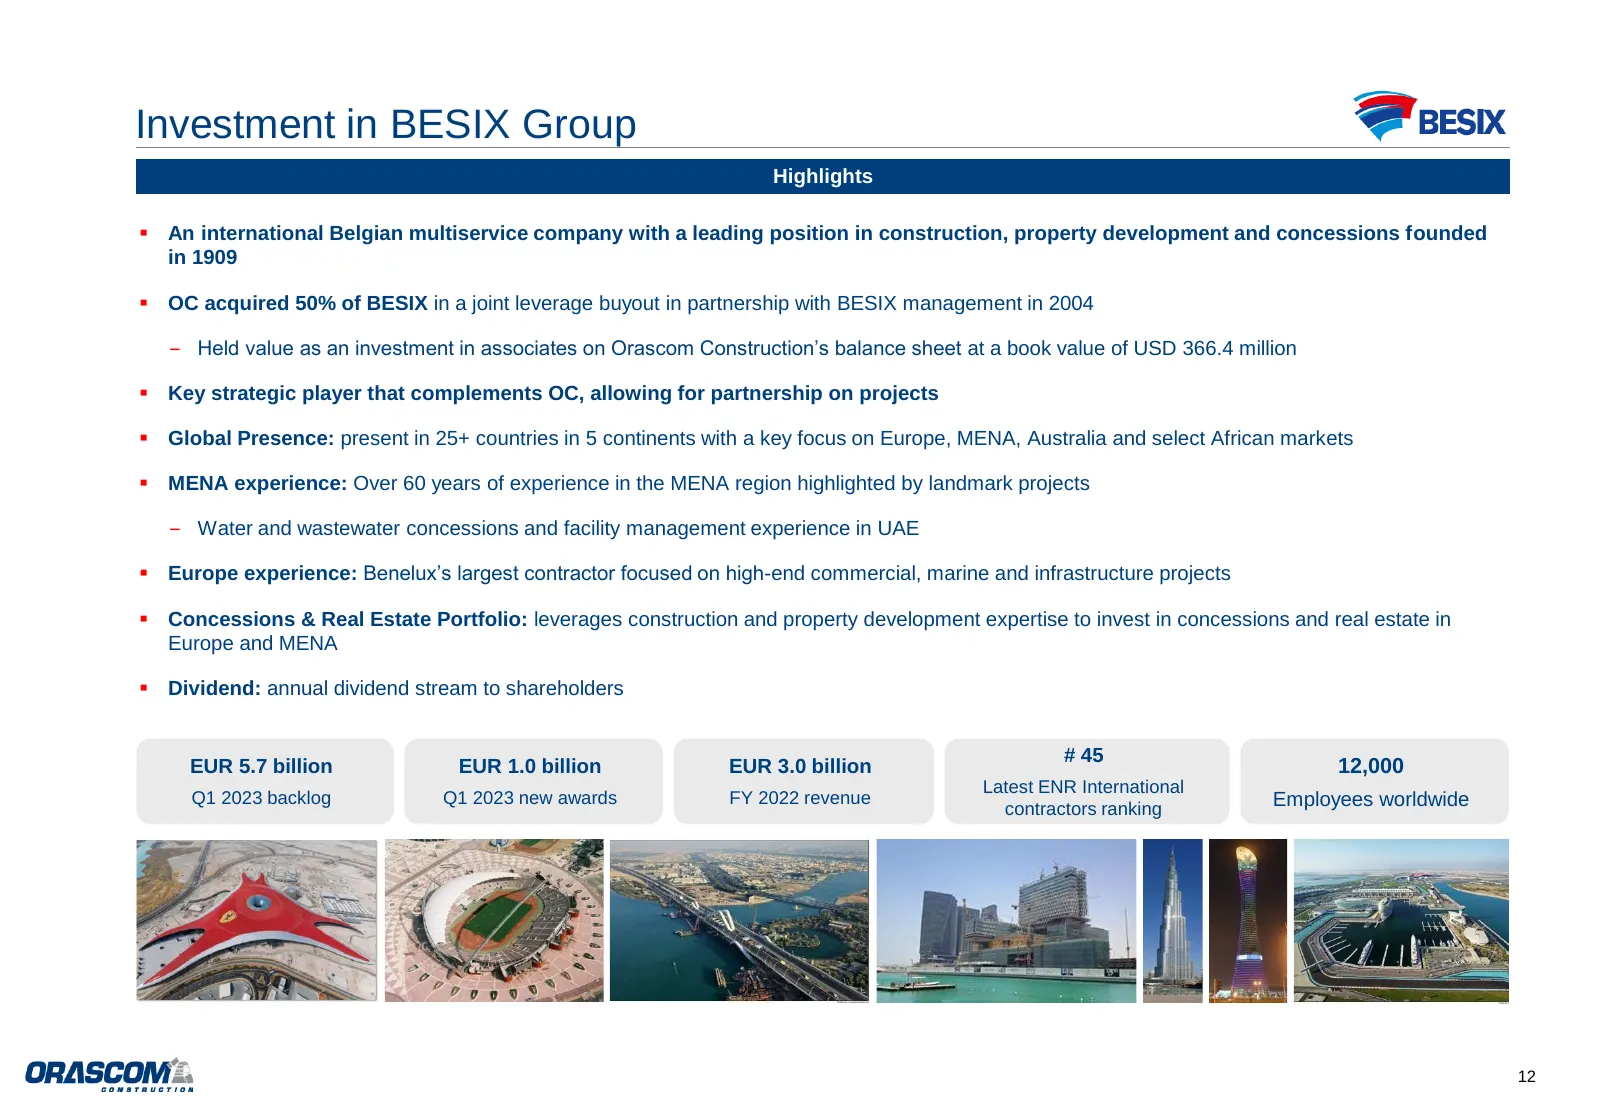
Investment in BESIX Group Highlights ▪ An international Belgian multiservice company with a leading position in construction, property development and concessions founded in 1909 ▪ OC acquired 50% of BESIX in a joint leverage buyout in partnership with BESIX management in 2004 ‒ Held value as an inv
Slide 13: Pro Forma Snapshot Including 50% of BESIX – Q1 2023
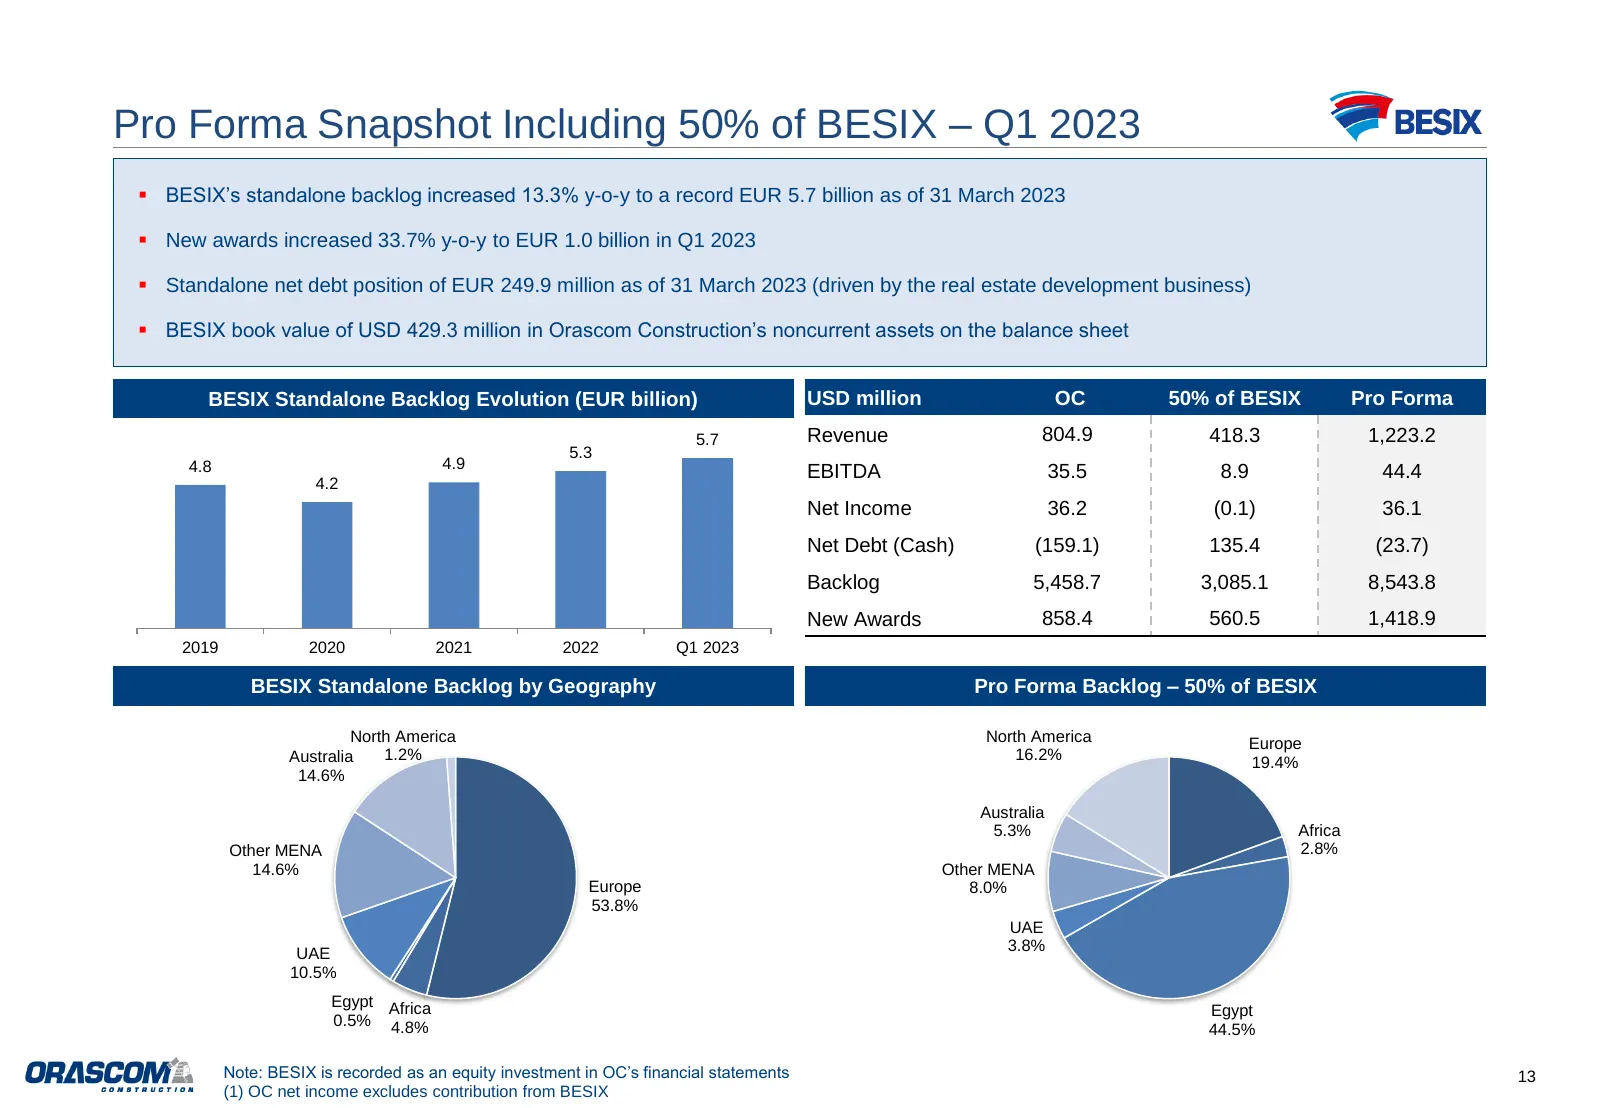
Pro Forma Snapshot Including 50% of BESIX – Q1 2023 ▪ BESIX’s standalone backlog increased 13.3% y-o-y to a record EUR 5.7 billion as of 31 March 2023 ▪ New awards increased 33.7% y-o-y to EUR 1.0 billion in Q1 2023 ▪ Standalone net debt position of EUR 249.9 million as of 31 March 2023 (driven by t
Slide 14: Proven Financing Capabilities
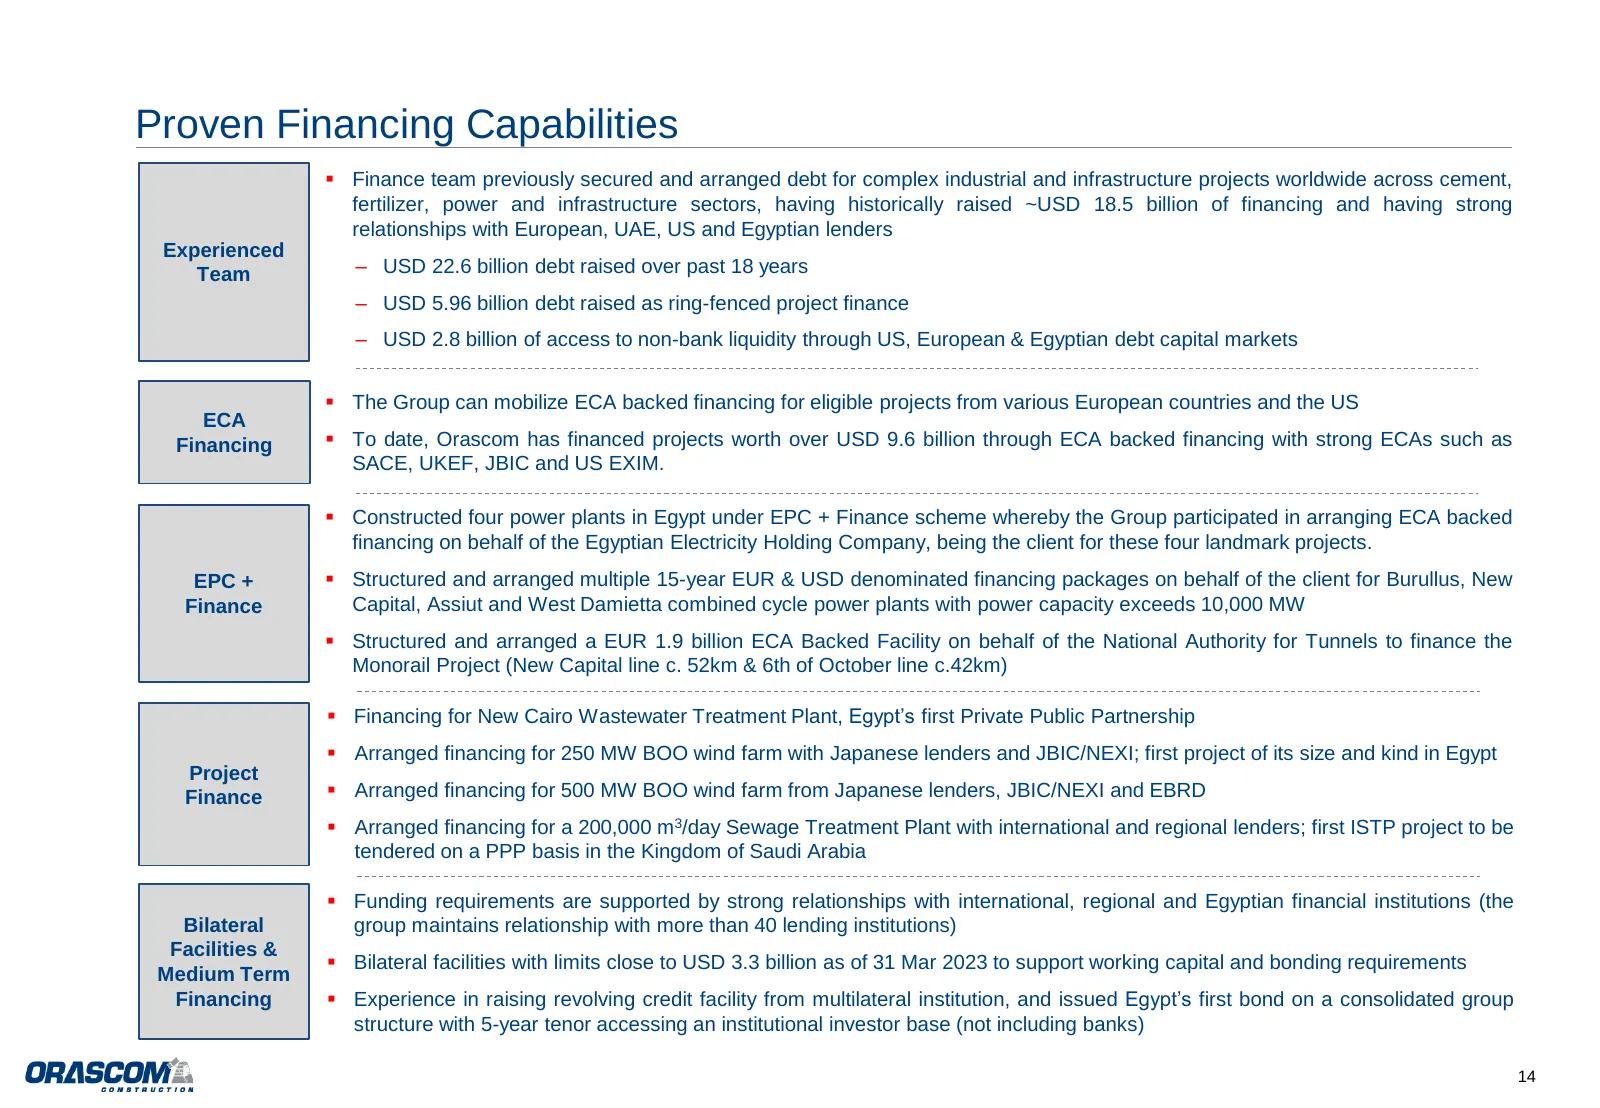
Proven Financing Capabilities ▪ Finance team previously secured and arranged debt for complex industrial and infrastructure projects worldwide across cement, fertilizer, power and infrastructure sectors, having historically raised ~USD 18.5 billion of financing and having strong relationships with E
Slide 15: Financial Section – Q1 2023 Results
Financial Section – Q1 2023 Results
Slide 16: Summary Income Statement
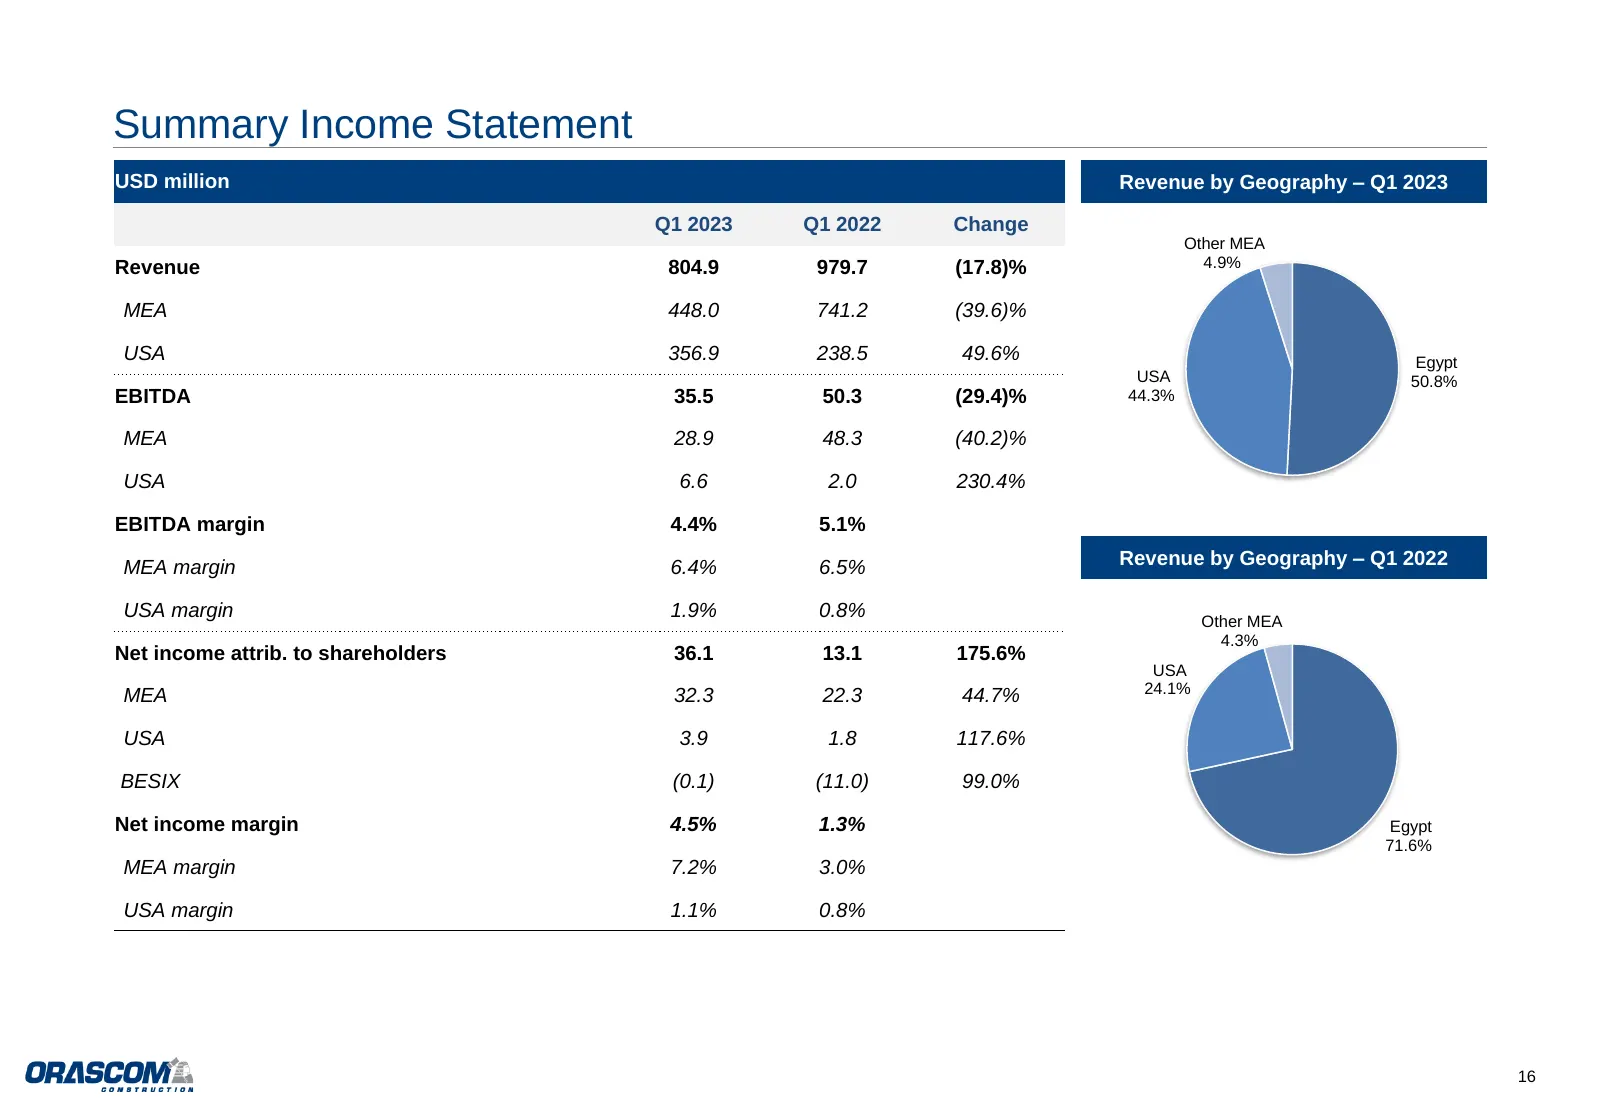
Summary Income Statement USD million Revenue by Geography – Q1 2023 Q1 2023 Q1 2022 Change Other MEA Revenue 804.9 979.7 (17.8)% 4.9% MEA 448.0 741.2 (39.6)% USA 356.9 238.5 49.6% Egypt USA 50.8% EBITDA 35.5 50.3 (29.4)% 44.3% MEA 28.9 48.3 (40.2)% USA 6.6 2.0 230.4% EBITDA margin 4.4% 5.1% MEA marg
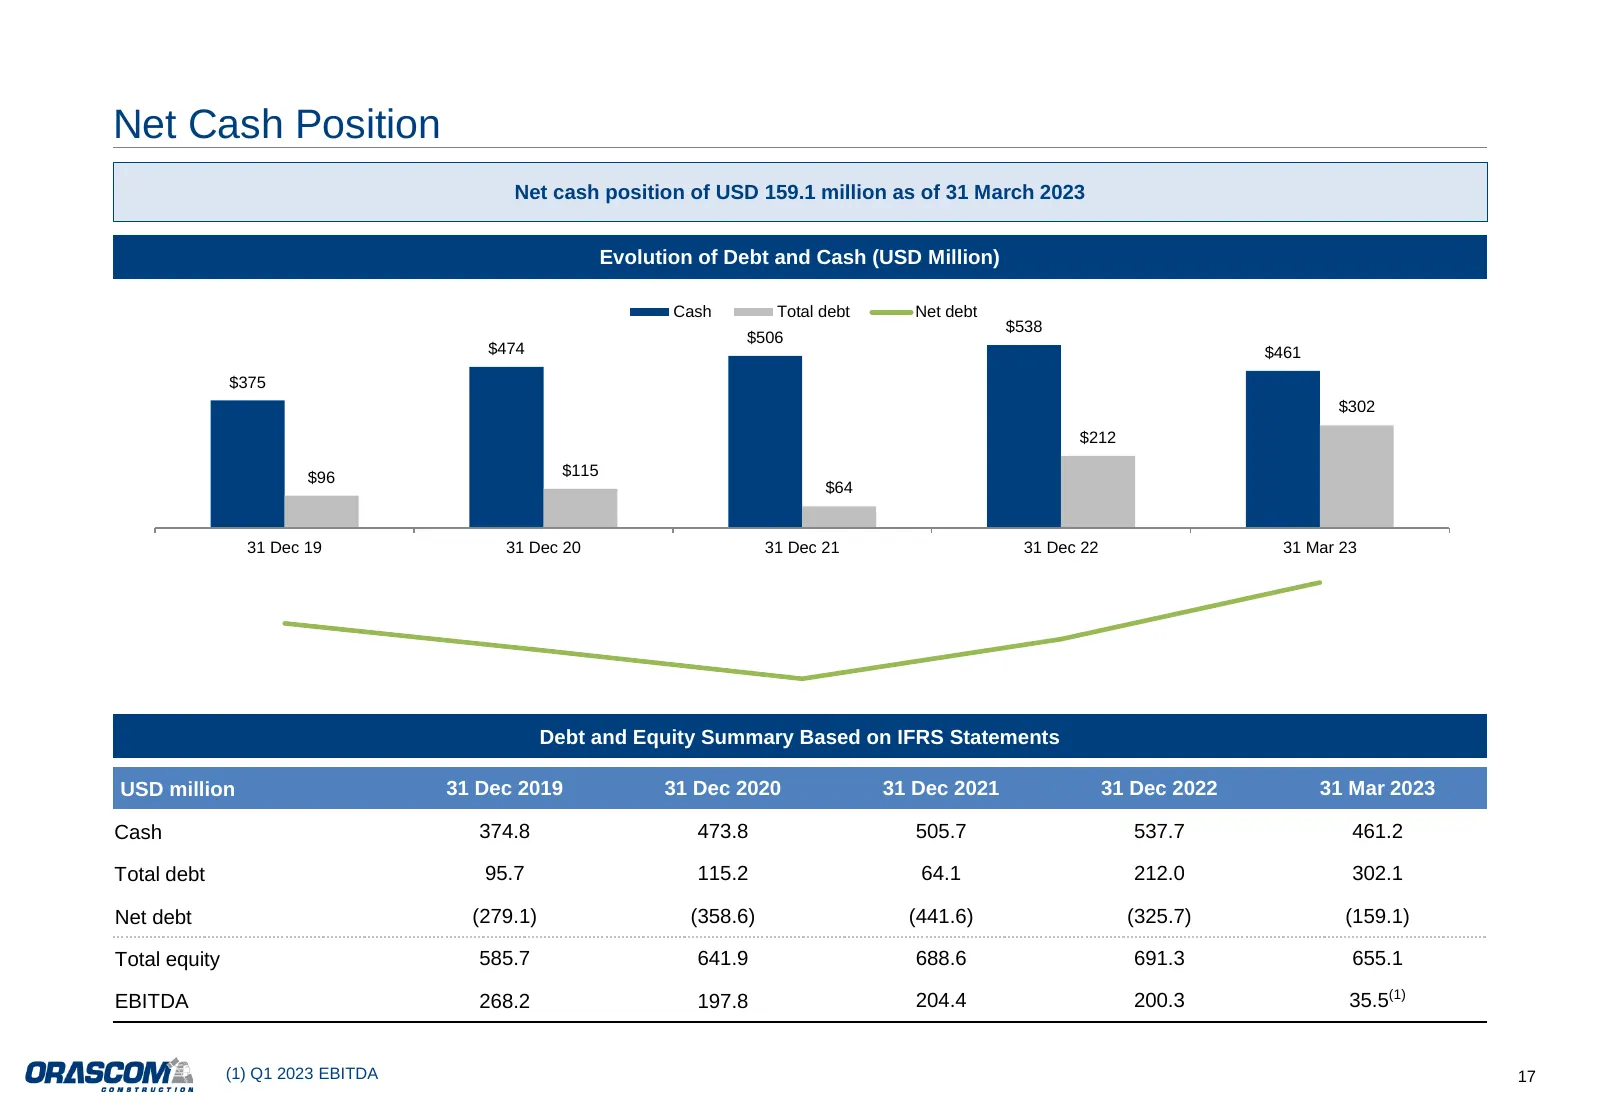
Slide 17: Net Cash Position
Net Cash Position Net cash position of USD 159.1 million as of 31 March 2023 Evolution of Debt and Cash (USD Million) Cash Total debt Net debt $538 $506 $474 $461 $375 $302 $212 $96 $115 $64 31 Dec 19 31 Dec 20 31 Dec 21 31 Dec 22 31 Mar 23 Debt and Equity Summary Based on IFRS Statements USD millio
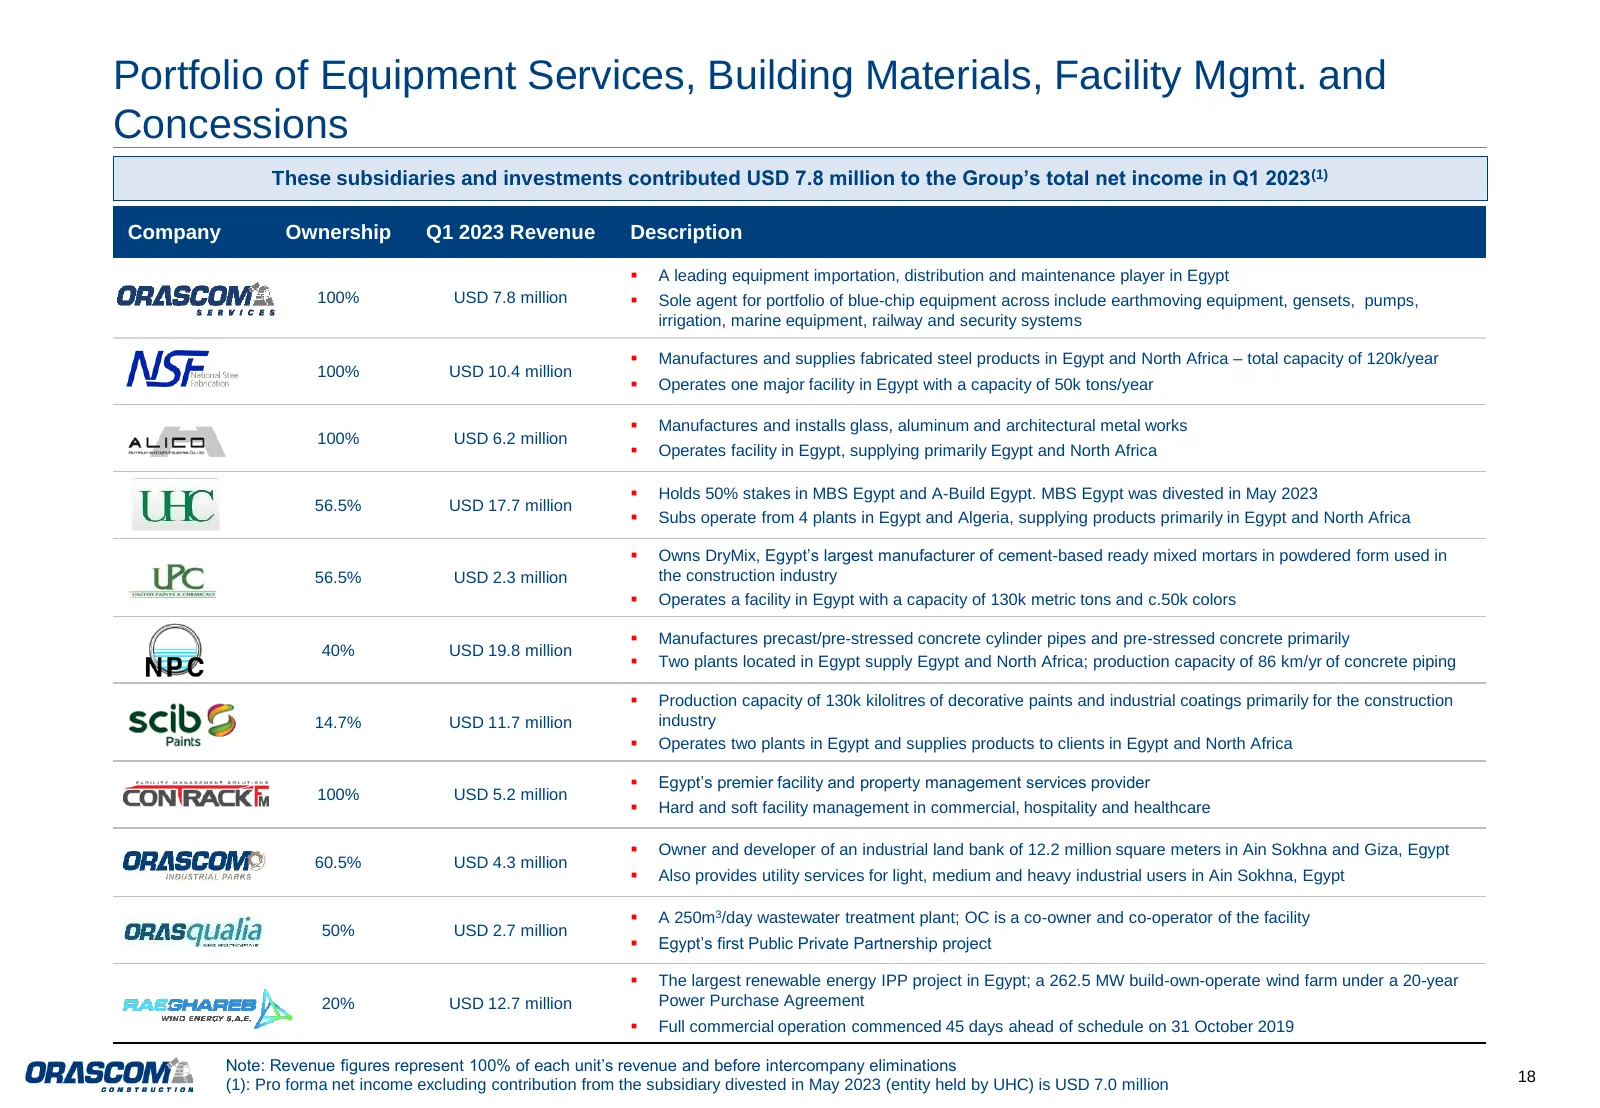
Slide 18: Portfolio of Equipment Services, Building Materials, Facility Mgmt. and Concessions
Portfolio of Equipment Services, Building Materials, Facility Mgmt. and Concessions These subsidiaries and investments contributed USD 7.8 million to the Group’s total net income in Q1 2023(1) Company Ownership Q1 2023 Revenue Description ▪ A leading equipment importation, distribution and maintenan
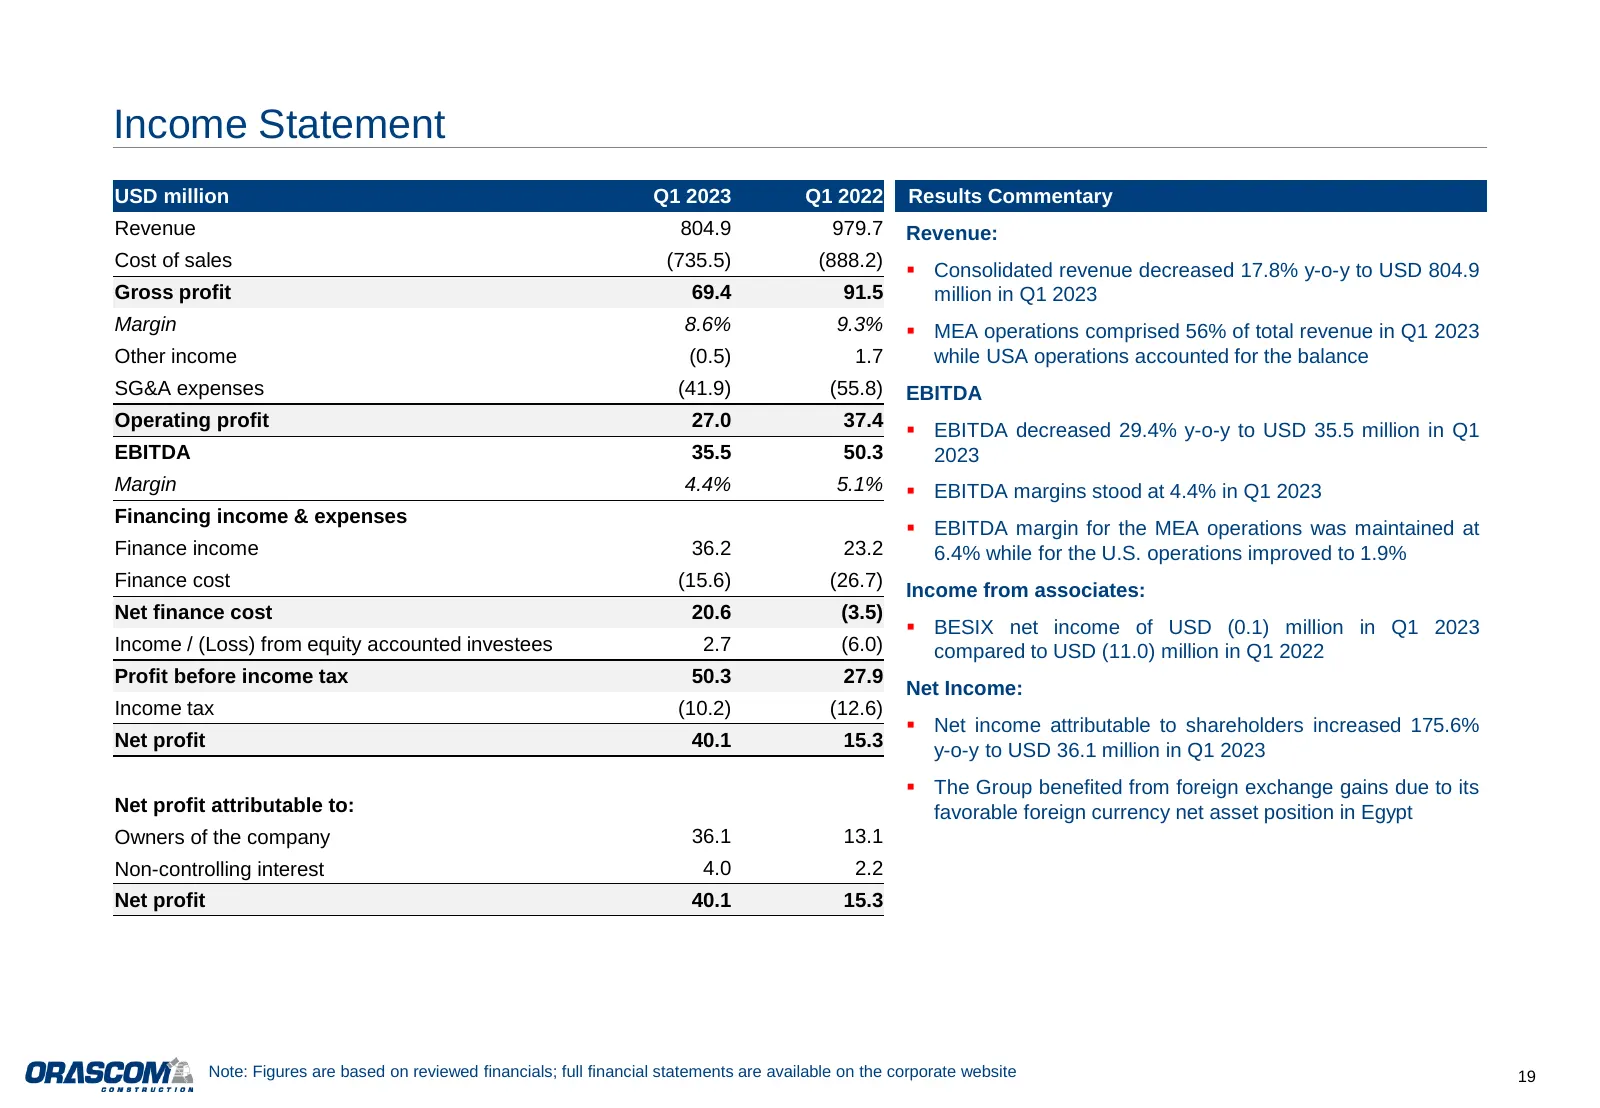
Slide 19: Income Statement
Income Statement USD million Q1 2023 Q1 2022 Results Commentary Revenue 804.9 979.7 Revenue: Cost of sales (735.5) (888.2) ▪ Consolidated revenue decreased 17.8% y-o-y to USD 804.9 Gross profit 69.4 91.5 million in Q1 2023 Margin 8.6% 9.3% ▪ MEA operations comprised 56% of total revenue in Q1 2023 O
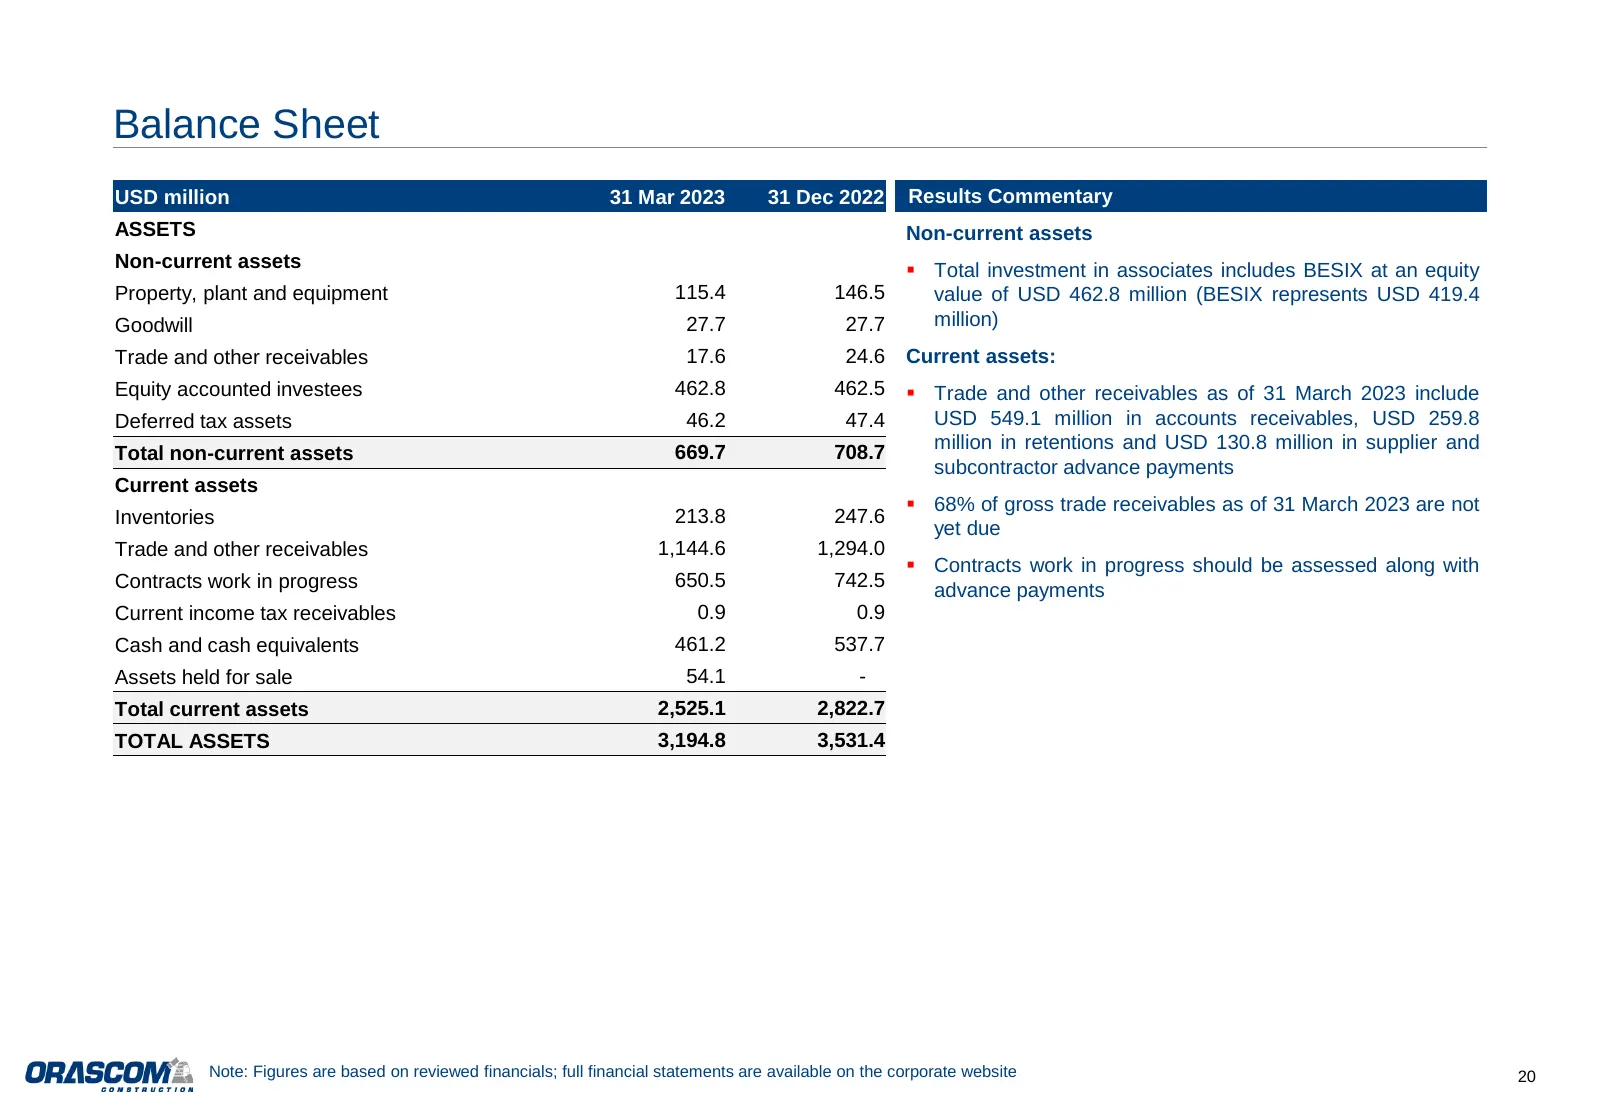
Slide 20: Balance Sheet
Balance Sheet USD million 31 Mar 2023 31 Dec 2022 Results Commentary ASSETS Non-current assets Non-current assets ▪ Total investment in associates includes BESIX at an equity Property, plant and equipment 115.4 146.5 value of USD 462.8 million (BESIX represents USD 419.4 Goodwill 27.7 27.7 million)
Slide 21: Balance Sheet
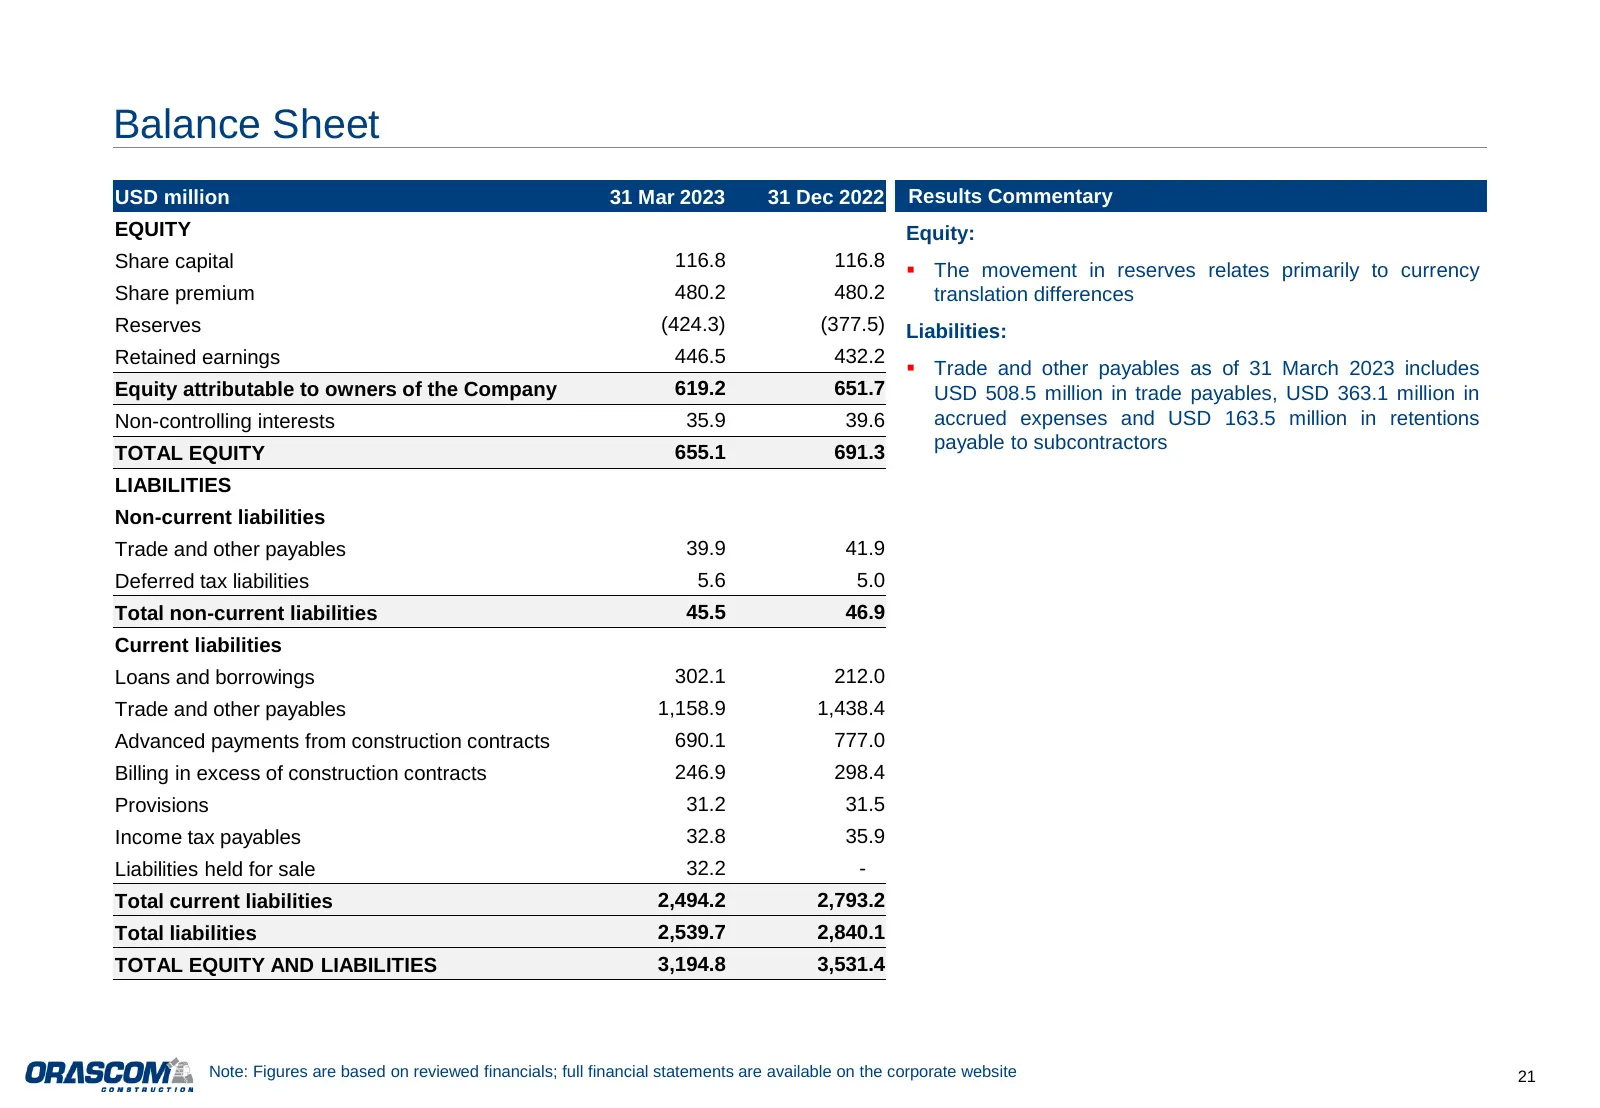
Balance Sheet USD million 31 Mar 2023 31 Dec 2022 Results Commentary EQUITY Equity: Share capital 116.8 116.8 ▪ The movement in reserves relates primarily to currency Share premium 480.2 480.2 translation differences Reserves (424.3) (377.5) Liabilities: Retained earnings 446.5 432.2 ▪ Trade and oth
Slide 22: Cash Flow Statement
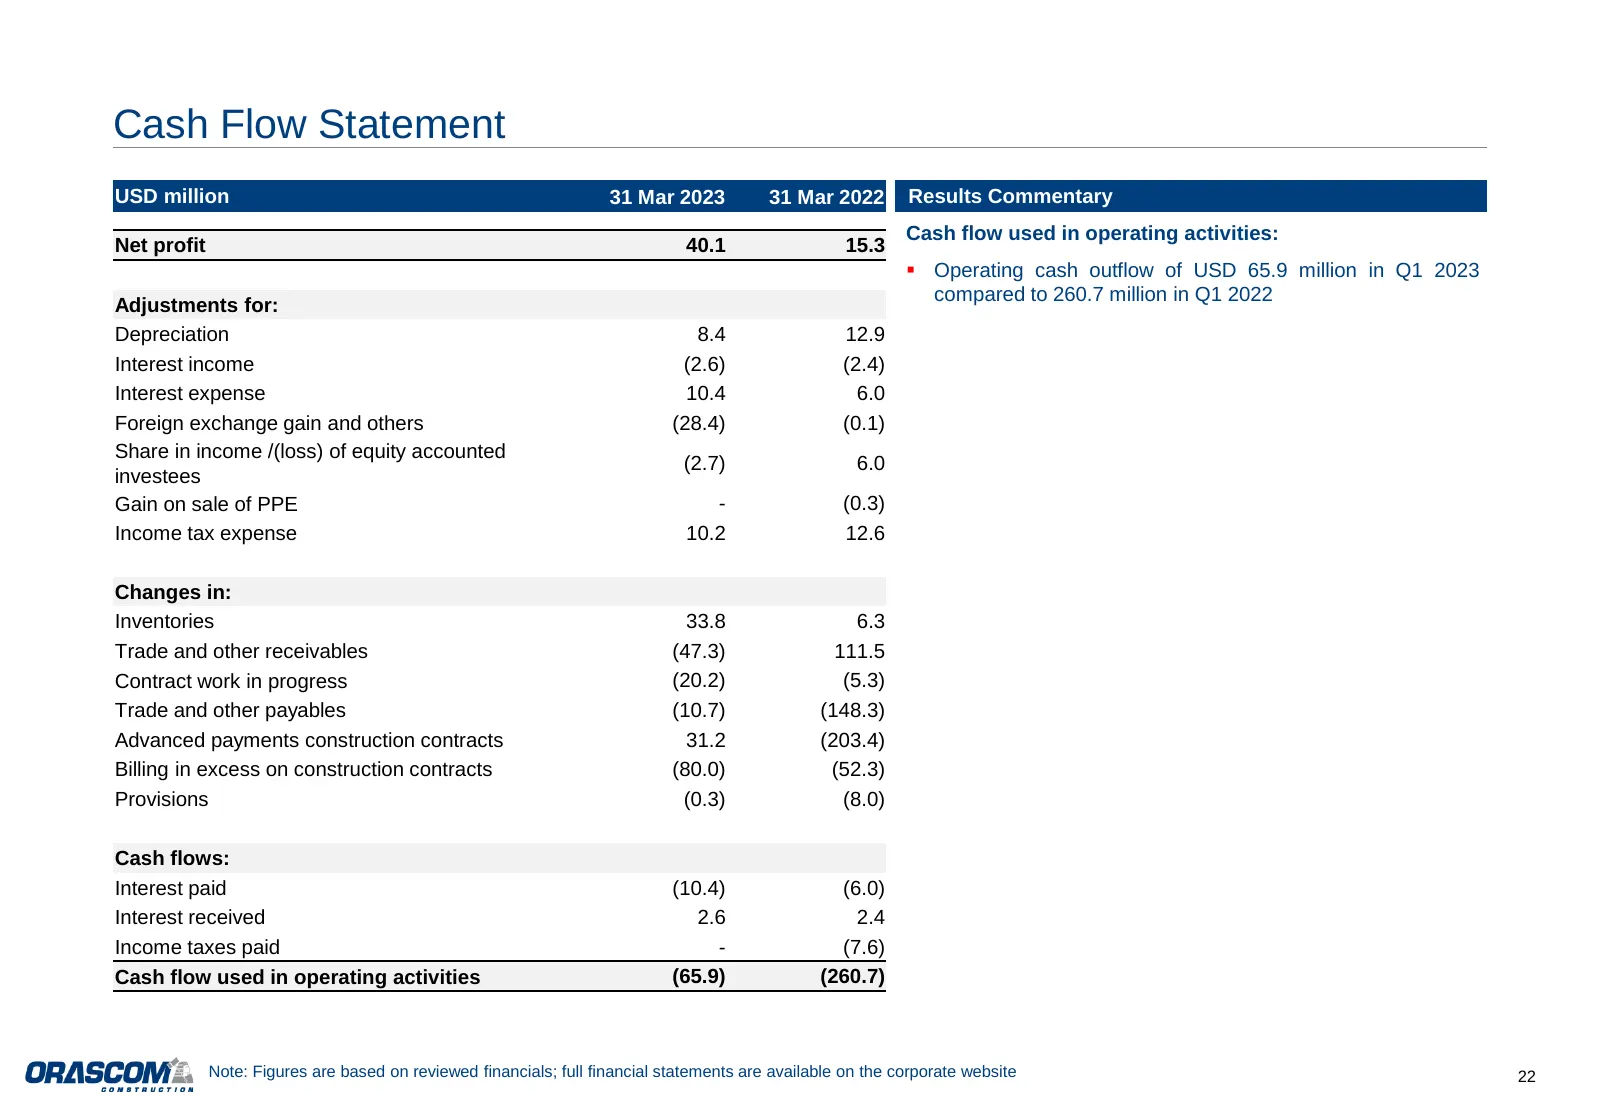
Cash Flow Statement USD million 31 Mar 2023 31 Mar 2022 Results Commentary Cash flow used in operating activities: Net profit 40.1 15.3 ▪ Operating cash outflow of USD 65.9 million in Q1 2023 Adjustments for: compared to 260.7 million in Q1 2022 Depreciation 8.4 12.9 Interest income (2.6) (2.4) Inte
Slide 23: Cash Flow Statement
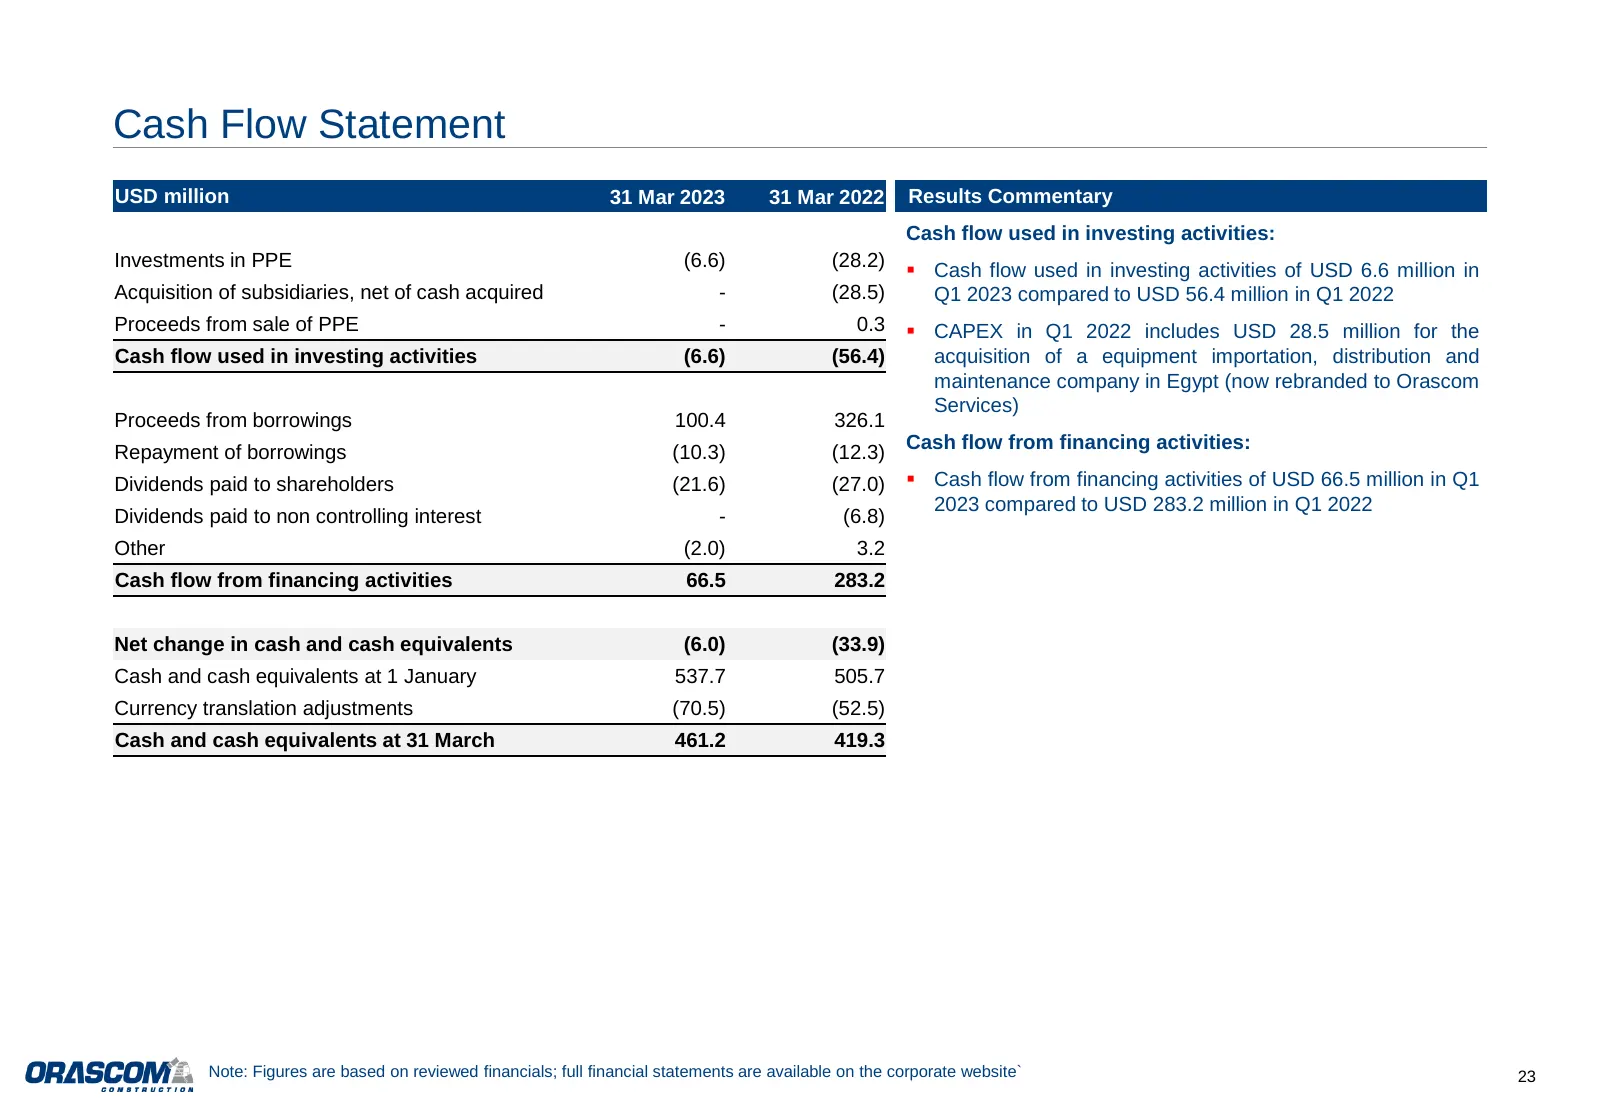
Cash Flow Statement USD million 31 Mar 2023 31 Mar 2022 Results Commentary Cash flow used in investing activities: Investments in PPE (6.6) (28.2) ▪ Cash flow used in investing activities of USD 6.6 million in Acquisition of subsidiaries, net of cash acquired - (28.5) Q1 2023 compared to USD 56.4 mi
Slide 24: Appendix
Appendix
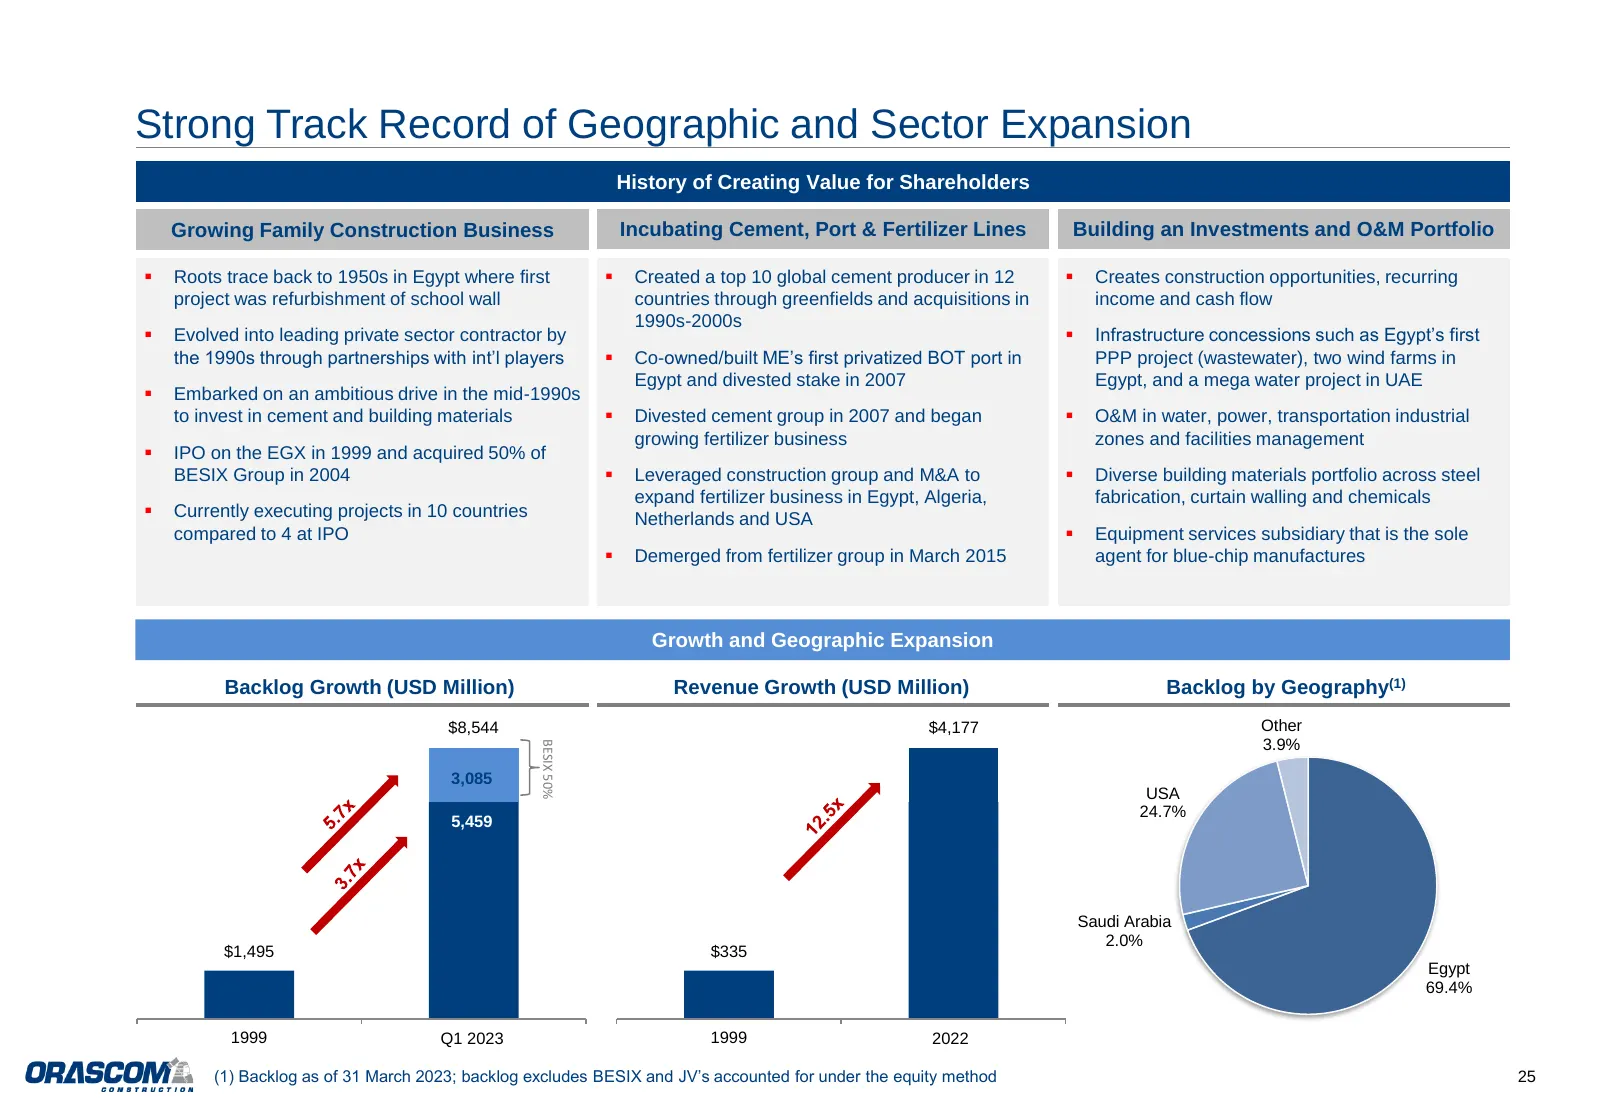
Slide 25: Strong Track Record of Geographic and Sector Expansion
Strong Track Record of Geographic and Sector Expansion History of Creating Value for Shareholders Growing Family Construction Business Incubating Cement, Port & Fertilizer Lines Building an Investments and O&M Portfolio ▪ Roots trace back to 1950s in Egypt where first ▪ Created a top 10 global cemen
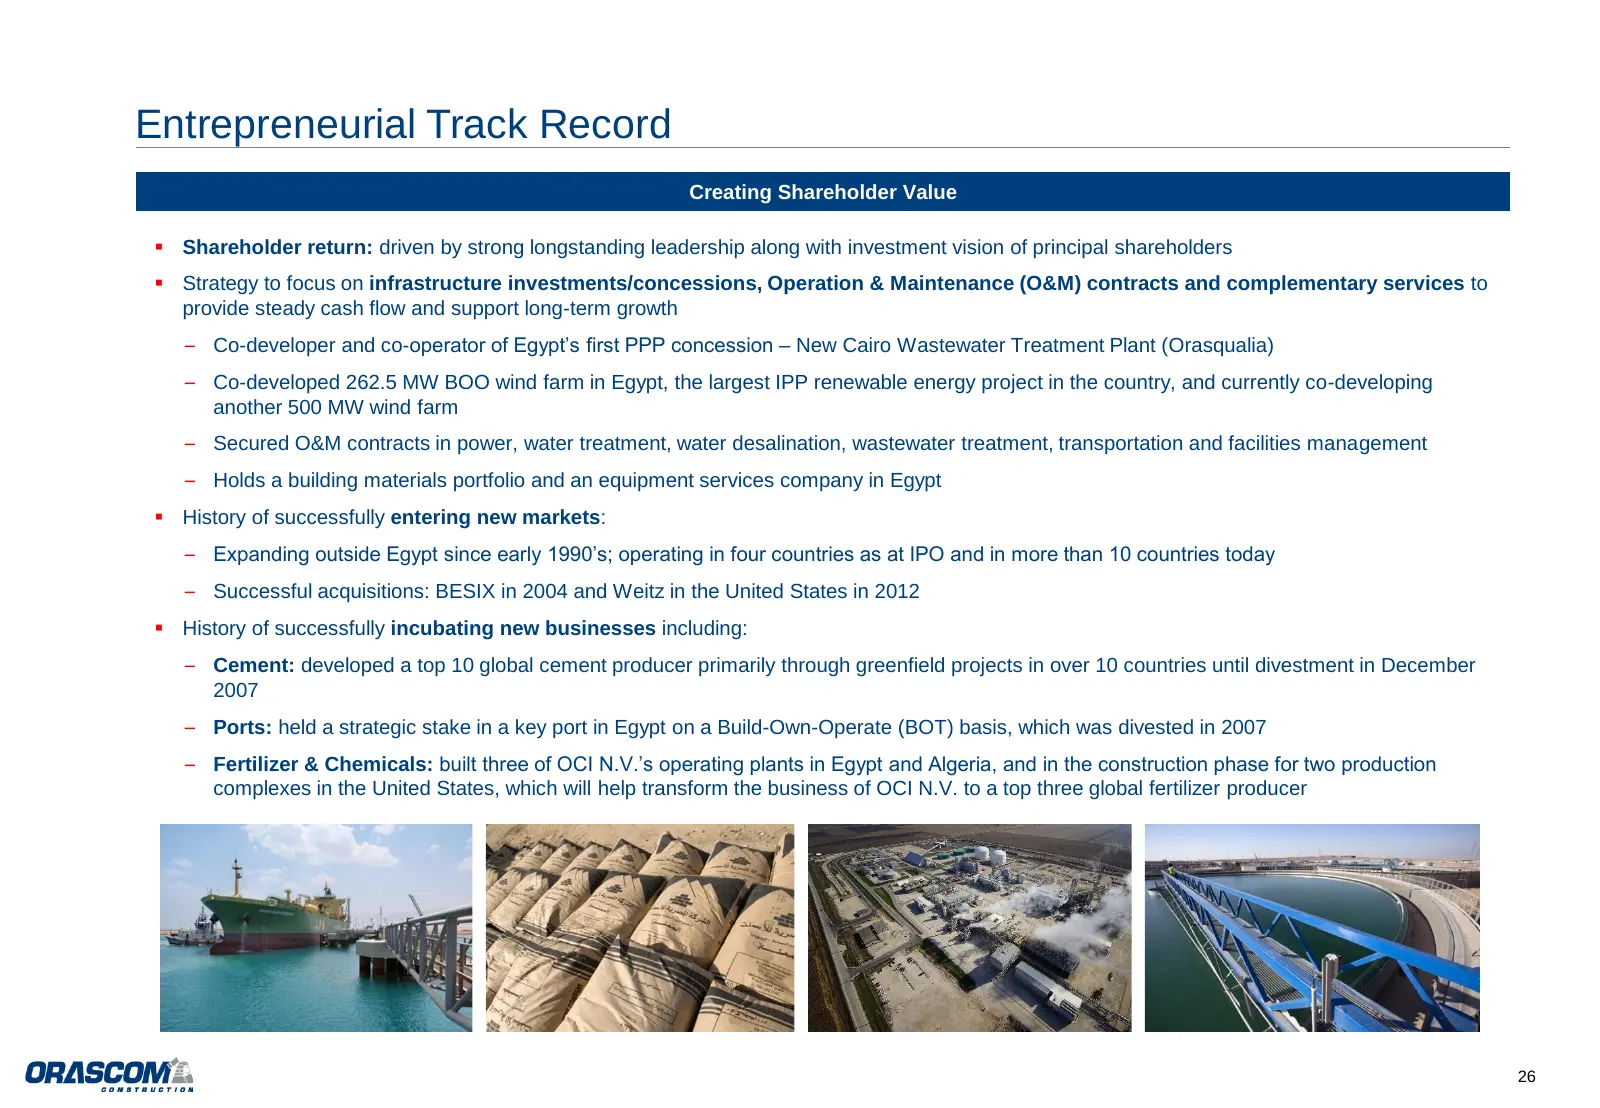
Slide 26: Entrepreneurial Track Record
Entrepreneurial Track Record Creating Shareholder Value ▪ Shareholder return: driven by strong longstanding leadership along with investment vision of principal shareholders ▪ Strategy to focus on infrastructure investments/concessions, Operation & Maintenance (O&M) contracts and complementary servi
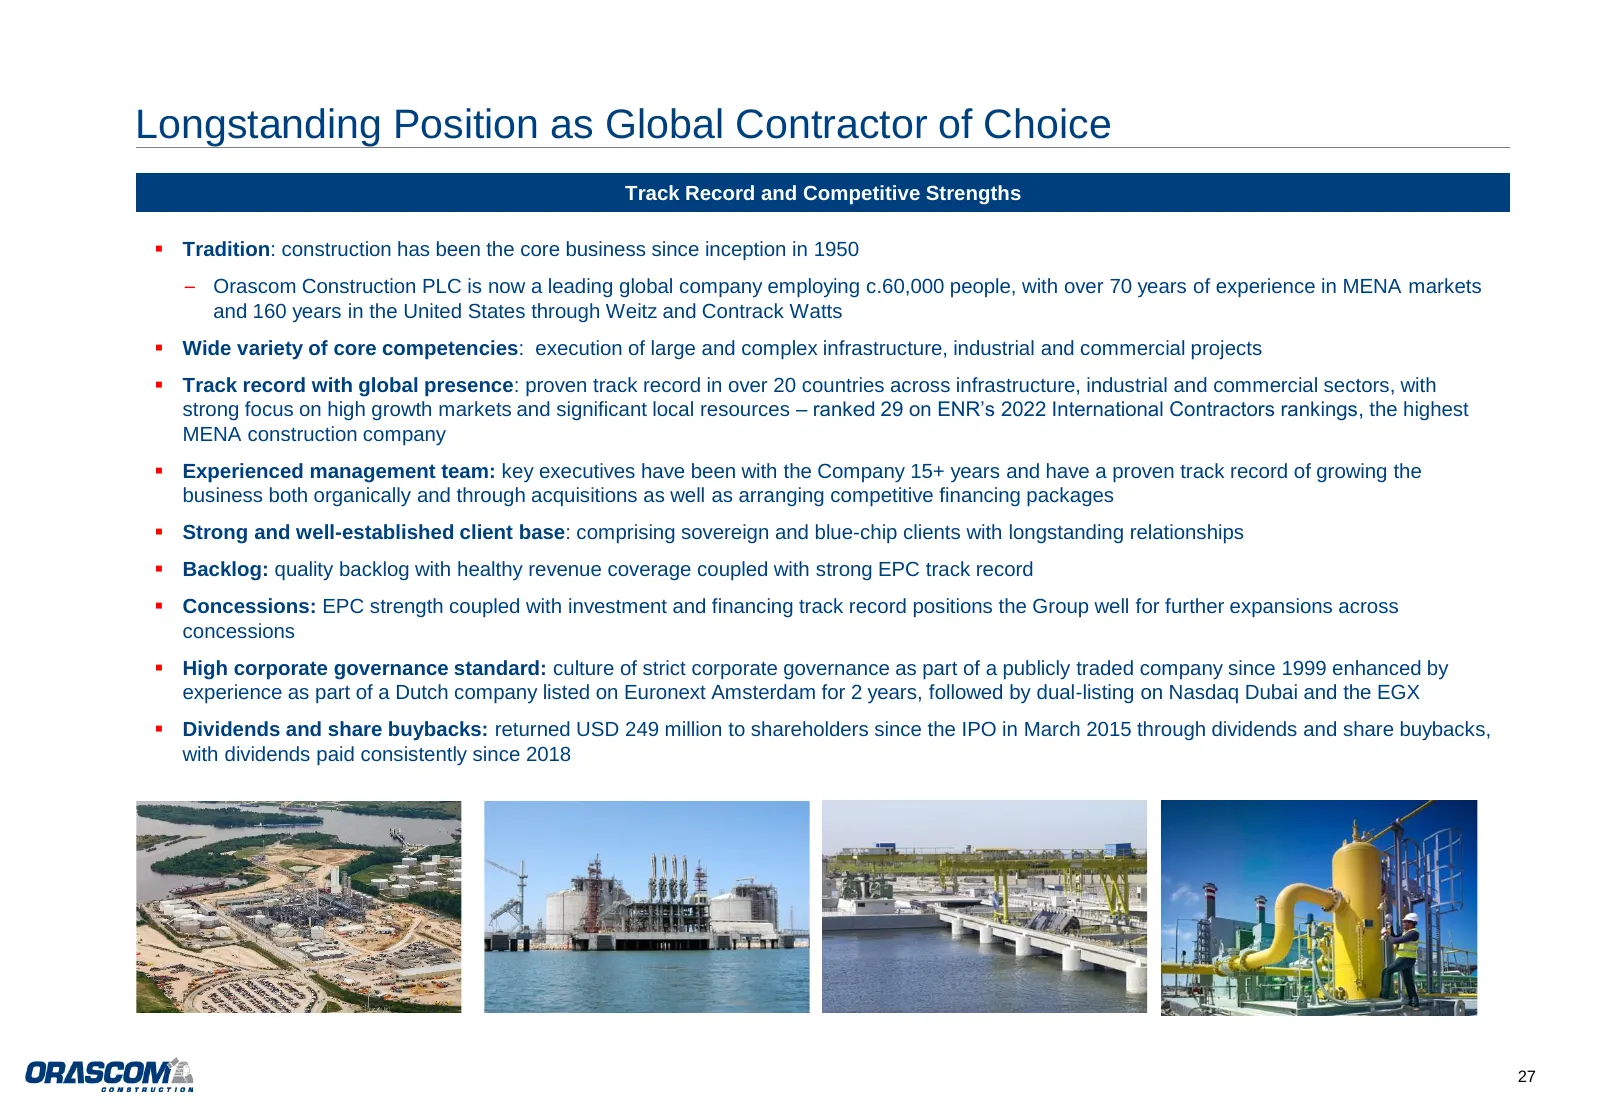
Slide 27: Longstanding Position as Global Contractor of Choice
Longstanding Position as Global Contractor of Choice Track Record and Competitive Strengths ▪ Tradition: construction has been the core business since inception in 1950 – Orascom Construction PLC is now a leading global company employing c.60,000 people, with over 70 years of experience in MENA mark
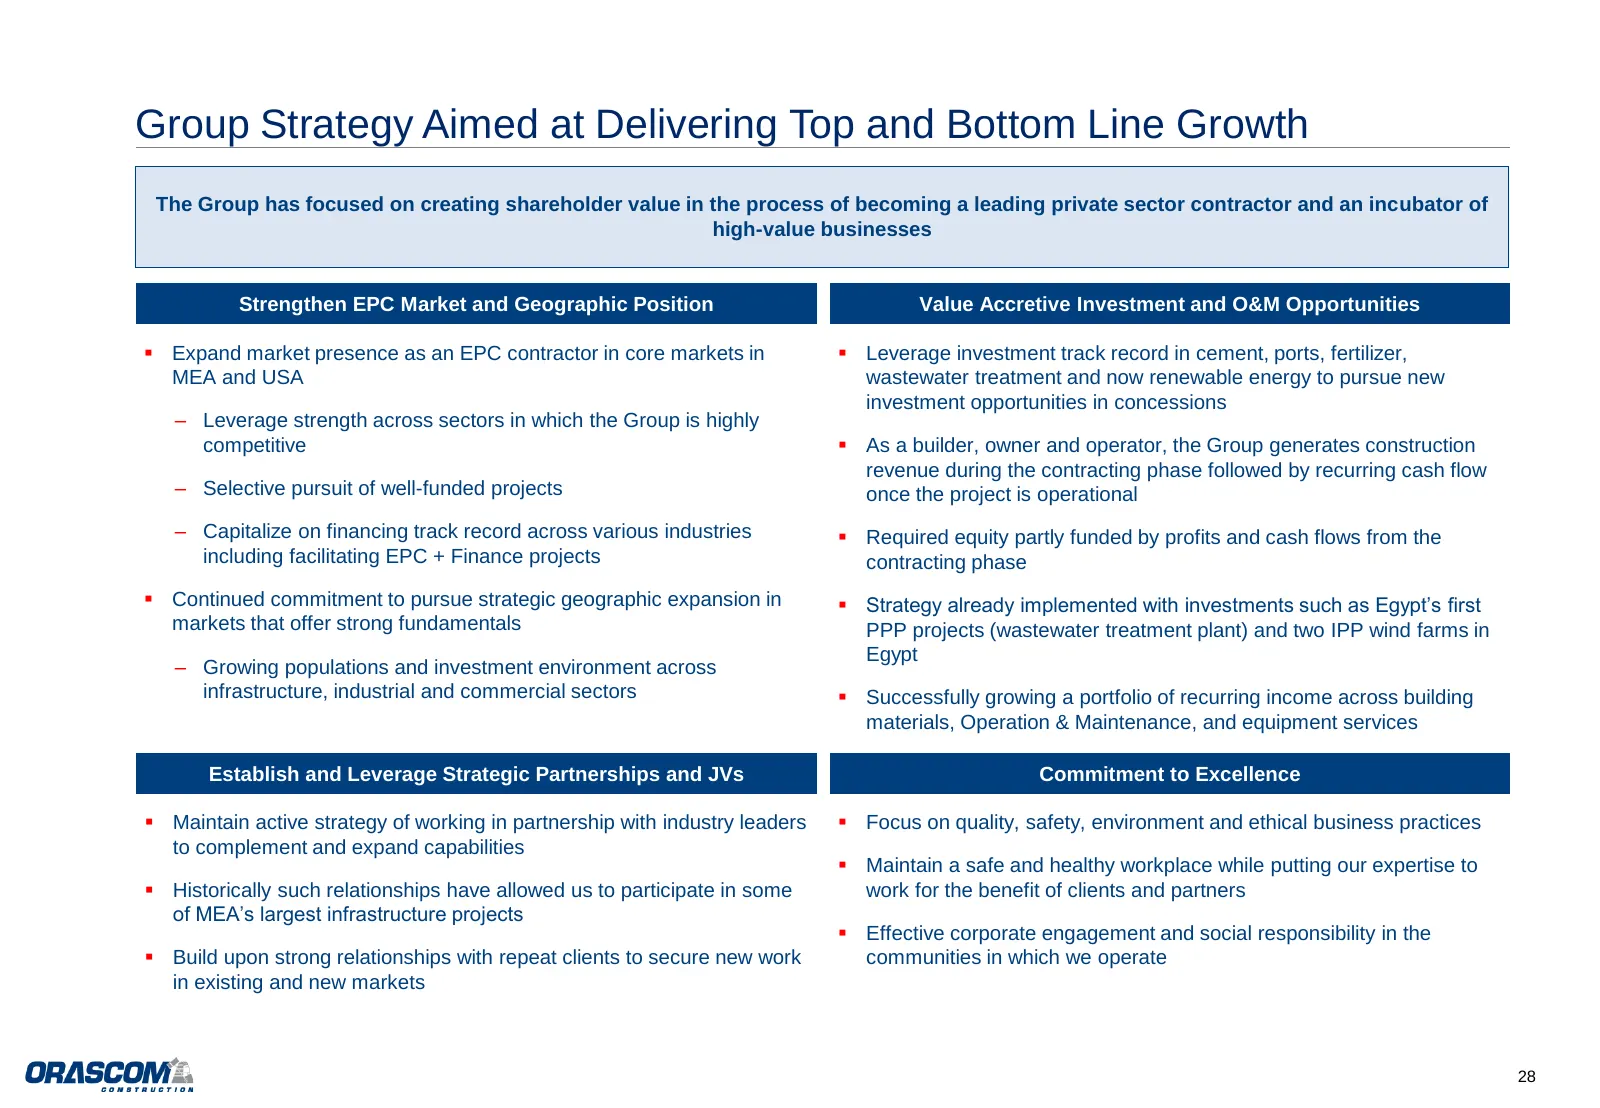
Slide 28: Group Strategy Aimed at Delivering Top and Bottom Line Growth
Group Strategy Aimed at Delivering Top and Bottom Line Growth The Group has focused on creating shareholder value in the process of becoming a leading private sector contractor and an incubator of high-value businesses Strengthen EPC Market and Geographic Position Value Accretive Investment and O&M
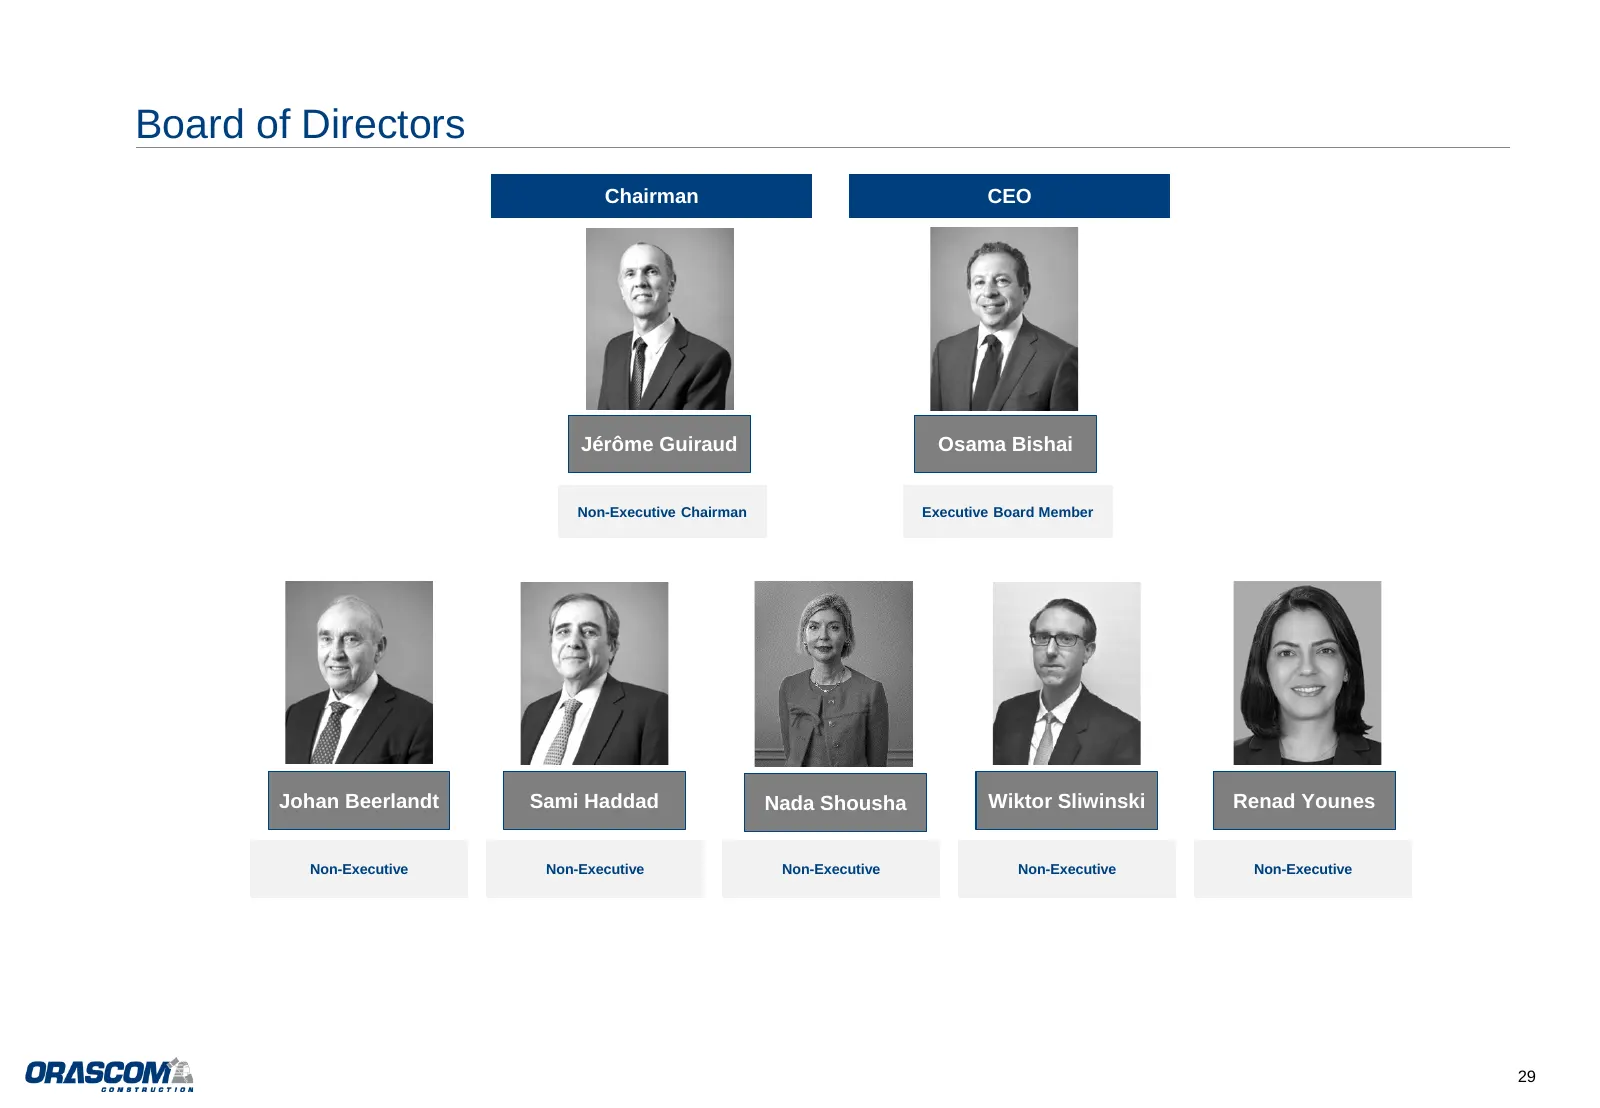
Slide 29: Board of Directors
Board of Directors Chairman CEO Jérôme Guiraud Osama Bishai Non-Executive Chairman Executive Board Member Johan Beerlandt Sami Haddad Nada Shousha Wiktor Sliwinski Renad Younes Non-Executive Non-Executive Non-Executive Non-Executive Non-Executive 29
Slide 30: Important Notice and Disclaimer
Important Notice and Disclaimer This document has been provided to you for information purposes only. This document does not constitute an offer of, or an invitation to invest or deal in, the securities of Orascom Construction PLC (the “Company”). The information set out in this document shall not f

Slide 31: Contact Investor Relations
Contact Investor Relations: Hesham El Halaby Director hesham.elhalaby@orascom.com T: +971 4 318 0900 NASDAQ Dubai: OC EGX: ORAS www.orascom.com
Source: Internet Archive copy of orascom.com
More decks from Orascom Construction PLC
 9M 2026 Earnings Presentation17 slides · Nov 18, 2026
 H1 2026 Earnings Presentation17 slides · Aug 14, 2026
 Investor Presentation (August 2026)27 slides · August 2026
 Q1 2026 Earnings Presentation16 slides · May 14, 2026
 Investor Presentation (May 2026)26 slides · May 2026
 Investor Presentation (April 2026)26 slides · April 2026