Thales SA · EURONEXT:HO
Thales SA — Investor Presentation (March 2023)
61 slides from Thales SA's investor presentation, March 2023

Slide 1: Investor meeting March 2023
Investor meeting March 2023 www.thalesgroup.com
Slide 2: Introduction to Thales, Key priorities, Outlook
Introduction to Thales Key priorities Outlook Sustainability: safer, greener, more inclusive Full-Year 2022 results www.thalesgroup.com
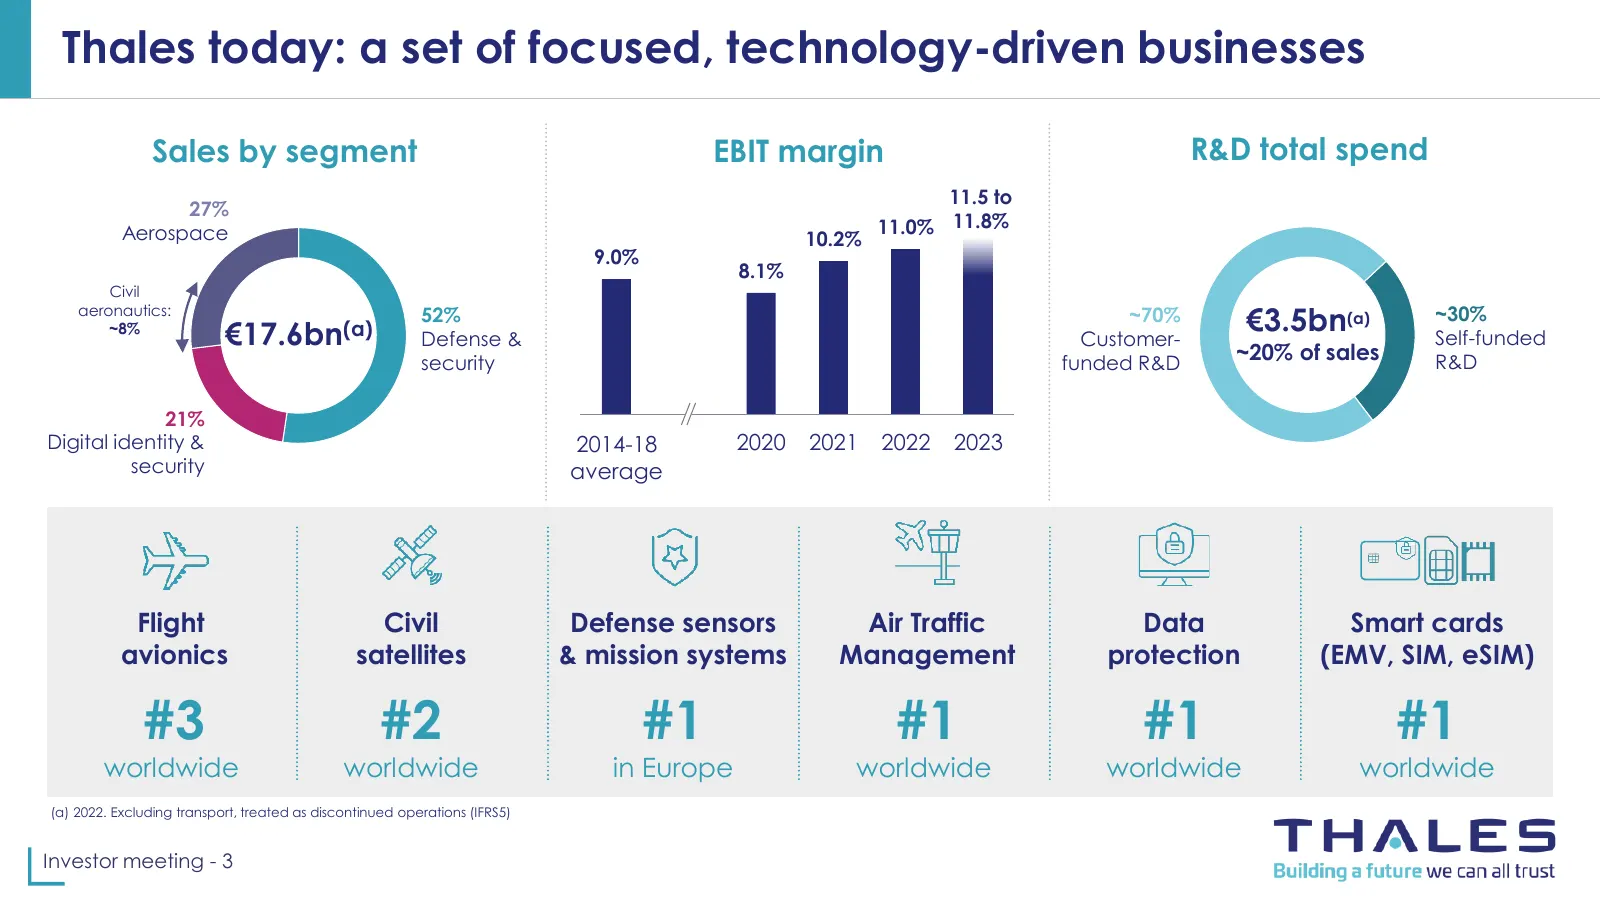
Slide 3: Thales today: a set of focused, technology-driven businesses
Thales today: a set of focused, technology-driven businesses Sales by segment EBIT margin R&D total spend 11.5 to 27% Aerospace 11.0% 11.8% 10.2% 9.0% 8.1% Civil aeronautics: ~8% €17.6bn(a) 52% Defense & ~70% Customer- €3.5bn(a) ~30% Self-funded security funded R&D ~20% of sales R&D 21% Digital iden
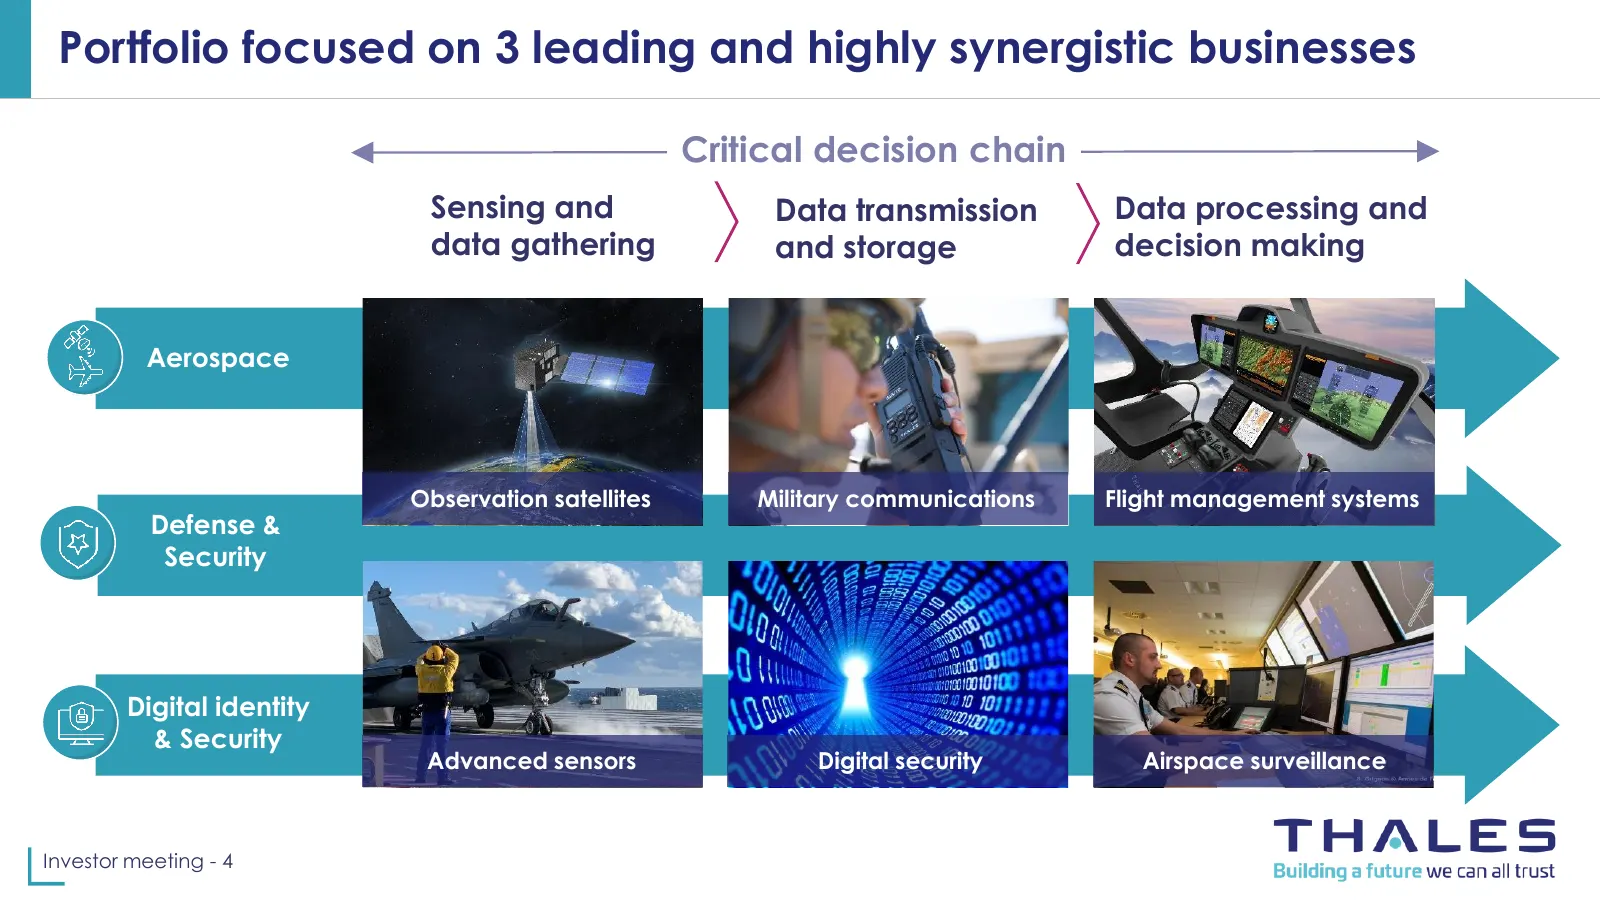
Slide 4: Portfolio focused on leading and highly synergistic businesses
Portfolio focused on 3 leading and highly synergistic businesses Critical decision chain Sensing and Data transmission Data processing and data gathering and storage decision making Aerospace Observation satellites Military communications Flight management systems Defense & Security Digital identity
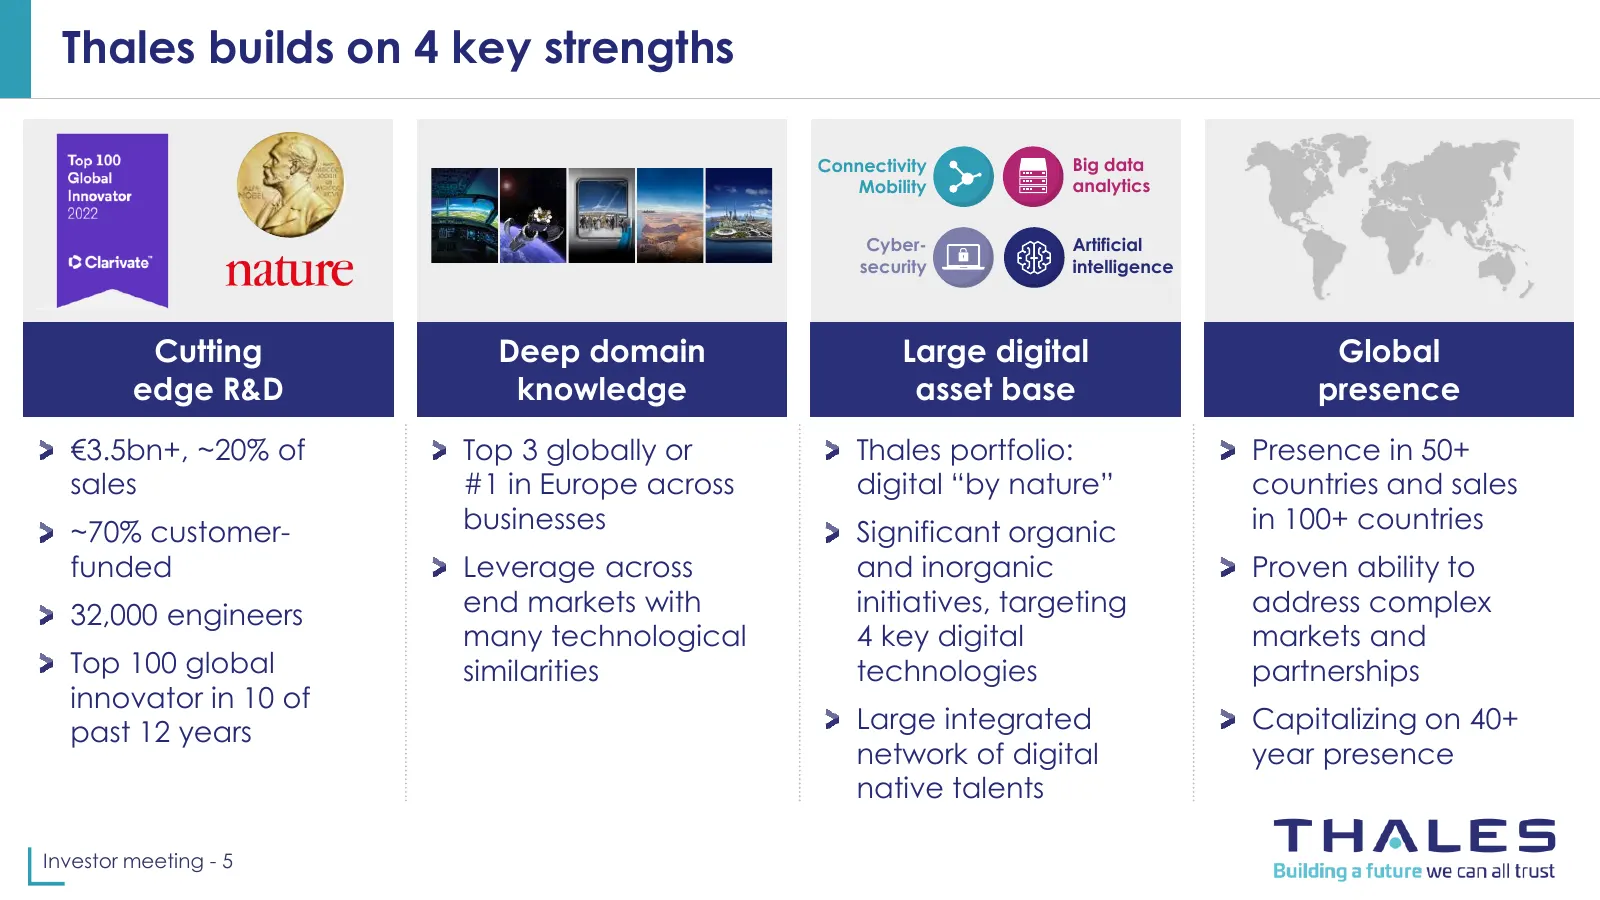
Slide 5: Thales builds on key strengths
Thales builds on 4 key strengths Connectivity Big data Mobility analytics Cyber- Artificial security intelligence Cutting Deep domain Large digital Global edge R&D knowledge asset base presence €3.5bn+, ~20% of Top 3 globally or Thales portfolio: Presence in 50+ sales #1 in Europe across digital “by
Slide 6: Key priorities
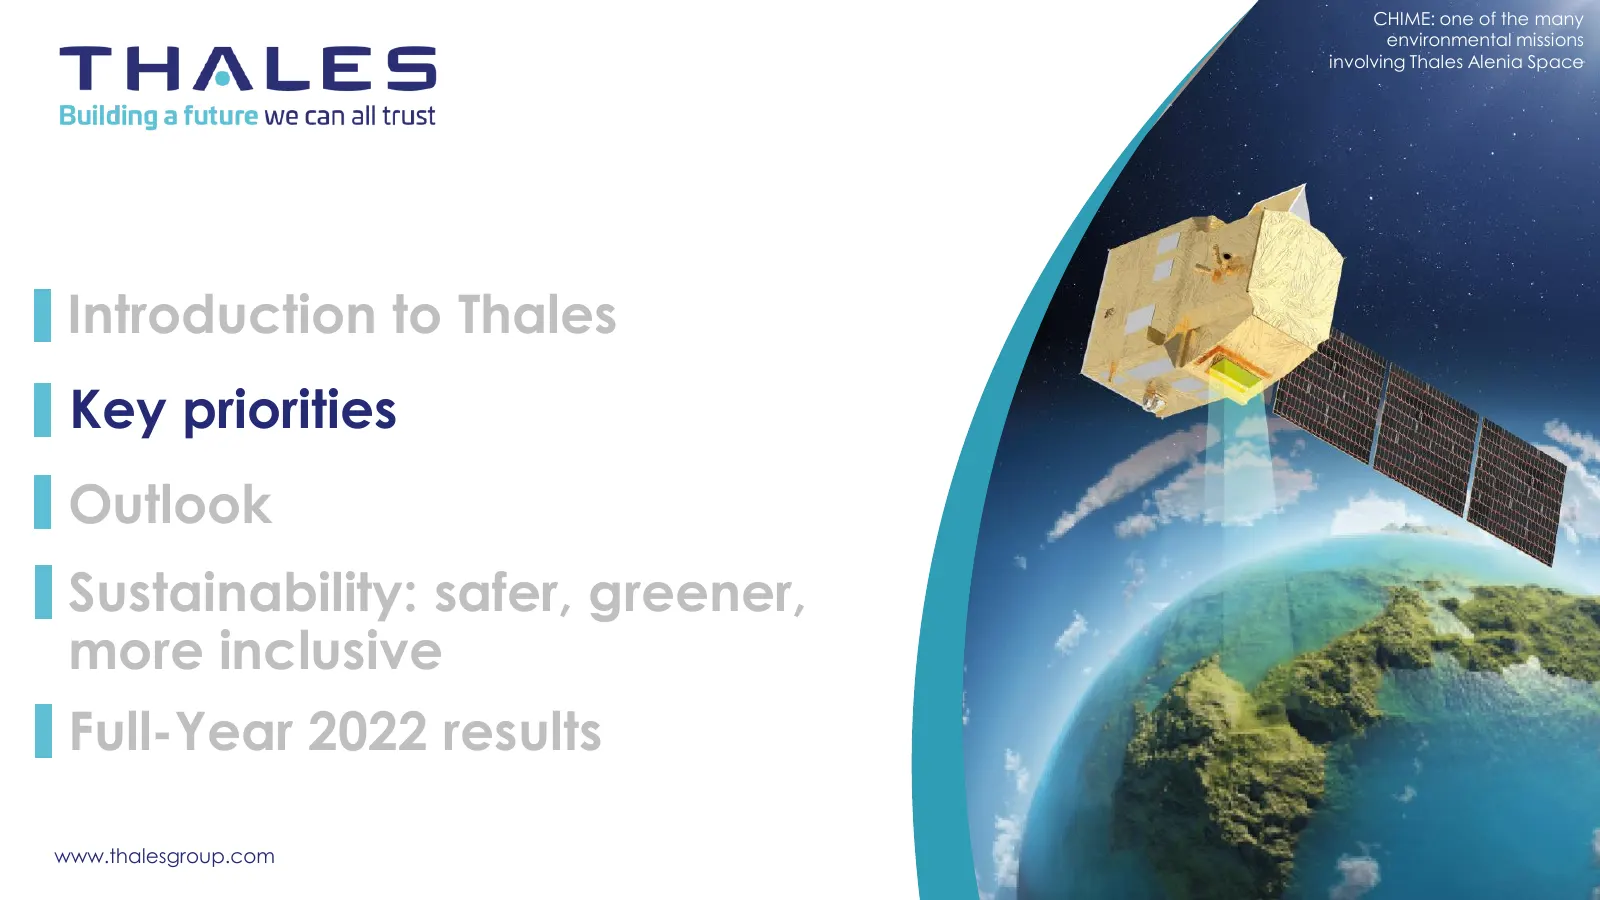
CHIME: one of the many environmental missions involving Thales Alenia Space Introduction to Thales Key priorities Outlook Sustainability: safer, greener, more inclusive Full-Year 2022 results www.thalesgroup.com
Slide 7: Key 2023 priorities
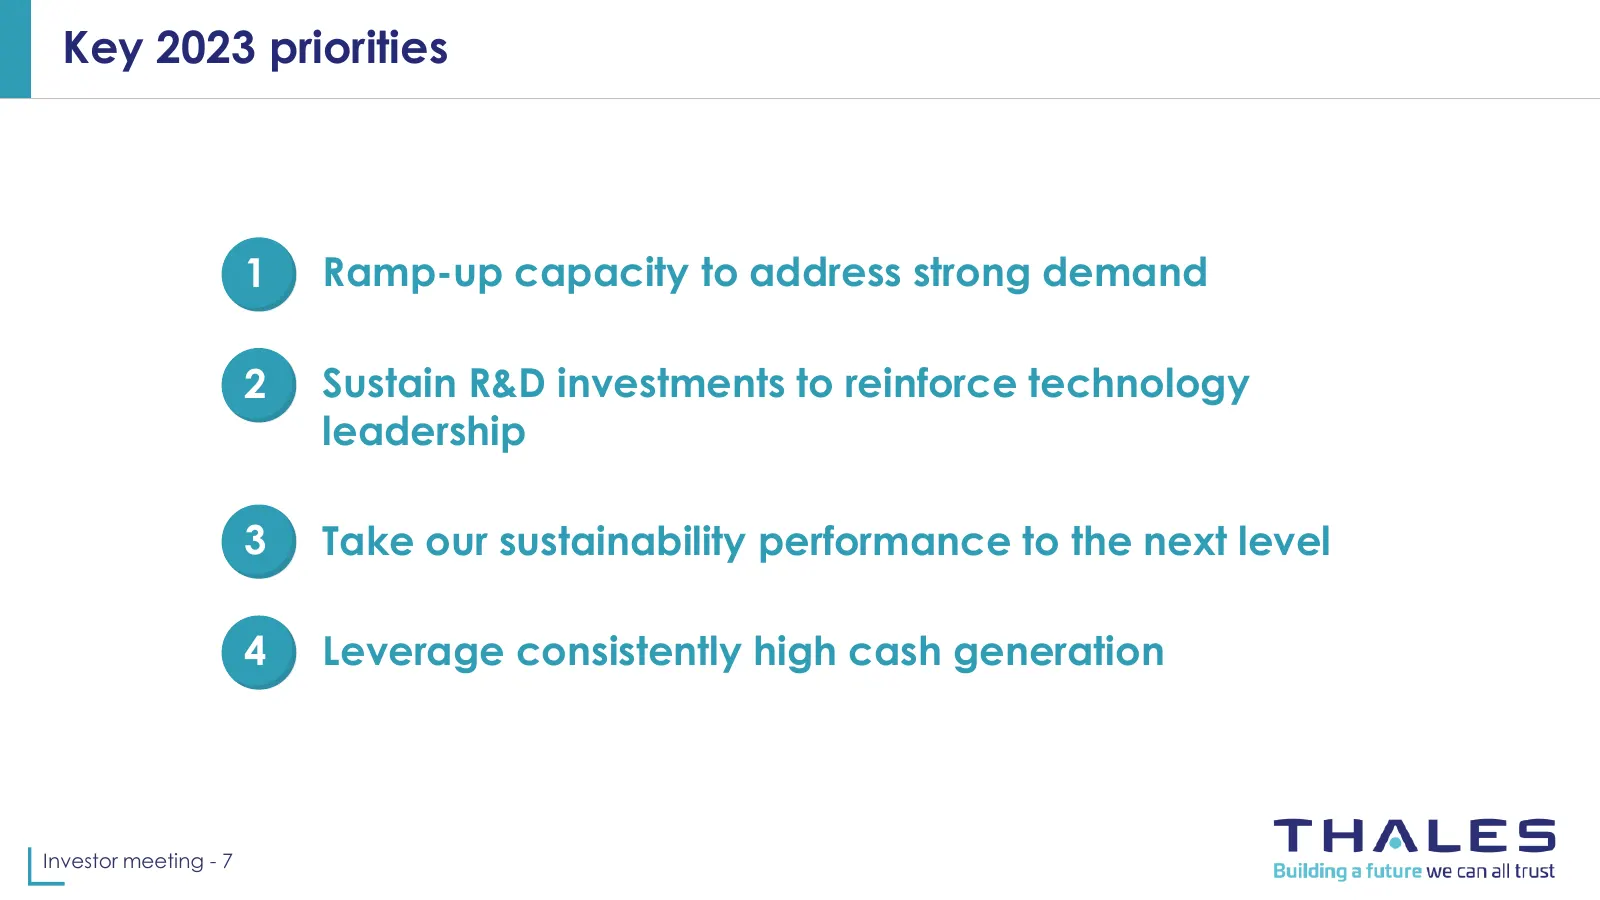
Key 2023 priorities 1 Ramp-up capacity to address strong demand 2 Sustain R&D investments to reinforce technology leadership 3 Take our sustainability performance to the next level 4 Leverage consistently high cash generation Investor meeting - 7
Slide 8: Ramp-up staffing to address strong demand
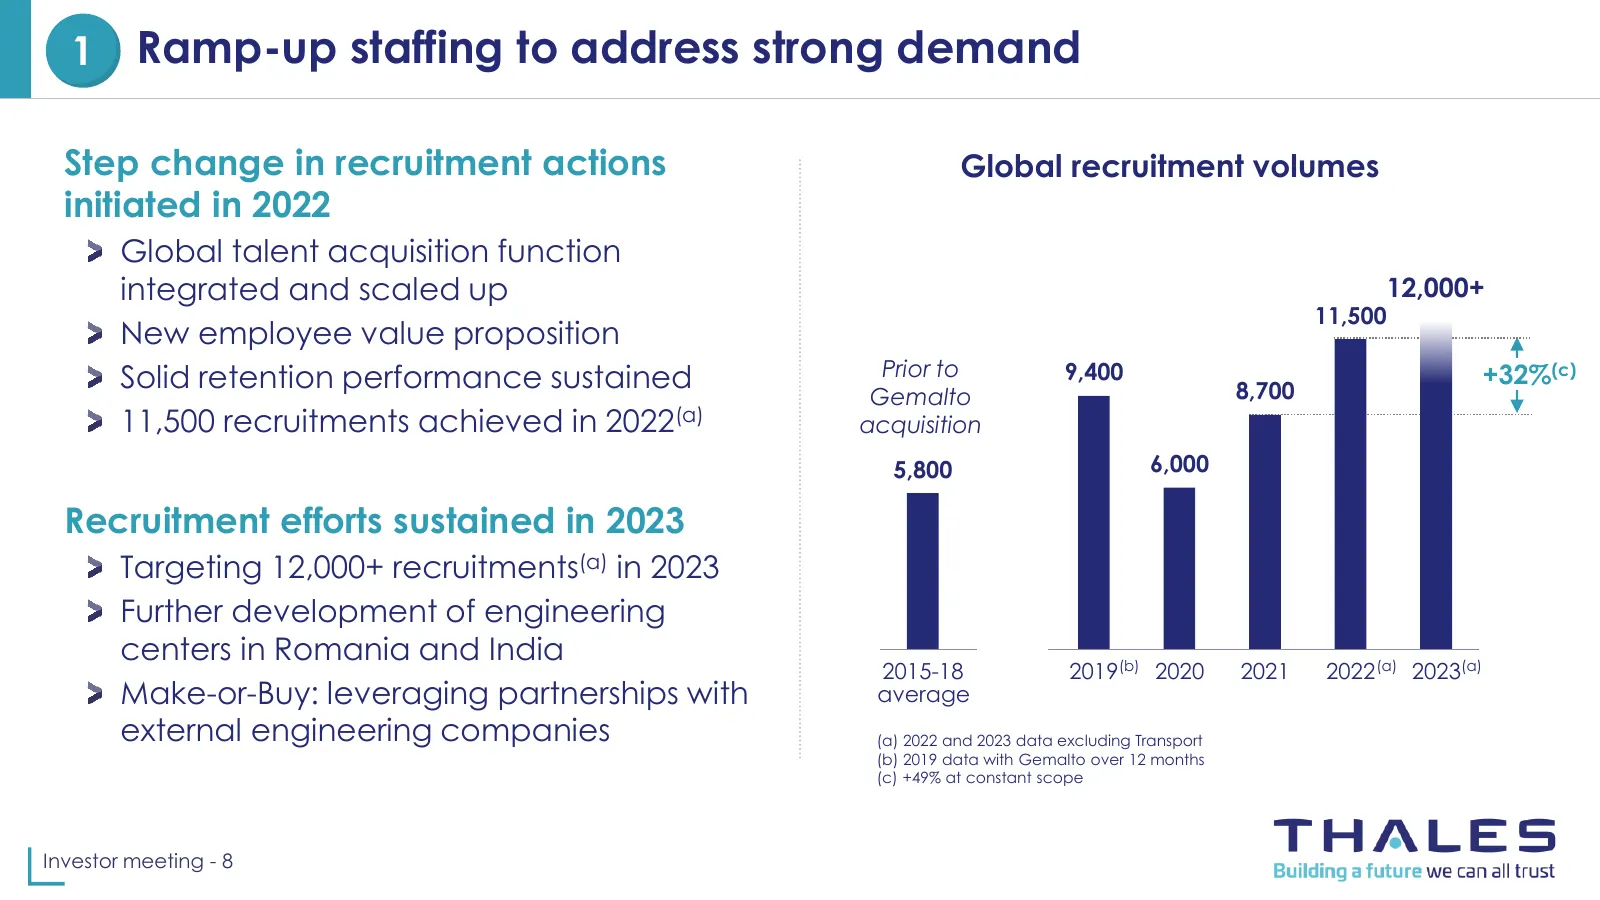
1 Ramp-up staffing to address strong demand Step change in recruitment actions Global recruitment volumes initiated in 2022 Global talent acquisition function integrated and scaled up 12,000+ 11,500 New employee value proposition Solid retention performance sustained Prior to 9,400 +32%(c) Gemalto 8
Slide 9: Ramp-up capex and supply chains to address strong demand
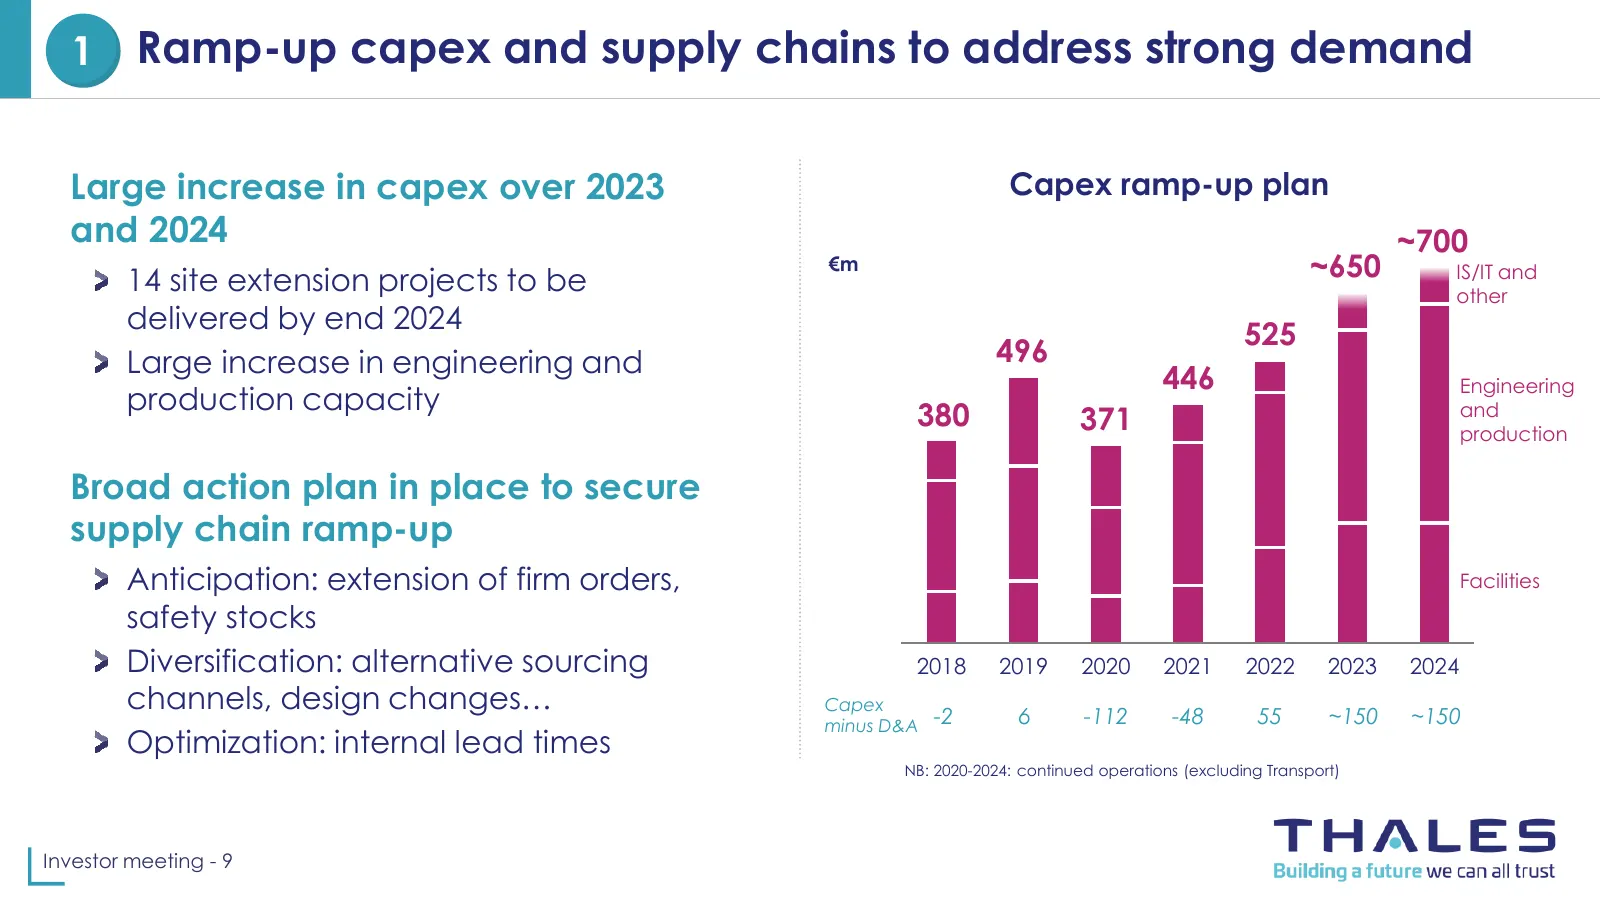
1 Ramp-up capex and supply chains to address strong demand Large increase in capex over 2023 Capex ramp-up plan and 2024 ~700 14 site extension projects to be €m ~650 IS/IT and other delivered by end 2024 525 Large increase in engineering and 496 446 Engineering production capacity 380 371 and produ
Slide 10: Sustain R&D investments to reinforce technology leadership
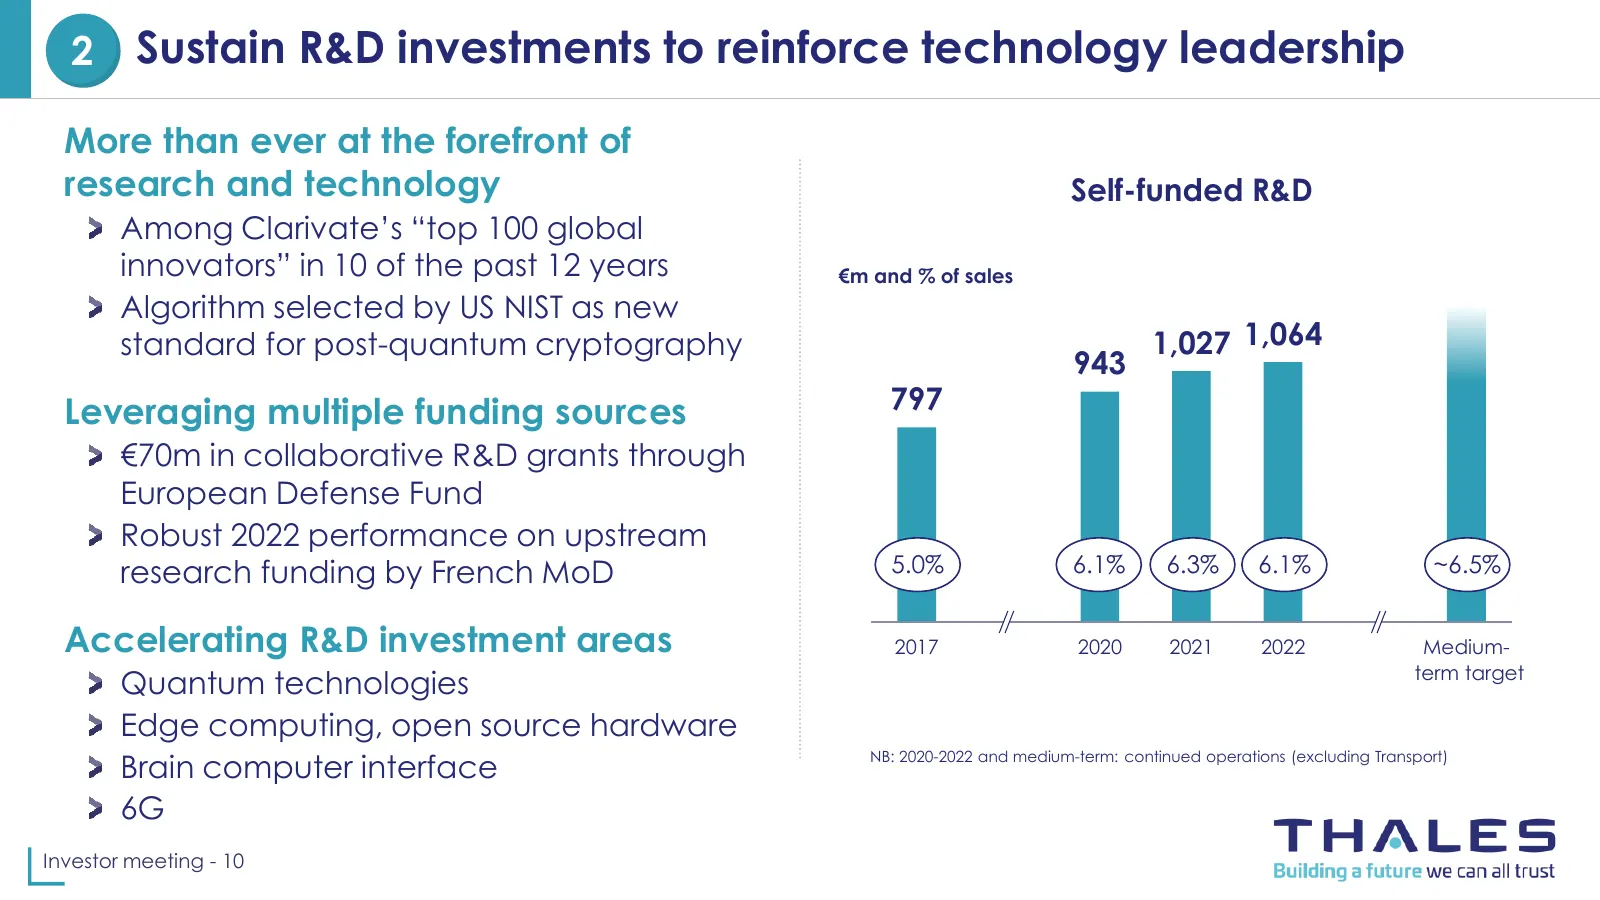
2 Sustain R&D investments to reinforce technology leadership More than ever at the forefront of research and technology Self-funded R&D Among Clarivate’s “top 100 global innovators” in 10 of the past 12 years €m and % of sales Algorithm selected by US NIST as new standard for post-quantum cryptograp
Slide 11: Take our sustainability performance to the next level
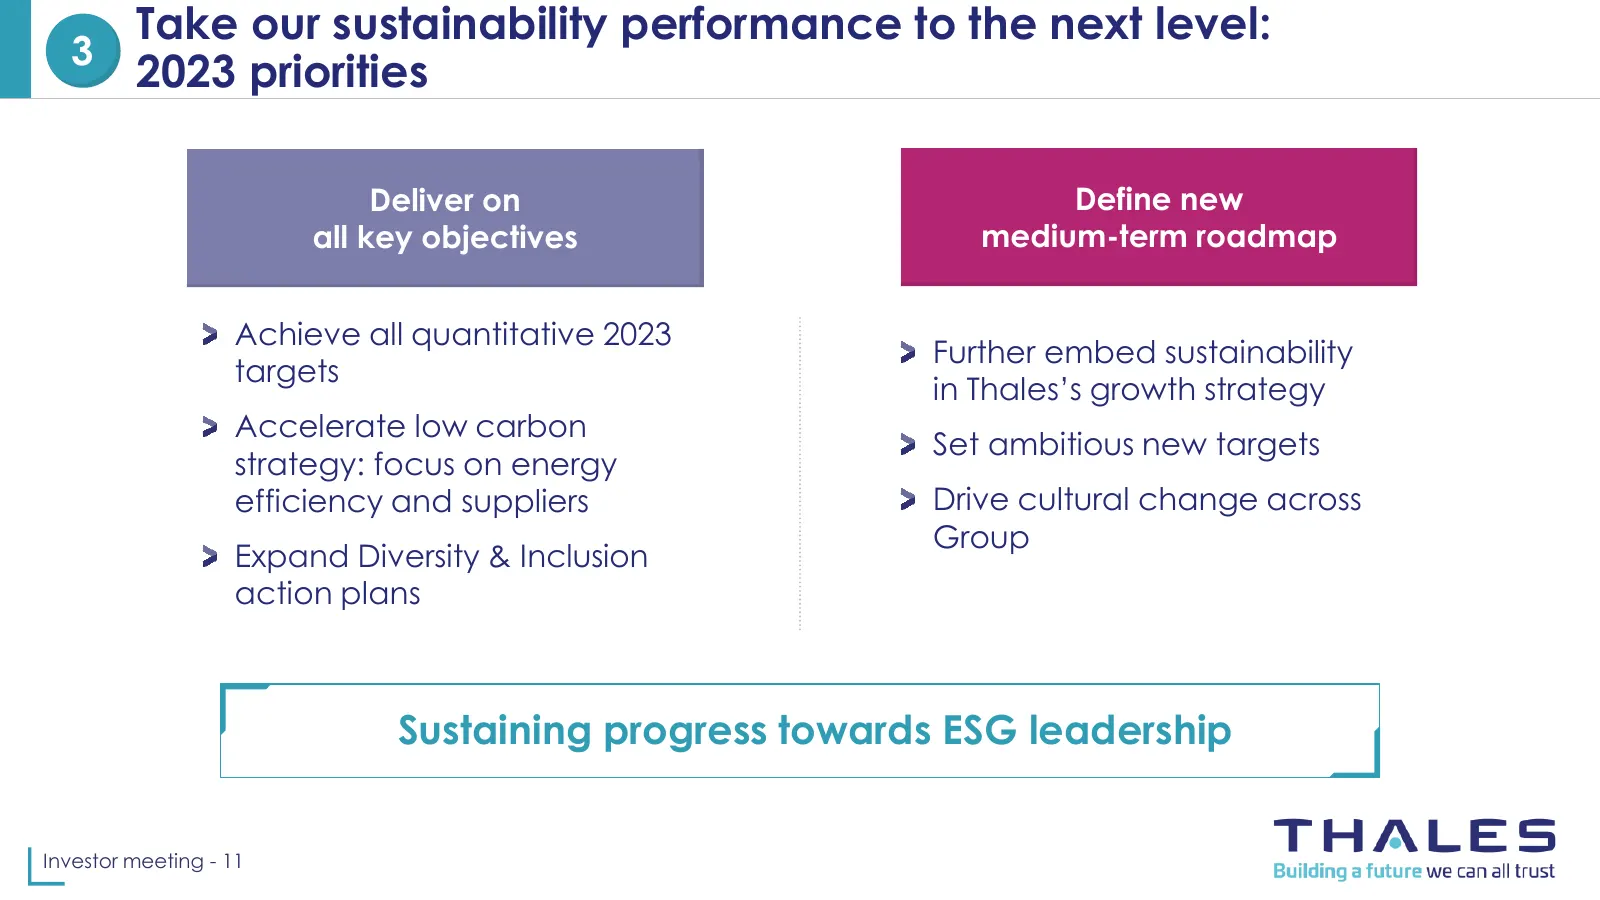
Take our sustainability performance to the next level: 3 2023 priorities Deliver on Define new all key objectives medium-term roadmap Achieve all quantitative 2023 Further embed sustainability targets in Thales’s growth strategy Accelerate low carbon Set ambitious new targets strategy: focus on ener
Slide 12: Leverage consistently high cash generation
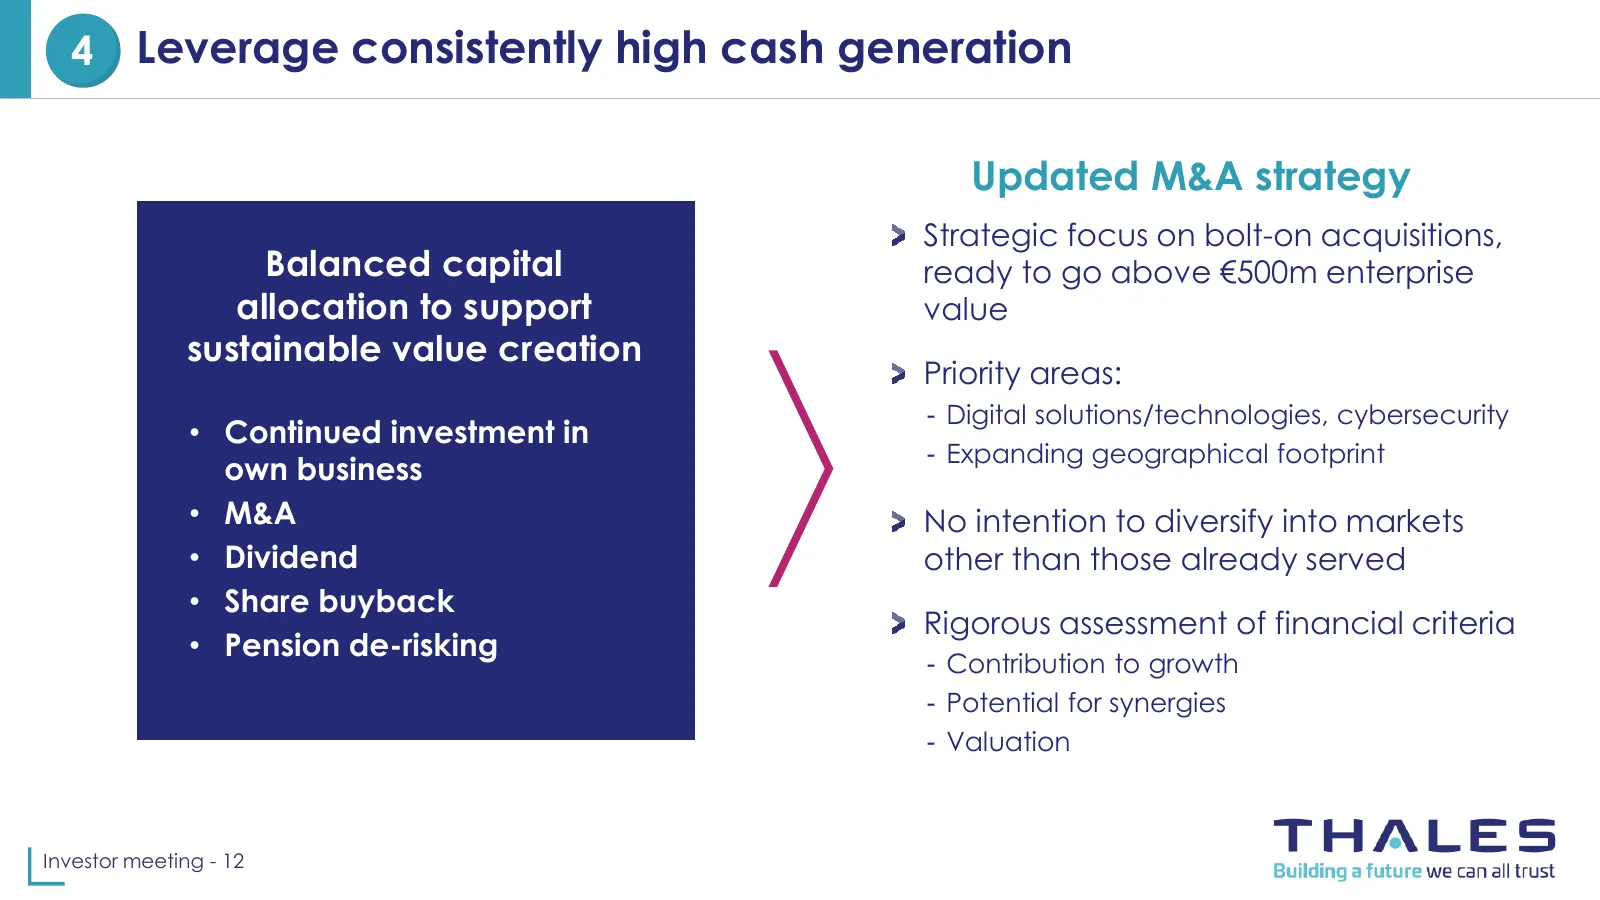
4 Leverage consistently high cash generation Updated M&A strategy Strategic focus on bolt-on acquisitions, Balanced capital ready to go above €500m enterprise allocation to support value sustainable value creation Priority areas: - Digital solutions/technologies, cybersecurity • Continued investment
Slide 13: Cybersecurity: selective M&A to support global leadership
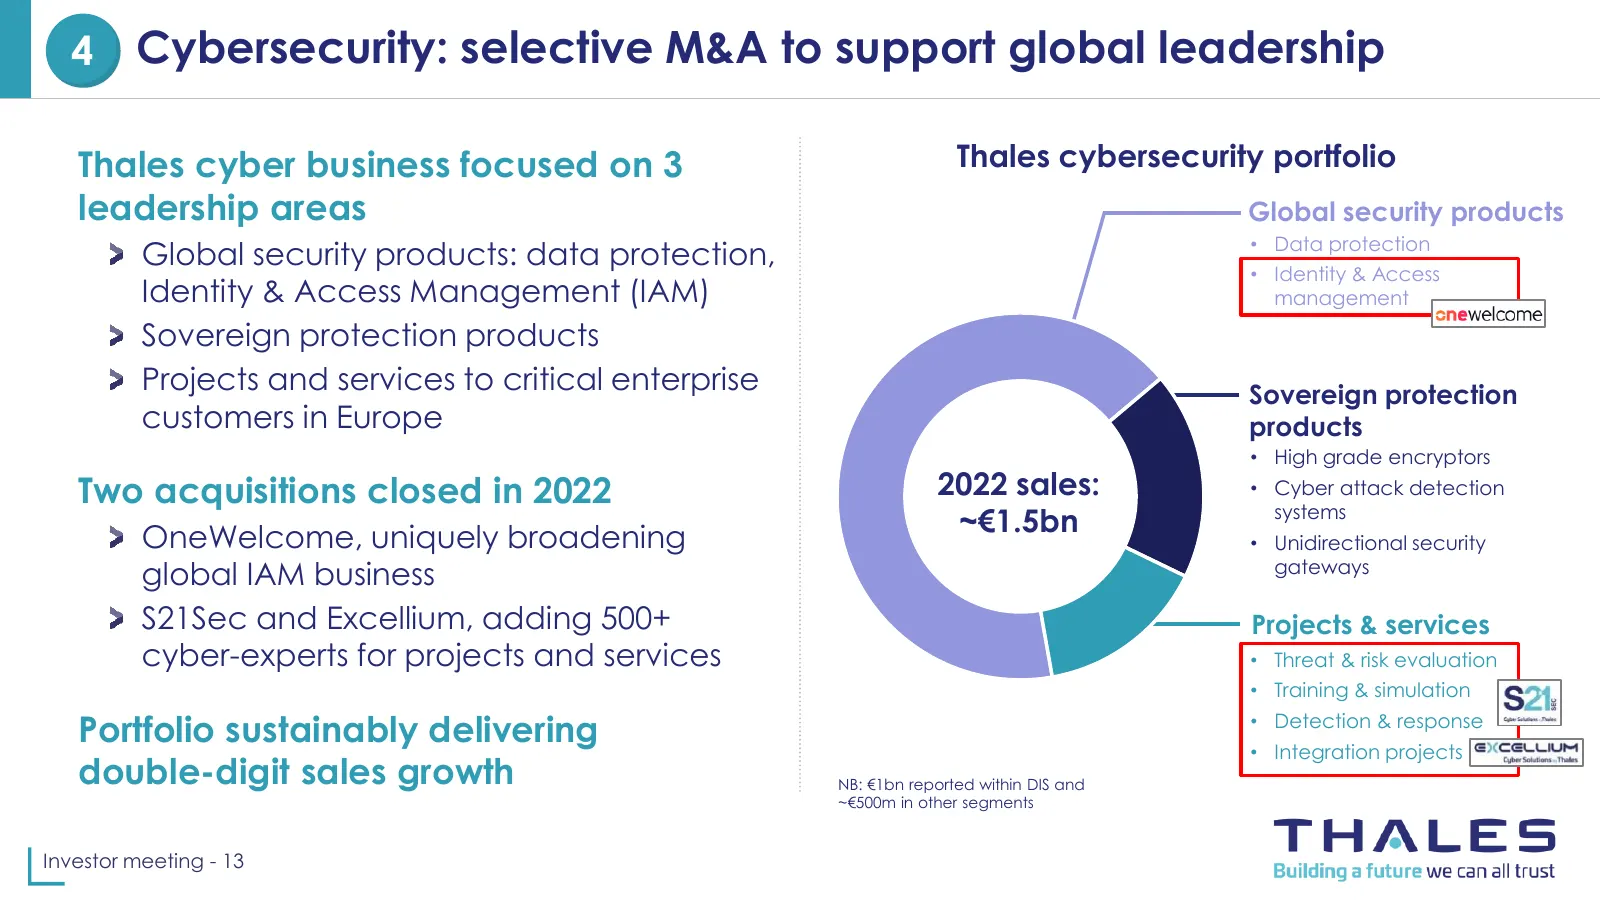
4 Cybersecurity: selective M&A to support global leadership Thales cyber business focused on 3 Thales cybersecurity portfolio leadership areas Global security products • Data protection Global security products: data protection, • Identity & Access Identity & Access Management (IAM) management Sover
Slide 14: Outlook
Introduction to Thales Key priorities Outlook Sustainability: safer, greener, more inclusive Full-Year 2022 results www.thalesgroup.com
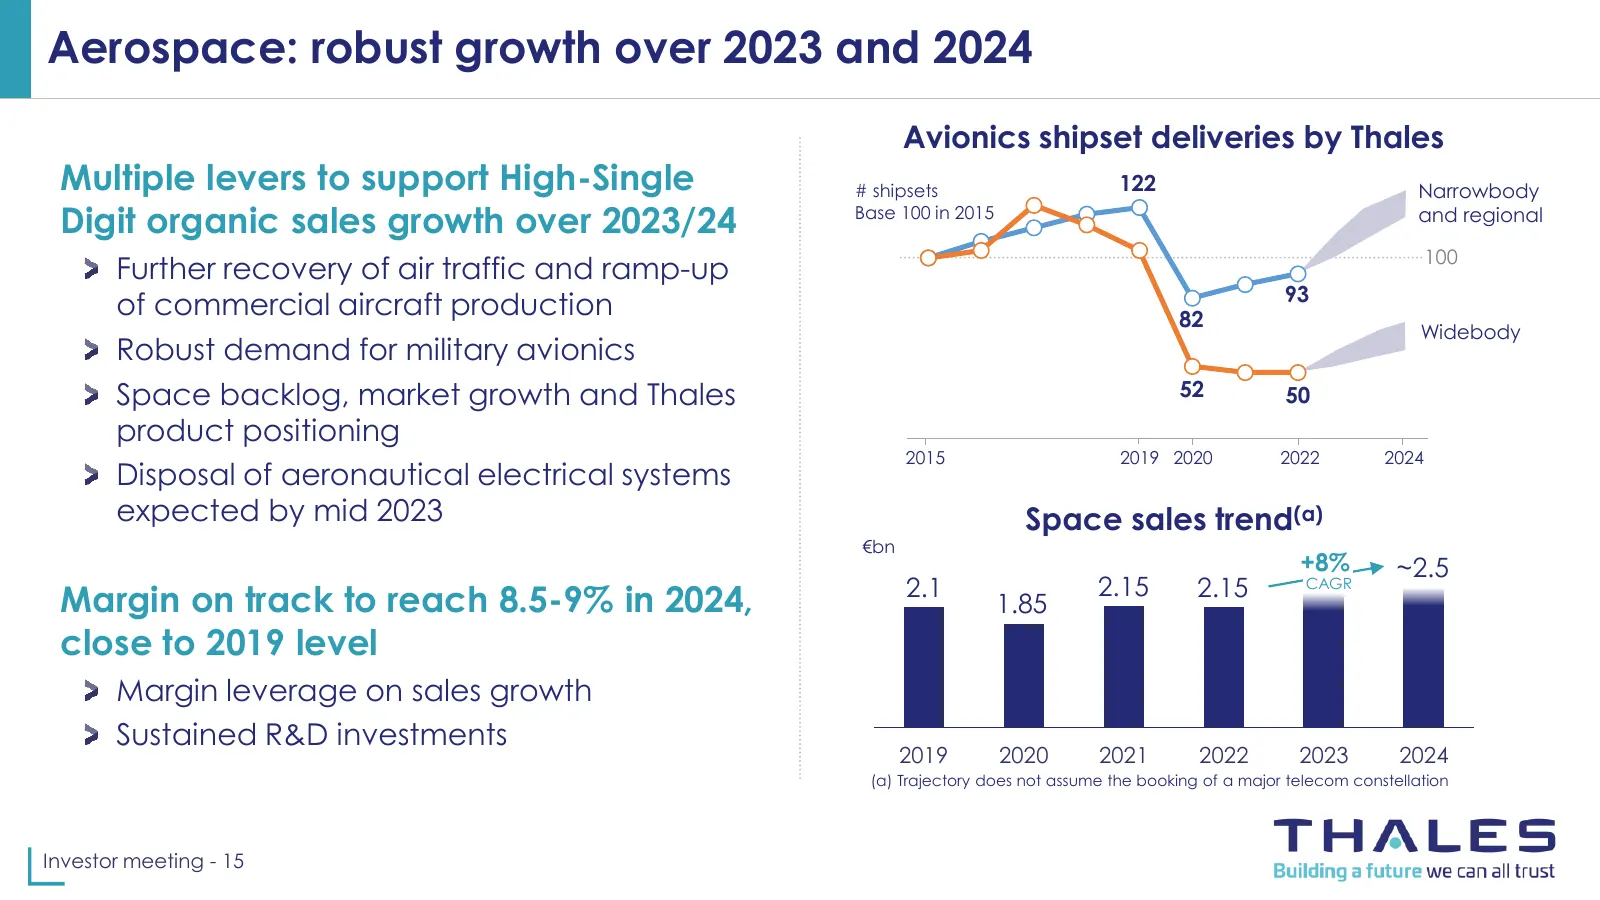
Slide 15: Aerospace: robust growth over 2023 and 2024
Aerospace: robust growth over 2023 and 2024 Avionics shipset deliveries by Thales Multiple levers to support High-Single # shipsets 122 Narrowbody Digit organic sales growth over 2023/24 Base 100 in 2015 and regional 100 Further recovery of air traffic and ramp-up 93 of commercial aircraft productio
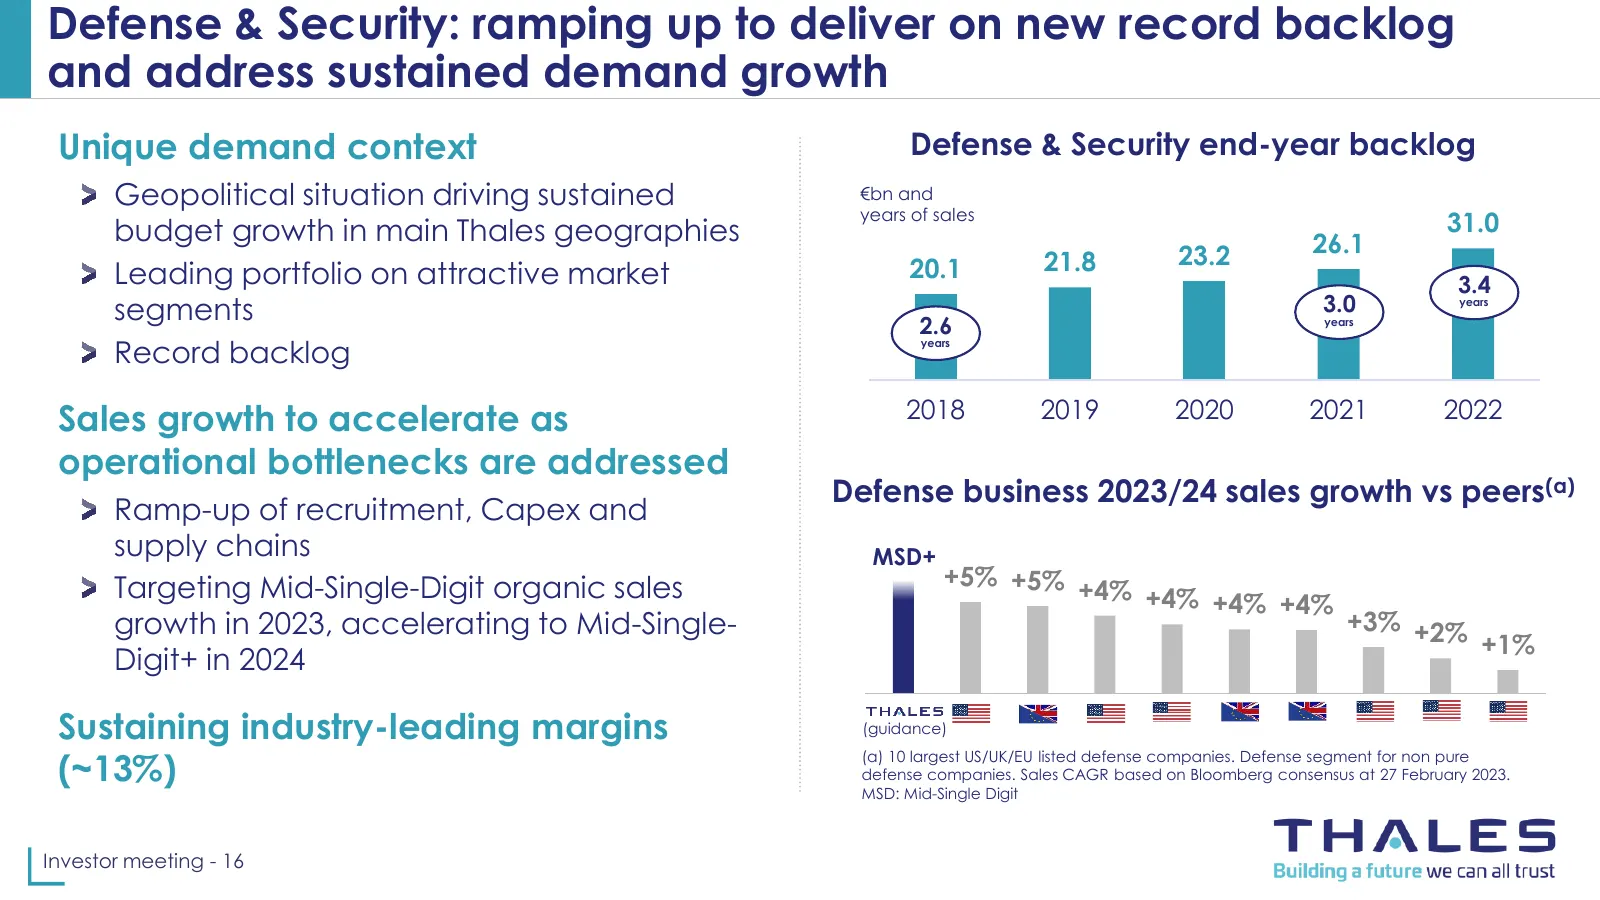
Slide 16: Defense & Security: ramping up to deliver on new record backlog
Defense & Security: ramping up to deliver on new record backlog and address sustained demand growth Unique demand context Defense & Security end-year backlog Geopolitical situation driving sustained €bn and years of sales budget growth in main Thales geographies 31.0 23.2 26.1 Leading portfolio on a
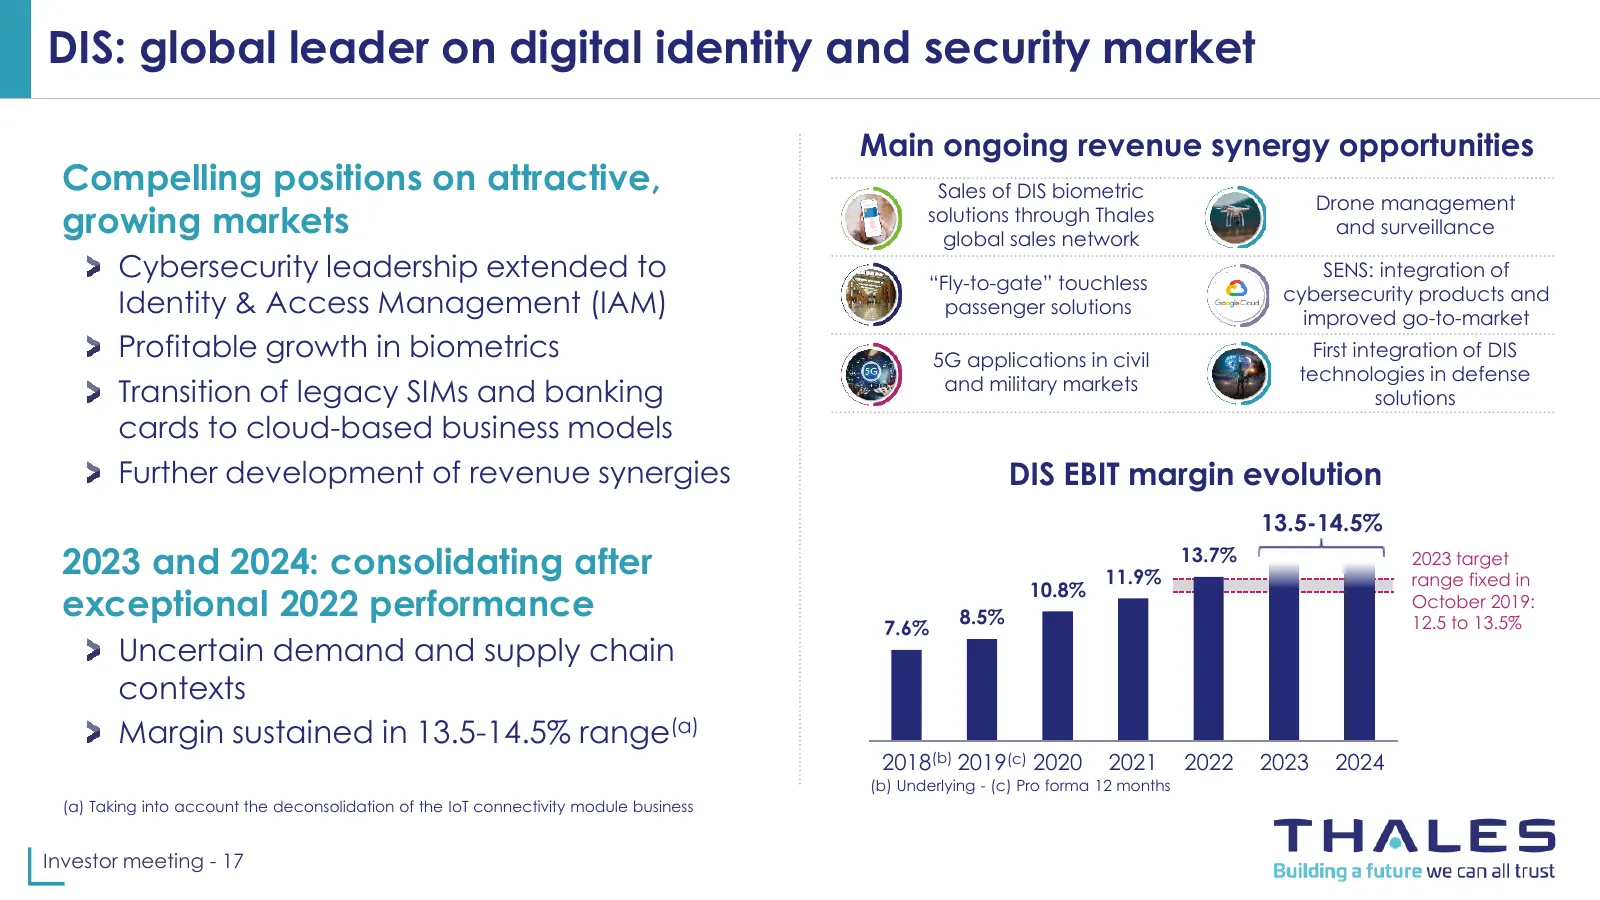
Slide 17: DIS: global leader on digital identity and security market
DIS: global leader on digital identity and security market Main ongoing revenue synergy opportunities Compelling positions on attractive, Sales of DIS biometric Drone management growing markets solutions through Thales global sales network and surveillance Cybersecurity leadership extended to “Fly-t
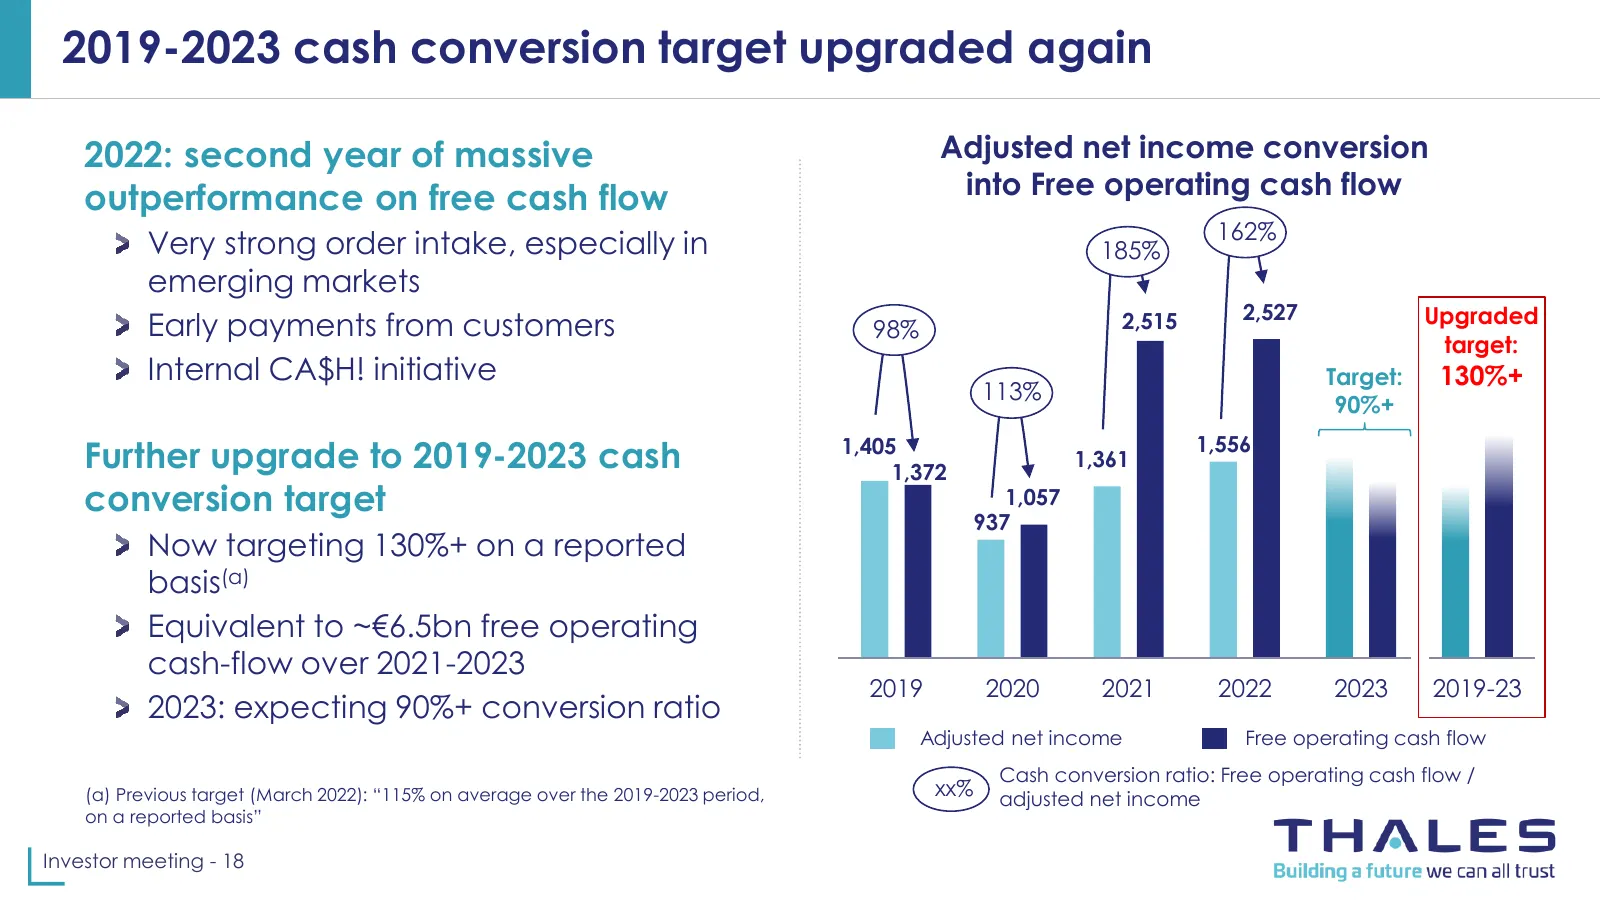
Slide 18: 2019-2023 cash conversion target upgraded again
2019-2023 cash conversion target upgraded again 2022: second year of massive Adjusted net income conversion outperformance on free cash flow into Free operating cash flow 162% Very strong order intake, especially in 185% emerging markets 2,527 Upgraded Early payments from customers 98% 2,515 target:
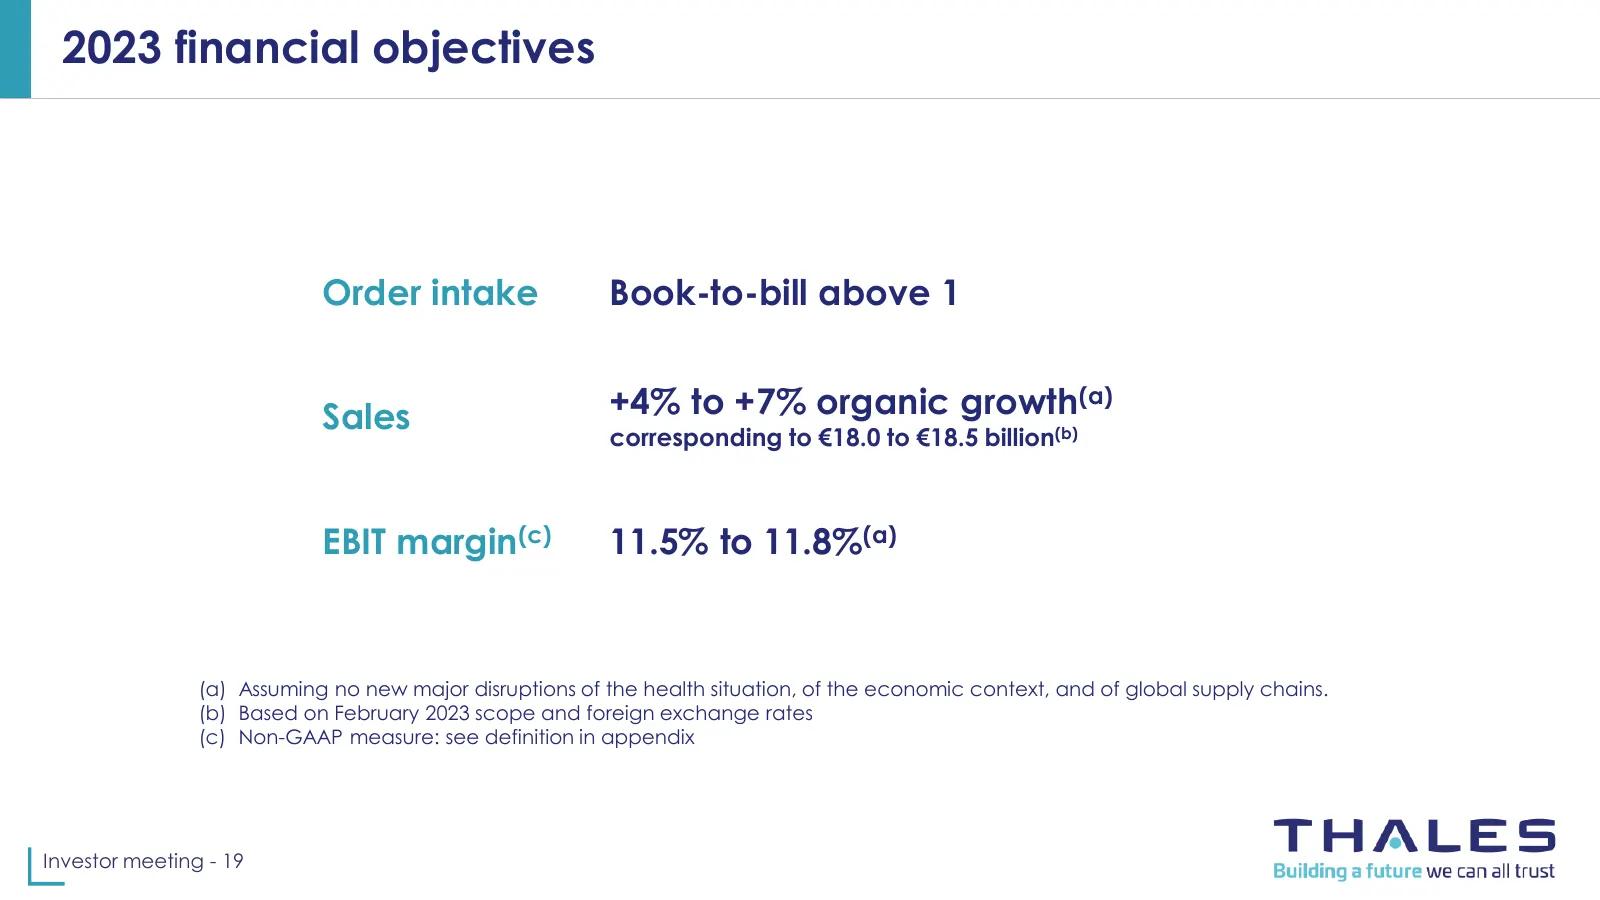
Slide 19: 2023 financial objectives
2023 financial objectives Order intake Book-to-bill above 1 Sales +4% to +7% organic growth(a) corresponding to €18.0 to €18.5 billion(b) EBIT margin(c) 11.5% to 11.8%(a) (a) Assuming no new major disruptions of the health situation, of the economic context, and of global supply chains. (b) Based on
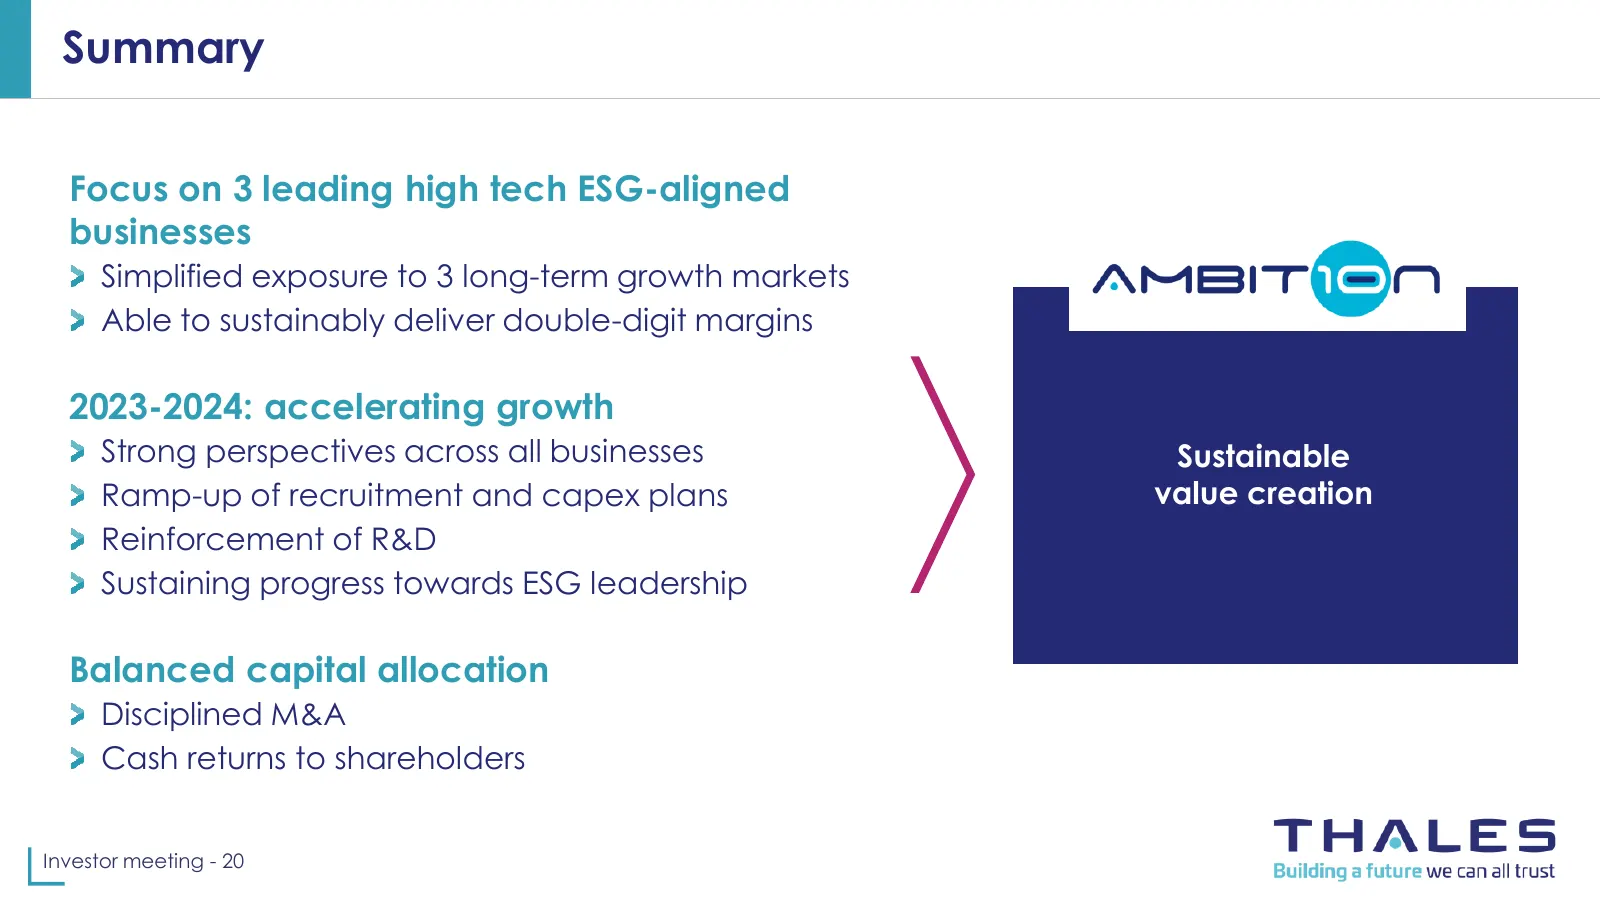
Slide 20: Summary
Summary Focus on 3 leading high tech ESG-aligned businesses Simplified exposure to 3 long-term growth markets Able to sustainably deliver double-digit margins 2023-2024: accelerating growth Strong perspectives across all businesses Sustainable Ramp-up of recruitment and capex plans value creation Re
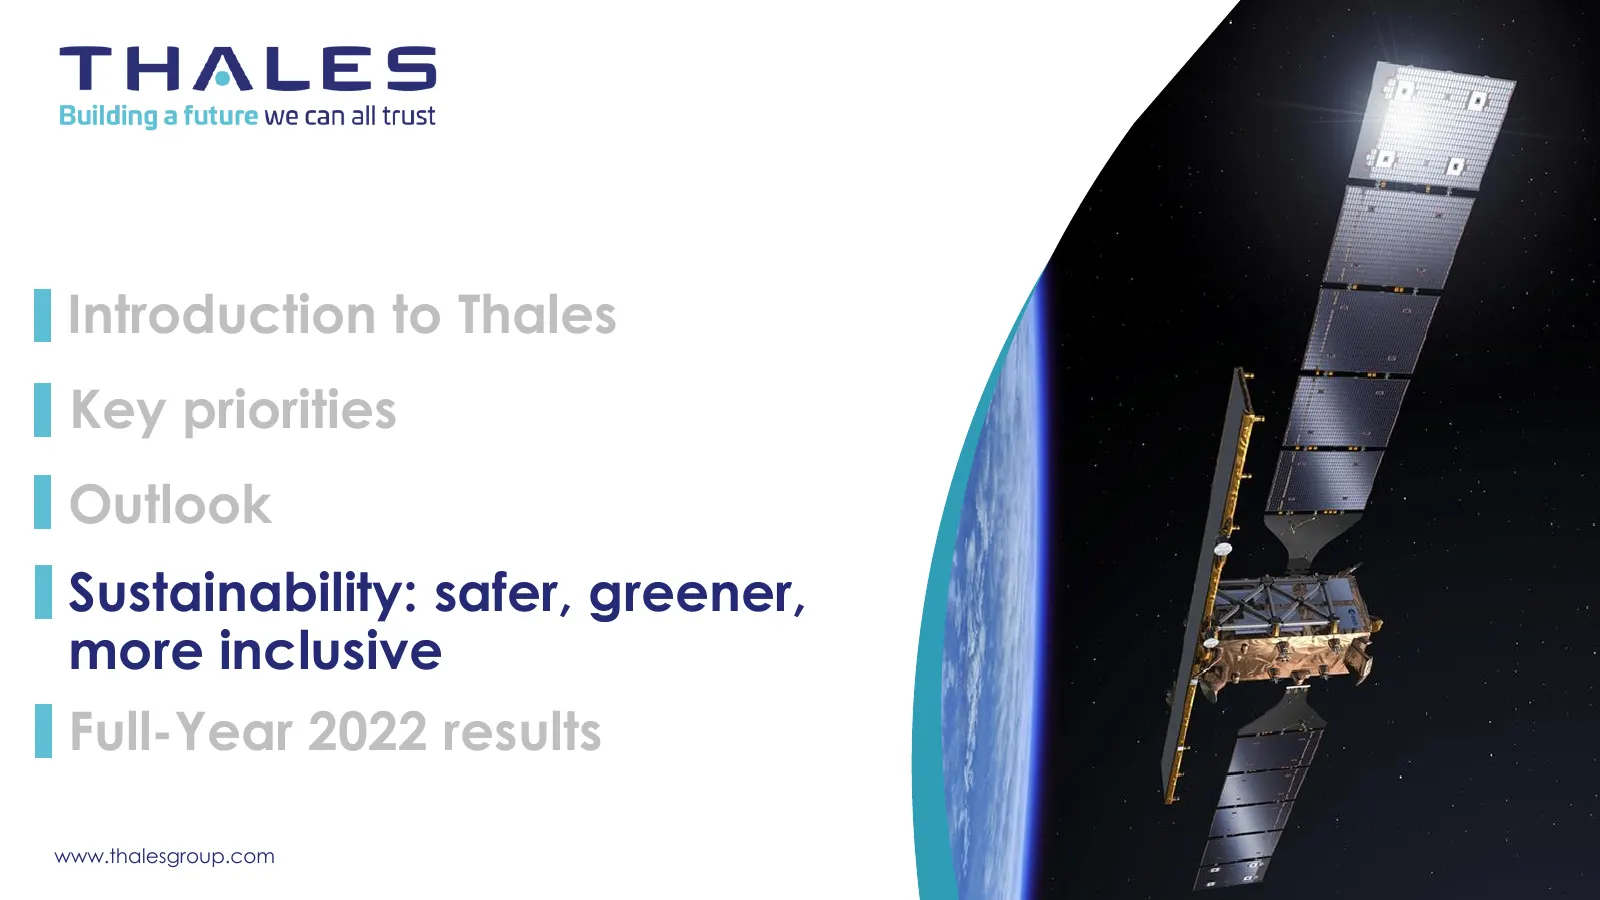
Slide 21: Sustainability: safer, greener, more inclusive
Introduction to Thales Key priorities Outlook Sustainability: safer, greener, more inclusive Full-Year 2022 results www.thalesgroup.com
Slide 22: Sustainability ambitions anchored in our purpose
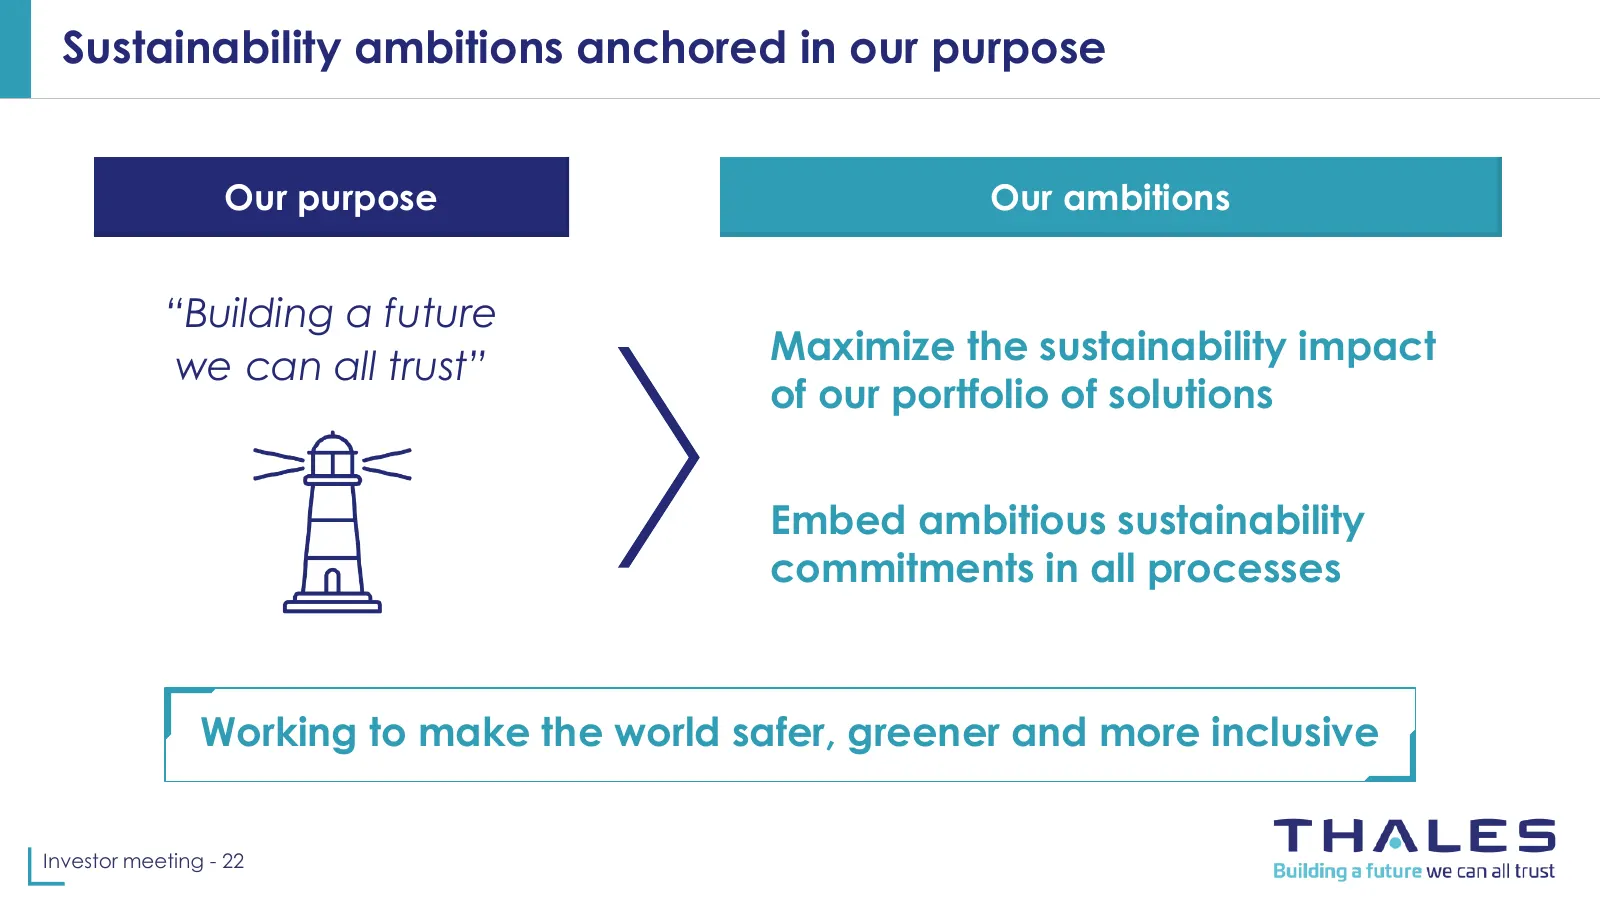
Sustainability ambitions anchored in our purpose Our purpose Our ambitions “Building a future we can all trust” Maximize the sustainability impact of our portfolio of solutions Embed ambitious sustainability commitments in all processes Working to make the world safer, greener and more inclusive Inv
Slide 23: Sustaining progress towards ESG leadership
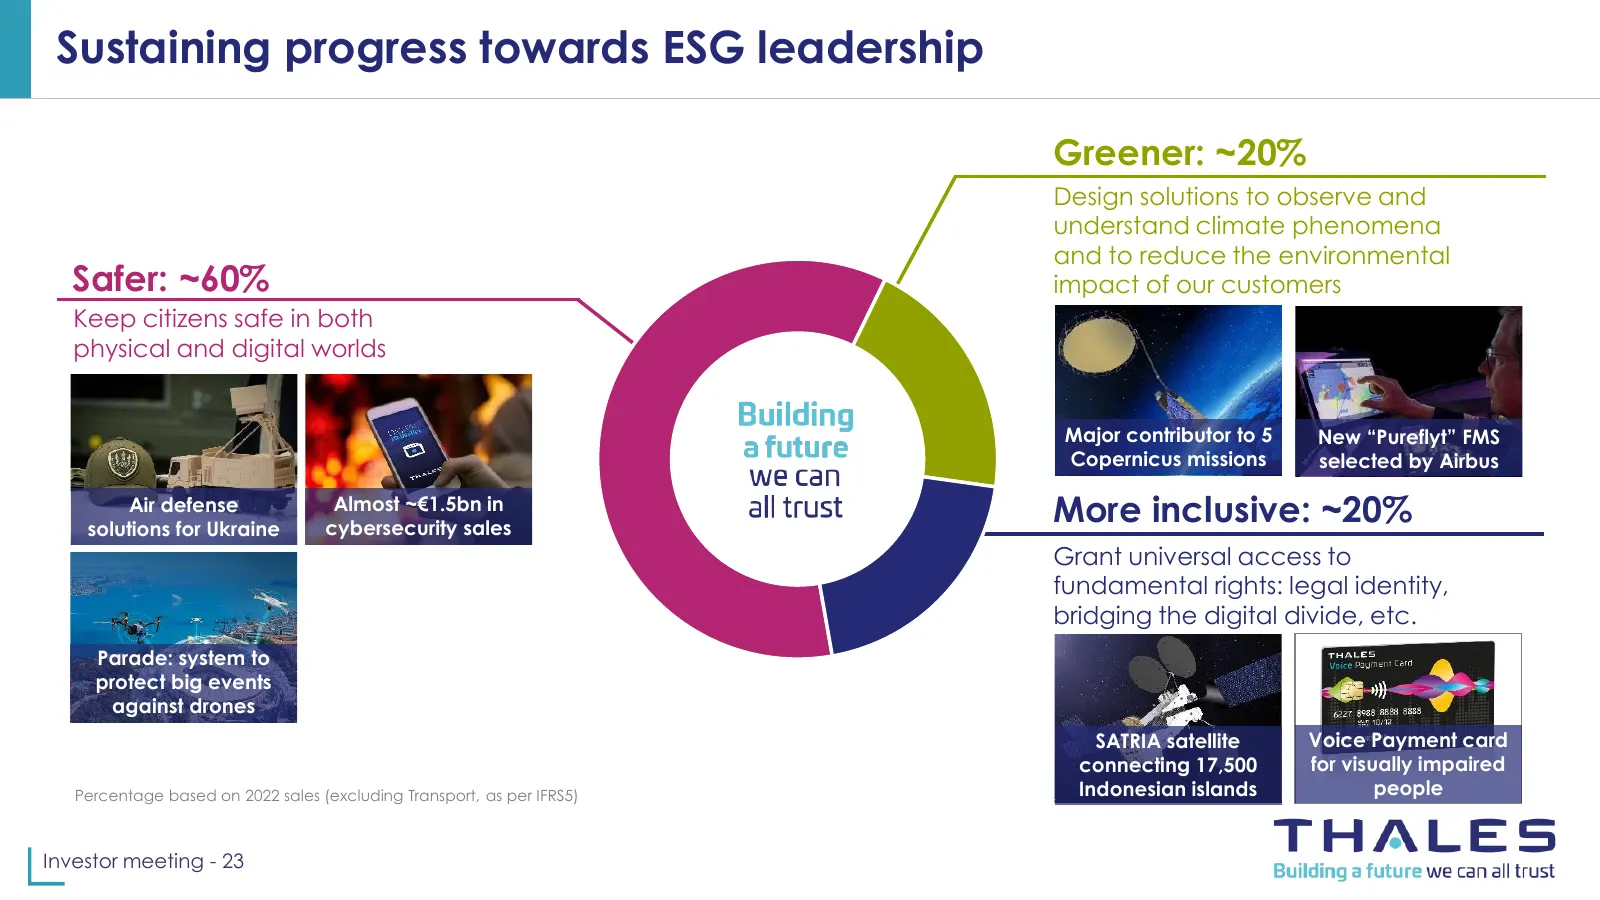
Sustaining progress towards ESG leadership Greener: ~20% Design solutions to observe and understand climate phenomena and to reduce the environmental Safer: ~60% impact of our customers Keep citizens safe in both physical and digital worlds Major contributor to 5 New “Pureflyt” FMS Copernicus missio
Slide 24: Sustainability: a strong space market growth driver, notably in Europe
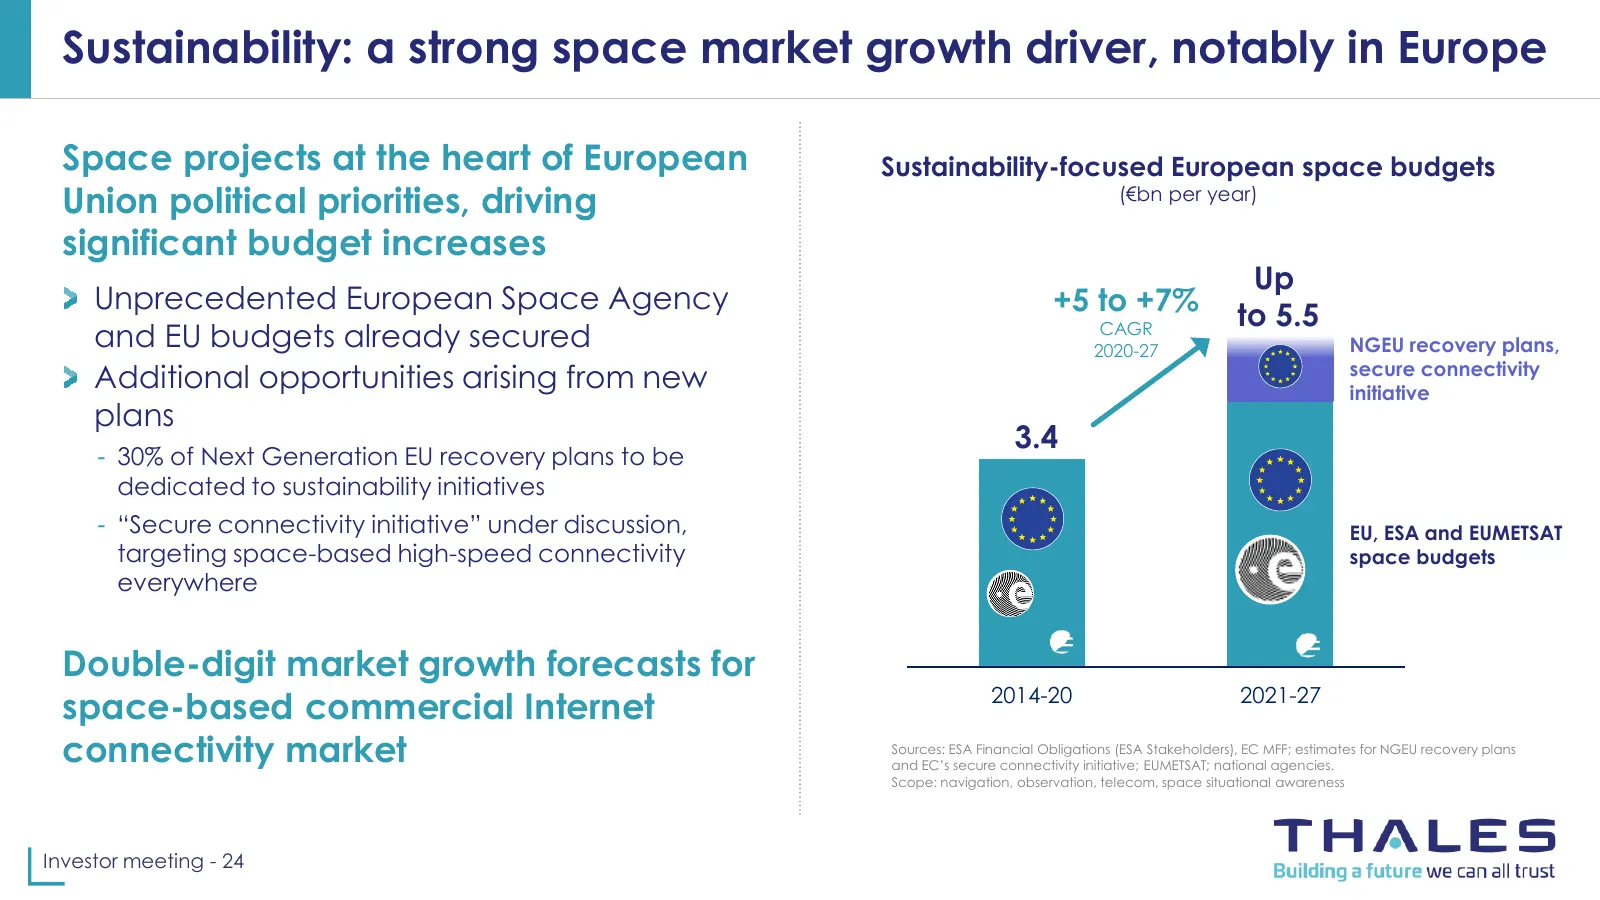
Sustainability: a strong space market growth driver, notably in Europe Space projects at the heart of European Sustainability-focused European space budgets Union political priorities, driving (€bn per year) significant budget increases Up Unprecedented European Space Agency +5 to +7% to 5.5 and EU
Slide 25: Optimization of aircraft operations: a major CO2 reduction opportunity for aviation
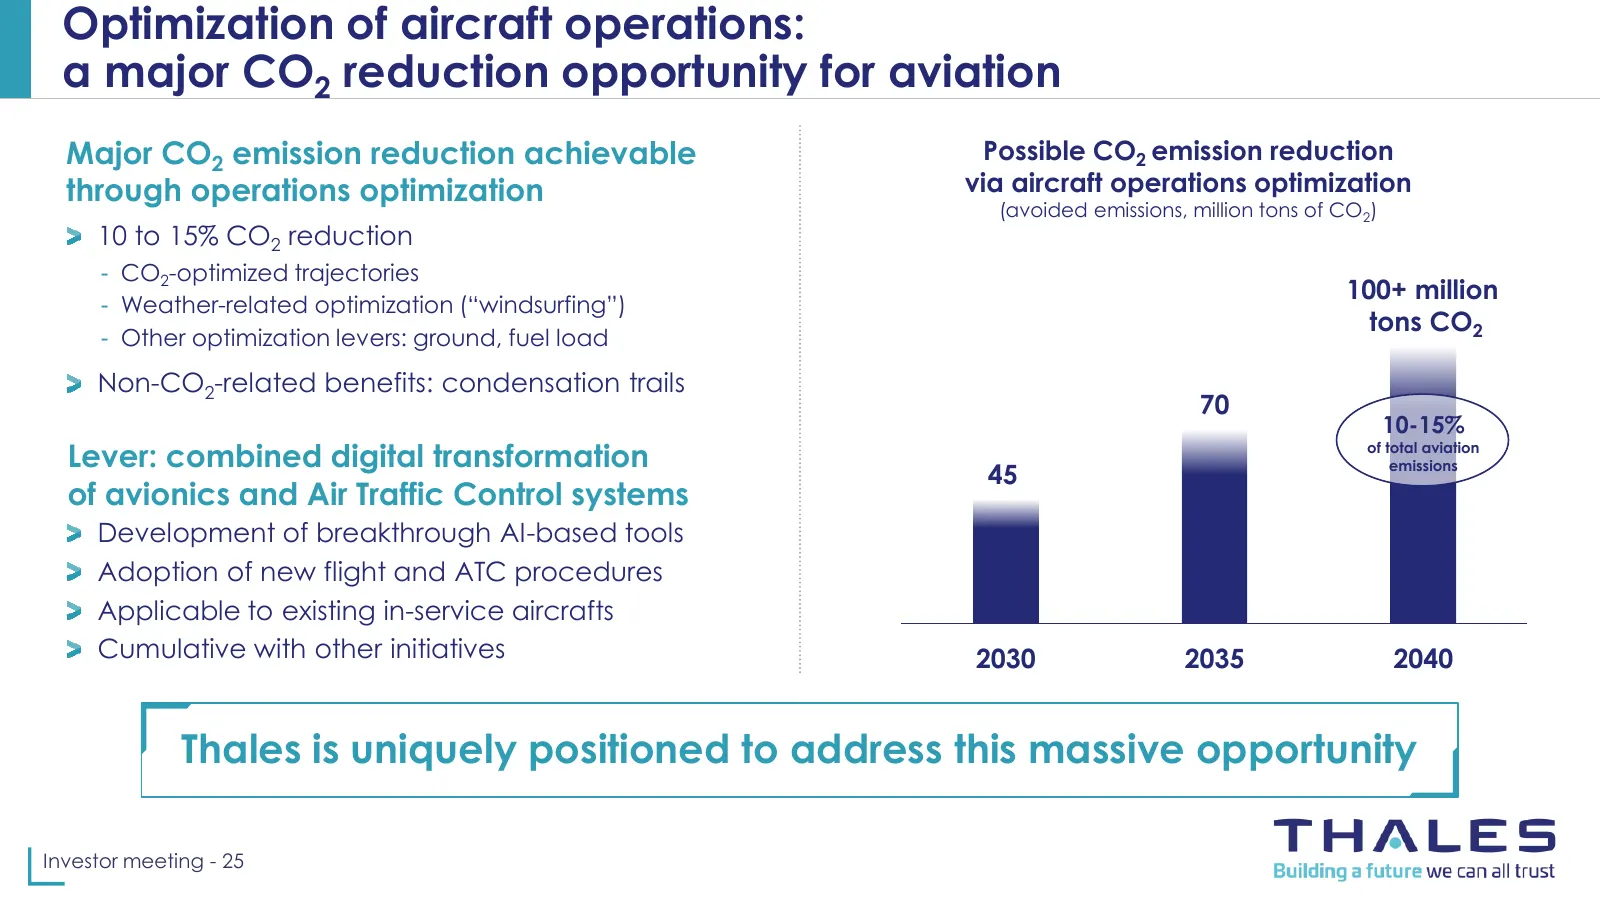
Optimization of aircraft operations: a major CO2 reduction opportunity for aviation Major CO2 emission reduction achievable Possible CO2 emission reduction through operations optimization via aircraft operations optimization (avoided emissions, million tons of CO2) 10 to 15% CO2 reduction - CO2-opti
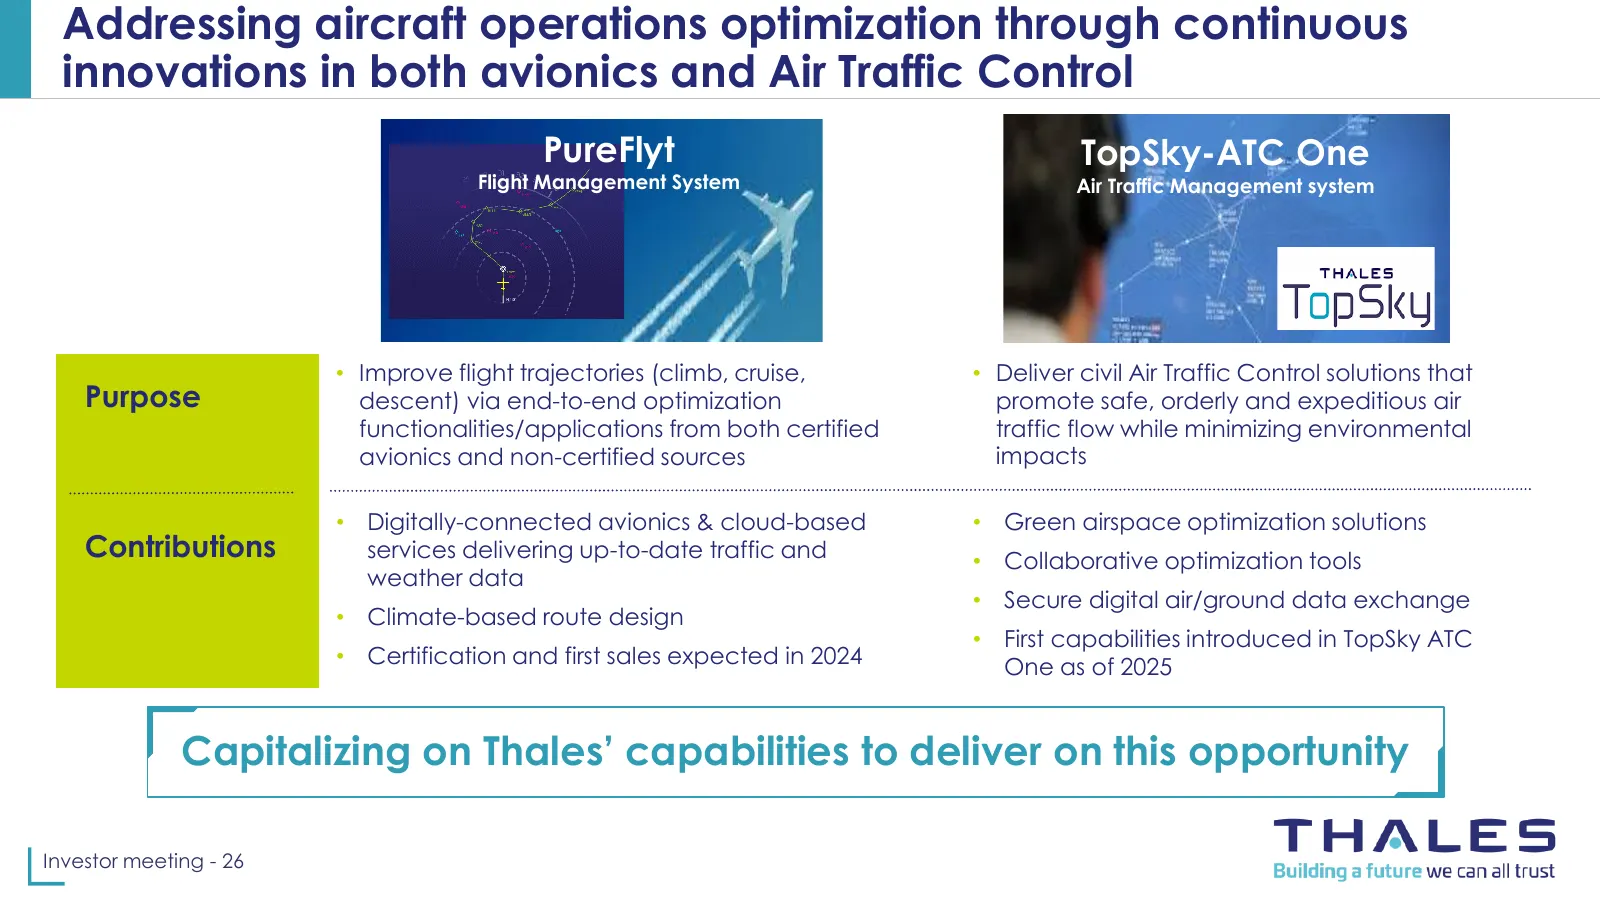
Slide 26: Aircraft operations optimization through innovations in avionics and Air Traffic Control
Addressing aircraft operations optimization through continuous innovations in both avionics and Air Traffic Control PureFlyt Redesign of A320 rudder control system TopSky-ATC TopSky-ATC One One Flight Management System Air Traffic Air Traffic Management Management system Syste • Improve flight traje
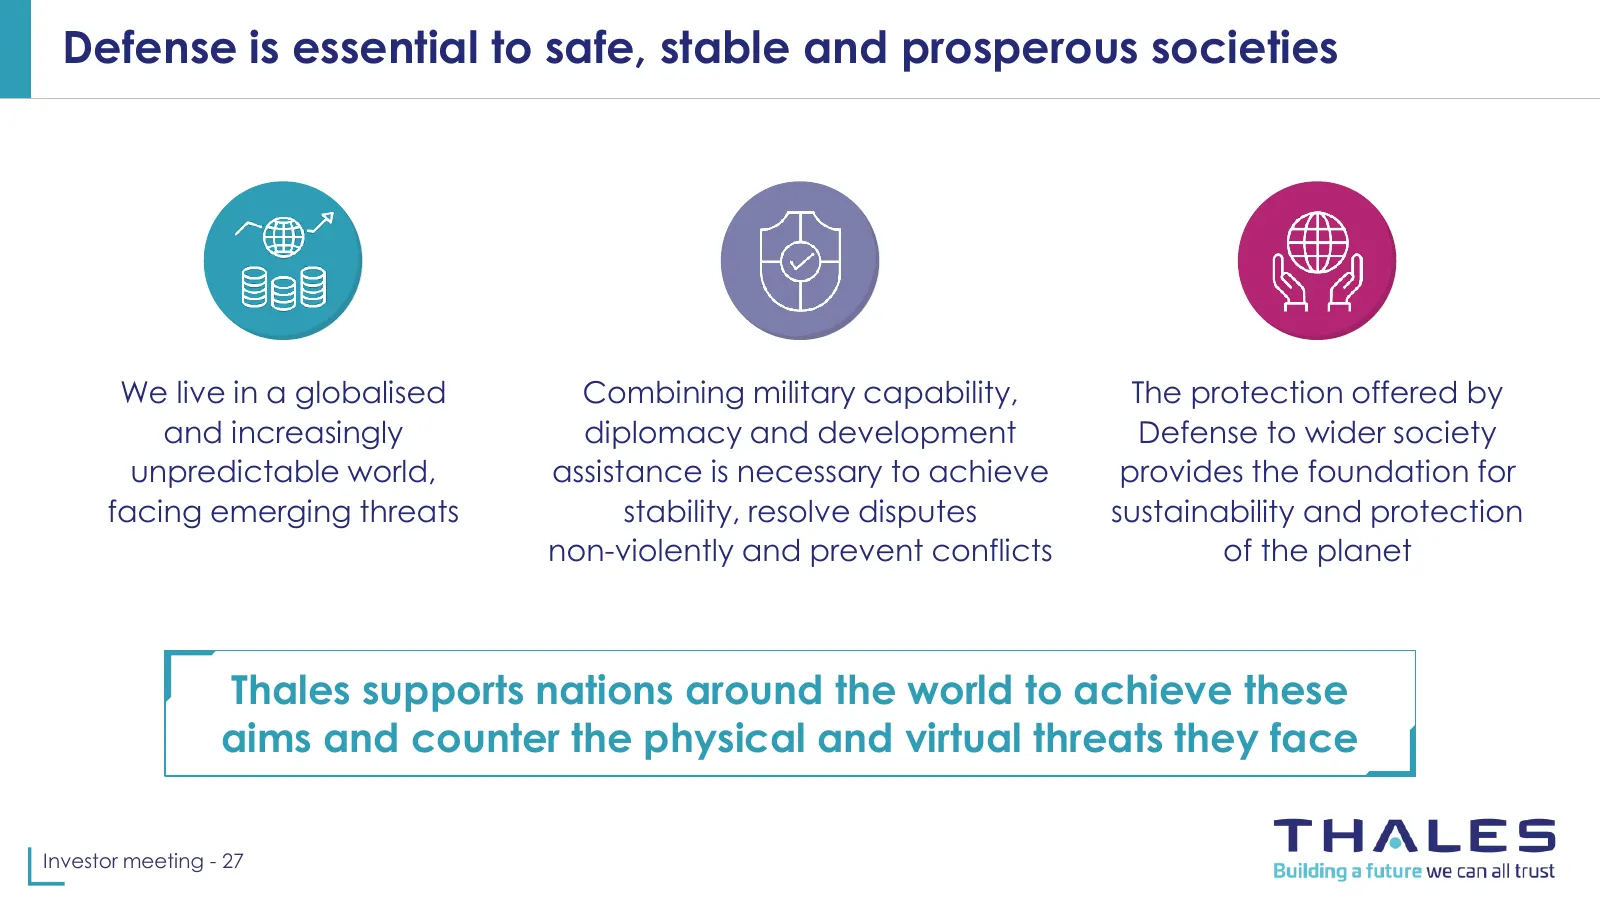
Slide 27: Defense is essential to safe, stable and prosperous societies
Defense is essential to safe, stable and prosperous societies We live in a globalised Combining military capability, The protection offered by and increasingly diplomacy and development Defense to wider society unpredictable world, assistance is necessary to achieve provides the foundation for facin
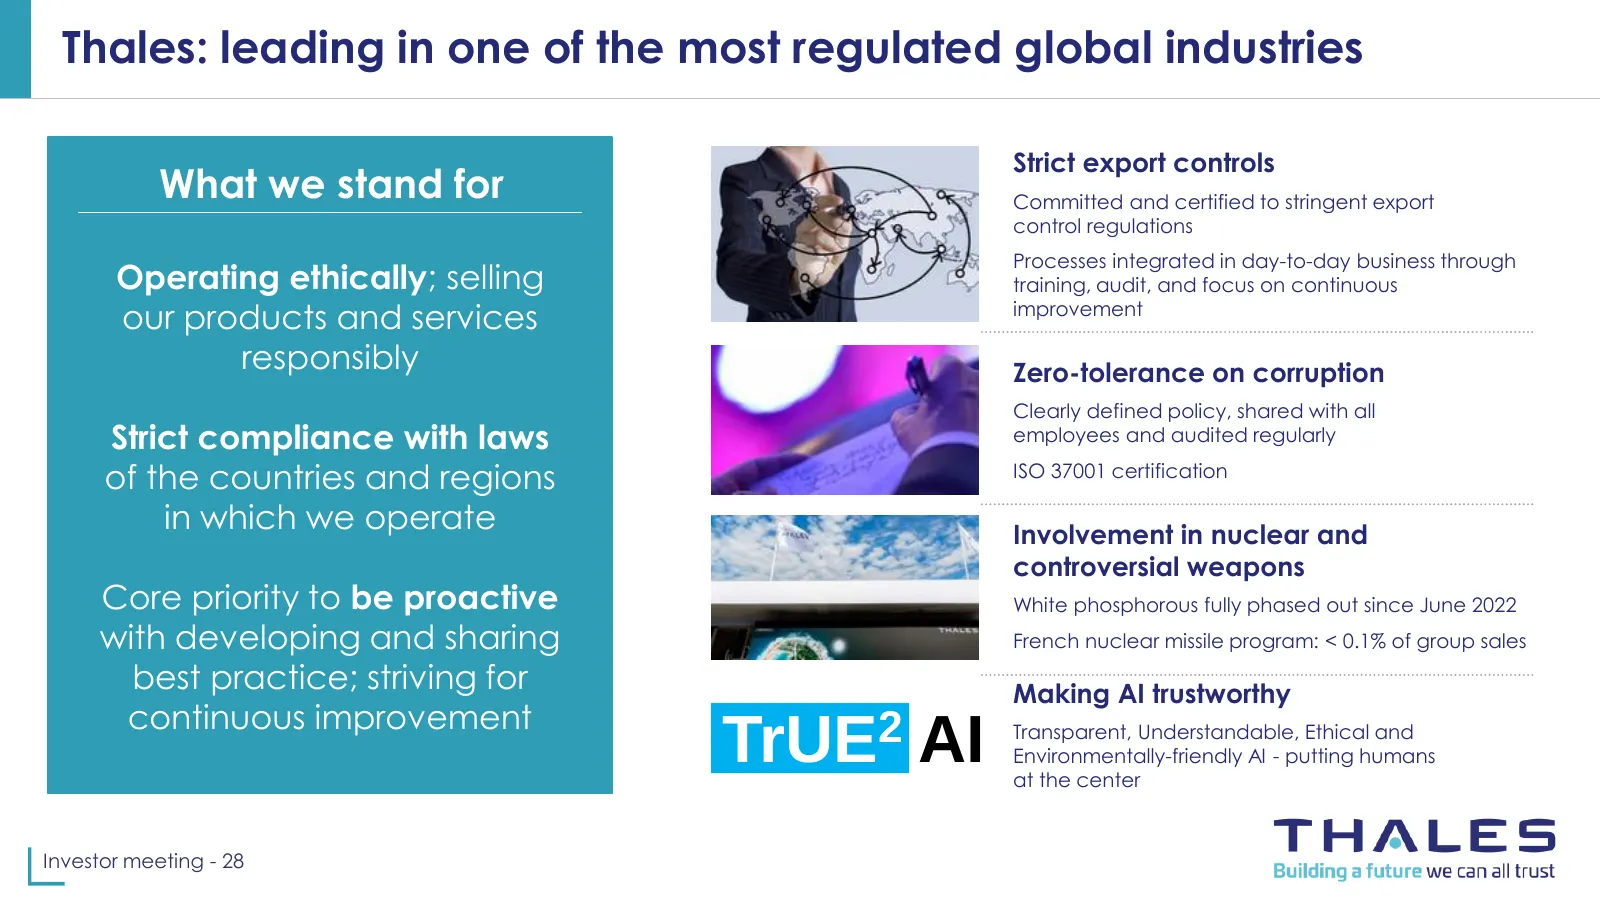
Slide 28: Thales: leading in one of the most regulated global industries
Thales: leading in one of the most regulated global industries Strict export controls What we stand for Committed and certified to stringent export control regulations Processes integrated in day-to-day business through Operating ethically; selling training, audit, and focus on continuous our produc
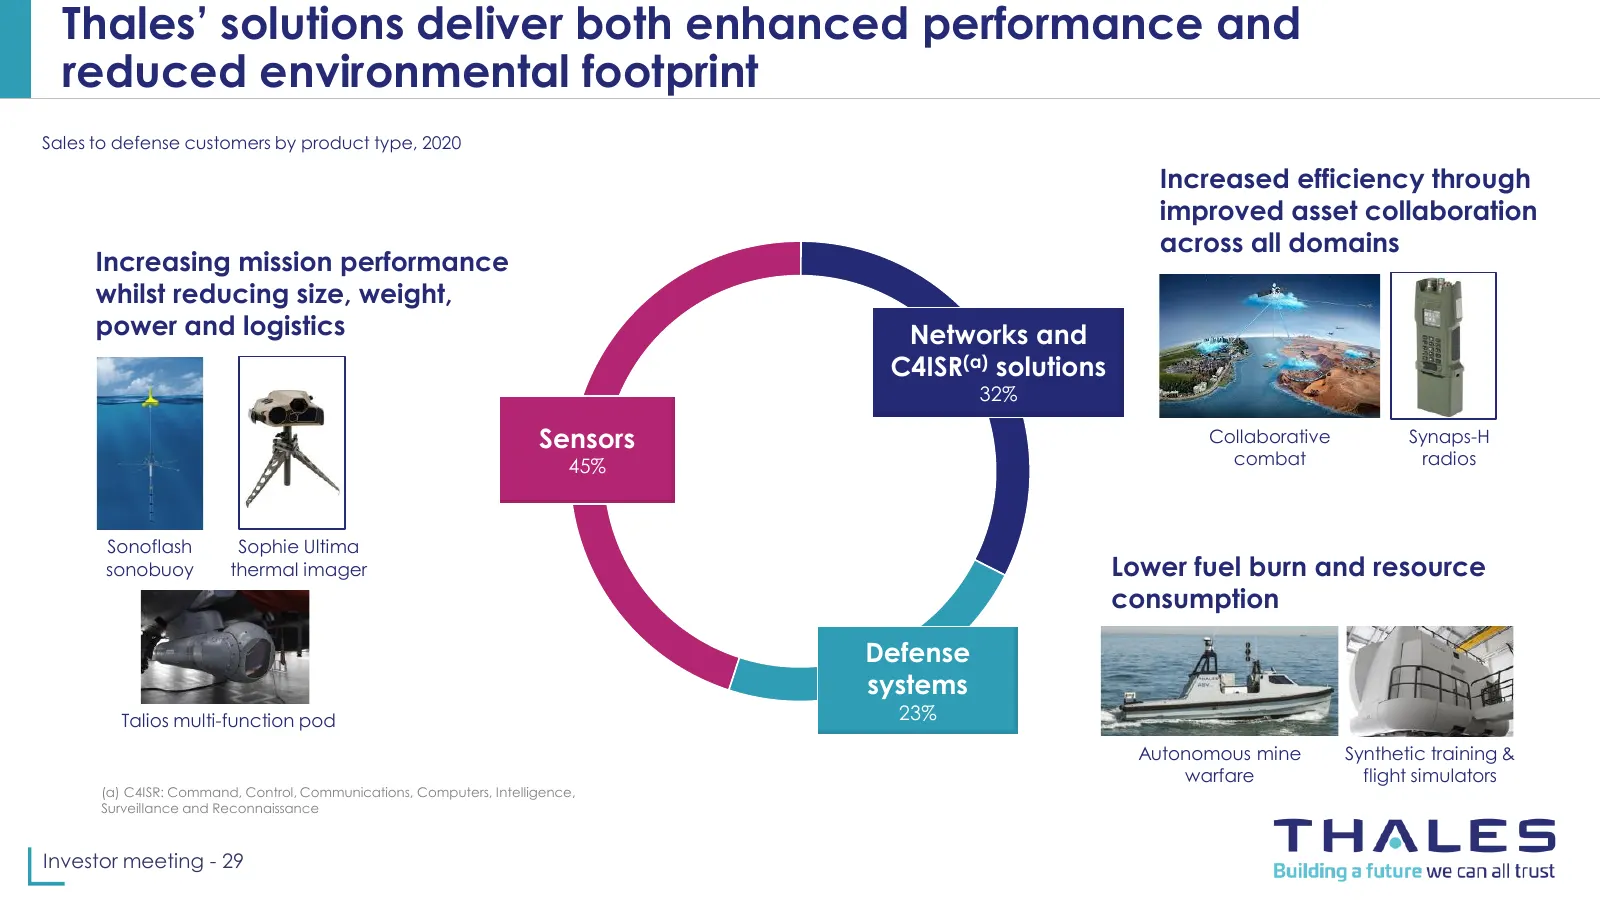
Slide 29: Thales' solutions deliver enhanced performance and reduced environmental footprint
Thales’ solutions deliver both enhanced performance and reduced environmental footprint Sales to defense customers by product type, 2020 Increased efficiency through improved asset collaboration across all domains Increasing mission performance whilst reducing size, weight, power and logistics Netwo
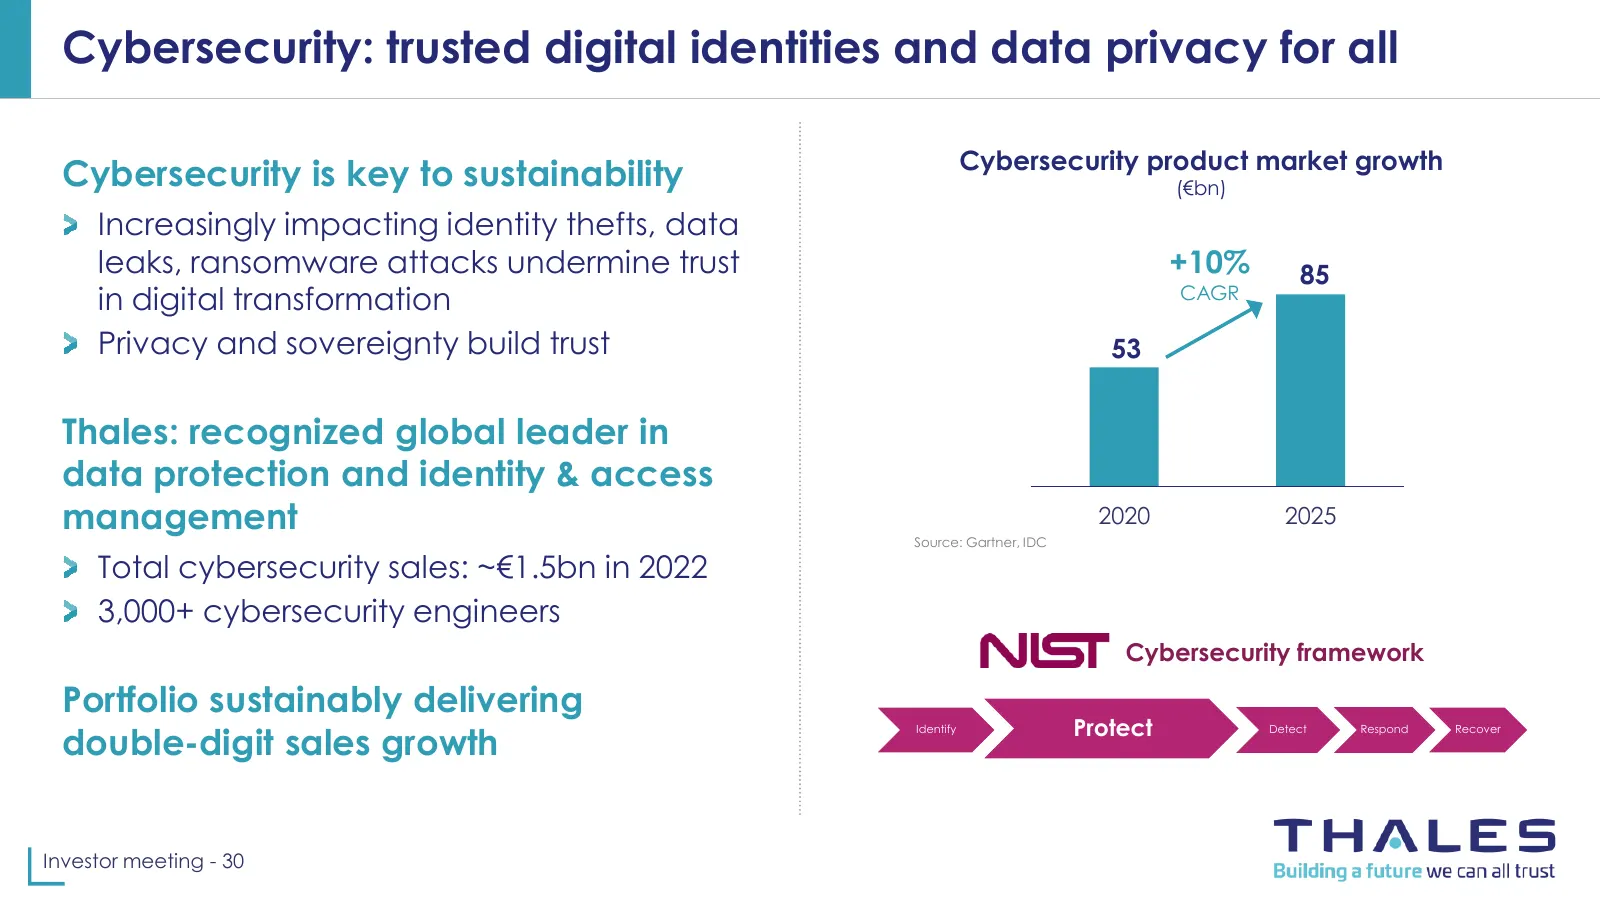
Slide 30: Cybersecurity: trusted digital identities and data privacy for all
Cybersecurity: trusted digital identities and data privacy for all Cybersecurity product market growth Cybersecurity is key to sustainability (€bn) Increasingly impacting identity thefts, data leaks, ransomware attacks undermine trust +10% 85 in digital transformation CAGR Privacy and sovereignty bu
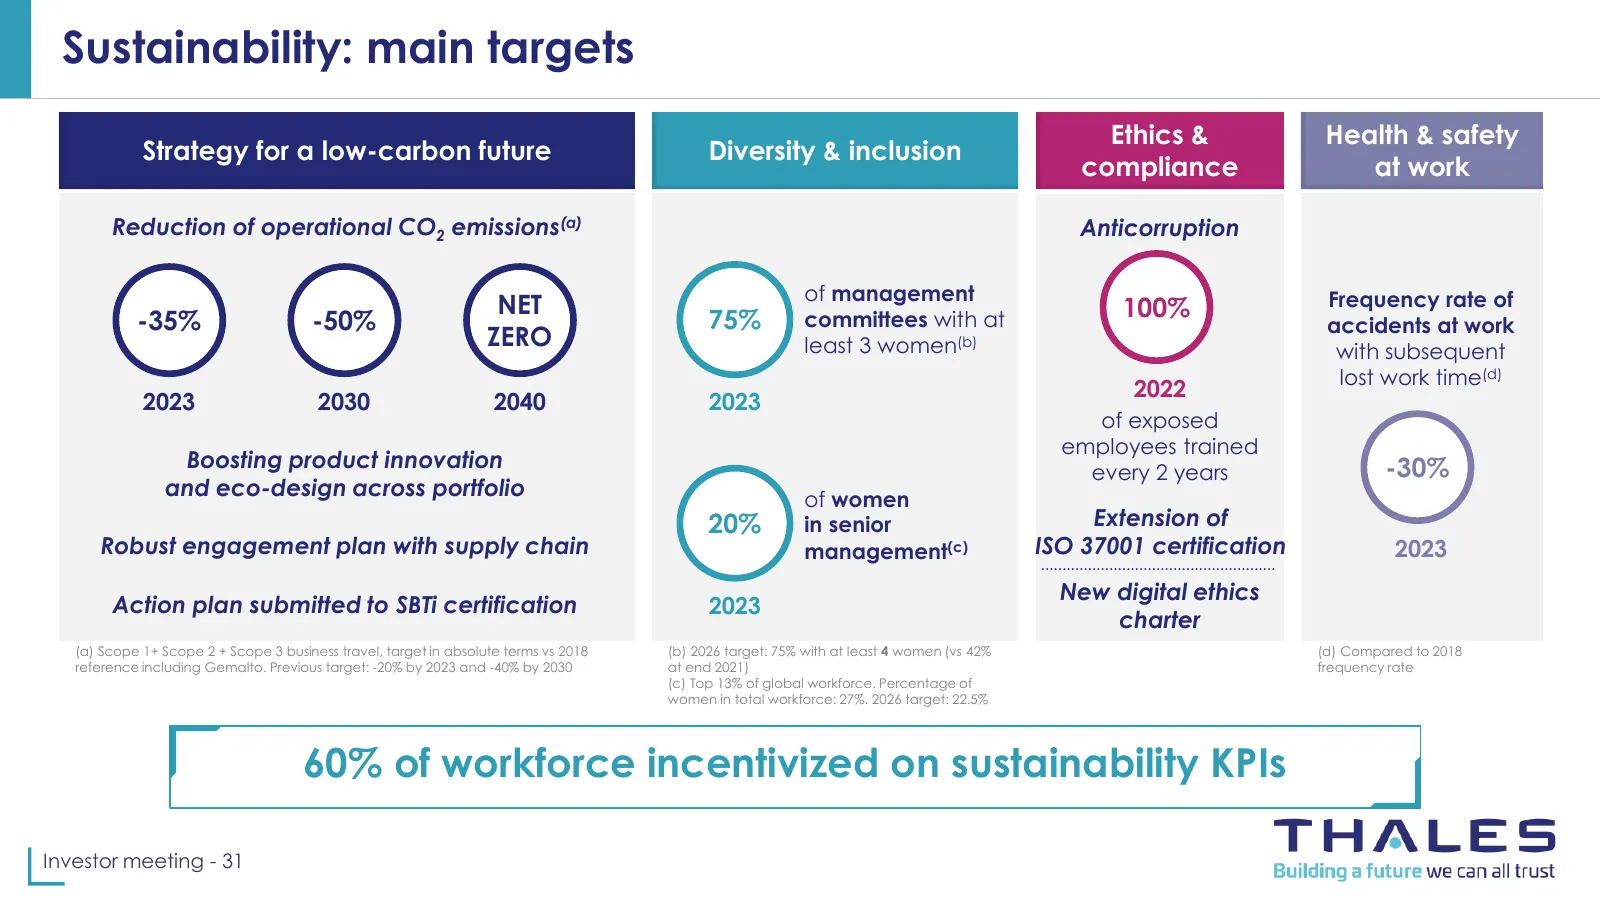
Slide 31: Sustainability: main targets
Sustainability: main targets Ethics & Health & safety Strategy for a low-carbon future Diversity & inclusion compliance at work Reduction of operational CO2 emissions(a) Anticorruption of management Frequency rate of NET 100% -35% -50% 75% committees with at accidents at work ZERO least 3 women(b) w
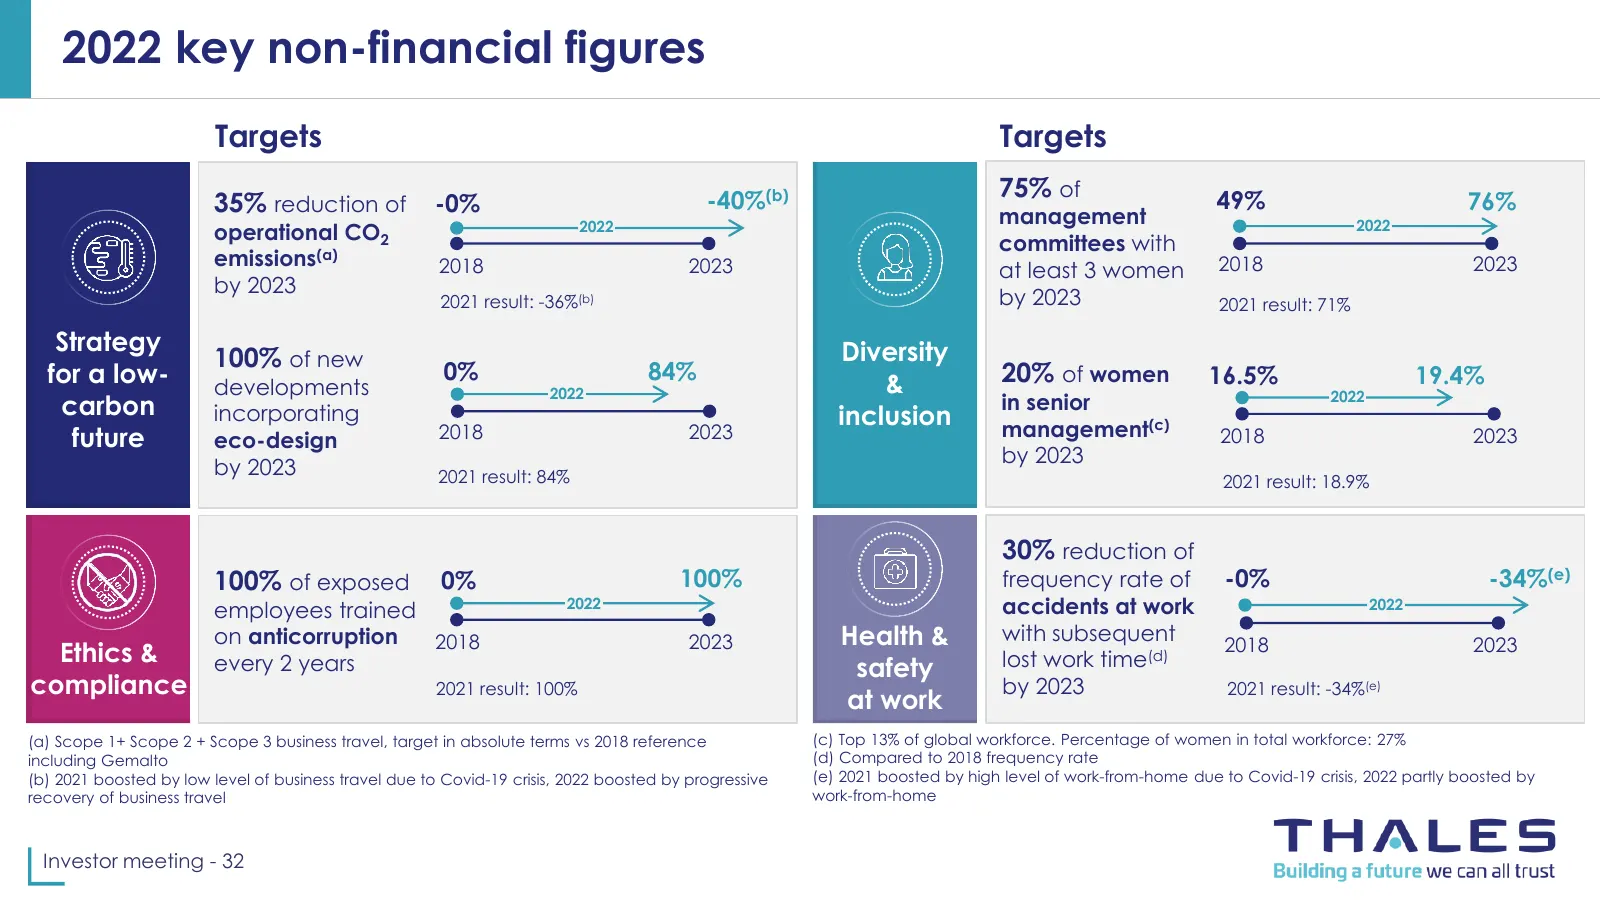
Slide 32: 2022 key non-financial figures
2022 key non-financial figures Targets Targets -40%(b) 75% of 49% 35% reduction of -0% management 76% 2022 2022 operational CO2 committees with emissions(a) 2018 2023 2018 2023 at least 3 women by 2023 2021 result: -36%(b) by 2023 2021 result: 71% Strategy Diversity 100% of new 0% 84% for a low- dev
Slide 33: Full-Year 2022 results
Introduction to Thales Key priorities Outlook Sustainability: safer, greener, more inclusive Full-Year 2022 results www.thalesgroup.com
Slide 34: Full-Year 2022 highlights
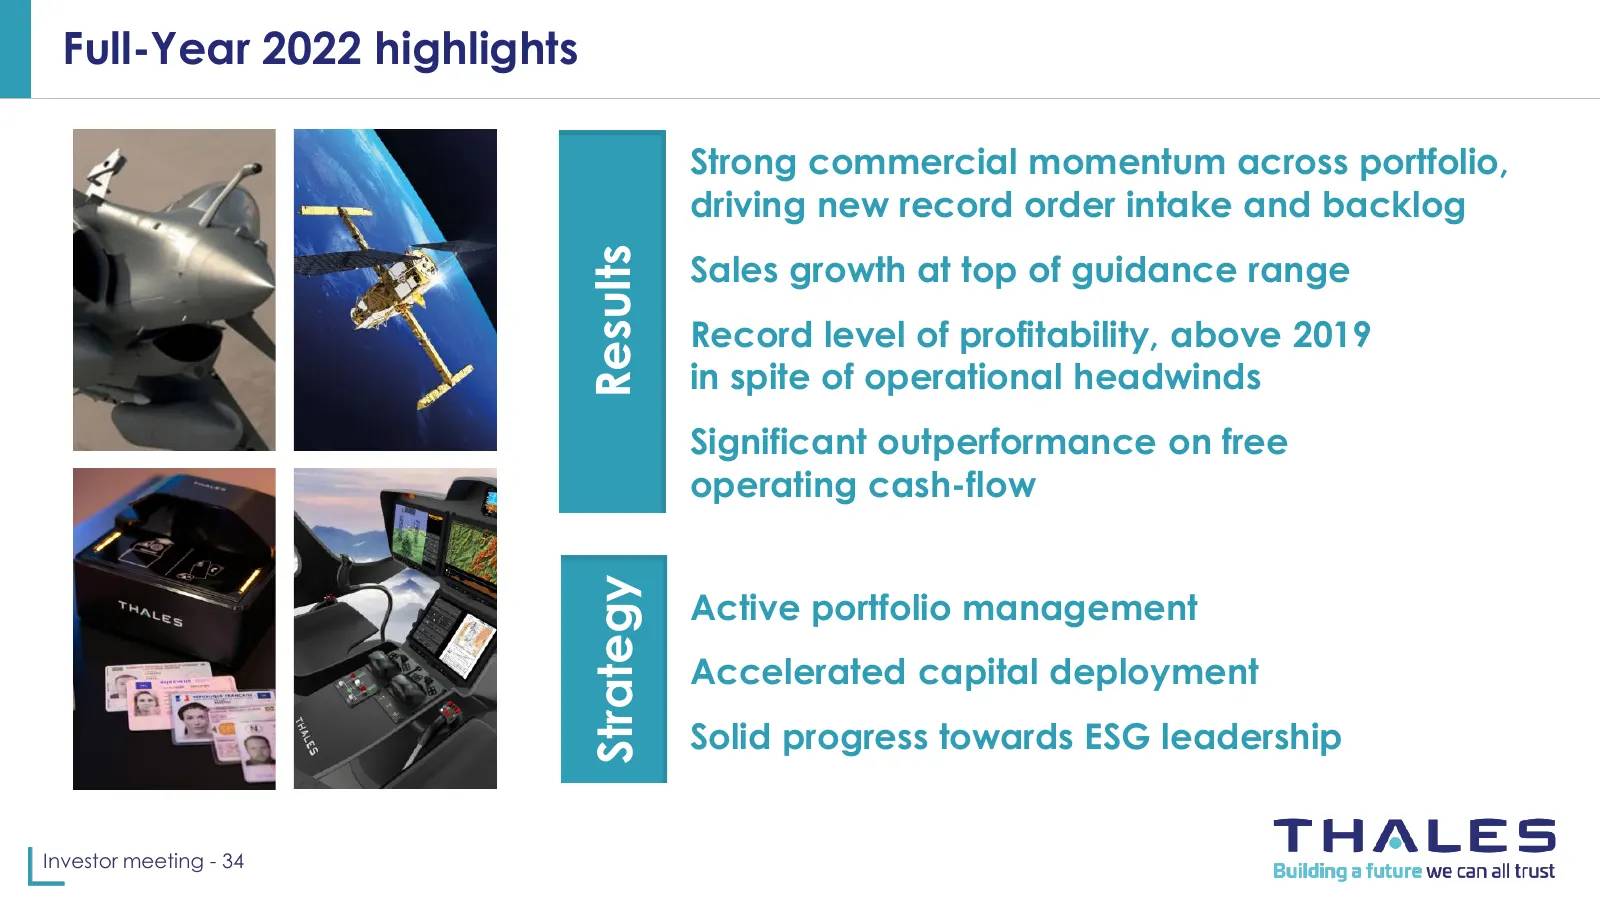
Full-Year 2022 highlights Strong commercial momentum across portfolio, driving new record order intake and backlog Results Sales growth at top of guidance range Record level of profitability, above 2019 in spite of operational headwinds Significant outperformance on free operating cash-flow Strategy
Slide 35: 2022 key figures
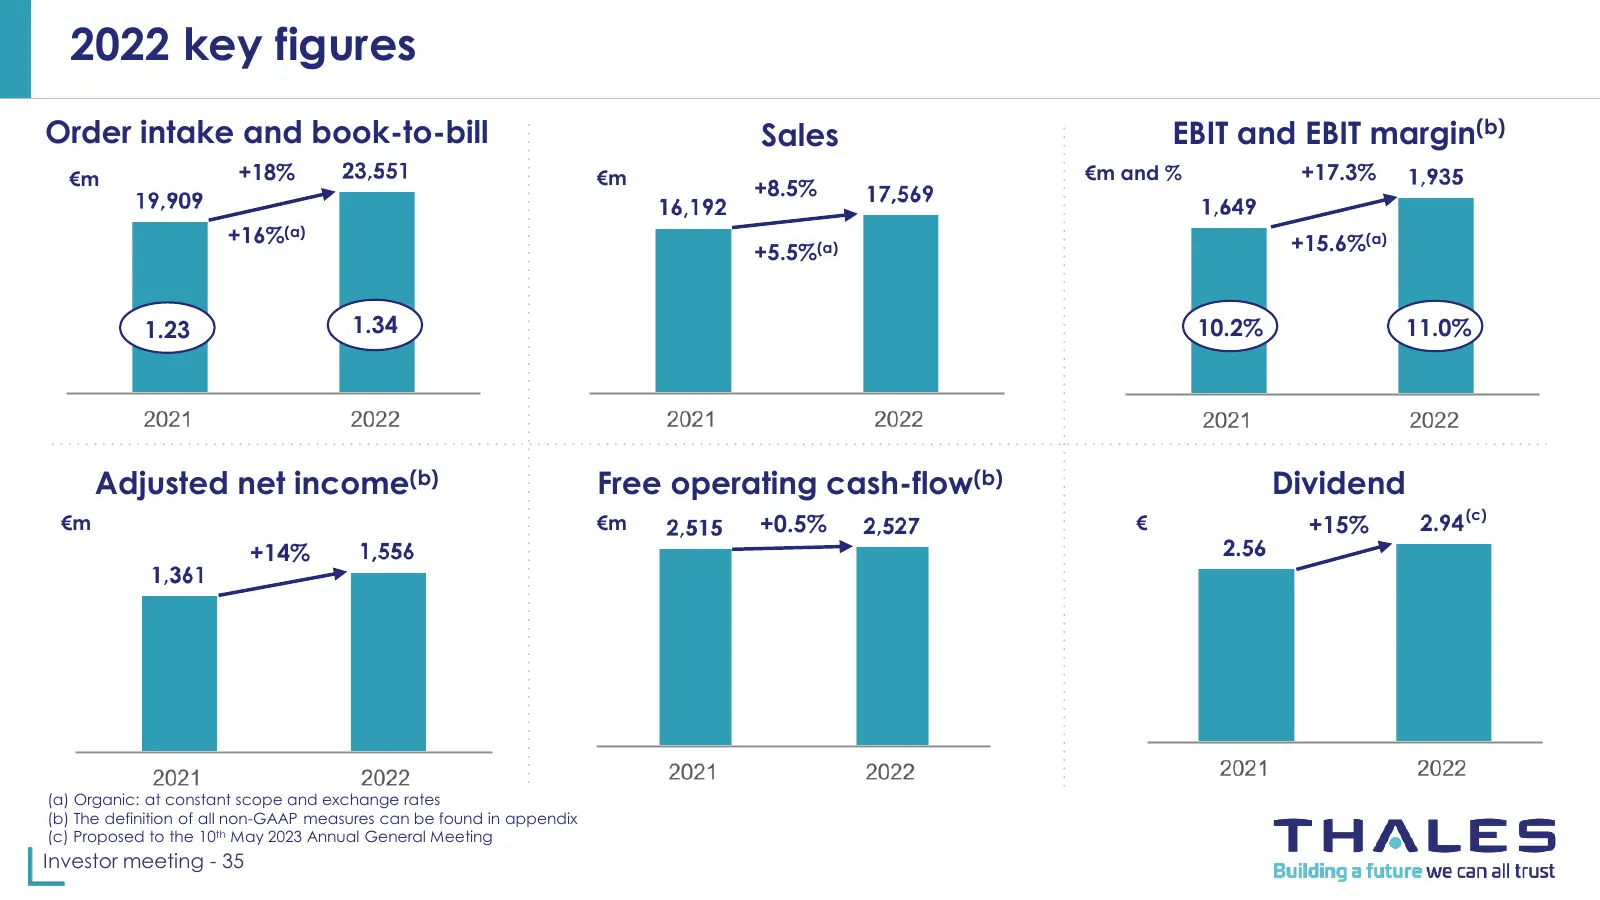
2022 key figures Order intake and book-to-bill Sales EBIT and EBIT margin(b) €m +18% €m €m and % +17.3% +8.5% +16%(a) +15.6%(a) +5.5%(a) 1.23 1.34 10.2% 11.0% Adjusted net income(b) Free operating cash-flow(b) Dividend (c) €m €m +0.5% € +15% +14% (a) Organic: at constant scope and exchange rates (b)
Slide 36: 2022 order intake
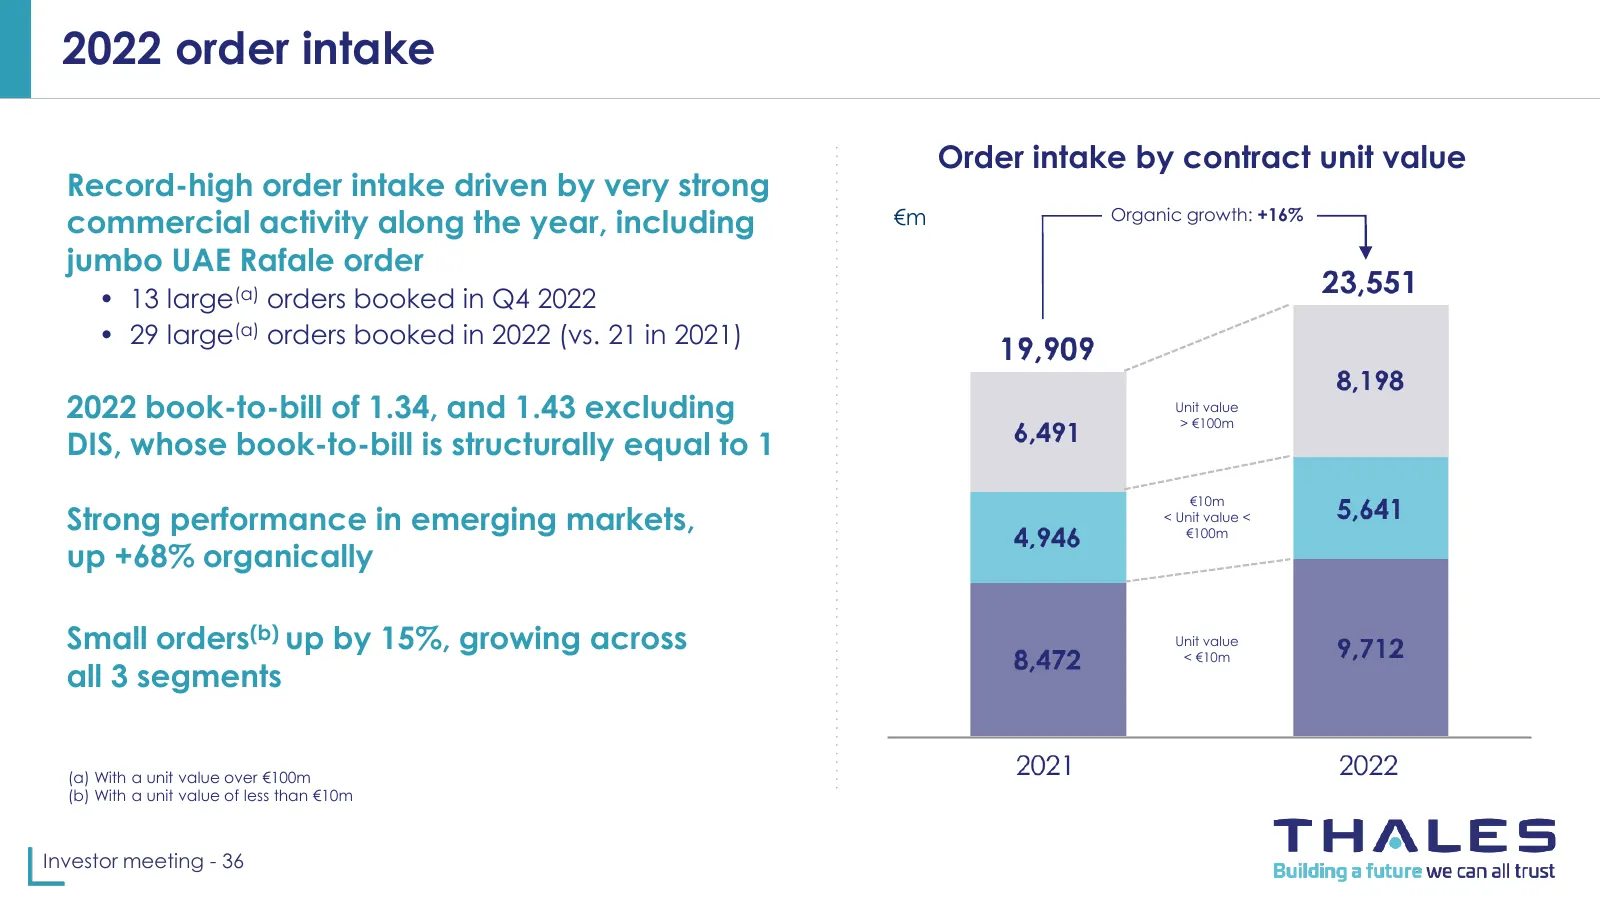
2022 order intake Order intake by contract unit value Record-high order intake driven by very strong commercial activity along the year, including €m Organic growth: +16% jumbo UAE Rafale order • 13 large(a) orders booked in Q4 2022 • 29 large(a) orders booked in 2022 (vs. 21 in 2021) 2022 book-to-b
Slide 37: 2022 sales growth
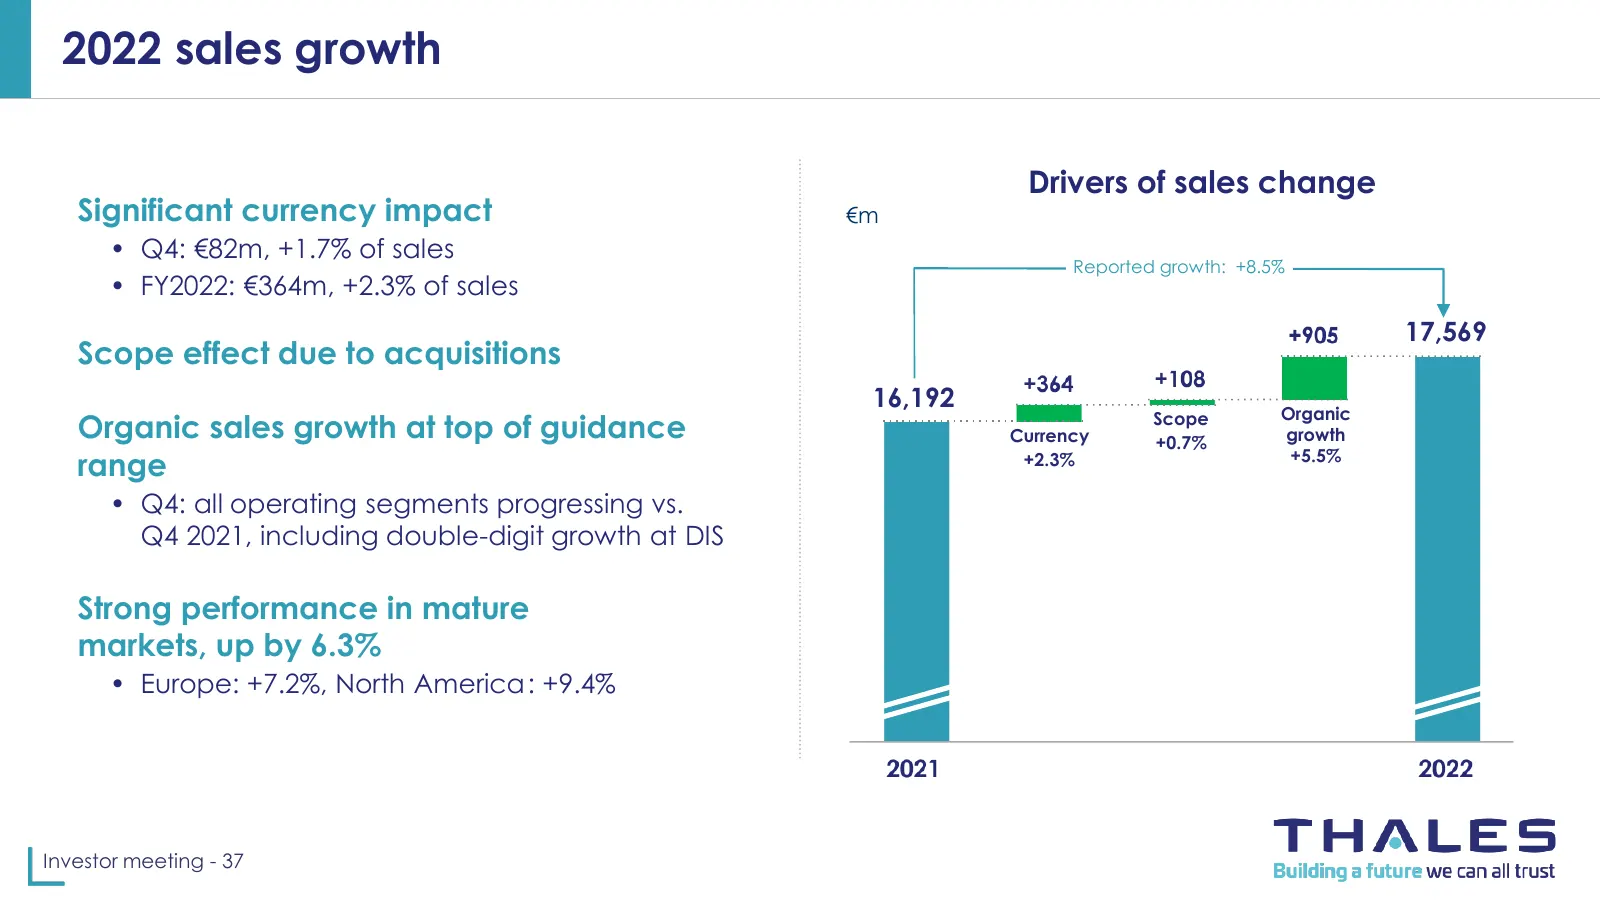
2022 sales growth Drivers of sales change Significant currency impact €m • Q4: €82m, +1.7% of sales Reported growth: +8.5% • FY2022: €364m, +2.3% of sales 17,569 Scope effect due to acquisitions 16,192 Organic Organic sales growth at top of guidance Currency Scope +0.7% growth +5.5% range +2.3% • Q4
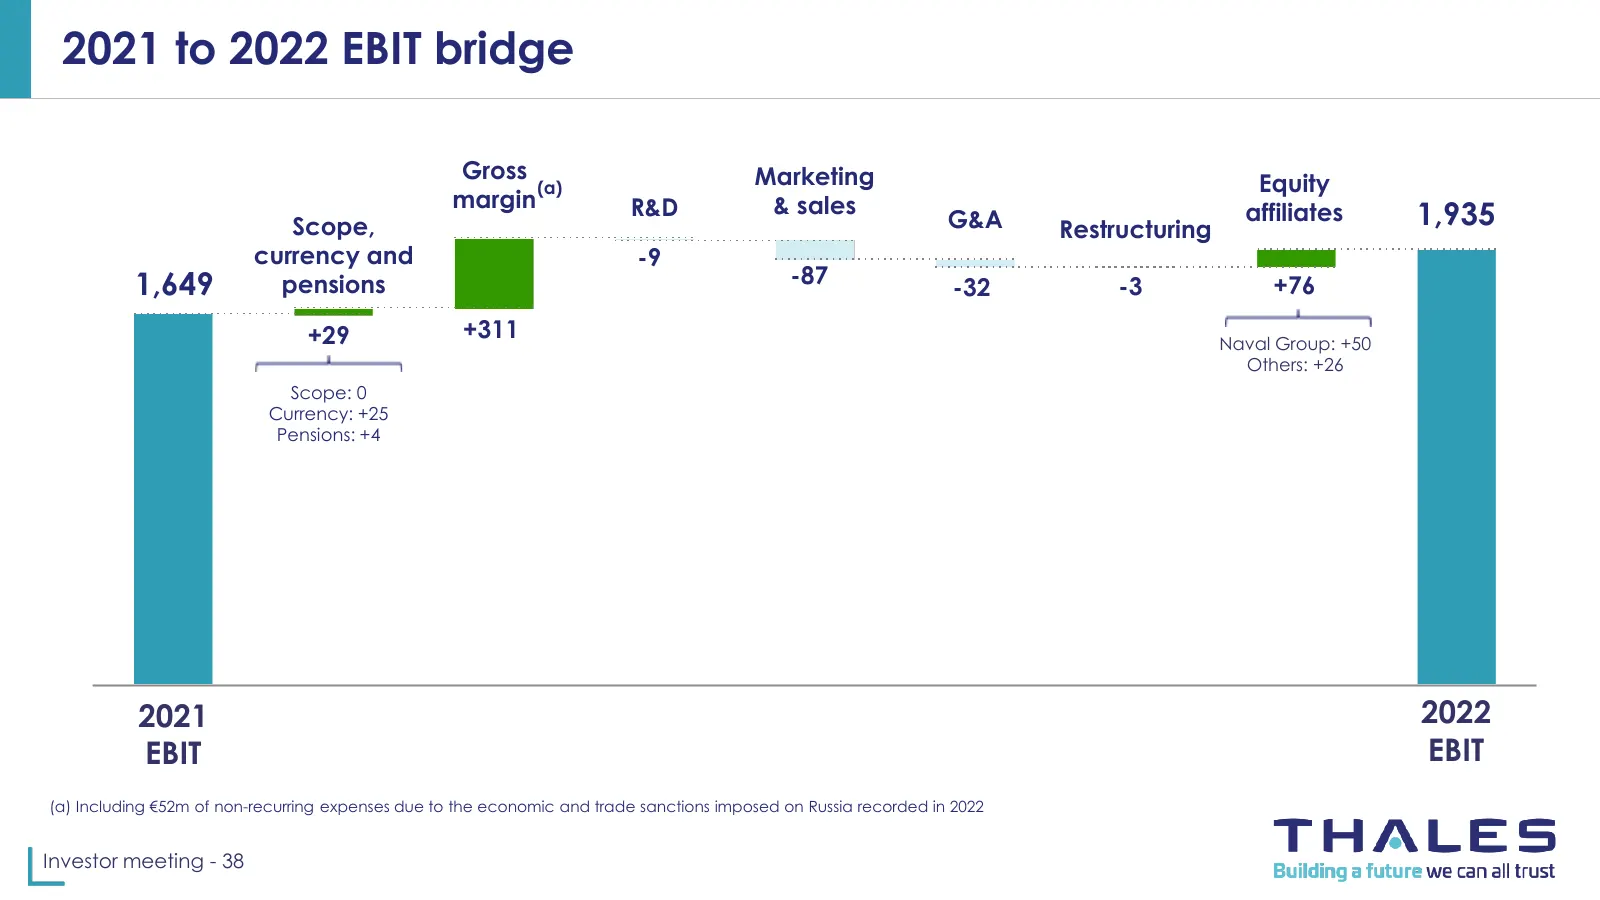
Slide 38: 2021 to 2022 EBIT bridge
2021 to 2022 EBIT bridge Gross Marketing (a) Equity margin R&D & sales Scope, G&A Restructuring affiliates 1,935 currency and -9 1,649 pensions -87 -32 -3 +76 +29 +311 Naval Group: +50 Others: +26 Scope: 0 Currency: +25 Pensions: +4 2021 2022 EBIT EBIT (a) Including €52m of non-recurring expenses du
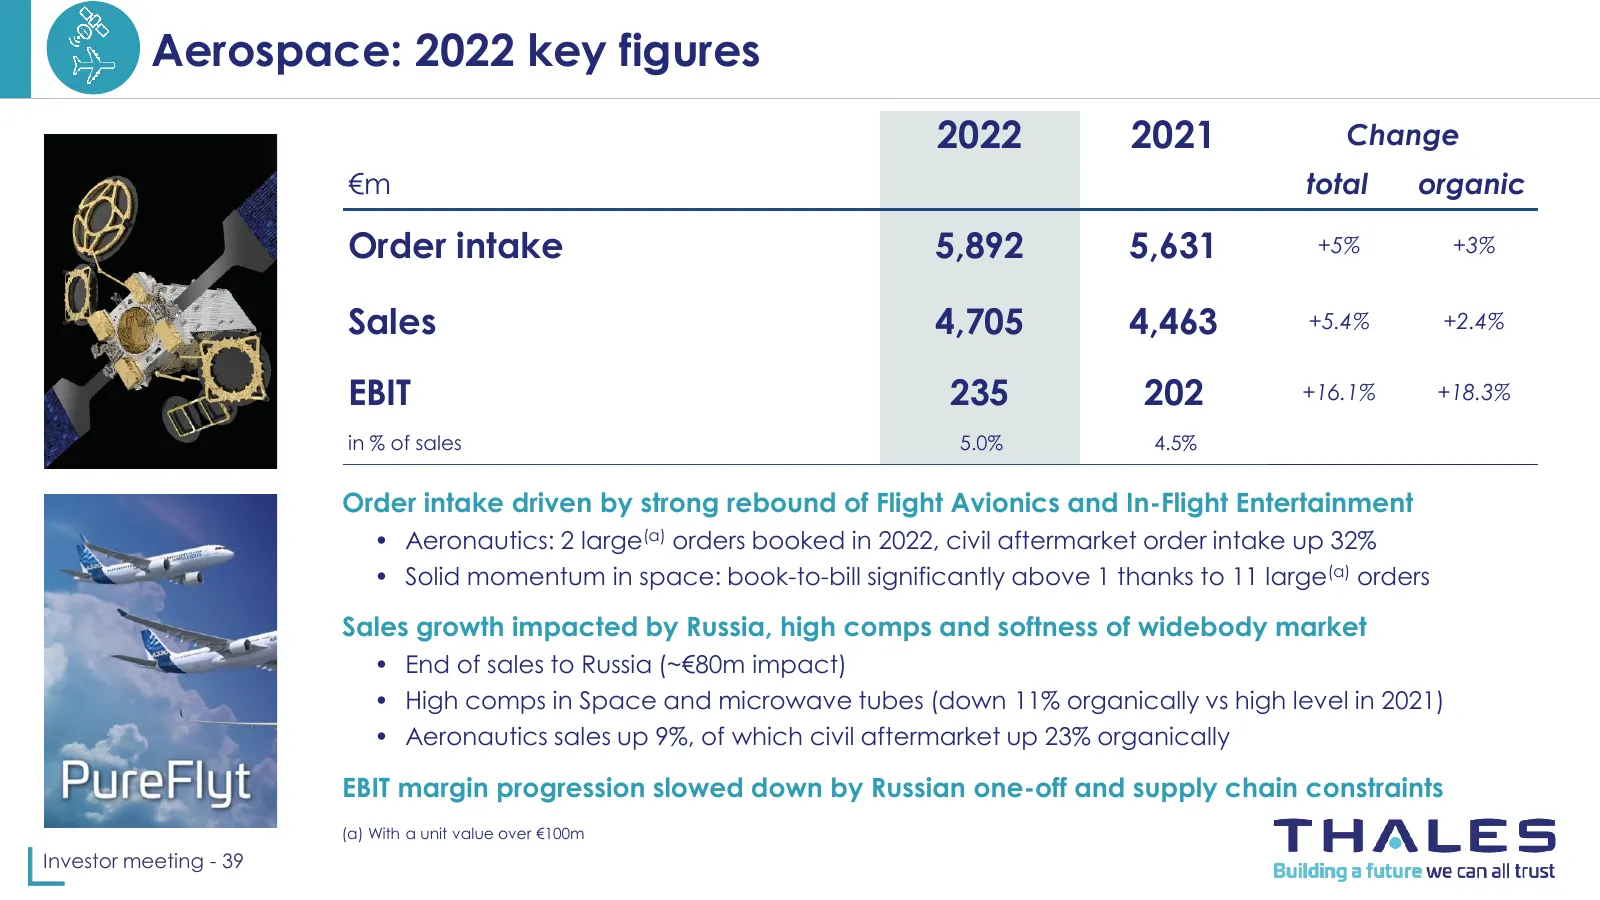
Slide 39: Aerospace: 2022 key figures
Aerospace: 2022 key figures 2022 2021 Change €m total organic Order intake 5,892 5,631 +5% +3% Sales 4,705 4,463 +5.4% +2.4% EBIT 235 202 +16.1% +18.3% in % of sales 5.0% 4.5% Order intake driven by strong rebound of Flight Avionics and In-Flight Entertainment • Aeronautics: 2 large(a) orders booked
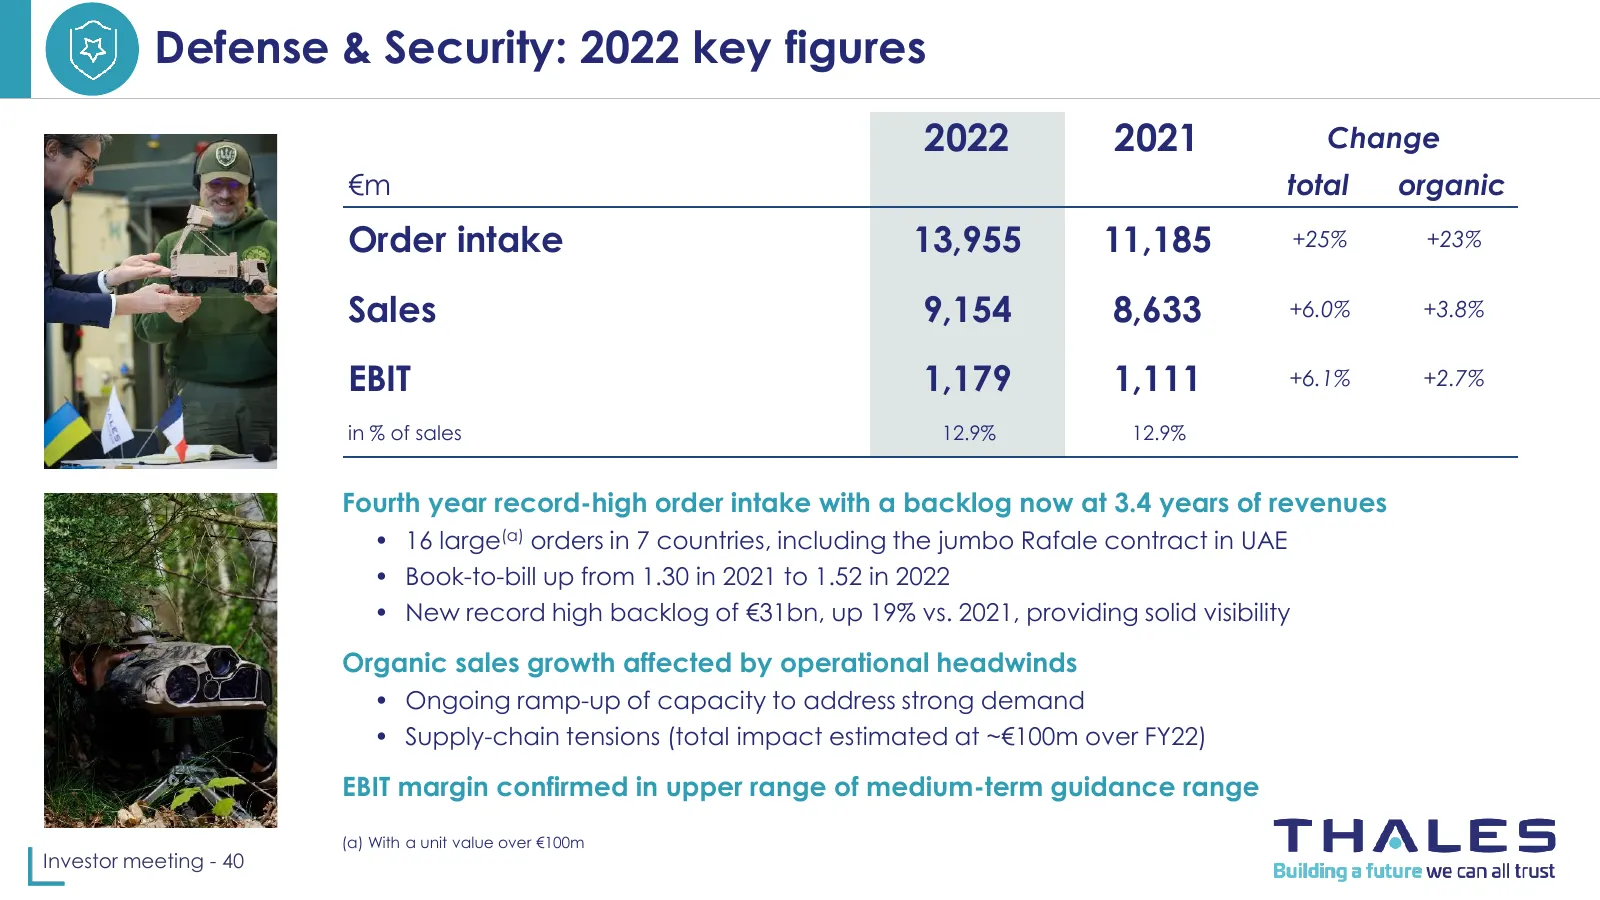
Slide 40: Defense & Security: 2022 key figures
Defense & Security: 2022 key figures 2022 2021 Change €m total organic Order intake 13,955 11,185 +25% +23% Sales 9,154 8,633 +6.0% +3.8% EBIT 1,179 1,111 +6.1% +2.7% in % of sales 12.9% 12.9% Fourth year record-high order intake with a backlog now at 3.4 years of revenues • 16 large(a) orders in 7
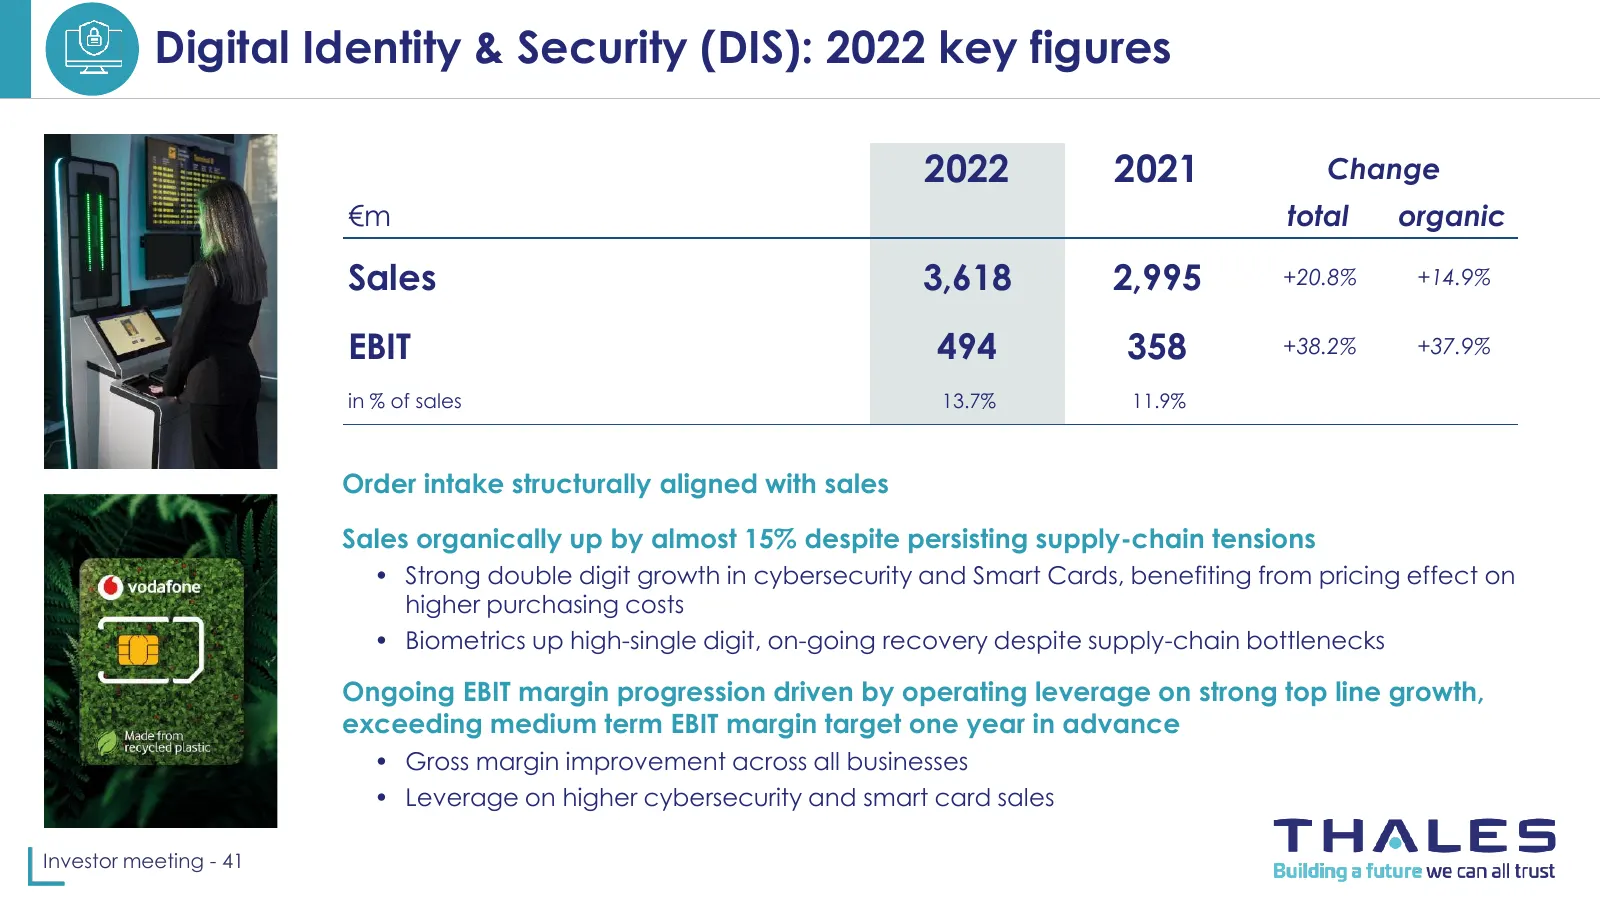
Slide 41: Digital Identity & Security (DIS): 2022 key figures
Digital Identity & Security (DIS): 2022 key figures 2022 2021 Change €m total organic Sales 3,618 2,995 +20.8% +14.9% EBIT 494 358 +38.2% +37.9% in % of sales 13.7% 11.9% Order intake structurally aligned with sales Sales organically up by almost 15% despite persisting supply-chain tensions • Strong
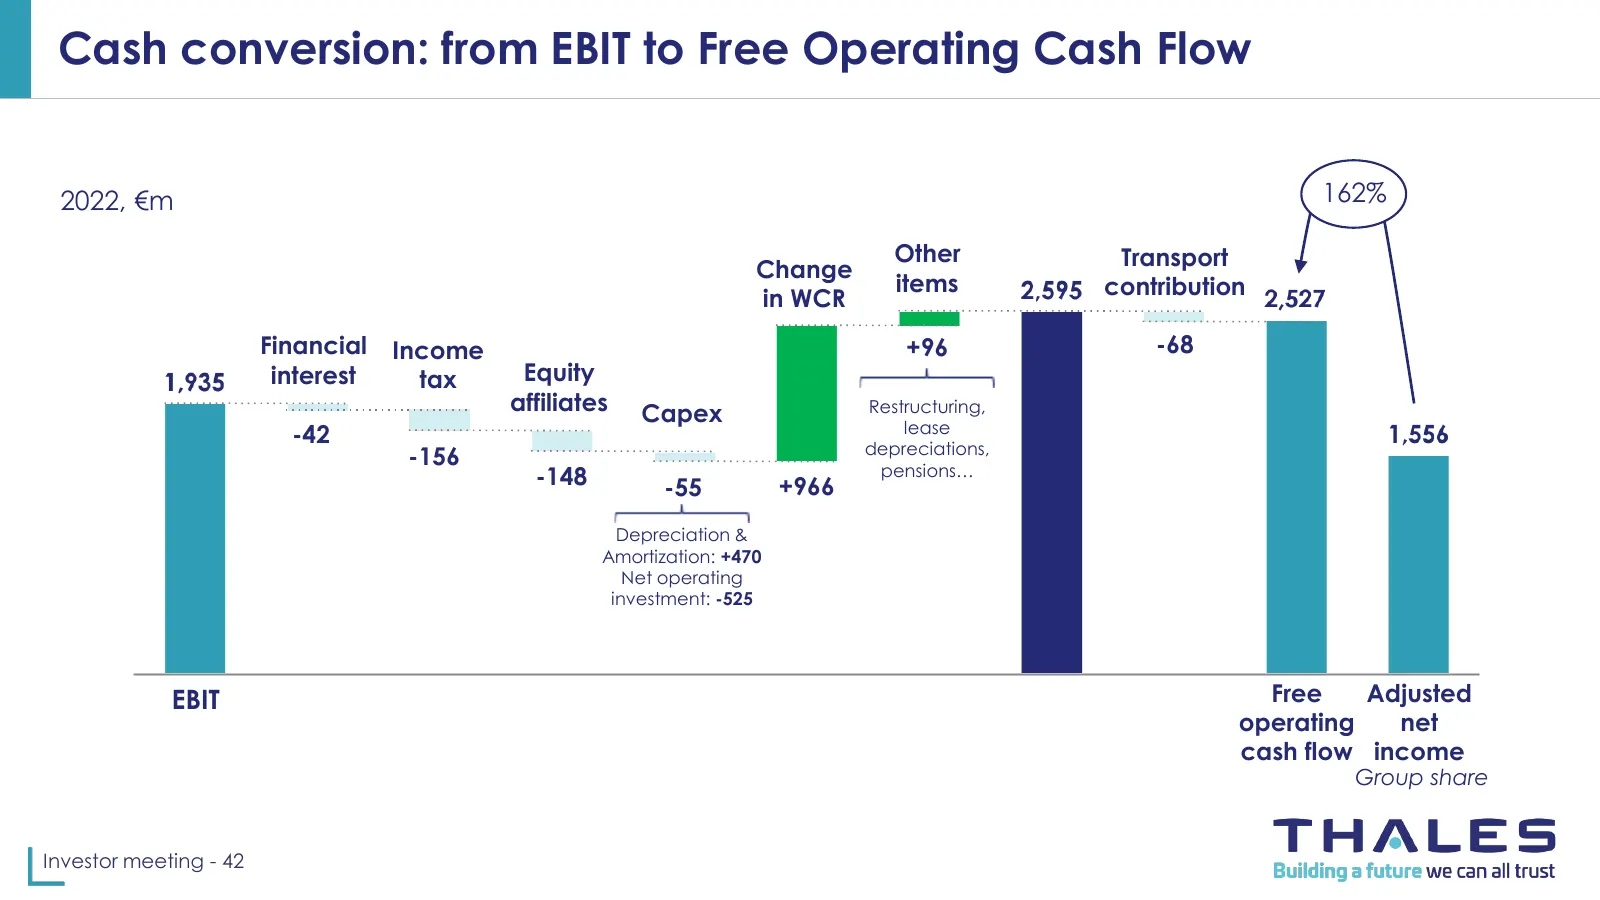
Slide 42: Cash conversion: from EBIT to Free Operating Cash Flow
Cash conversion: from EBIT to Free Operating Cash Flow 2022, €m 162% Other Transport Change items contribution in WCR Financial Income +96 -68 interest tax Equity affiliates Capex Restructuring, lease -42 depreciations, -156 pensions… -148 -55 +966 Depreciation & Amortization: +470 Net operating inv

Slide 43: Appendix
Appendix www.thalesgroup.com
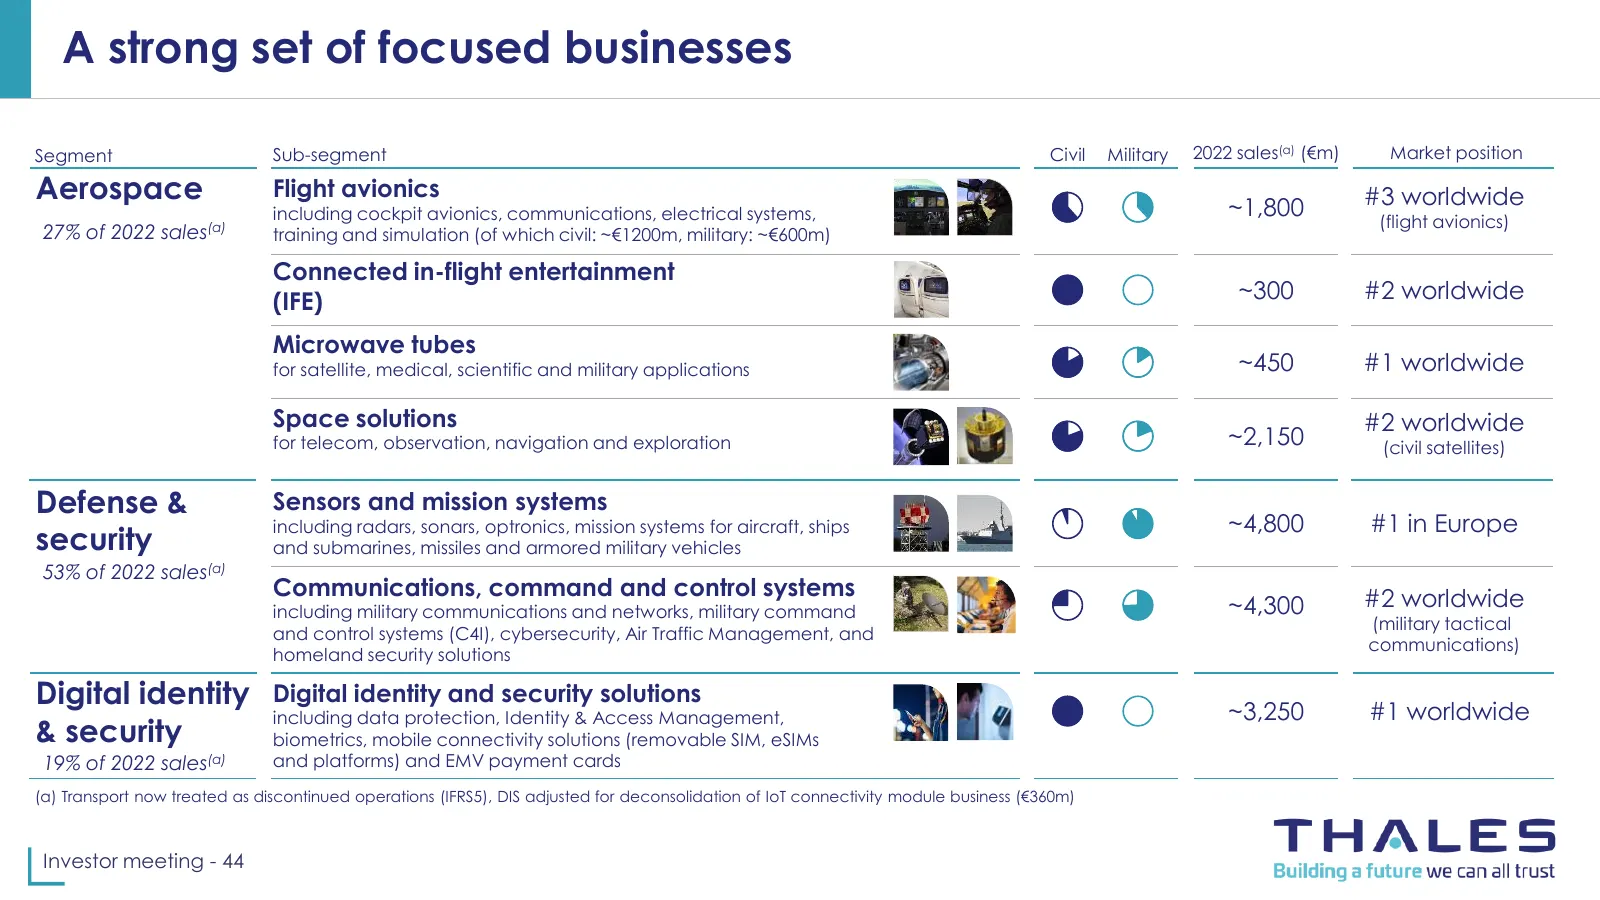
Slide 44: A strong set of focused businesses
A strong set of focused businesses Segment Sub-segment Civil Military 2022 sales(a) (€m) Market position Aerospace Flight avionics #3 worldwide including cockpit avionics, communications, electrical systems, ~1,800 (flight avionics) 27% of 2022 sales(a) training and simulation (of which civil: ~€120
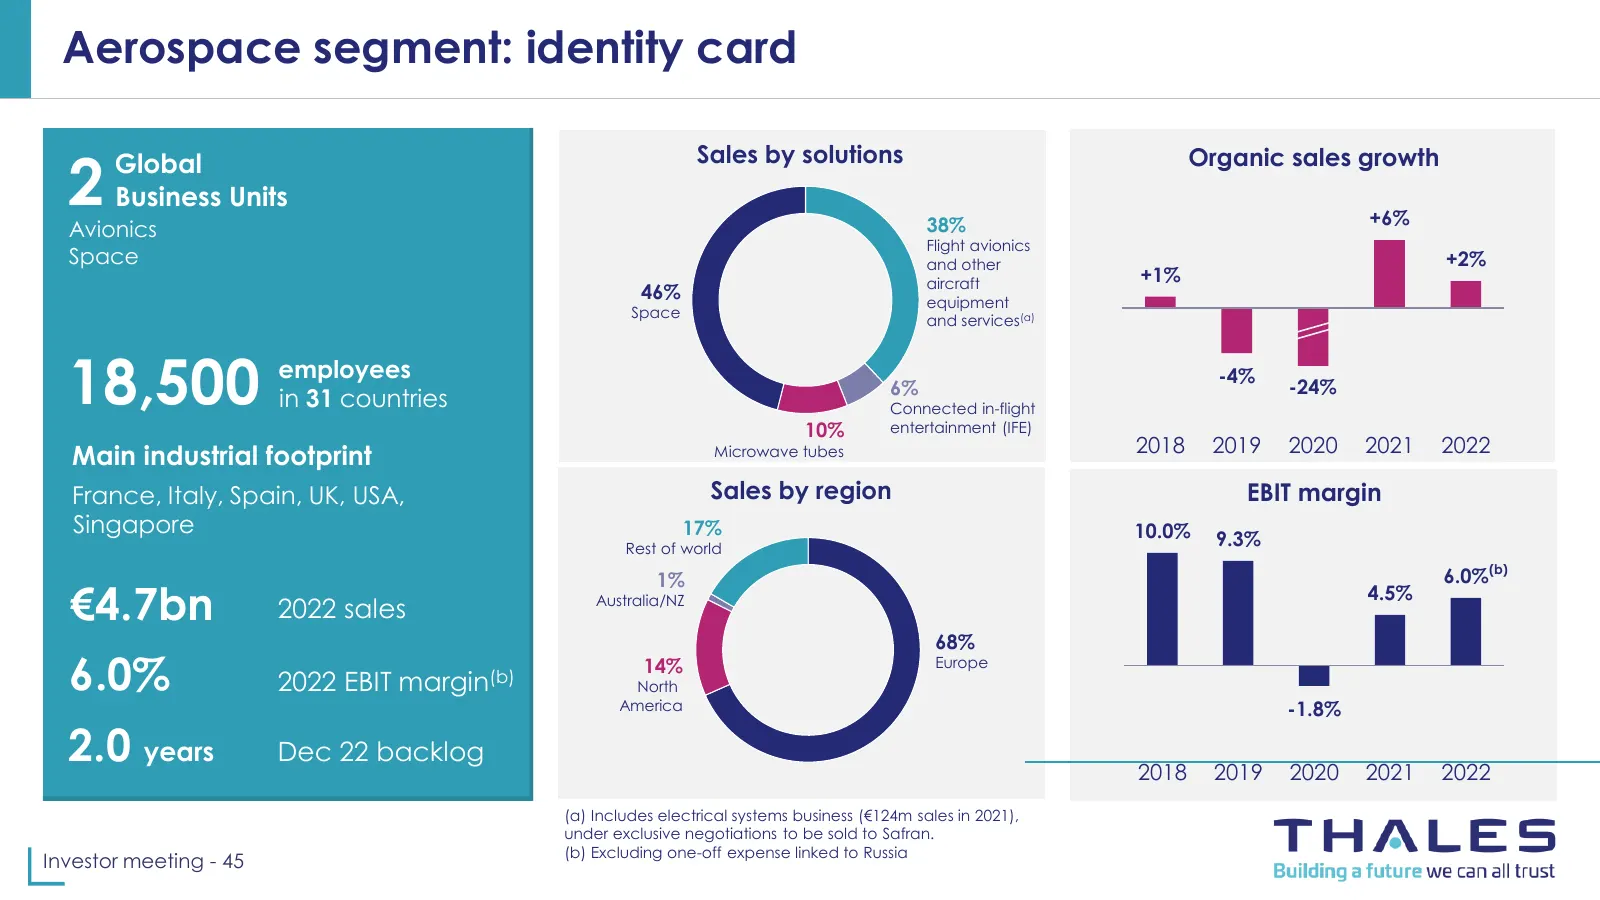
Slide 45: Aerospace segment: identity card
Aerospace segment: identity card Sales by solutions 2 Global Organic sales growth Business Units 38% +6% Avionics Flight avionics Space and other +2% aircraft +1% 46% equipment Space and services(a) 18,500 employees in 31 countries 6% Connected in-flight -4% -24% 10% entertainment (IFE) 2018 2019 20
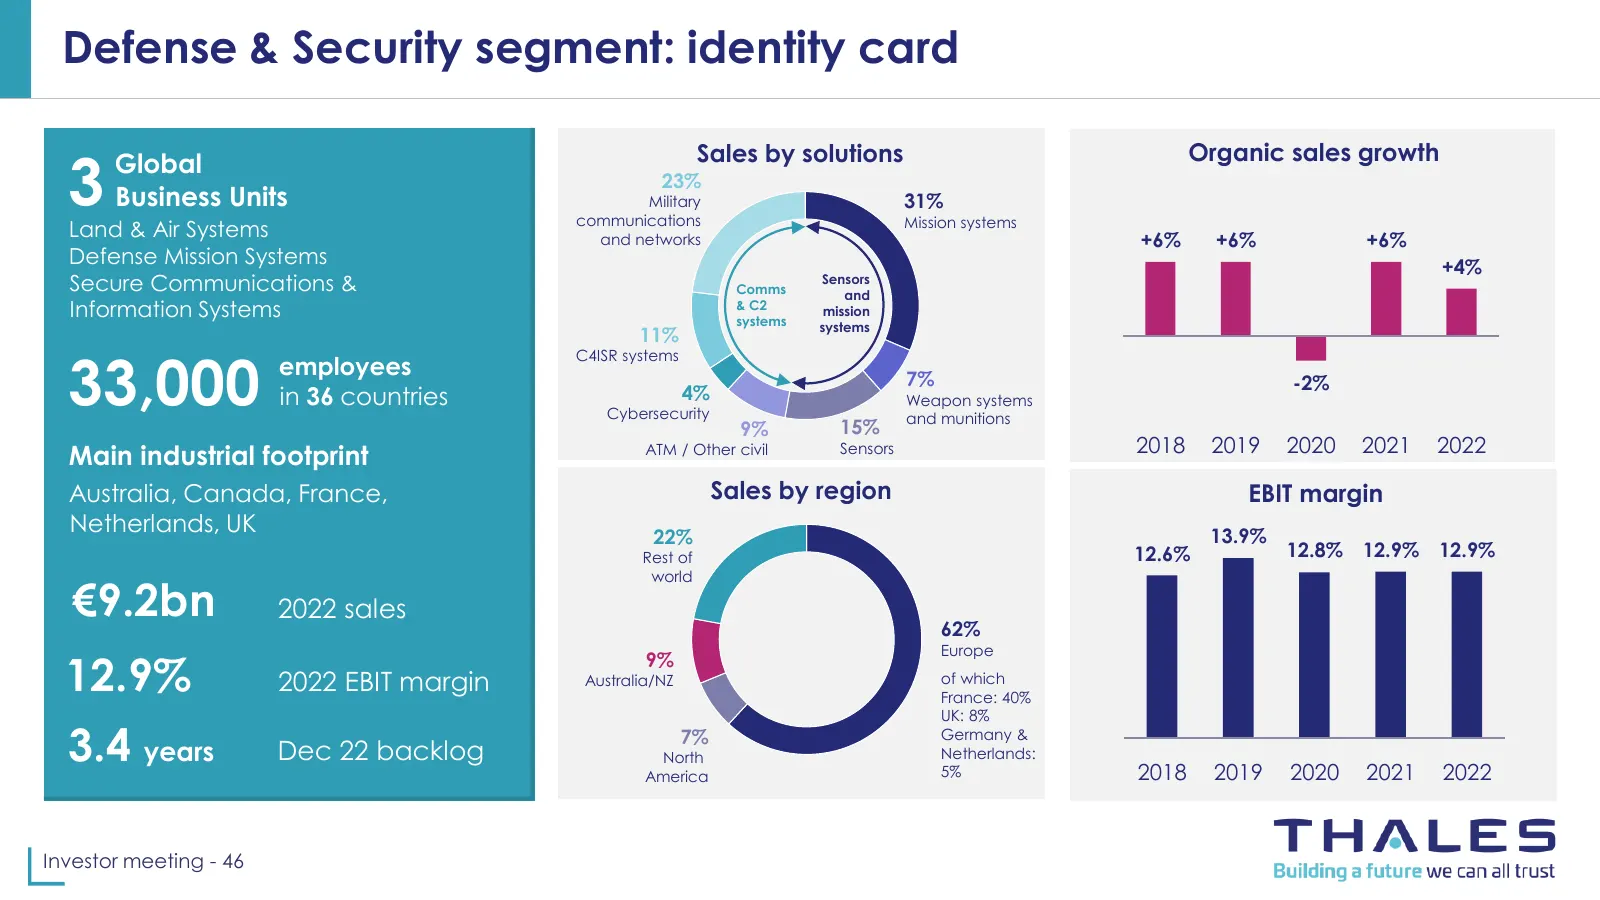
Slide 46: Defense & Security segment: identity card
Defense & Security segment: identity card Sales by solutions Organic sales growth 3 Global Business Units Land & Air Systems 23% Military communications 31% Mission systems and networks +6% +6% +6% Defense Mission Systems +4% Secure Communications & Comms Sensors and Information Systems & C2 systems
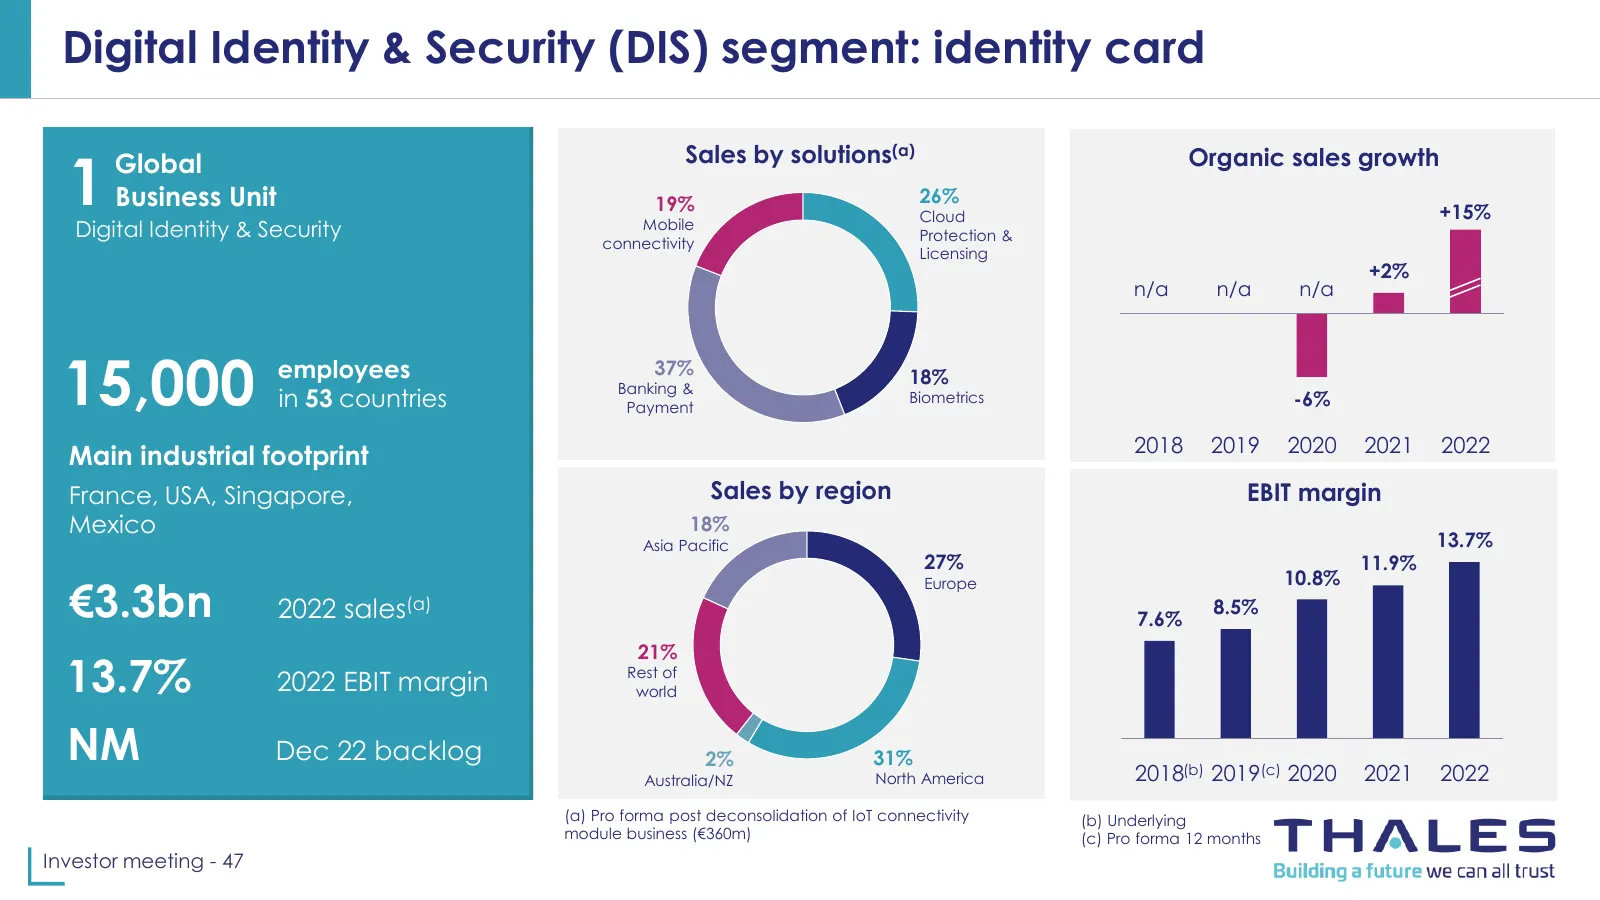
Slide 47: Digital Identity & Security (DIS) segment: identity card
Digital Identity & Security (DIS) segment: identity card Sales by solutions(a) 1 Global Organic sales growth Business Unit 19% 26% +15% Cloud Digital Identity & Security Mobile Protection & connectivity Licensing +2% n/a n/a n/a 15,000 employees in 53 countries 37% Banking & Payment 18% Biometrics -
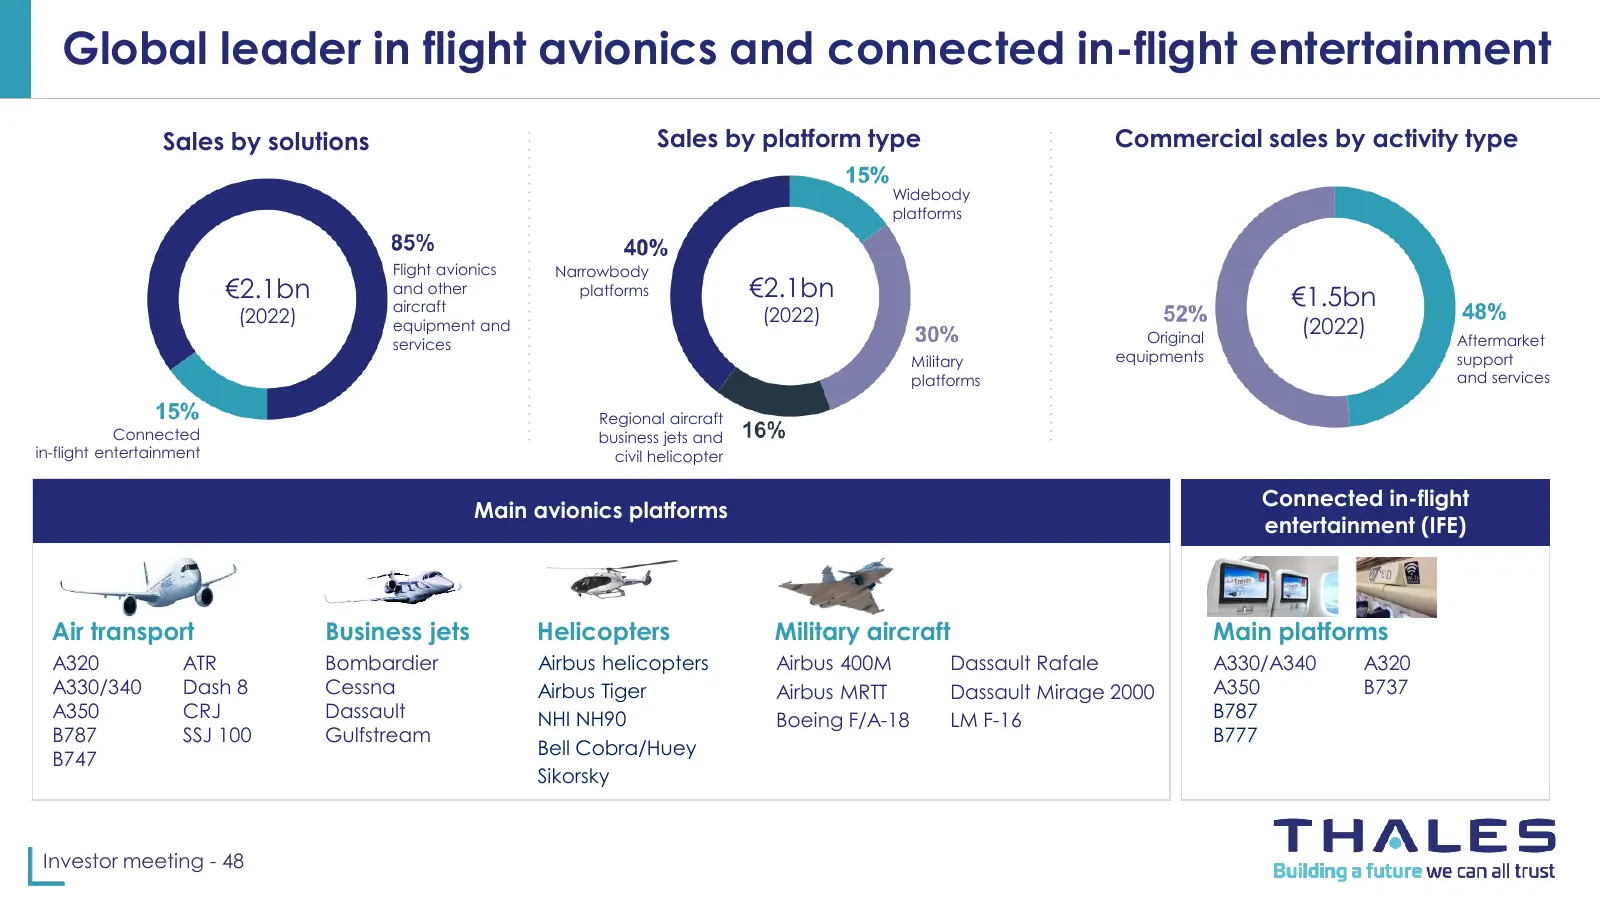
Slide 48: Global leader in flight avionics and connected in-flight entertainment
Global leader in flight avionics and connected in-flight entertainment Sales by solutions Sales by platform type Commercial sales by activity type Widebody platforms Flight avionics Narrowbody €2.1bn and other platforms €2.1bn €1.5bn aircraft (2022) (2022) equipment and Original (2022) services Afte
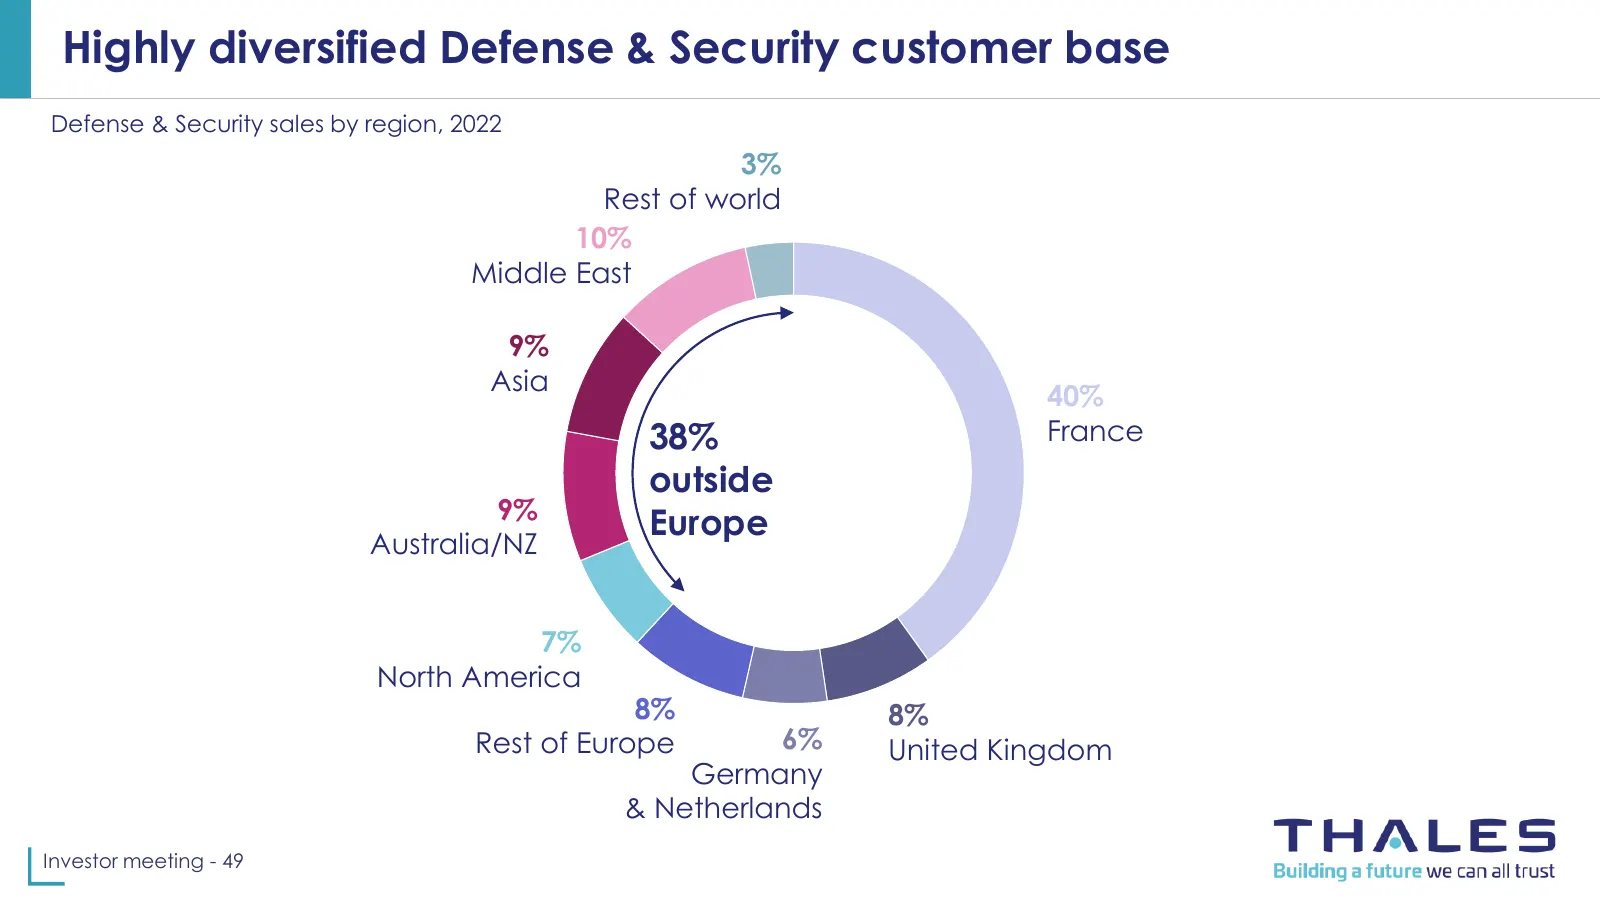
Slide 49: Highly diversified Defense & Security customer base
Highly diversified Defense & Security customer base Defense & Security sales by region, 2022 3% Rest of world 10% Middle East 9% Asia 40% 38% France outside 9% Europe Australia/NZ 7% North America 8% 8% Rest of Europe 6% United Kingdom Germany & Netherlands Investor meeting - 49
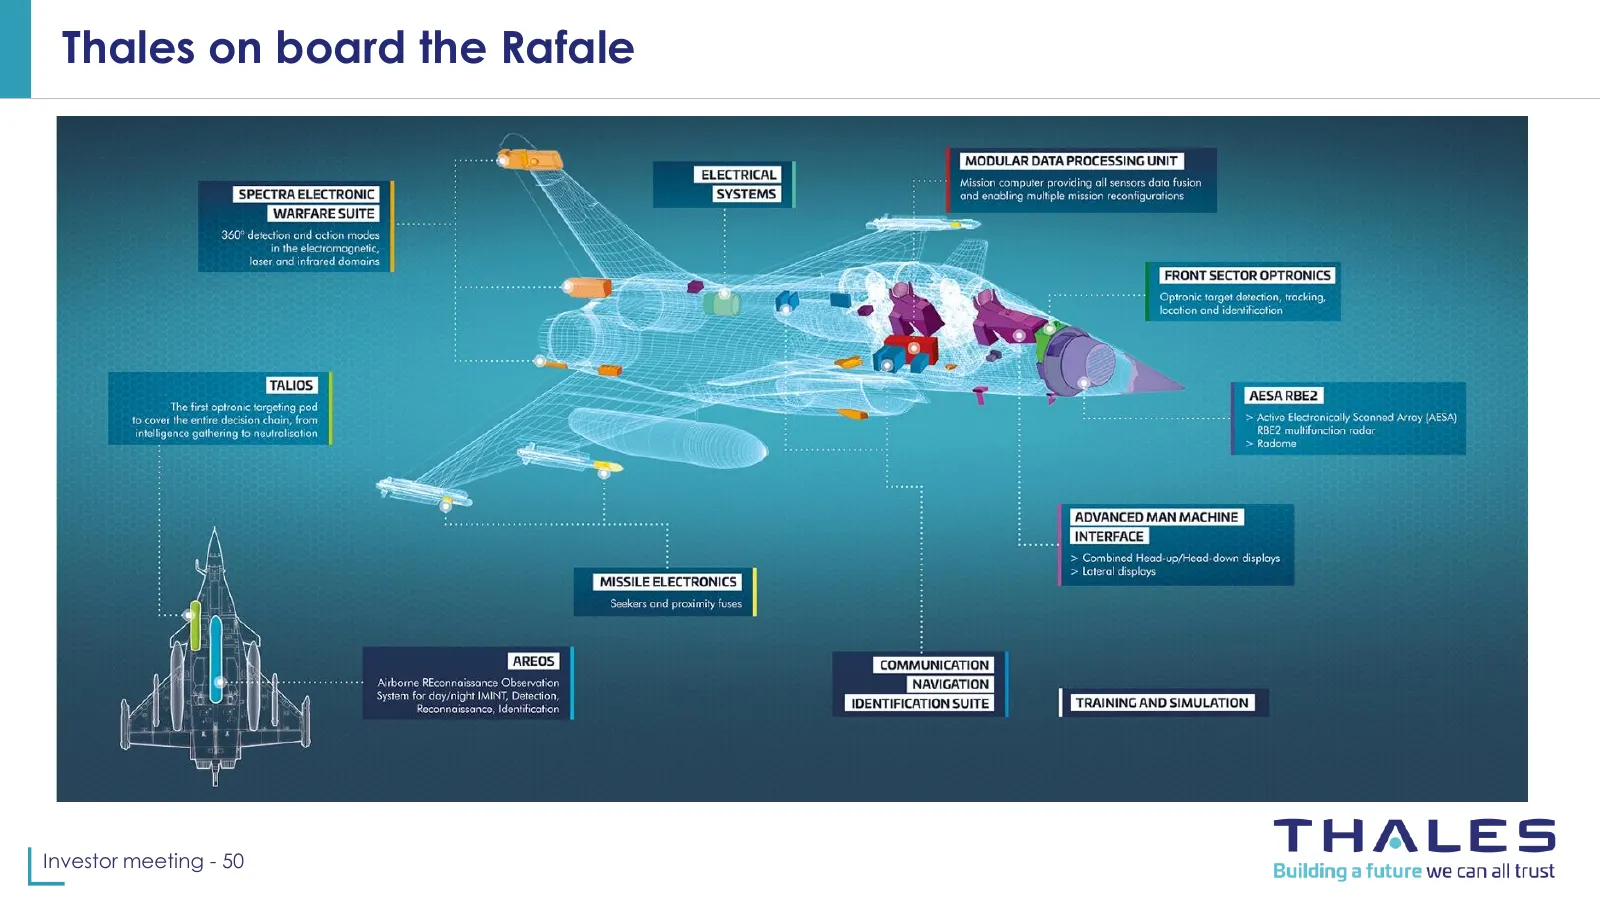
Slide 50: Thales on board the Rafale
Thales on board the Rafale Investor meeting - 50
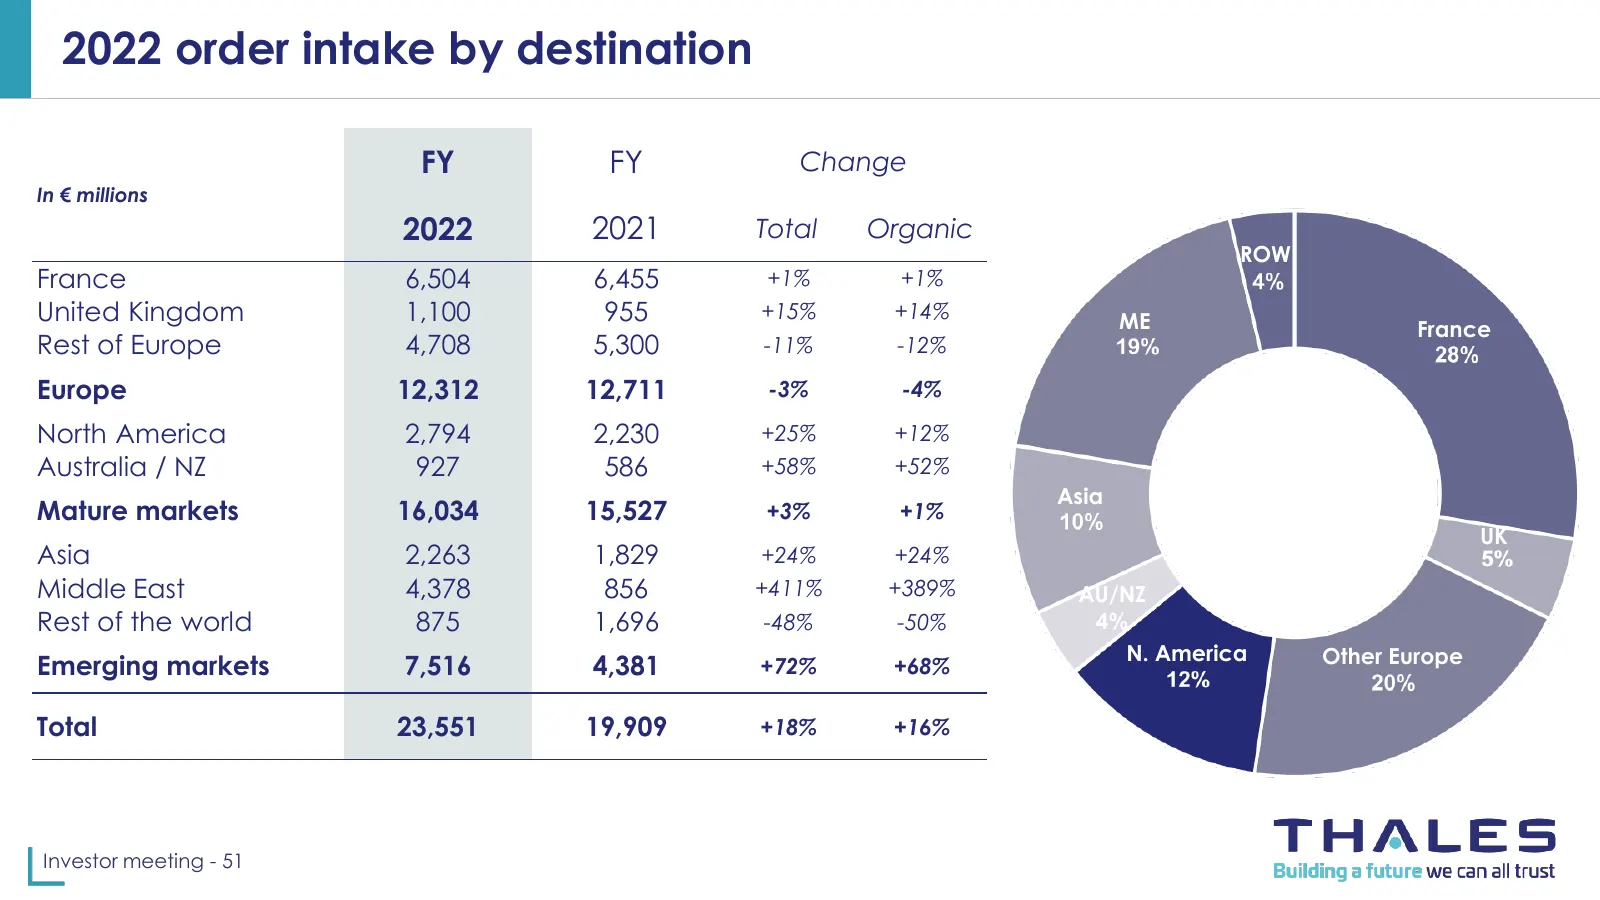
Slide 51: 2022 order intake by destination
2022 order intake by destination FY FY Change In € millions 2022 2021 Total Organic ROW France 6,504 6,455 +1% +1% United Kingdom 1,100 955 +15% +14% ME France Rest of Europe 4,708 5,300 -11% -12% Europe 12,312 12,711 -3% -4% North America 2,794 2,230 +25% +12% Australia / NZ 927 586 +58% +52% Asia
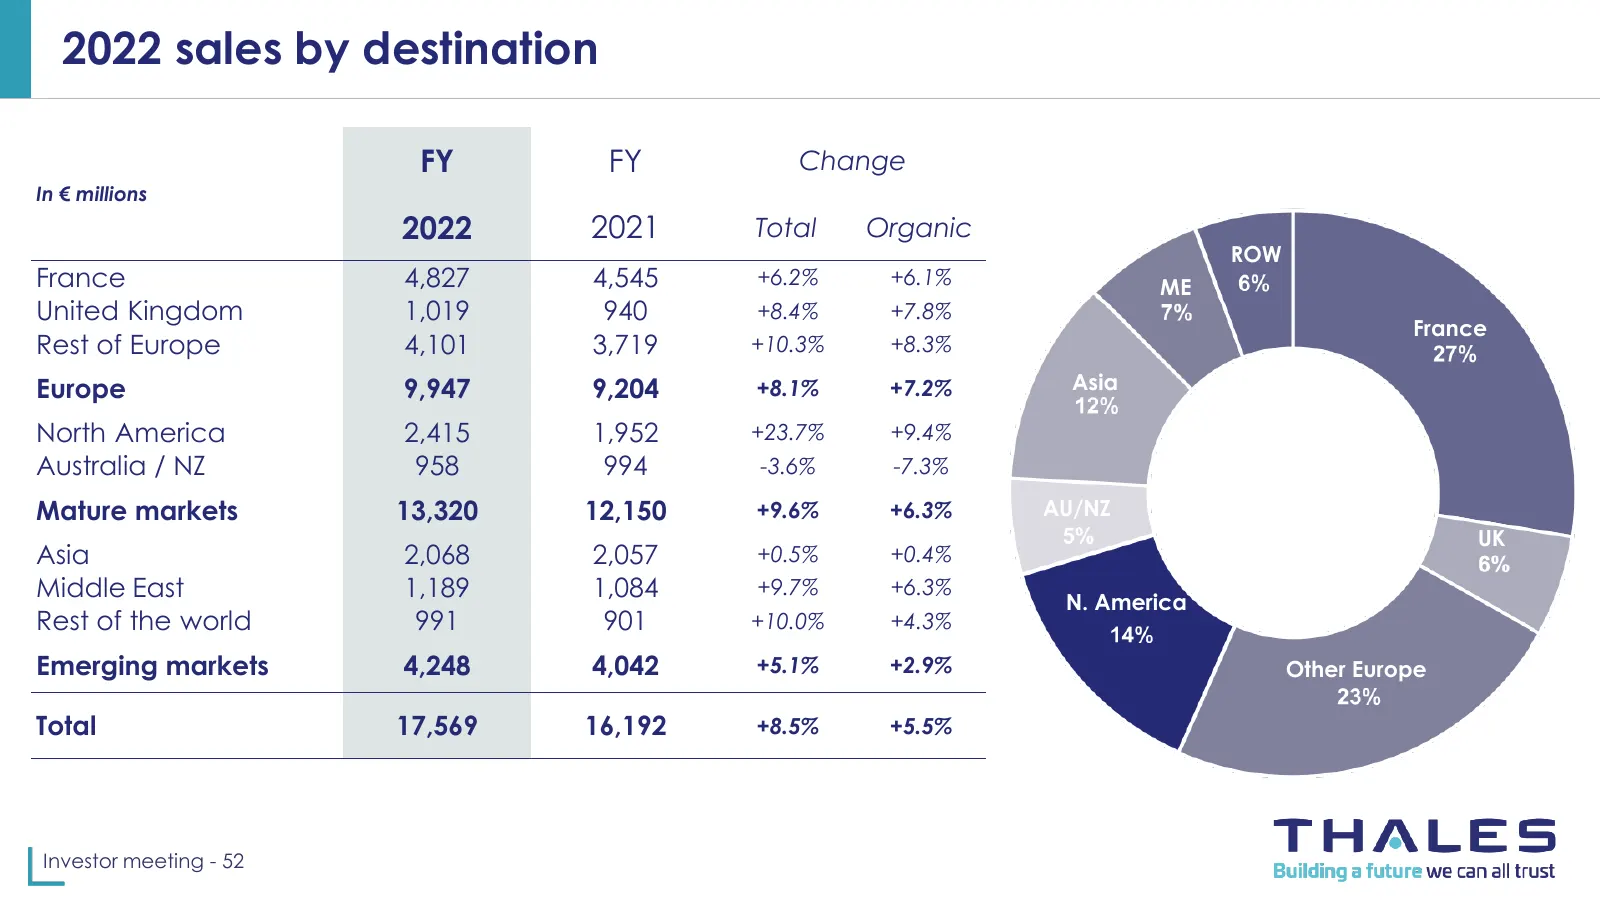
Slide 52: 2022 sales by destination
2022 sales by destination FY FY Change In € millions 2022 2021 Total Organic ROW France 4,827 4,545 +6.2% +6.1% ME United Kingdom 1,019 940 +8.4% +7.8% France Rest of Europe 4,101 3,719 +10.3% +8.3% Europe 9,947 9,204 +8.1% +7.2% Asia North America 2,415 1,952 +23.7% +9.4% Australia / NZ 958 994 -3.
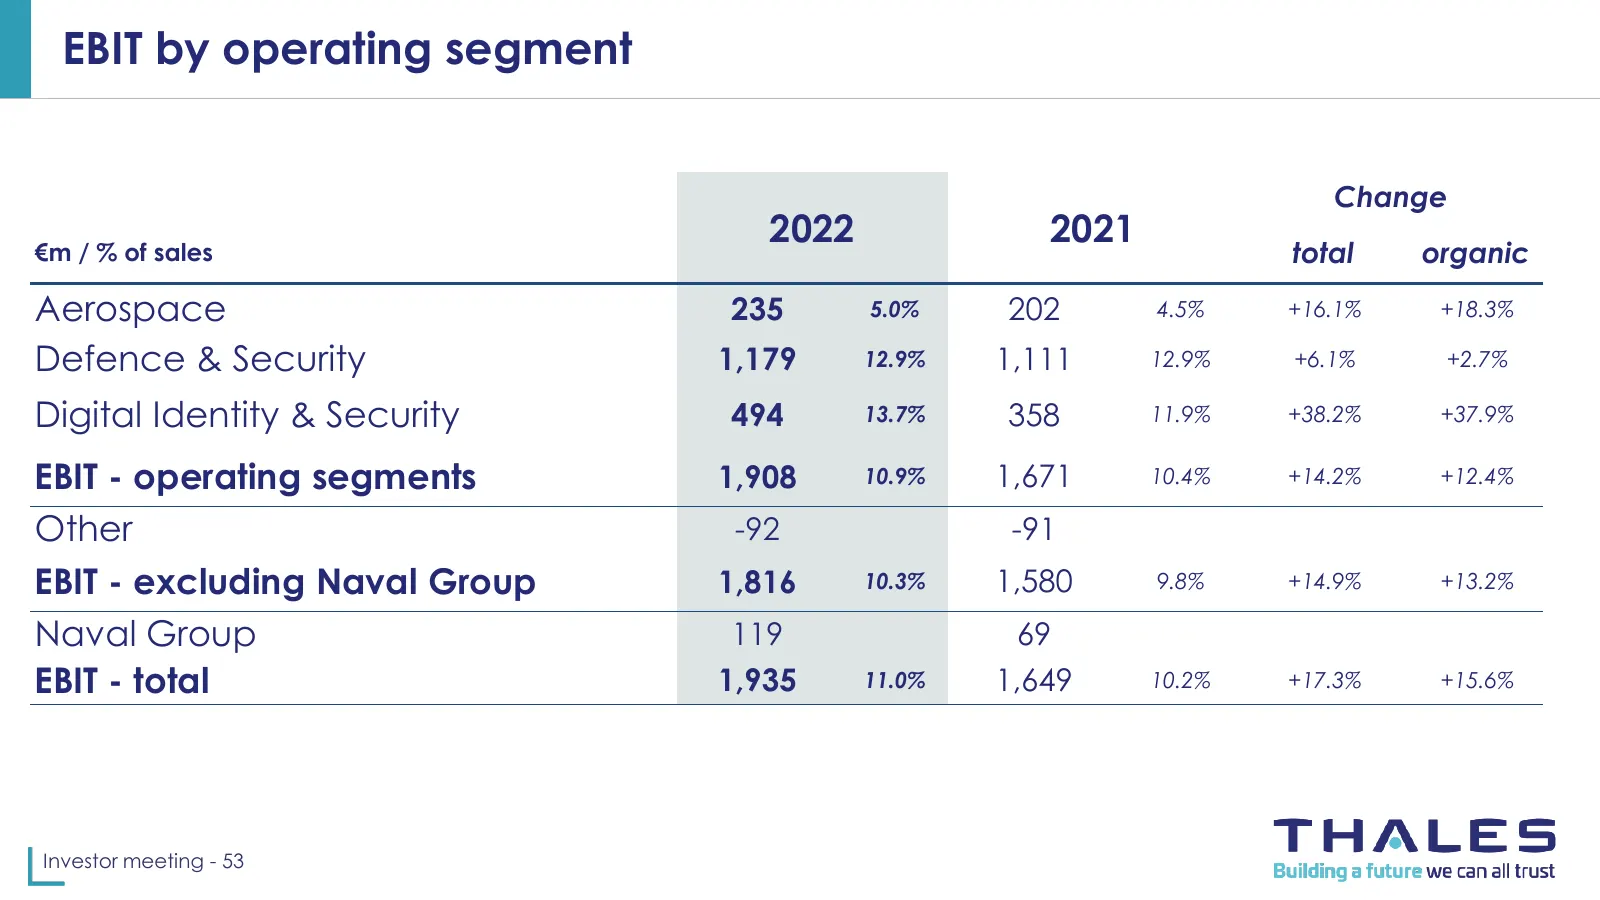
Slide 53: EBIT by operating segment
EBIT by operating segment Change 2022 2021 €m / % of sales total organic Aerospace 235 5.0% 202 4.5% +16.1% +18.3% Defence & Security 1,179 12.9% 1,111 12.9% +6.1% +2.7% Digital Identity & Security 494 13.7% 358 11.9% +38.2% +37.9% EBIT - operating segments 1,908 10.9% 1,671 10.4% +14.2% +12.4% Othe
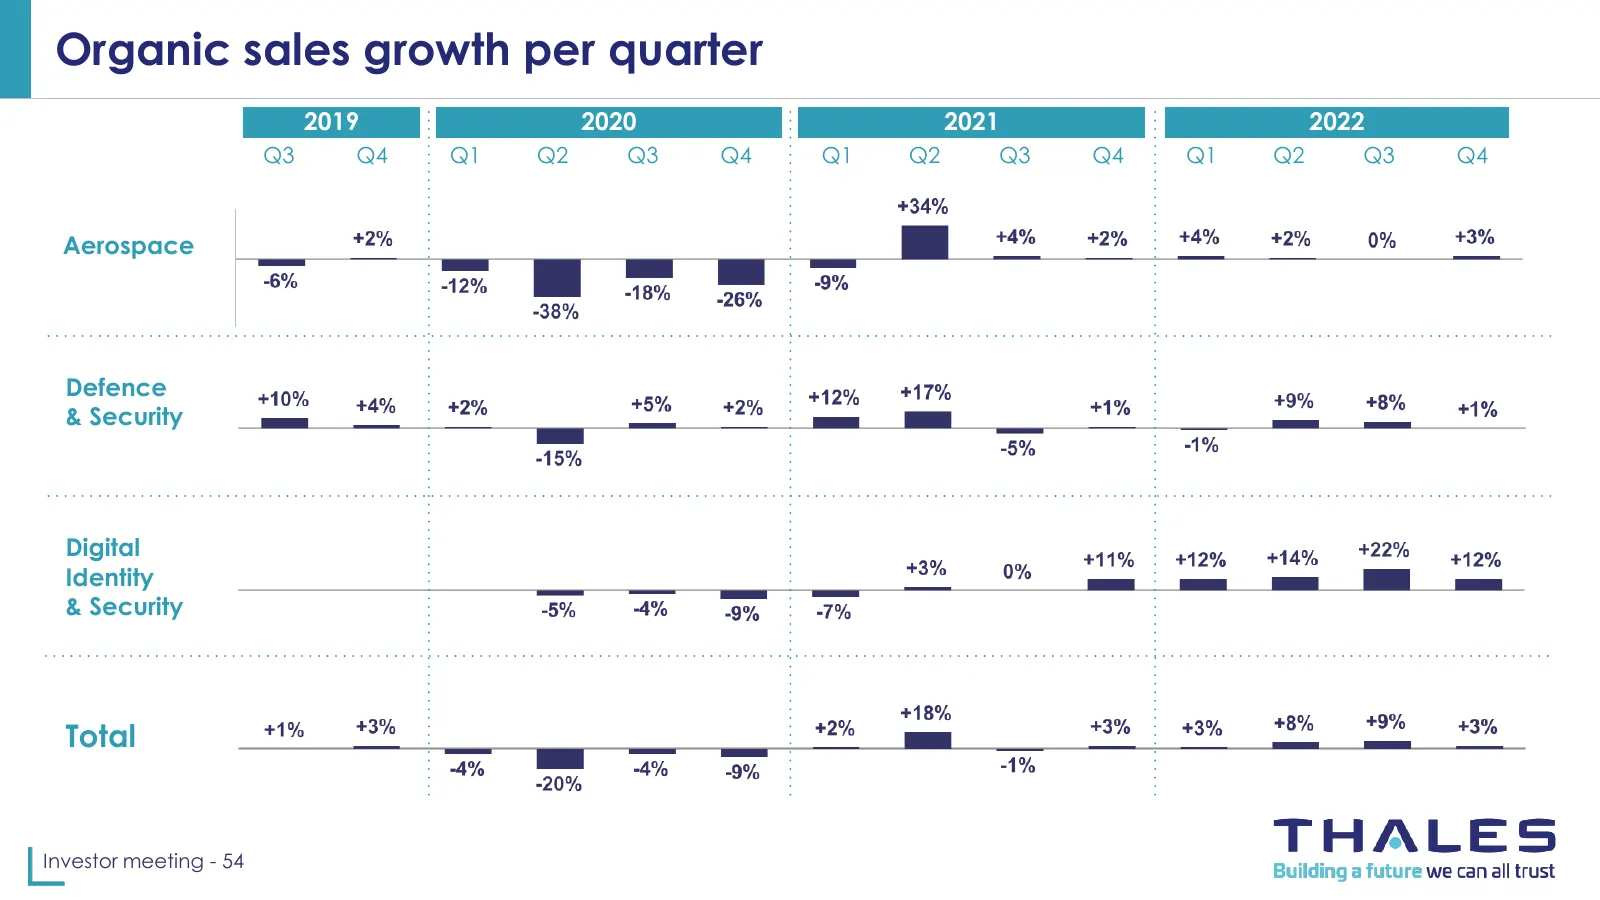
Slide 54: Organic sales growth per quarter
Organic sales growth per quarter 2019 2020 2018 2021 2019 2022 Q3 Q4 Q1 Q2 Q3 Q4 Q1 Q2 Q3 Q4 Q1 Q2 Q3 Q4 Aerospace Defence & Security Digital Identity & Security Total Investor meeting - 54
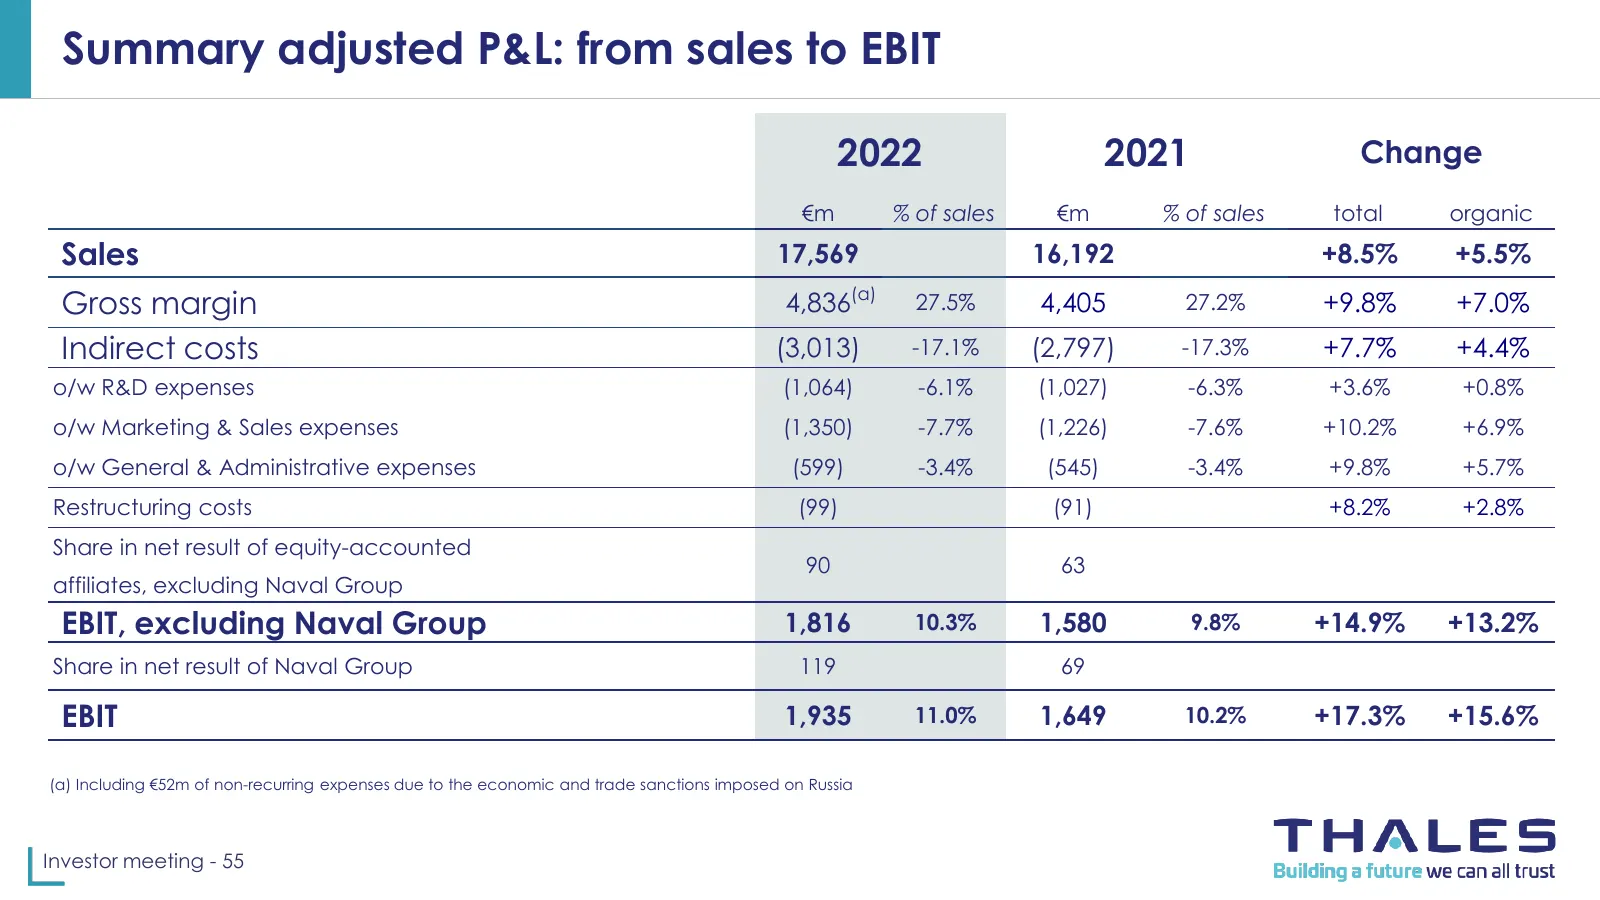
Slide 55: Summary adjusted P&L: from sales to EBIT
Summary adjusted P&L: from sales to EBIT 2022 2021 Change €m % of sales €m % of sales total organic Sales 17,569 16,192 +8.5% +5.5% Gross margin 4,836(a) 27.5% 4,405 27.2% +9.8% +7.0% Indirect costs (3,013) -17.1% (2,797) -17.3% +7.7% +4.4% o/w R&D expenses (1,064) -6.1% (1,027) -6.3% +3.6% +0.8% o/
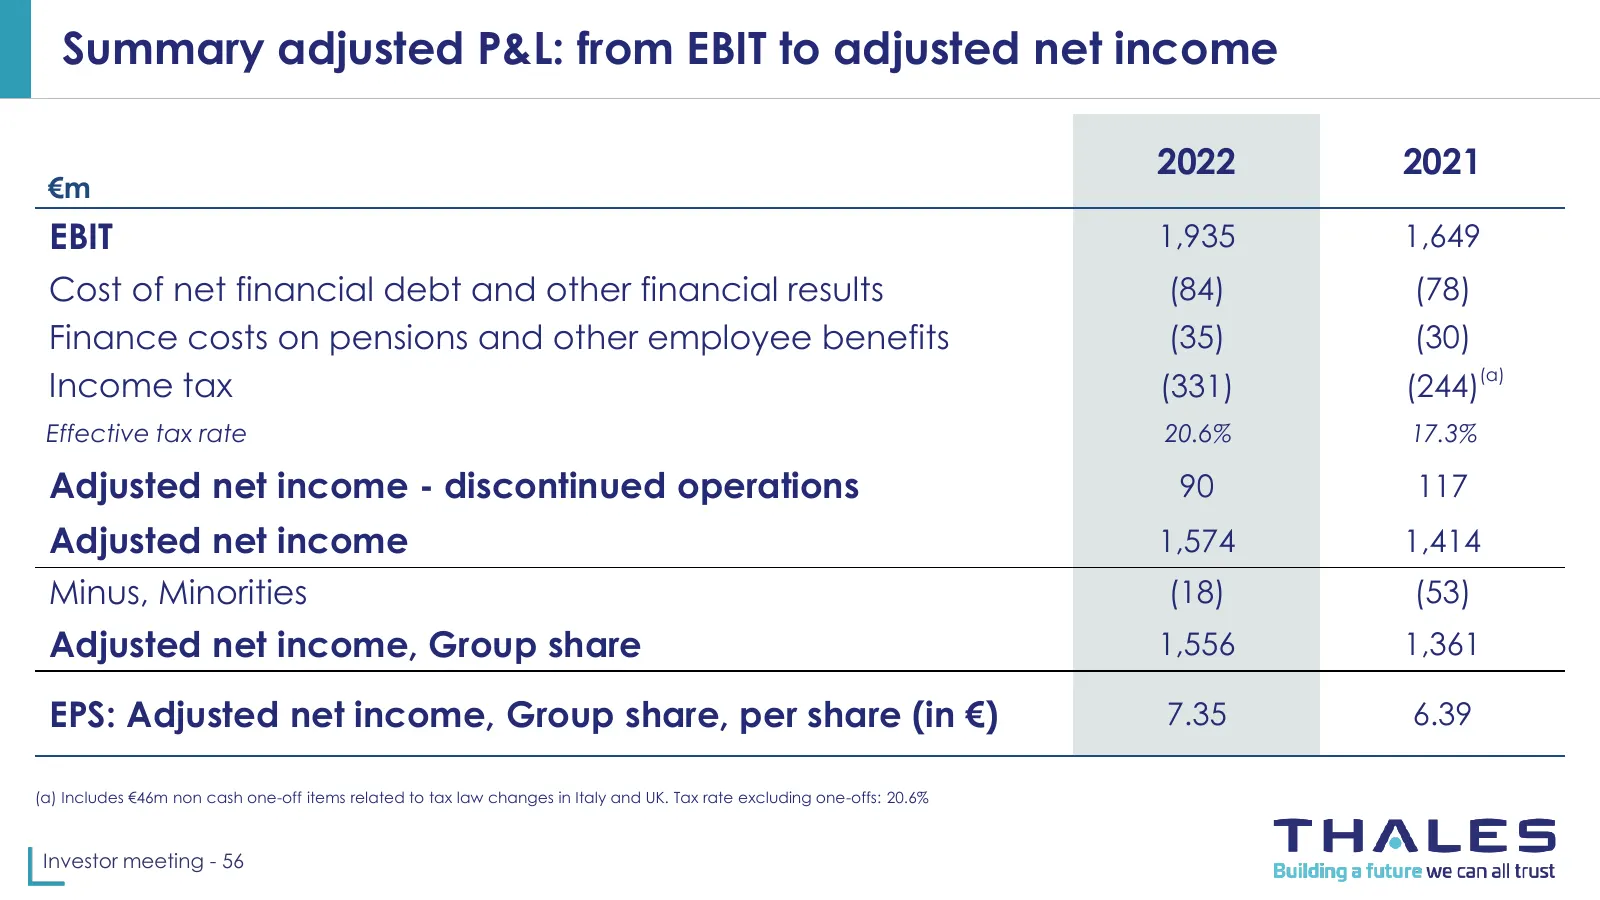
Slide 56: Summary adjusted P&L: from EBIT to adjusted net income
Summary adjusted P&L: from EBIT to adjusted net income 2022 2021 €m EBIT 1,935 1,649 Cost of net financial debt and other financial results (84) (78) Finance costs on pensions and other employee benefits (35) (30) Income tax (331) (244)(a) Effective tax rate 20.6% 17.3% Adjusted net income - discont
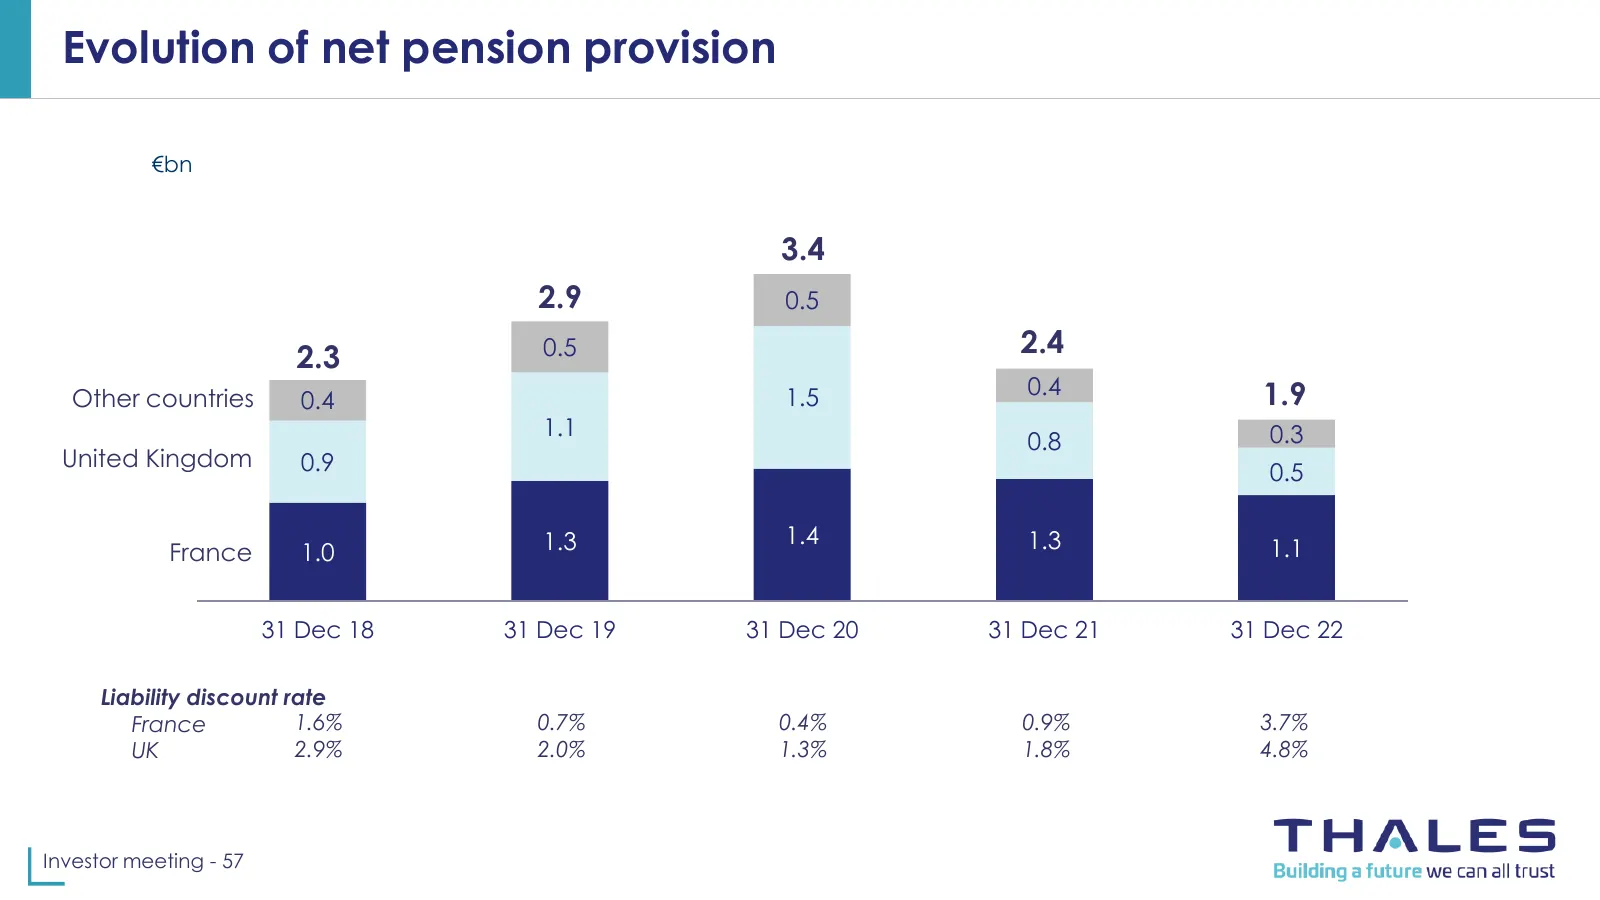
Slide 57: Evolution of net pension provision
Evolution of net pension provision €bn 3.4 2.9 0.5 2.3 0.5 2.4 1.5 0.4 1.9 Other countries 0.4 1.1 0.3 0.8 United Kingdom 0.9 0.5 1.3 1.4 1.3 France 1.0 1.1 31 Dec 18 31 Dec 19 31 Dec 20 31 Dec 21 31 Dec 22 Liability discount rate France 1.6% 0.7% 0.4% 0.9% 3.7% UK 2.9% 2.0% 1.3% 1.8% 4.8% Investor
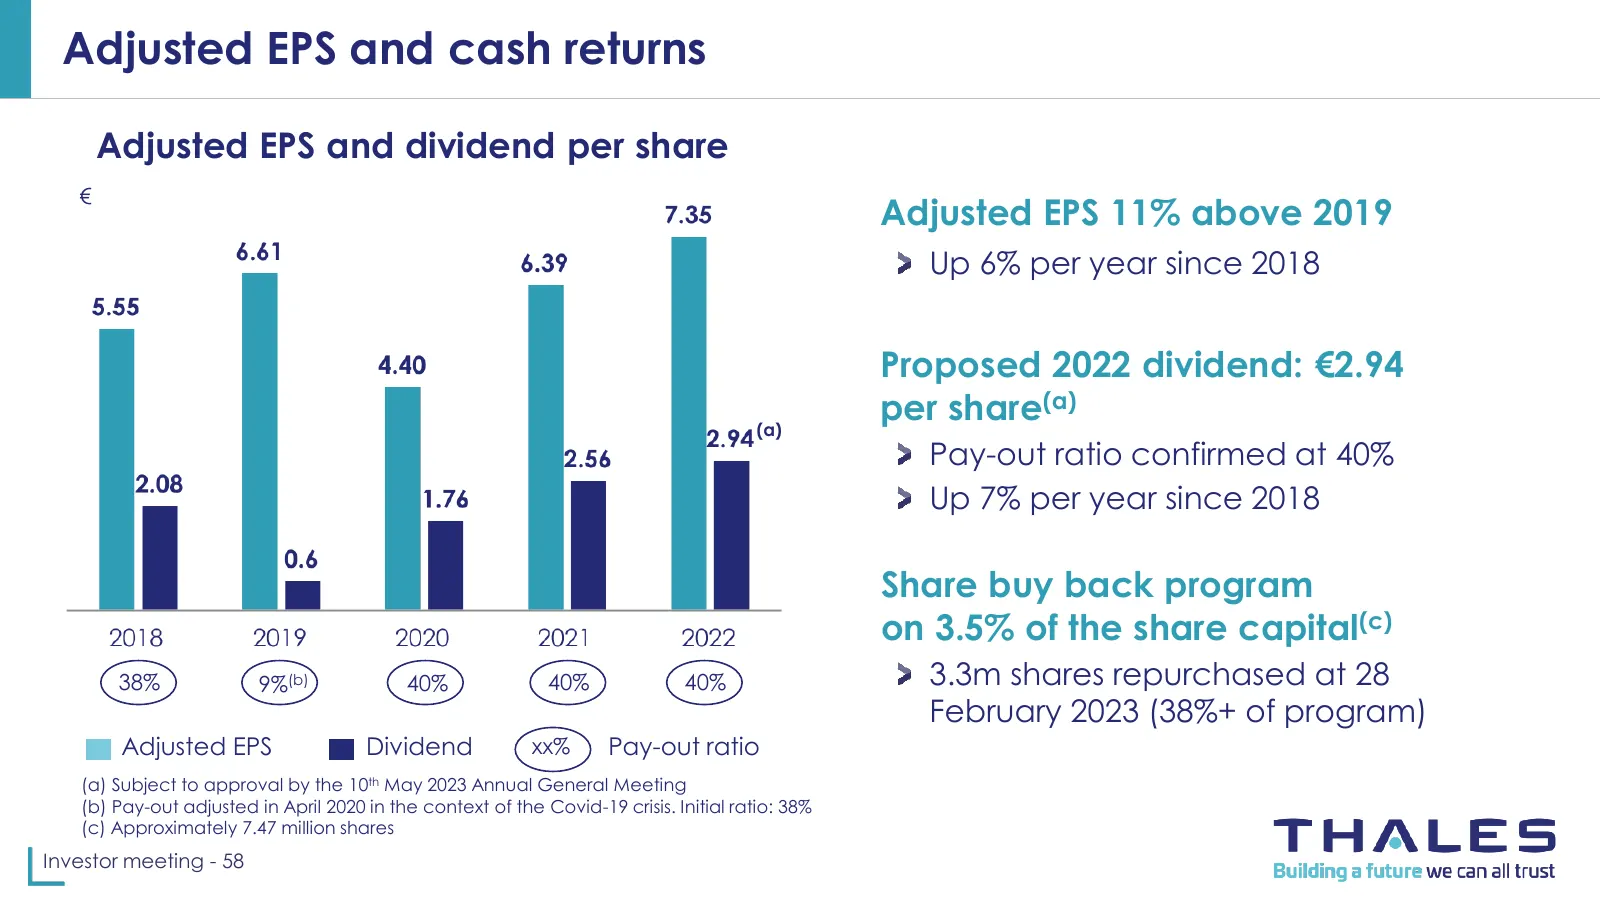
Slide 58: Adjusted EPS and cash returns
Adjusted EPS and cash returns Adjusted EPS and dividend per share € Adjusted EPS 11% above 2019 Up 6% per year since 2018 Proposed 2022 dividend: €2.94 (a) per share(a) Pay-out ratio confirmed at 40% Up 7% per year since 2018 Share buy back program on 3.5% of the share capital(c) 38% 9%(b) 40% 40% 4
Slide 59: Movement in net debt over 2022
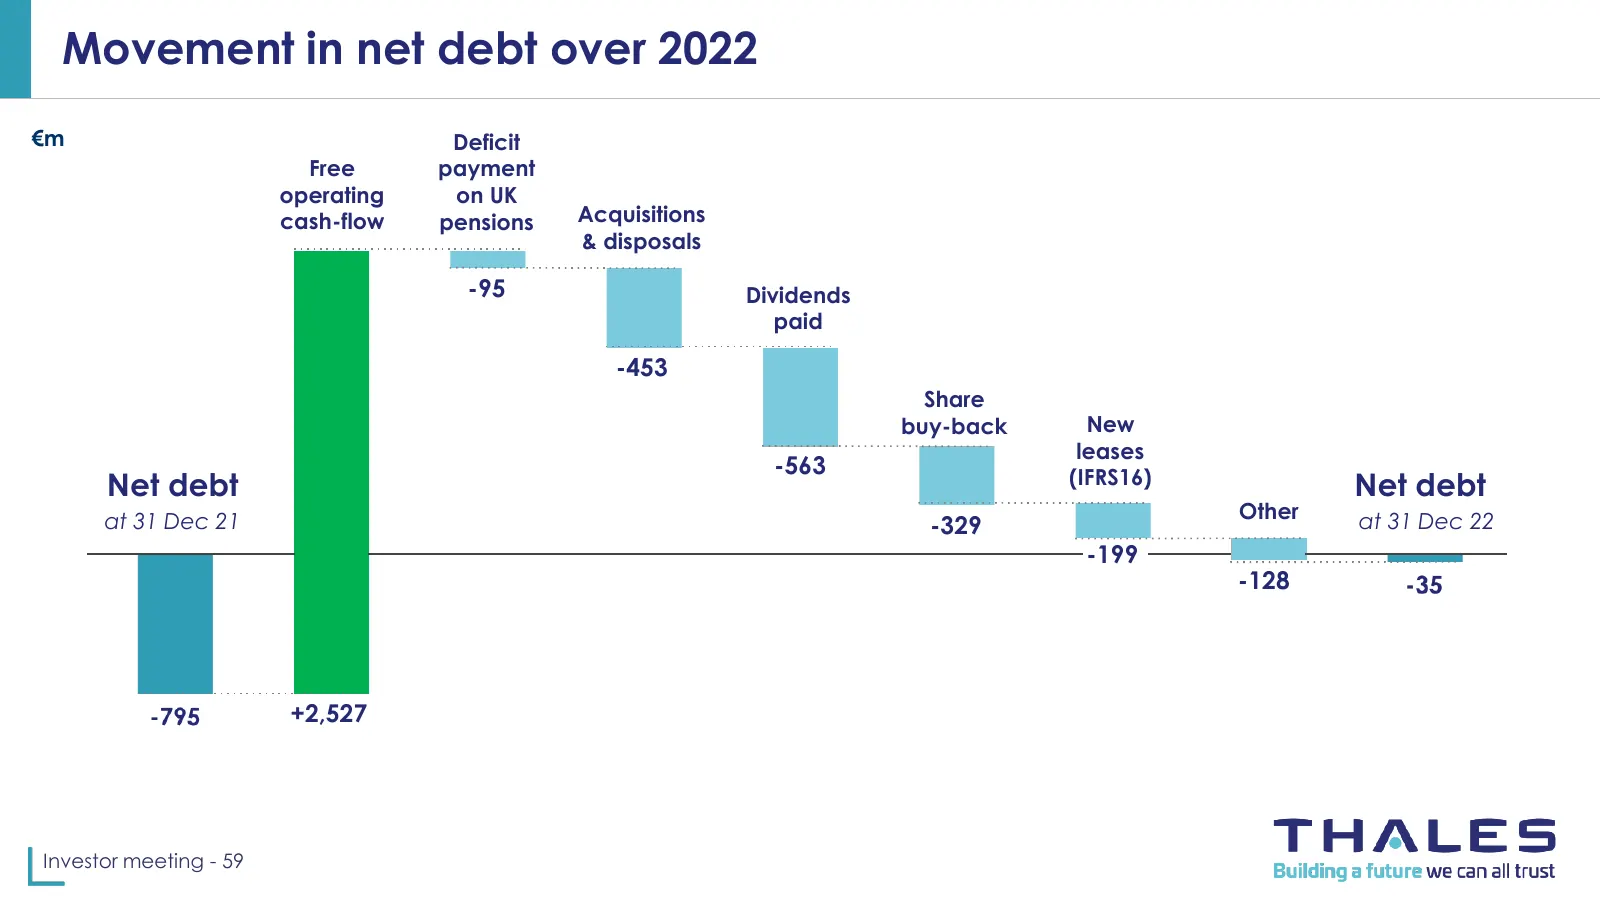
Movement in net debt over 2022 €m Deficit Free payment operating on UK cash-flow pensions Acquisitions & disposals -95 Dividends paid -453 Share buy-back New leases -563 (IFRS16) Net debt Net debt at 31 Dec 21 Other at 31 Dec 22 -329 -199 -128 +2,527 Investor meeting - 59
Slide 60: Definition of non-GAAP measures and other remarks
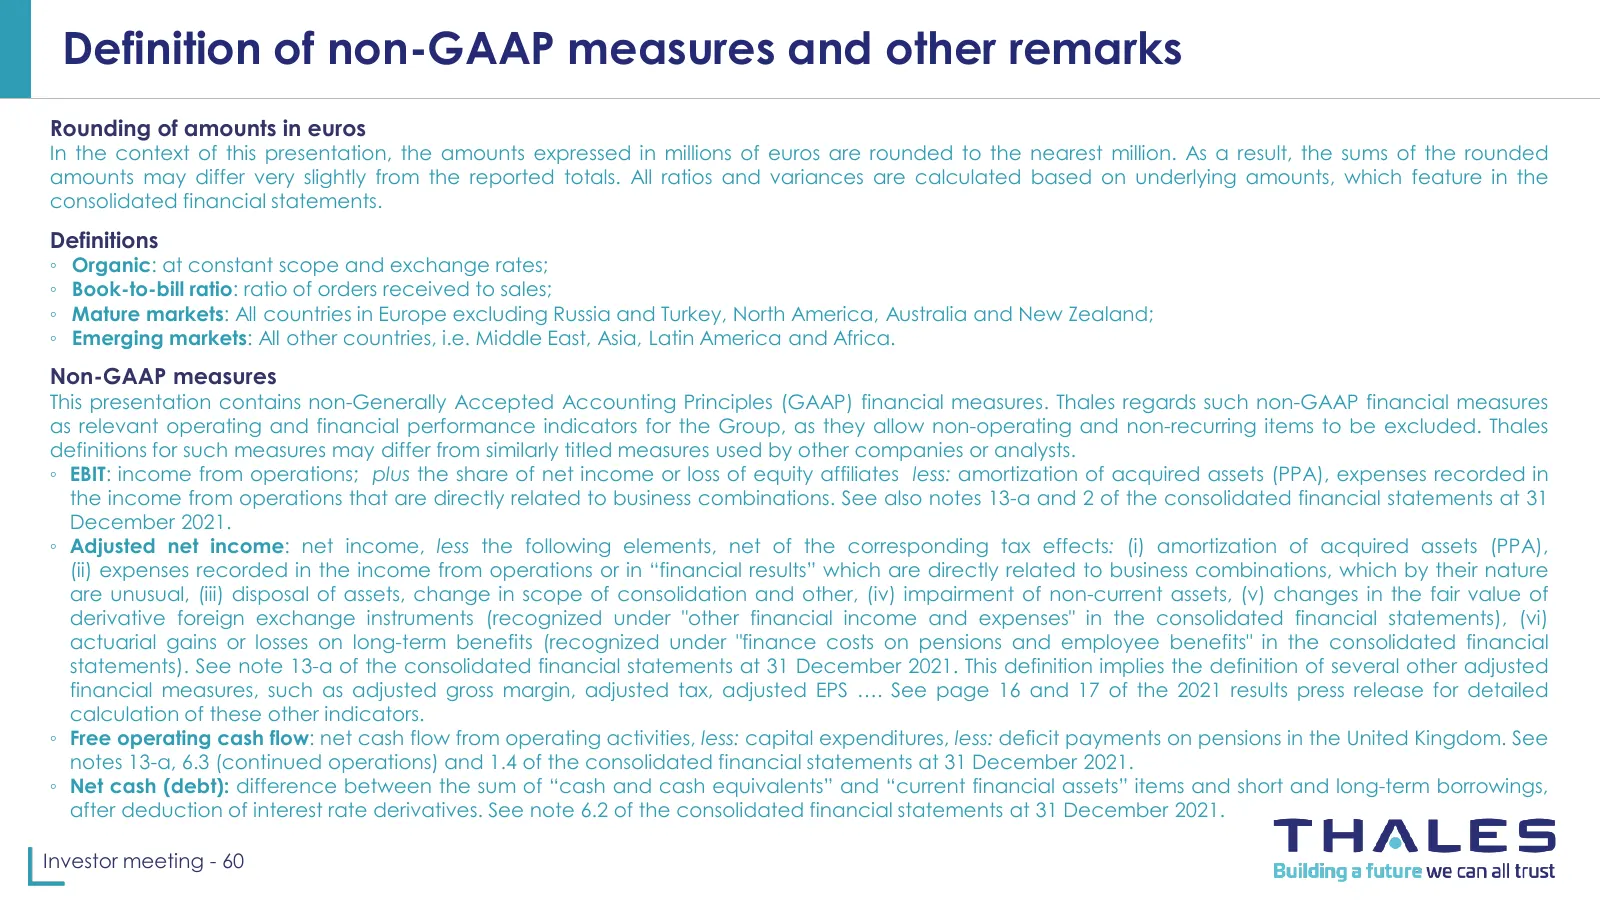
Definition of non-GAAP measures and other remarks Rounding of amounts in euros In the context of this presentation, the amounts expressed in millions of euros are rounded to the nearest million. As a result, the sums of the rounded amounts may differ very slightly from the reported totals. All ratio

Slide 61: Contact and forward-looking statements
Tour Carpe Diem 31 Place des Corolles 92098 Paris La Défense France ir@thalesgroup.com This presentation contains certain forward-looking statements. Although Thales believes that its expectations are based on reasonable assumptions, actual results may differ significantly from these forward-looking
Source: Internet Archive copy of thalesgroup.com
More decks from Thales SA
 Fact Sheet (2026)1 slide · Jul 27, 2026
 H1 2026 Earnings Presentation26 slides · Jul 23, 2026
 Merger or Acquisition (July 2026)15 slides · Jul 6, 2026
 Investor Presentation (May 2026)66 slides · May 2026
 Q1 2026 Earnings Presentation17 slides · Apr 21, 2026
 FY2025 Earnings Presentation33 slides · Mar 3, 2026