Novelis — Q2 FY2015 Earnings Presentation
18 slides from Novelis's earnings presentation, Nov 10, 2014
Slide 1: Novelis Q2 Fiscal Year 2015 Earnings Conference Call
©2014Novelis Inc. 1 November 10, 2014 Philip Martens President and Chief Executive Officer Steve Fisher Senior Vice President and Chief Financial Officer Novelis Q2 Fiscal Year 2015 Earnings Conference Call Exhibit 99.2
Slide 2: Safe Harbor Statement
©2014Novelis Inc. 2 Safe Harbor Statement Forward-Looking Statements Statements made in this presentation which describe Novelis' intentions, expectations, beliefs or predictions may be forward-looking statements within the meaning of securities laws. Forward-looking statements include statements pr
Slide 3: Business Highlights & Strategy
©2014Novelis Inc. 3 Business Highlights & Strategy
Slide 4: Business Highlights
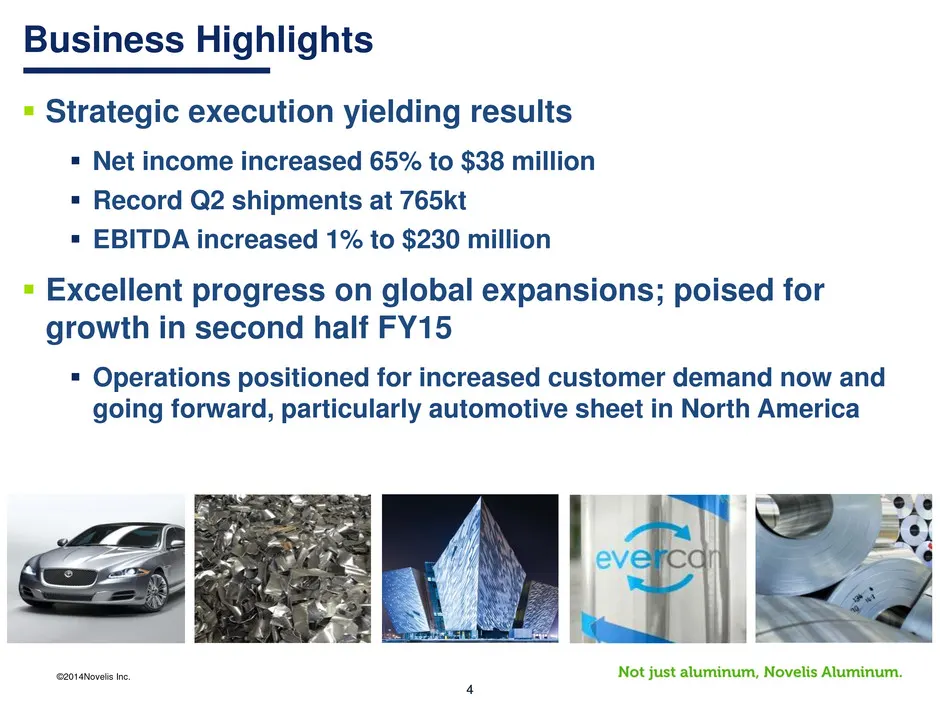
©2014Novelis Inc. 4 Business Highlights Strategic execution yielding results Net income increased 65% to $38 million Record Q2 shipments at 765kt EBITDA increased 1% to $230 million Excellent progress on global expansions; poised for growth in second half FY15 Operations positioned for i
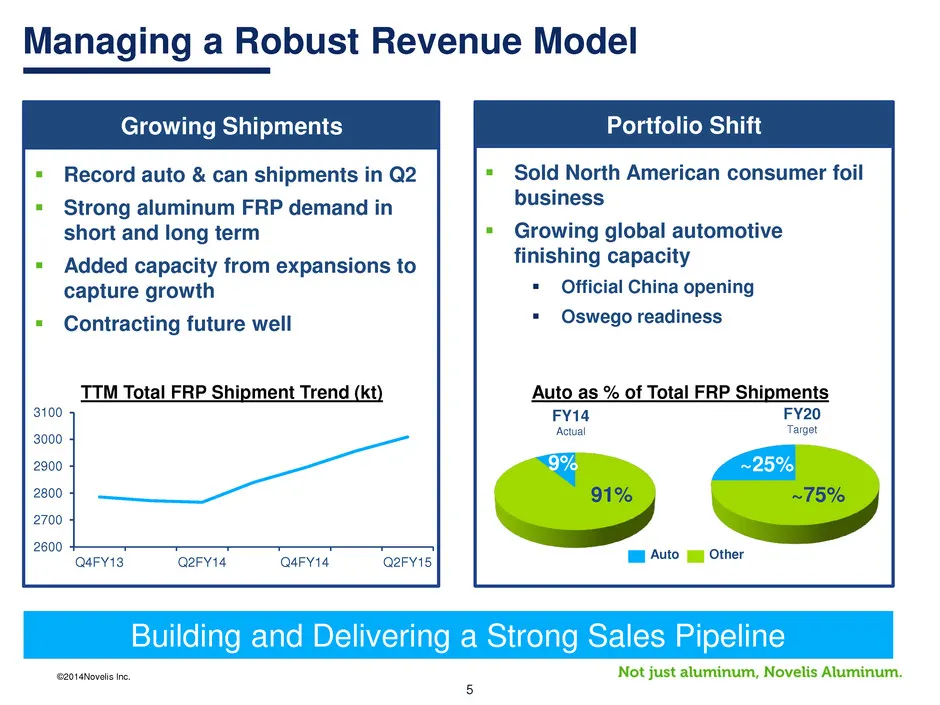
Slide 5: Managing a Robust Revenue Model
©2014Novelis Inc. 5 2600 2700 2800 2900 3000 3100 Q4FY13 Q2FY14 Q4FY14 Q2FY15 Managing a Robust Revenue Model Growing Shipments Record auto & can shipments in Q2 Strong aluminum FRP demand in short and long term Added capacity from expansions to capture growth Contracting future well Portfol
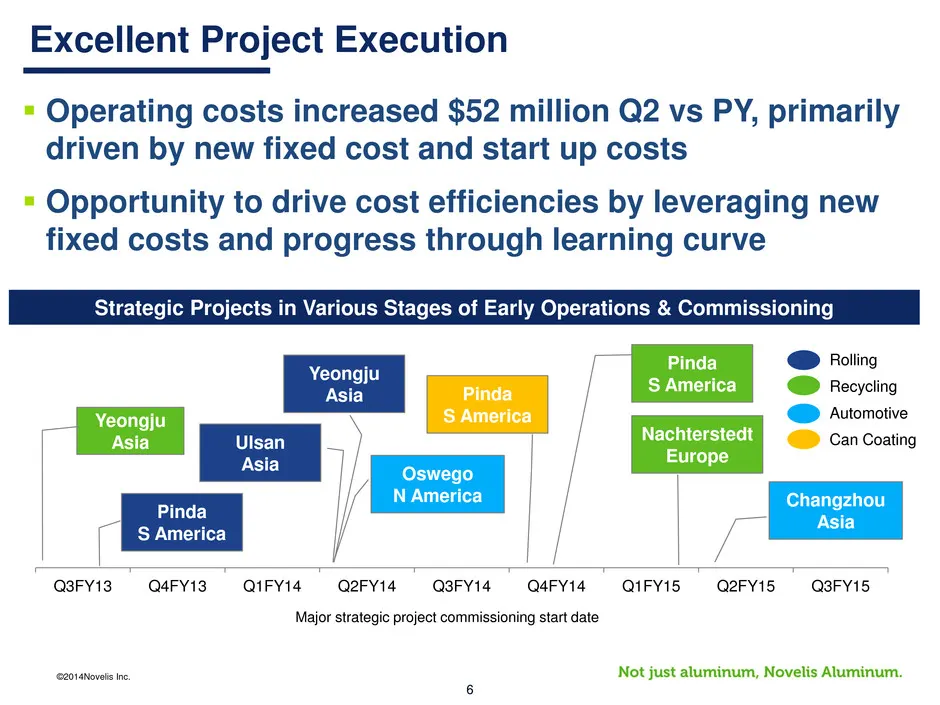
Slide 6: Excellent Project Execution
©2014Novelis Inc. 6 Excellent Project Execution Q3FY13 Q4FY13 Q1FY14 Q2FY14 Q3FY14 Q4FY14 Q1FY15 Q2FY15 Q3FY15 Yeongju Asia Pinda S America Pinda S America Yeongju Asia Ulsan Asia Oswego N America Changzhou Asia Nachterstedt Europe Pinda S America Rolling Recycling Automotive Can Coating Strategic P
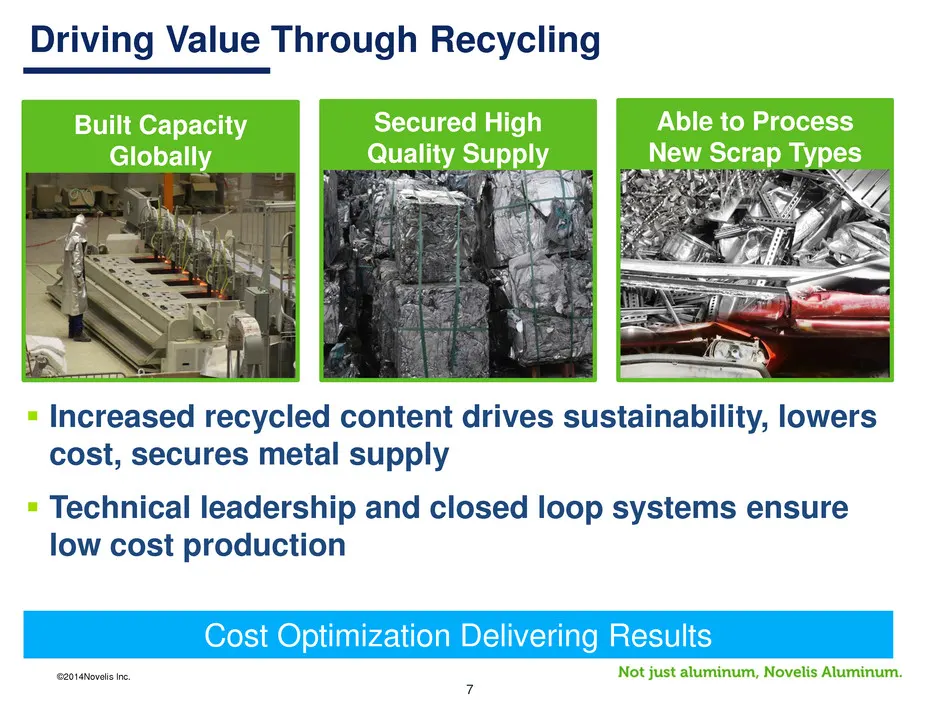
Slide 7: Driving Value Through Recycling
©2014Novelis Inc. 7 Driving Value Through Recycling Secured High Quality Supply Built Capacity Globally Able to Process New Scrap Types Increased recycled content drives sustainability, lowers cost, secures metal supply Technical leadership and closed loop systems ensure low cost production Cost
Slide 8: Q2FY15 Detailed Financial Review
©2014Novelis Inc. 8 Q2FY15 Detailed Financial Review
Slide 9: Second Quarter Highlights
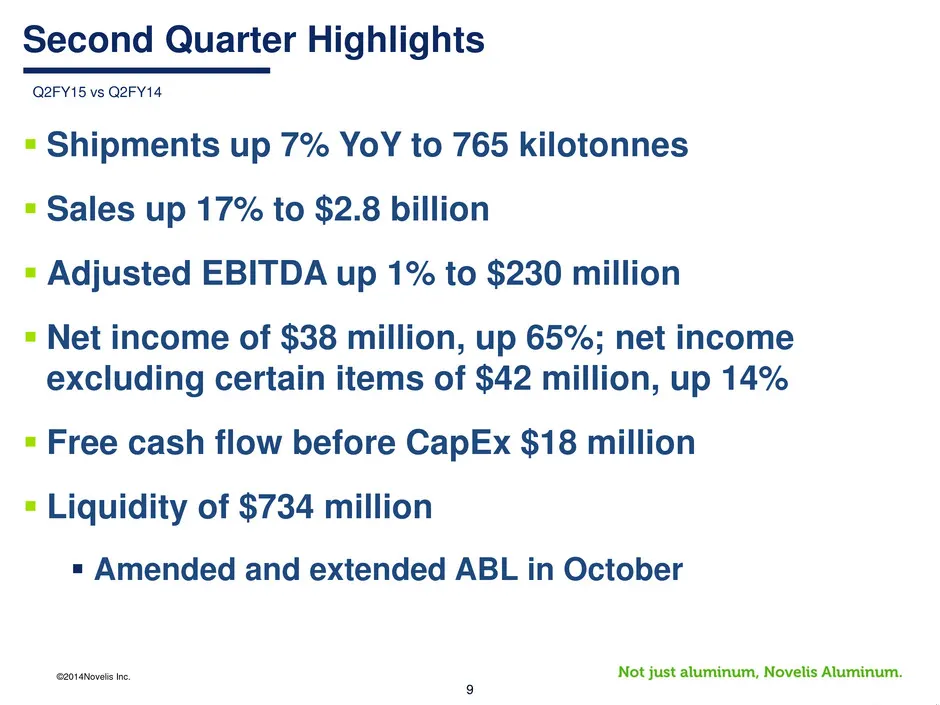
©2014Novelis Inc. 9 Second Quarter Highlights Shipments up 7% YoY to 765 kilotonnes Sales up 17% to $2.8 billion Adjusted EBITDA up 1% to $230 million Net income of $38 million, up 65%; net income excluding certain items of $42 million, up 14% Free cash flow before CapEx $18 million Liqu
Slide 10: Shipments & Sales
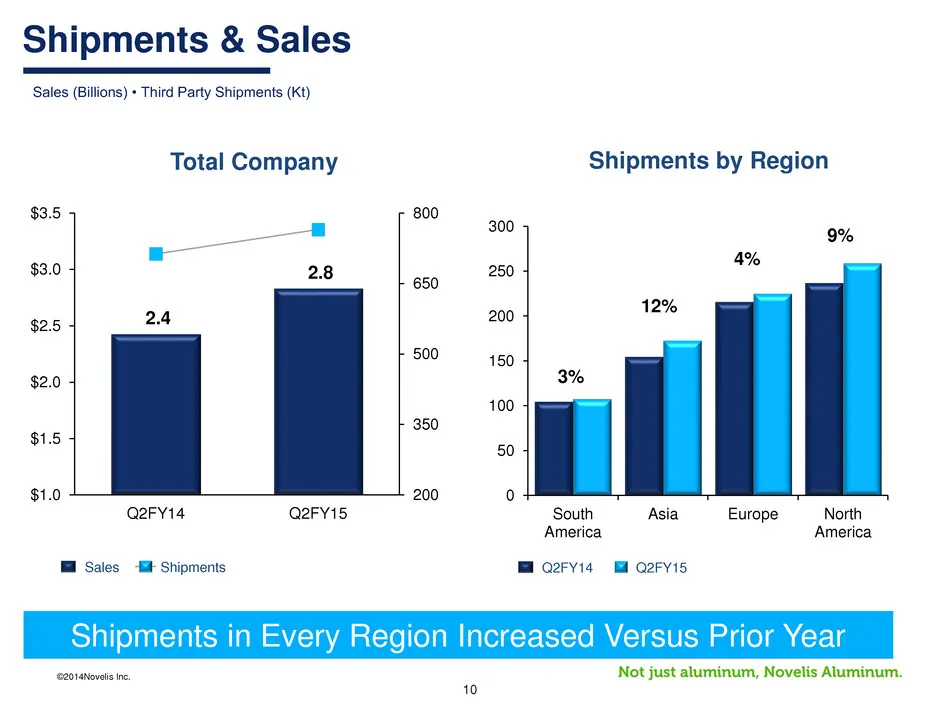
©2014Novelis Inc. 10 2.4 2.8 200 350 500 650 800 $1.0 $1.5 $2.0 $2.5 $3.0 $3.5 Q2FY14 Q2FY15 0 50 100 150 200 250 300 South America Asia Europe North America 12% 4% 9% 3% Sales (Billions) • Third Party Shipments (Kt) Shipments & Sales Shipments Sales Total Company Shipments by Region Shipments in Ev
Slide 11: Q2FY15 Adjusted EBITDA Bridge
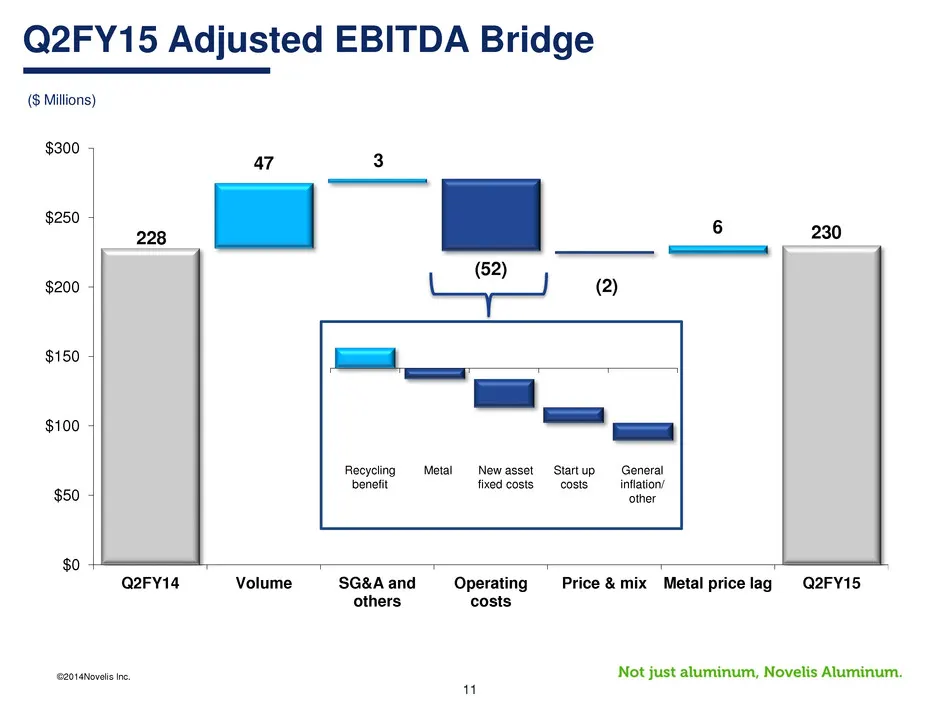
©2014Novelis Inc. 11 Q2FY15 Adjusted EBITDA Bridge ($ Millions) 228 47 3 (52) (2) 6 230 $0 $50 $100 $150 $200 $250 $300 Q2FY14 Volume SG&A and others Operating costs Price & mix Metal price lag Q2FY15 Metal New asset fixed costs Start up costs General inflation/ other Recycling benefit
Slide 12: Capital Expenditures & Free Cash Flow
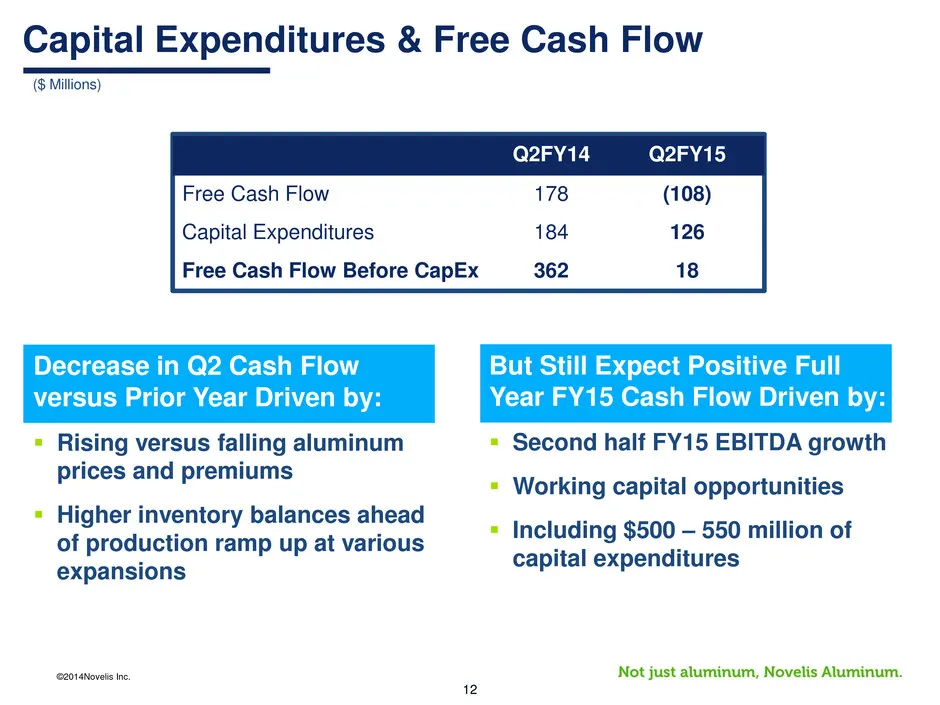
©2014Novelis Inc. 12 ($ Millions) Capital Expenditures & Free Cash Flow Q2FY14 Q2FY15 Free Cash Flow 178 (108) Capital Expenditures 184 126 Free Cash Flow Before CapEx 362 18 Decrease in Q2 Cash Flow versus Prior Year Driven by: Rising versus falling aluminum prices and premiums Higher inventory

Slide 13: Summary
©2014Novelis Inc. 13 Summary
Slide 14: Summary
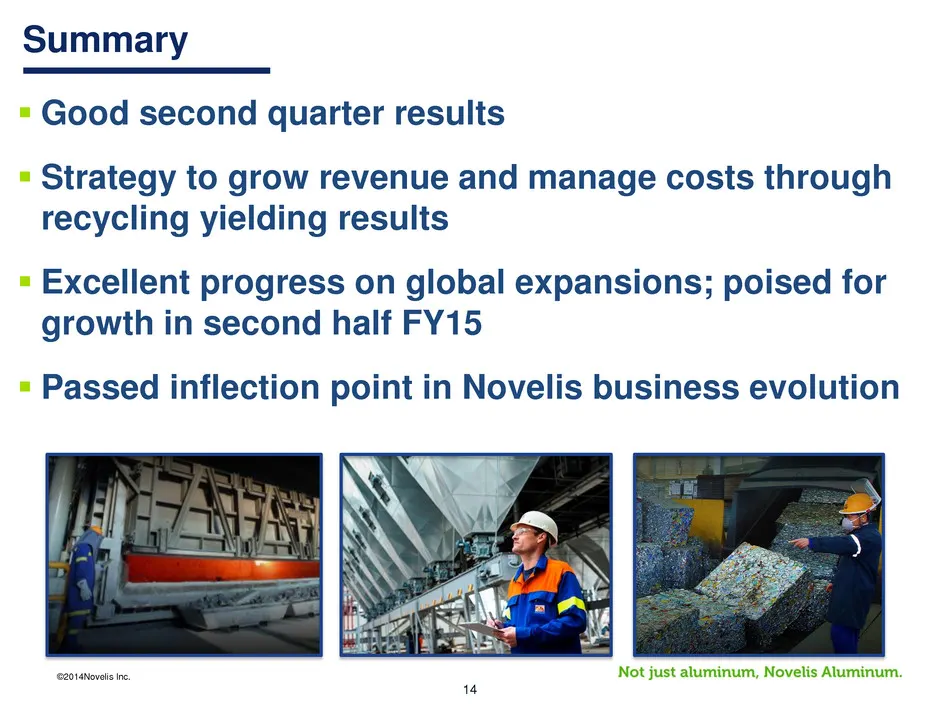
©2014Novelis Inc. 14 Good second quarter results Strategy to grow revenue and manage costs through recycling yielding results Excellent progress on global expansions; poised for growth in second half FY15 Passed inflection point in Novelis business evolution Summary

Slide 15: Questions & Answers
©2014Novelis Inc. 15 Questions & Answers

Slide 16: Appendix
©2014Novelis Inc. 16 Appendix
Slide 17: Adjusted EBITDA Reconciliation
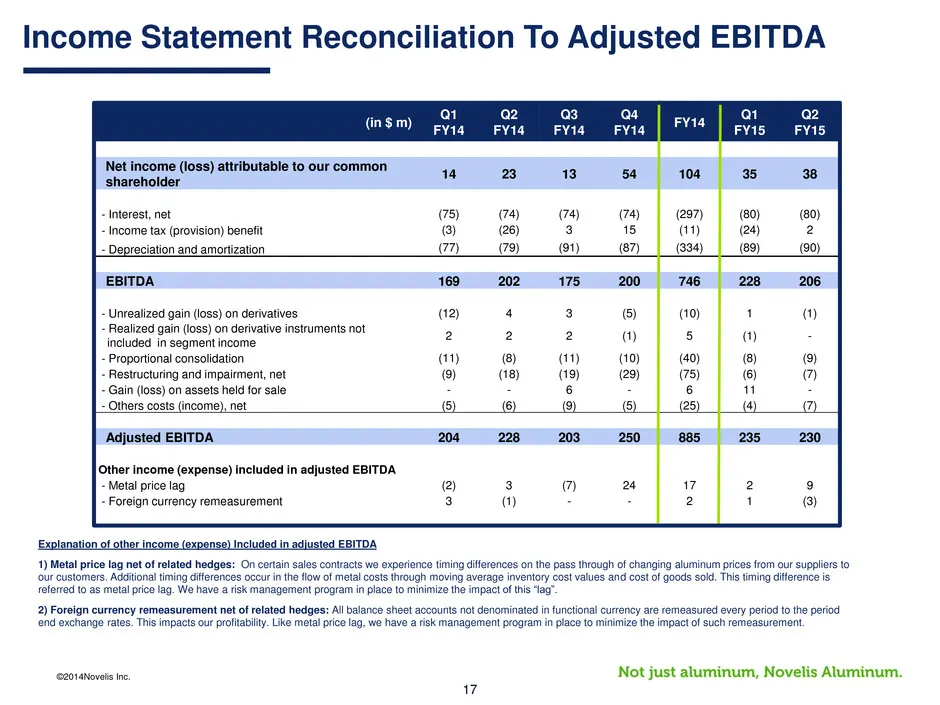
©2014Novelis Inc. 17 (in $ m) Q1 FY14 Q2 FY14 Q3 FY14 Q4 FY14 FY14 Q1 FY15 Q2 FY15 Net income (loss) attributable to our common shareholder 14 23 13 54 104 35 38 - Interest, net (75) (74) (74) (74) (297) (80) (80) - Income tax (provision) benefit (3) (26) 3 15 (11) (24) 2 - Depreciation and amortiza
Slide 18: Free Cash Flow Reconciliation
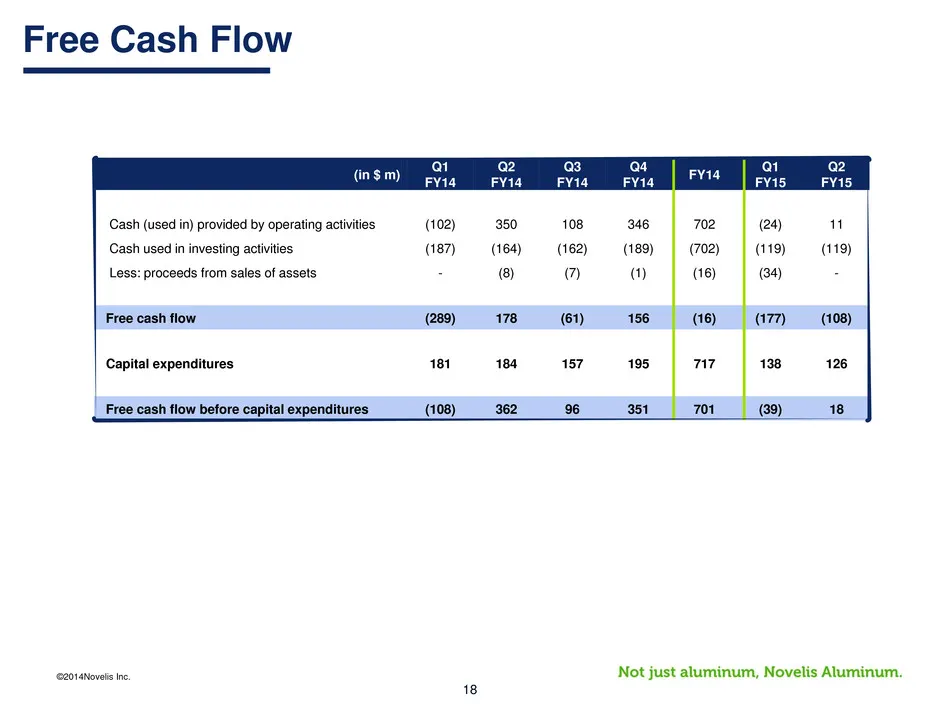
©2014Novelis Inc. 18 (in $ m) Q1 FY14 Q2 FY14 Q3 FY14 Q4 FY14 FY14 Q1 FY15 Q2 FY15 Cash (used in) provided by operating activities (102) 350 108 346 702 (24) 11 Cash used in investing activities (187) (164) (162) (189) (702) (119) (119) Less: proceeds from sales of assets - (8) (7) (1) (16) (34) - F
Source: SEC EDGAR · 8-K filed Nov 10, 2014
More decks from Novelis Inc.
 Q2 FY2027 Earnings Presentation20 slides · Nov 5, 2026
 Q2 FY2027 Earnings Presentation31 slides · Nov 5, 2026
 Q1 FY2027 Earnings Presentation21 slides · Aug 5, 2026
 Q1 FY2027 Earnings Presentation31 slides · Aug 5, 2026
 Q4 FY2026 Earnings Presentation33 slides · May 19, 2026
 Q3 FY2026 Earnings Presentation33 slides · Feb 11, 2026