Novelis — Q1 FY2027 Earnings Presentation
21 slides from Novelis's earnings presentation, Aug 5, 2026
Slide 1: Novelis Q1 Fiscal Year 2027 Earnings Presentation
Novelis Q1 Fiscal Year 2027 Earnings Presentation August 5, 2026 Steve Fisher President and Chief Executive Officer Dev Ahuja Executive Vice President and Chief Financial Officer
Slide 2: Safe Harbor Statement
Safe Harbor Statement Forward-looking statements Statements made in this presentation which describe Novelis' intentions, expectations, beliefs or predictions may be forward-looking within the meaning of securities laws. Forward-looking statements include statements preceded by, followed by, or incl
Slide 3: Recent highlights
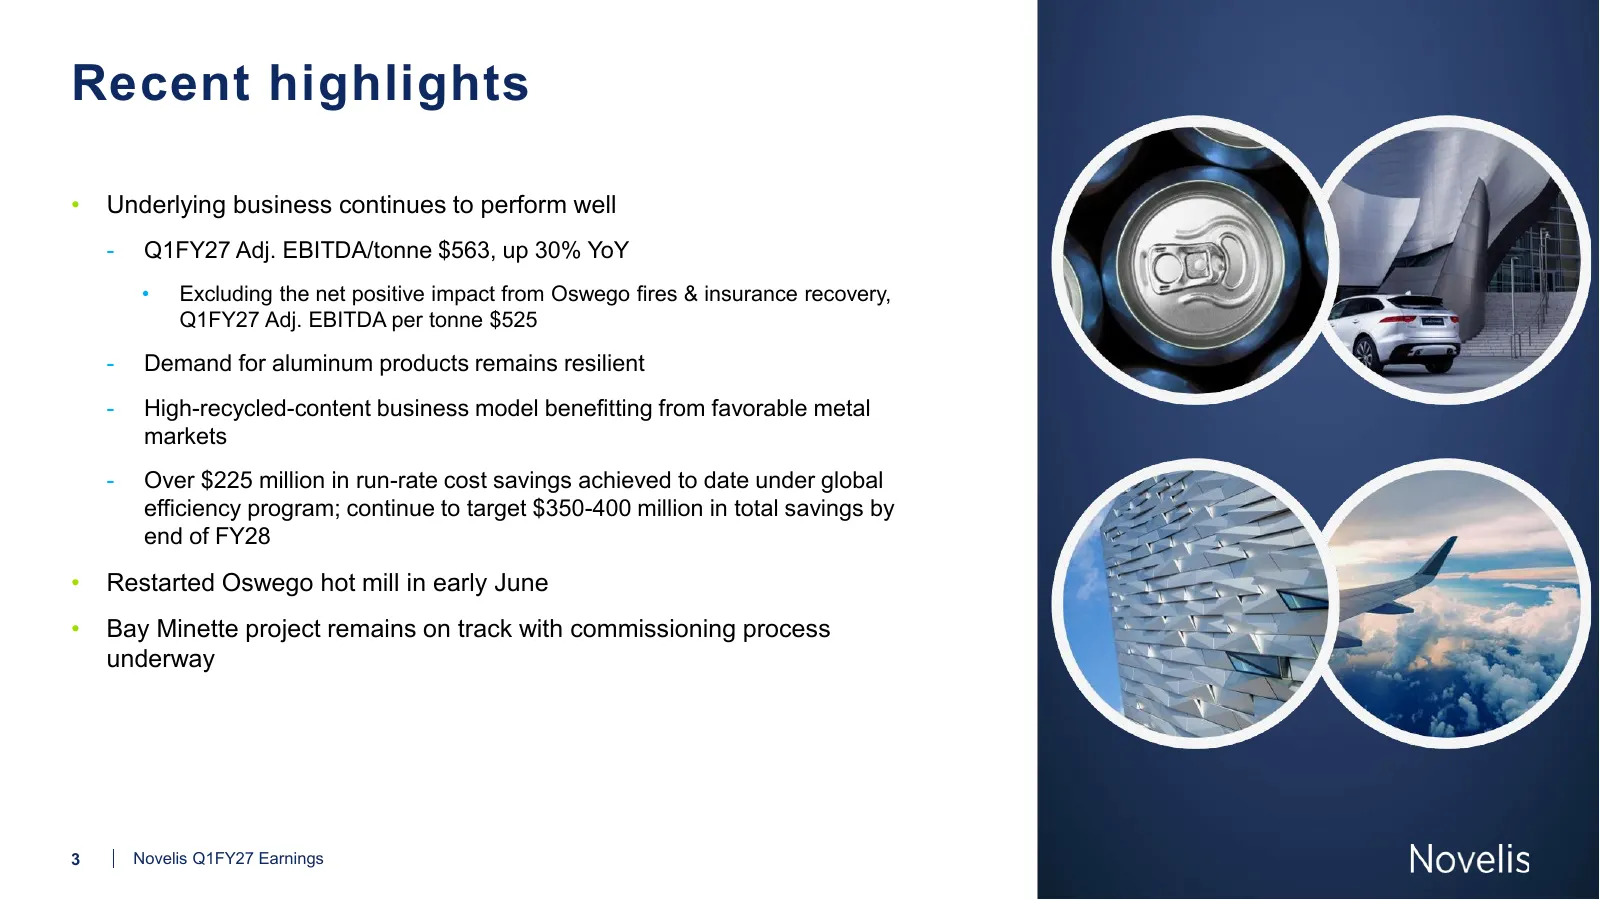
Recent highlights • Underlying business continues to perform well - Q1FY27 Adj. EBITDA/tonne $563, up 30% YoY • Excluding the net positive impact from Oswego fires & insurance recovery, Q1FY27 Adj. EBITDA per tonne $525 - Demand for aluminum products remains resilient - High-recycled-content busines
Slide 4: Oswego, NY, U.S. plant restart
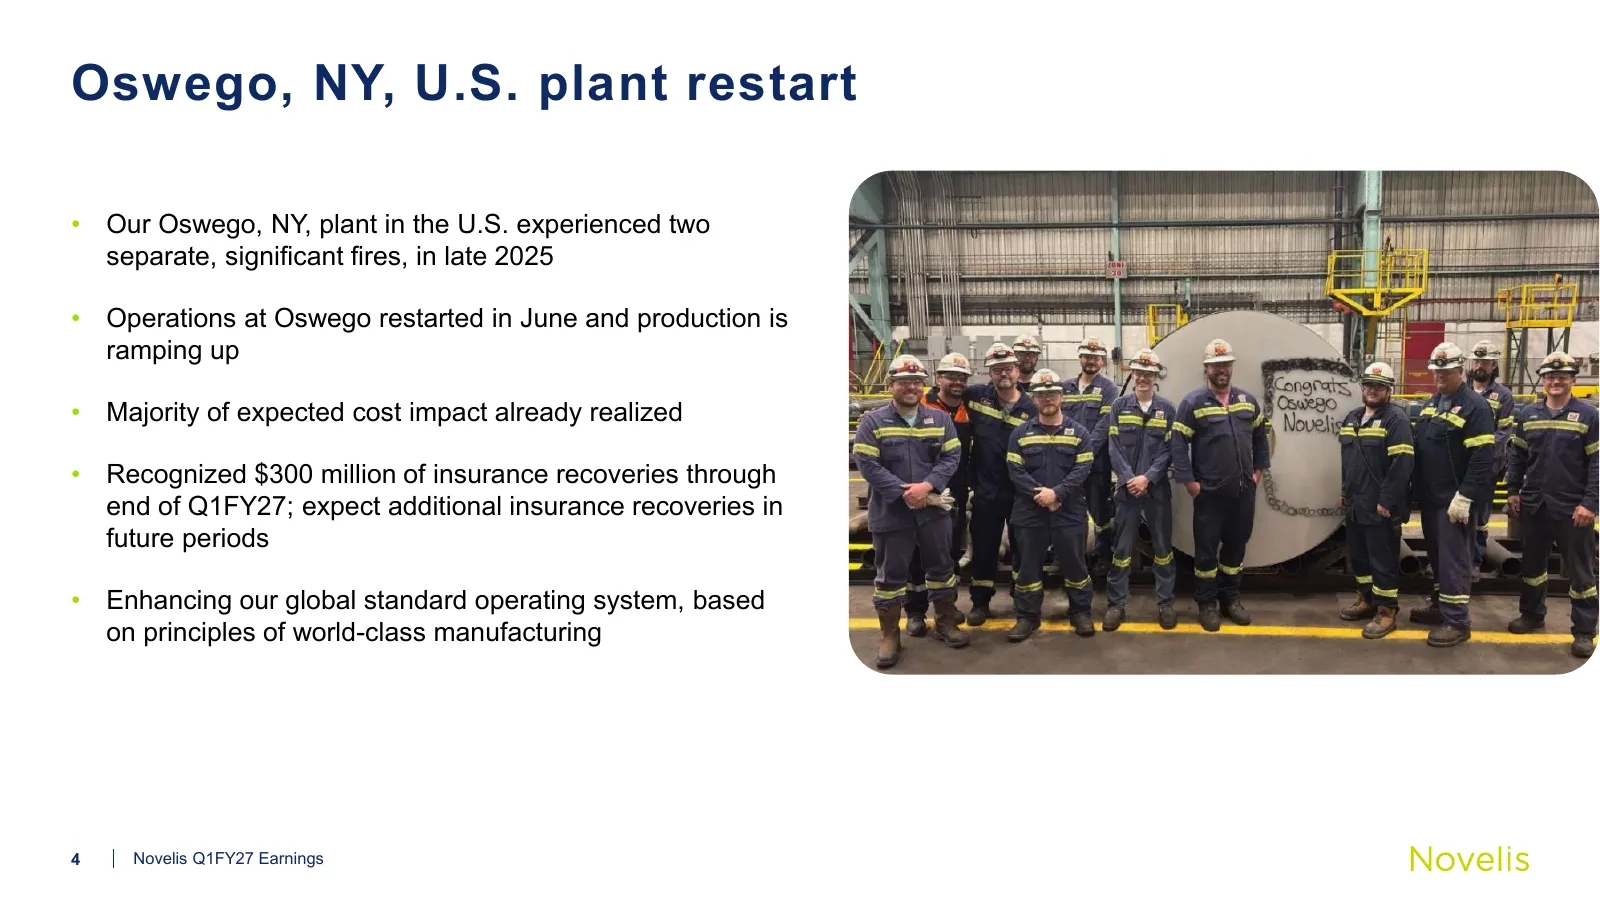
Oswego, NY, U.S. plant restart • Our Oswego, NY, plant in the U.S. experienced two separate, significant fires, in late 2025 • Operations at Oswego restarted in June and production is ramping up • Majority of expected cost impact already realized • Recognized $300 million of insurance recoveries thr
Slide 5: Financial Highlights
Financial Highlights 5
Slide 6: Q1 Financial Highlights
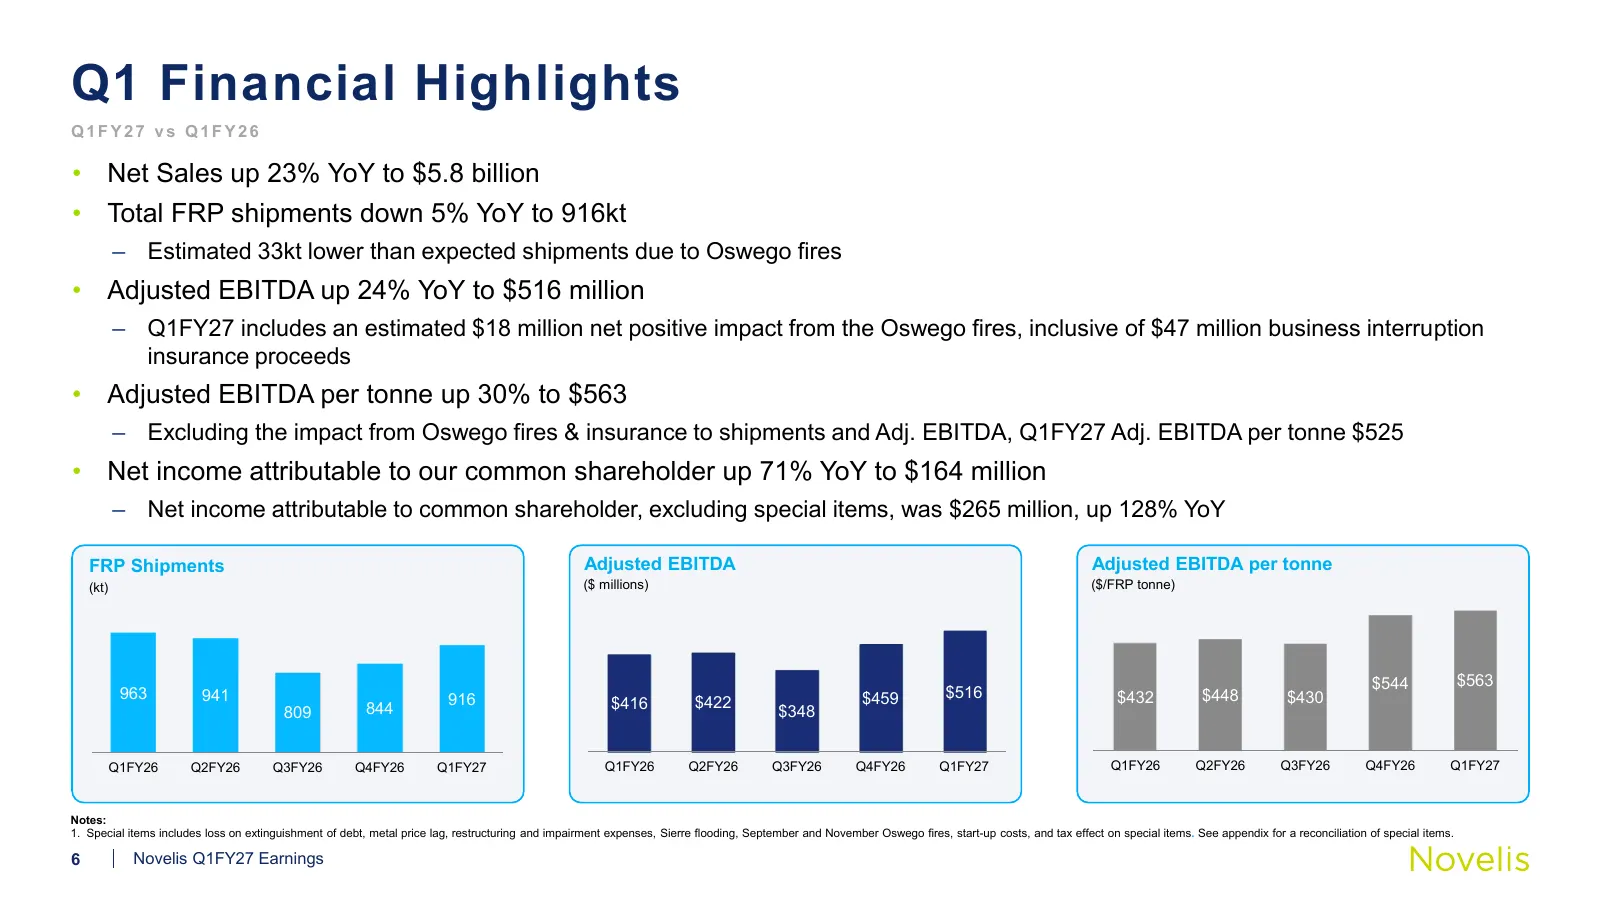
Q1 Financial Highlights Q1FY27 vs Q1FY26 • Net Sales up 23% YoY to $5.8 billion • Total FRP shipments down 5% YoY to 916kt – Estimated 33kt lower than expected shipments due to Oswego fires • Adjusted EBITDA up 24% YoY to $516 million – Q1FY27 includes an estimated $18 million net positive impact fr
Slide 7: Q1 Adjusted EBITDA Bridge vs. prior year
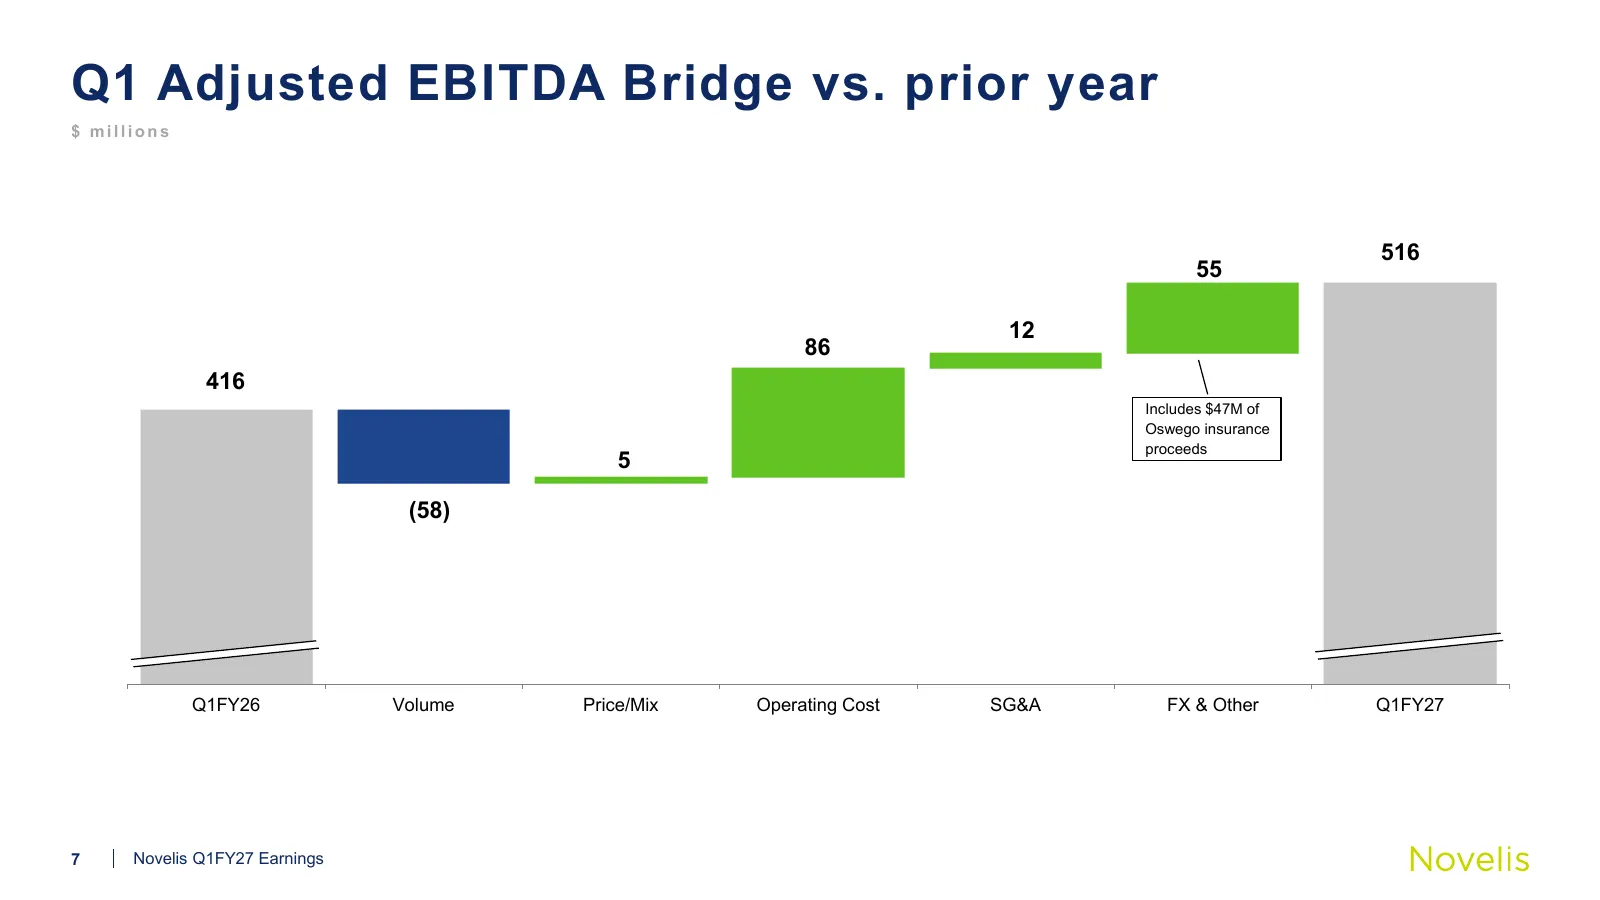
Q1 Adjusted EBITDA Bridge vs. prior year $ millions 516 55 12 86 416 Includes $47M of Oswego insurance proceeds 5 (58) Q1FY26 Volume Price/Mix Operating Cost SG&A FX & Other Q1FY27 7 Novelis Q1FY27 Earnings
Slide 8: Q1 Segment Results
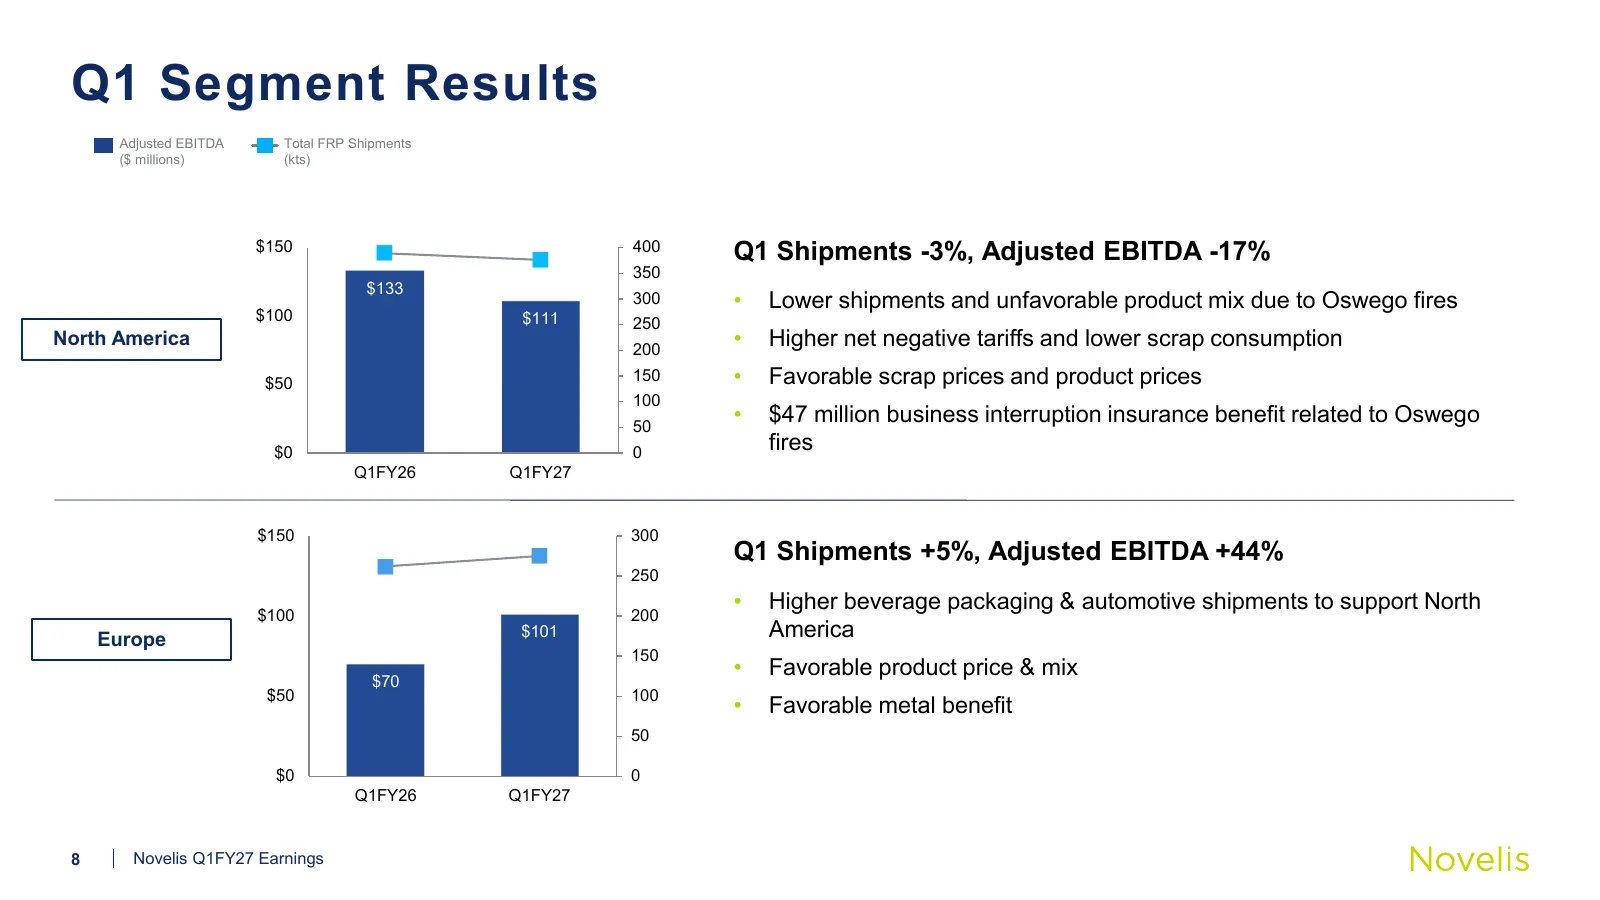
Q1 Segment Results Adjusted EBITDA Total FRP Shipments ($ millions) (kts) $150 400 Q1 Shipments -3%, Adjusted EBITDA -17% 350 $133 300 • Lower shipments and unfavorable product mix due to Oswego fires $100 $111 250 North America 200 • Higher net negative tariffs and lower scrap consumption $50 150 •
Slide 9: Q1 Segment Results
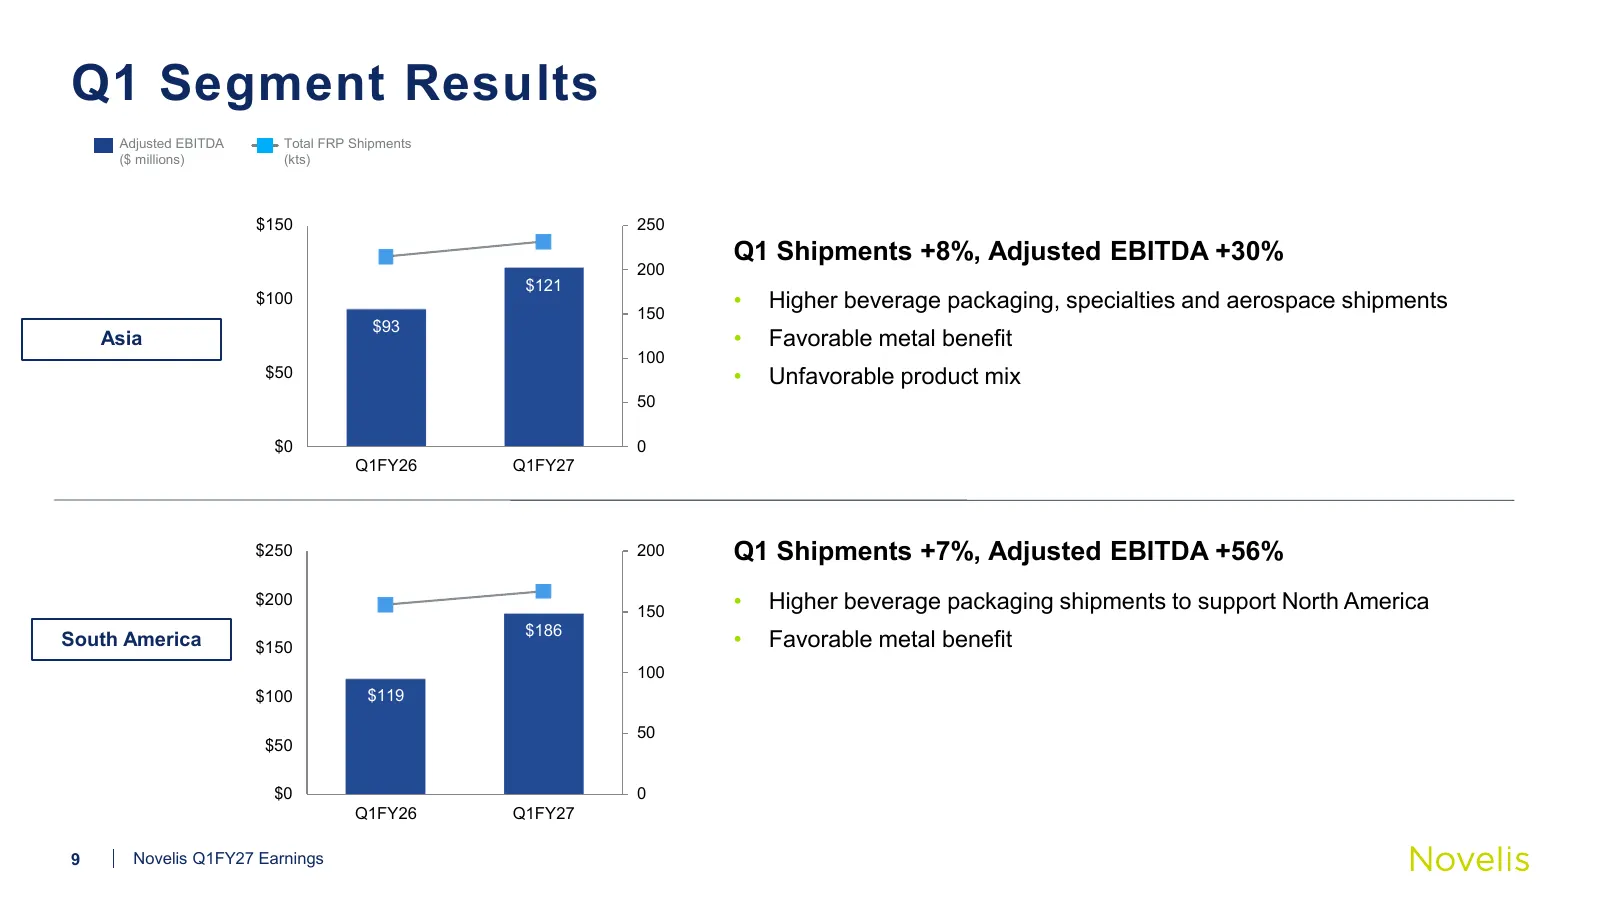
Q1 Segment Results Adjusted EBITDA Total FRP Shipments ($ millions) (kts) $150 250 Q1 Shipments +8%, Adjusted EBITDA +30% 200 $121 $100 150 • Higher beverage packaging, specialties and aerospace shipments $93 Asia • Favorable metal benefit 100 $50 • Unfavorable product mix 50 $0 0 Q1FY26 Q1FY27 $250
Slide 10: Structural cost-efficiency initiative driving results
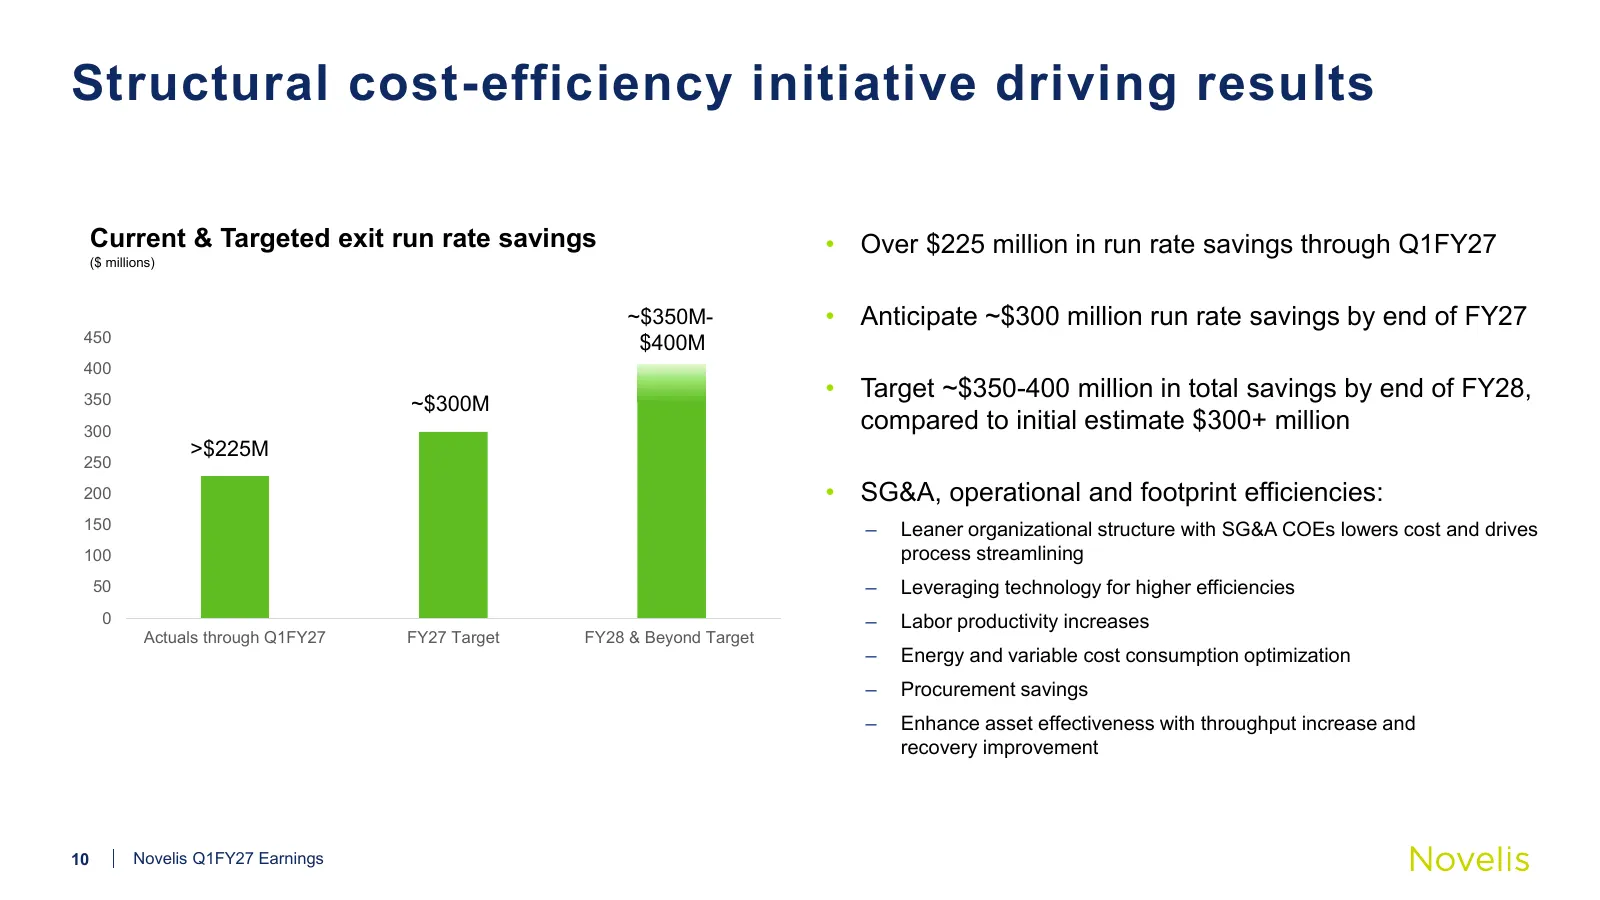
Structural cost-efficiency initiative driving results Current & Targeted exit run rate savings • Over $225 million in run rate savings through Q1FY27 ($ millions) ~$350M- • Anticipate ~$300 million run rate savings by end of FY27 450 $400M ~400 400 350 • Target ~$350-400 million in total savings by
Slide 11: Adj Free Cash Flow and Net Leverage
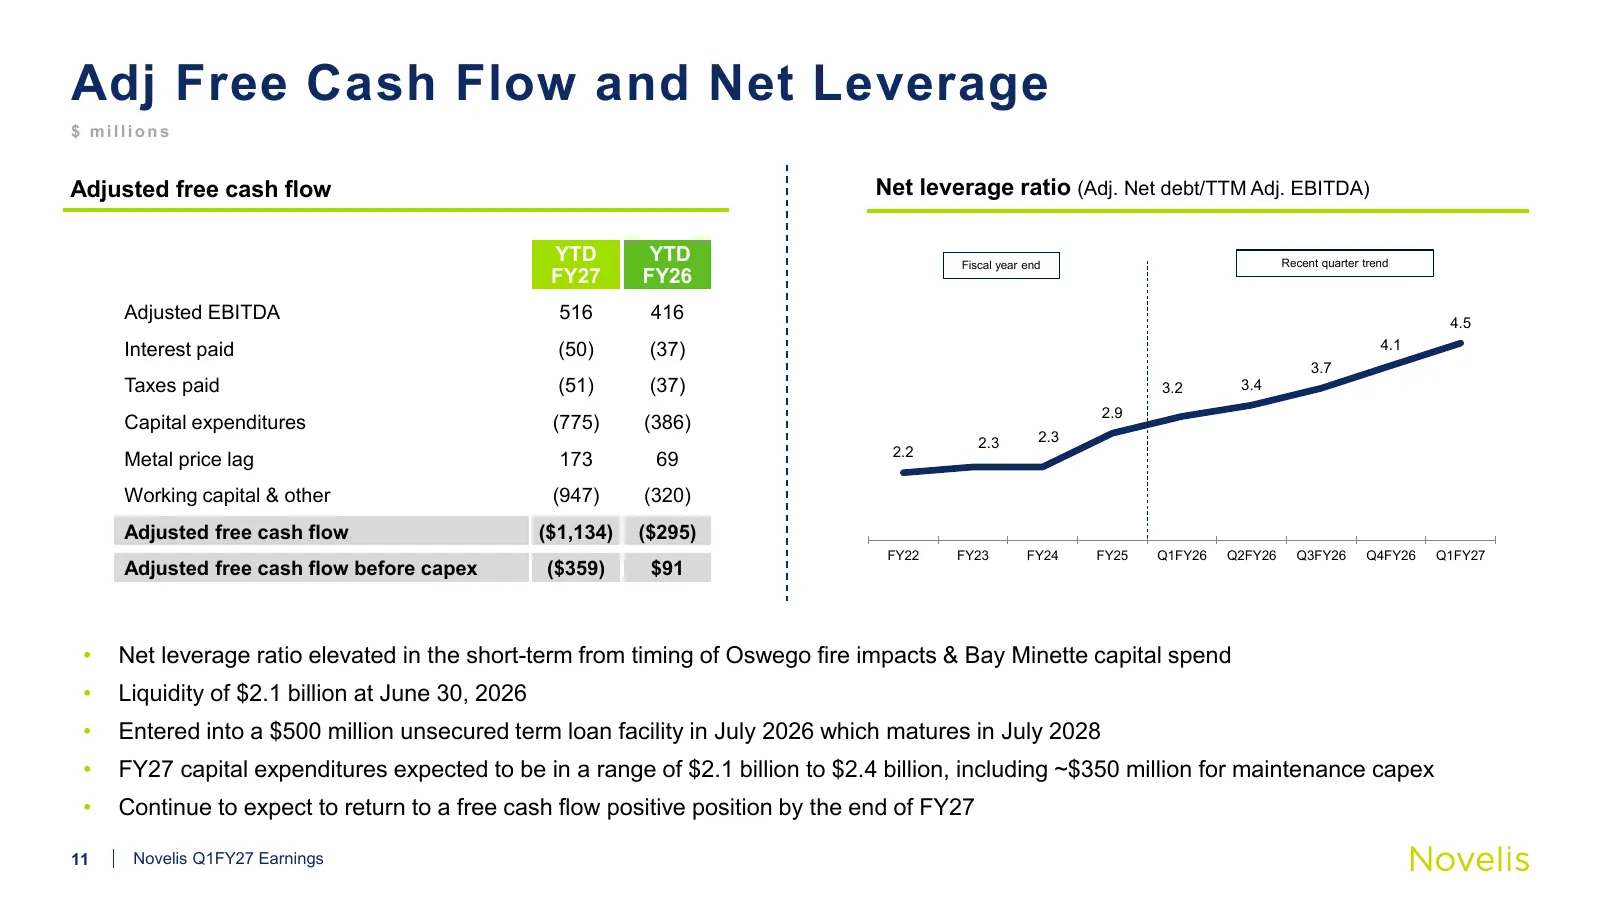
Adj Free Cash Flow and Net Leverage $ millions Adjusted free cash flow Net leverage ratio (Adj. Net debt/TTM Adj. EBITDA) YTD YTD Fiscal year end Recent quarter trend FY27 FY26 Adjusted EBITDA 516 416 4.5 Interest paid (50) (37) 4.1 3.7 Taxes paid (51) (37) 3.2 3.4 2.9 Capital expenditures (775) (38
Slide 12: Strategic Updates & Outlook
Strategic Updates & Outlook
Slide 13: End Market Trends
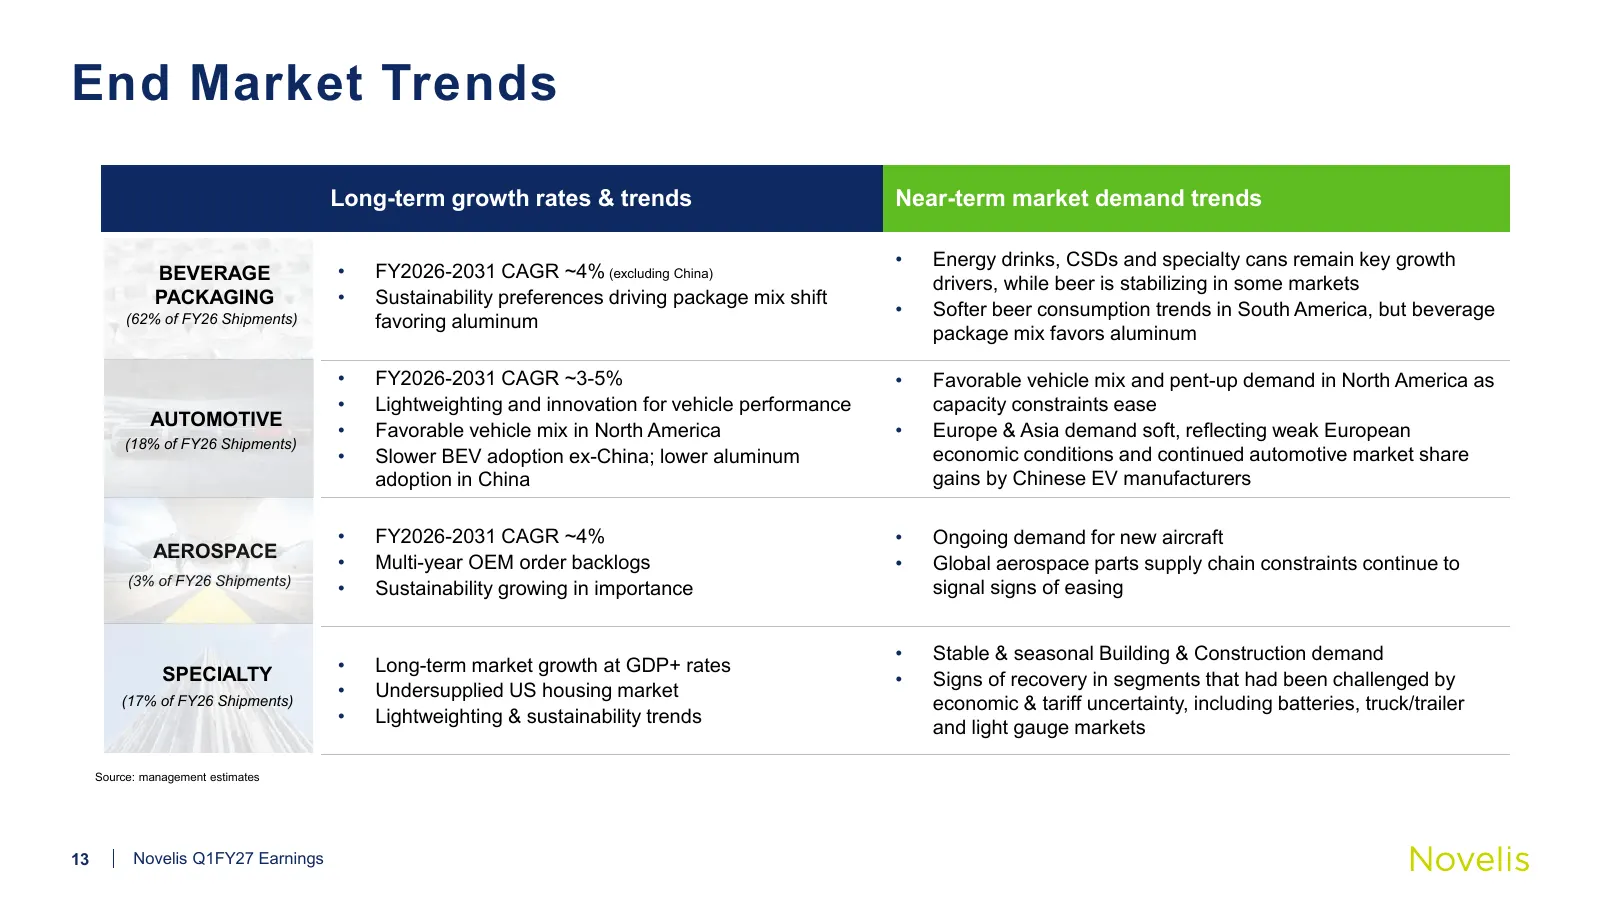
End Market Trends Long-term growth rates & trends Near-term market demand trends • Energy drinks, CSDs and specialty cans remain key growth BEVERAGE • FY2026-2031 CAGR ~4% (excluding China) drivers, while beer is stabilizing in some markets PACKAGING • Sustainability preferences driving package mix
Slide 14: Bay Minette Project Update
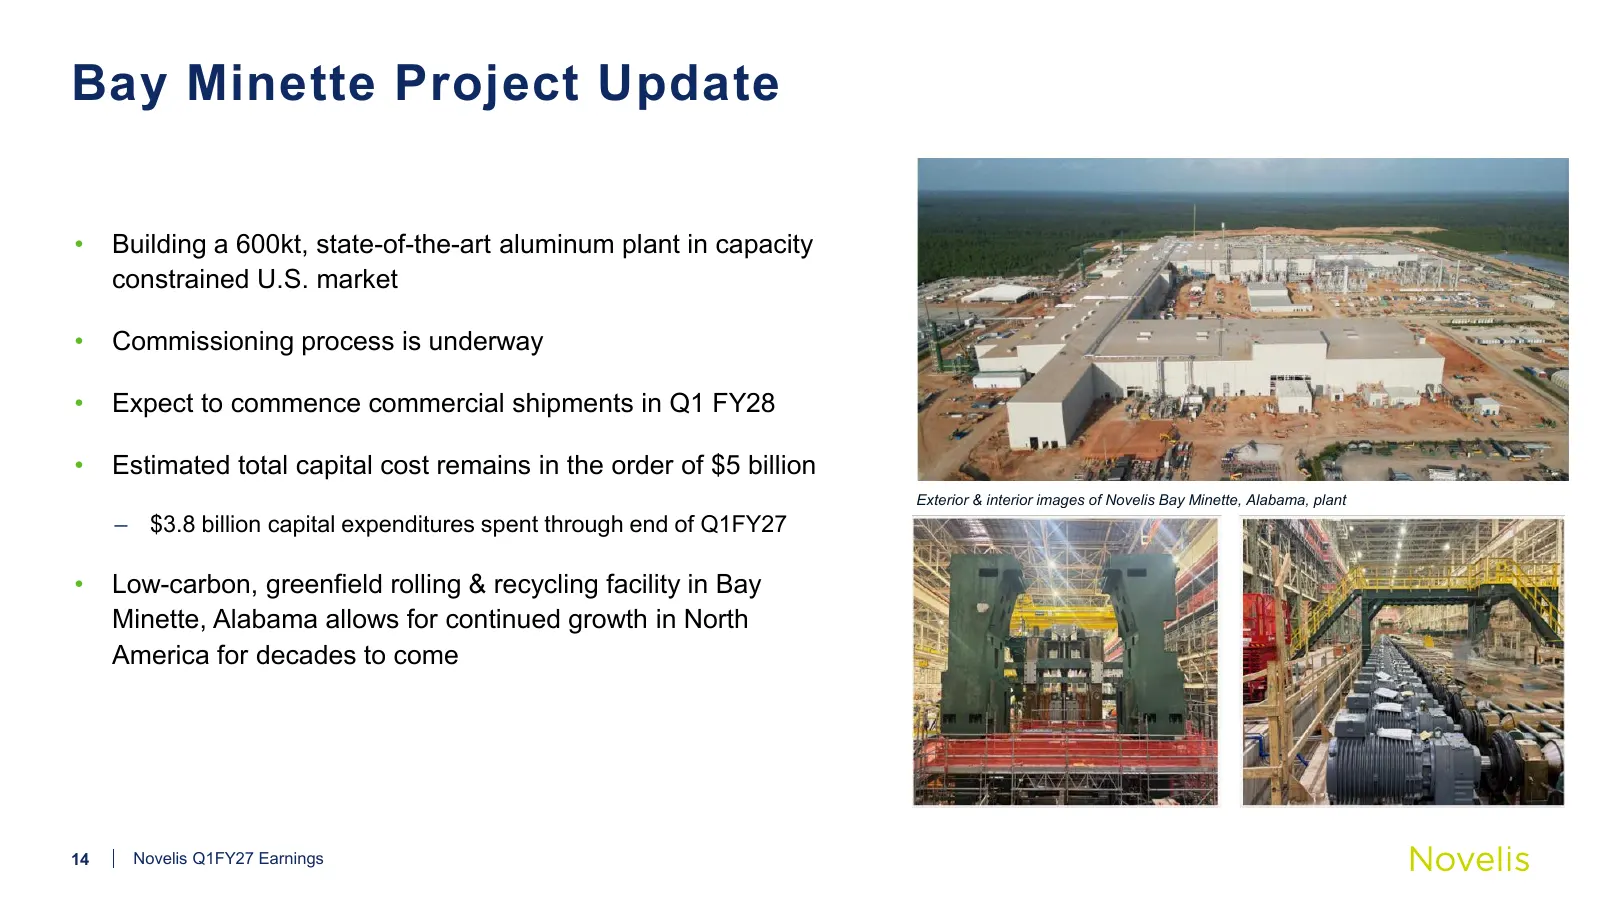
Bay Minette Project Update • Building a 600kt, state-of-the-art aluminum plant in capacity constrained U.S. market • Commissioning process is underway • Expect to commence commercial shipments in Q1 FY28 • Estimated total capital cost remains in the order of $5 billion Exterior & interior images of
Slide 15: Summary
Summary • Strong underlying performance driven by favorable market conditions combined with successful cost efficiency program • Oswego operations restarted in early June and ramping up to support customer demand • Bay Minette plant commissioning underway and poised to produce commercial shipments n

Slide 16: Thank You
Thank You www.novelis.com finx @ Novelis
Slide 17: Appendix
Appendix
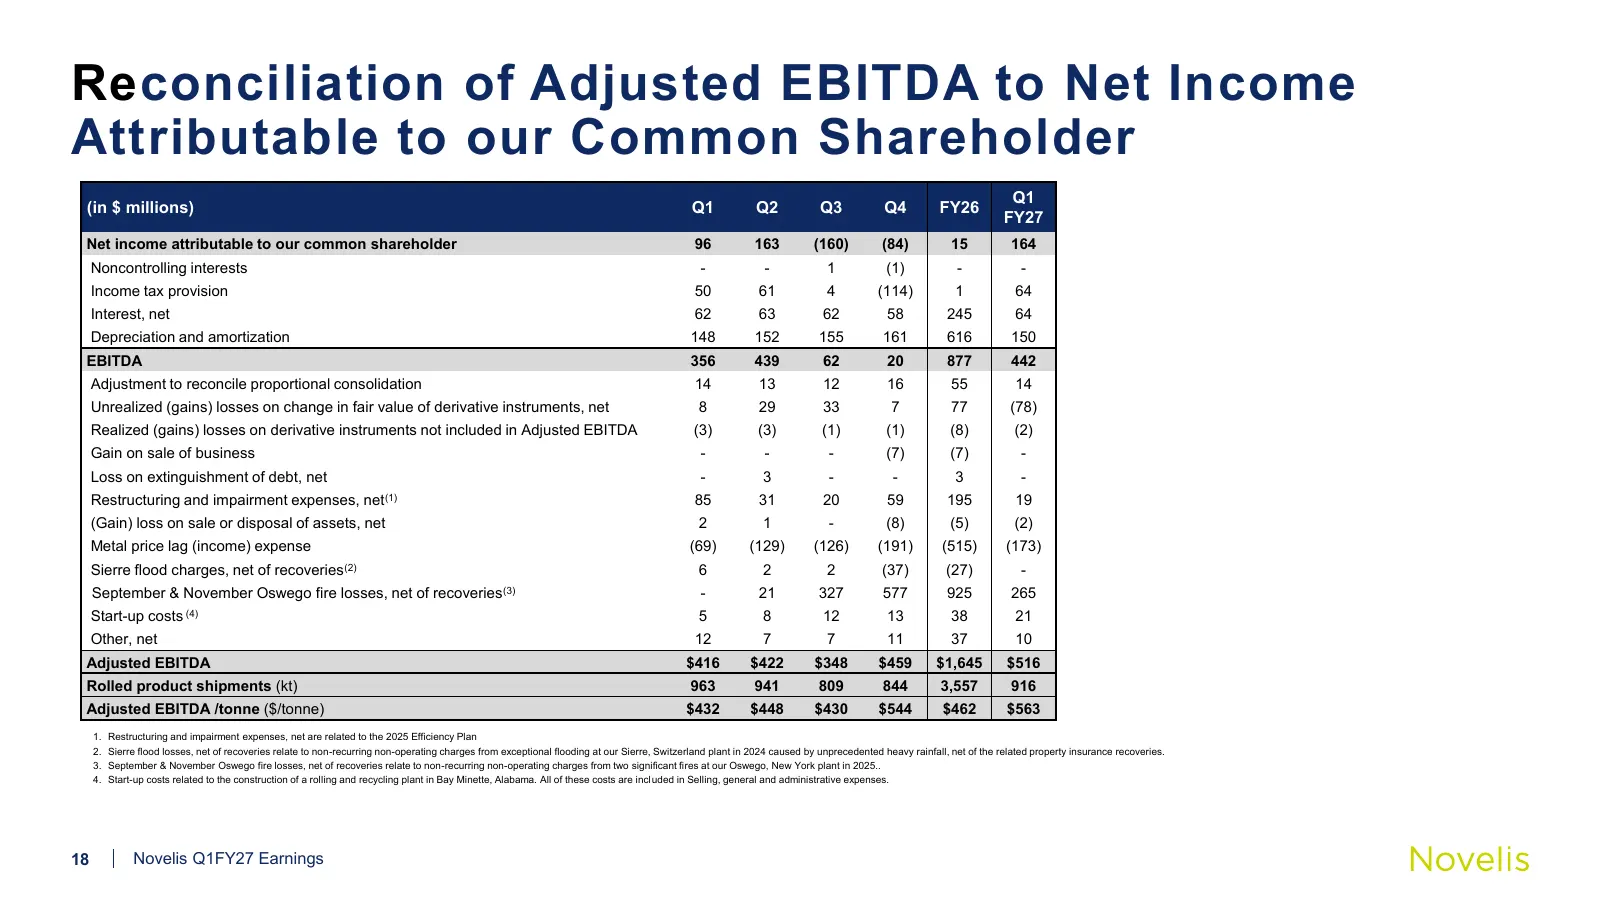
Slide 18: Reconciliation of Adjusted EBITDA to Net Income Attributable to our Common Shareholder
Reconciliation of Adjusted EBITDA to Net Income Attributable to our Common Shareholder Q1 (in $ millions) Q1 Q2 Q3 Q4 FY26 FY27 Net income attributable to our common shareholder 96 163 (160) (84) 15 164 Noncontrolling interests - - 1 (1) - - Income tax provision 50 61 4 (114) 1 64 Interest, net 62 6
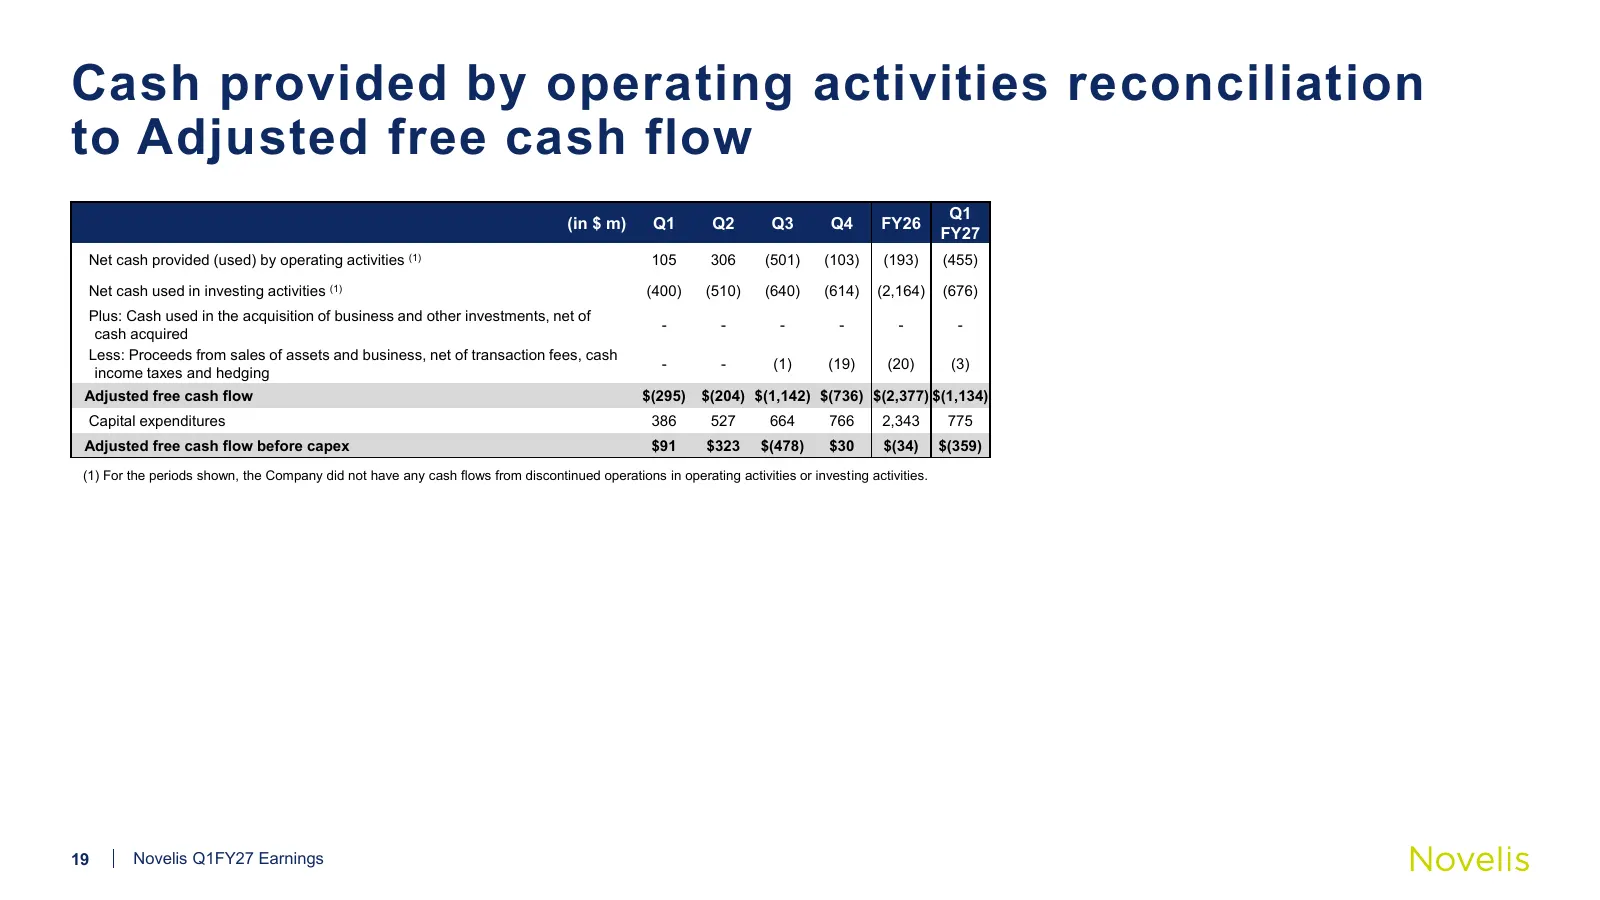
Slide 19: Cash provided by operating activities reconciliation to Adjusted free cash flow
Cash provided by operating activities reconciliation to Adjusted free cash flow Q1 (in $ m) Q1 Q2 Q3 Q4 FY26 FY27 Net cash provided (used) by operating activities (1) 105 306 (501) (103) (193) (455) Net cash used in investing activities (1) (400) (510) (640) (614) (2,164) (676) Plus: Cash used in th
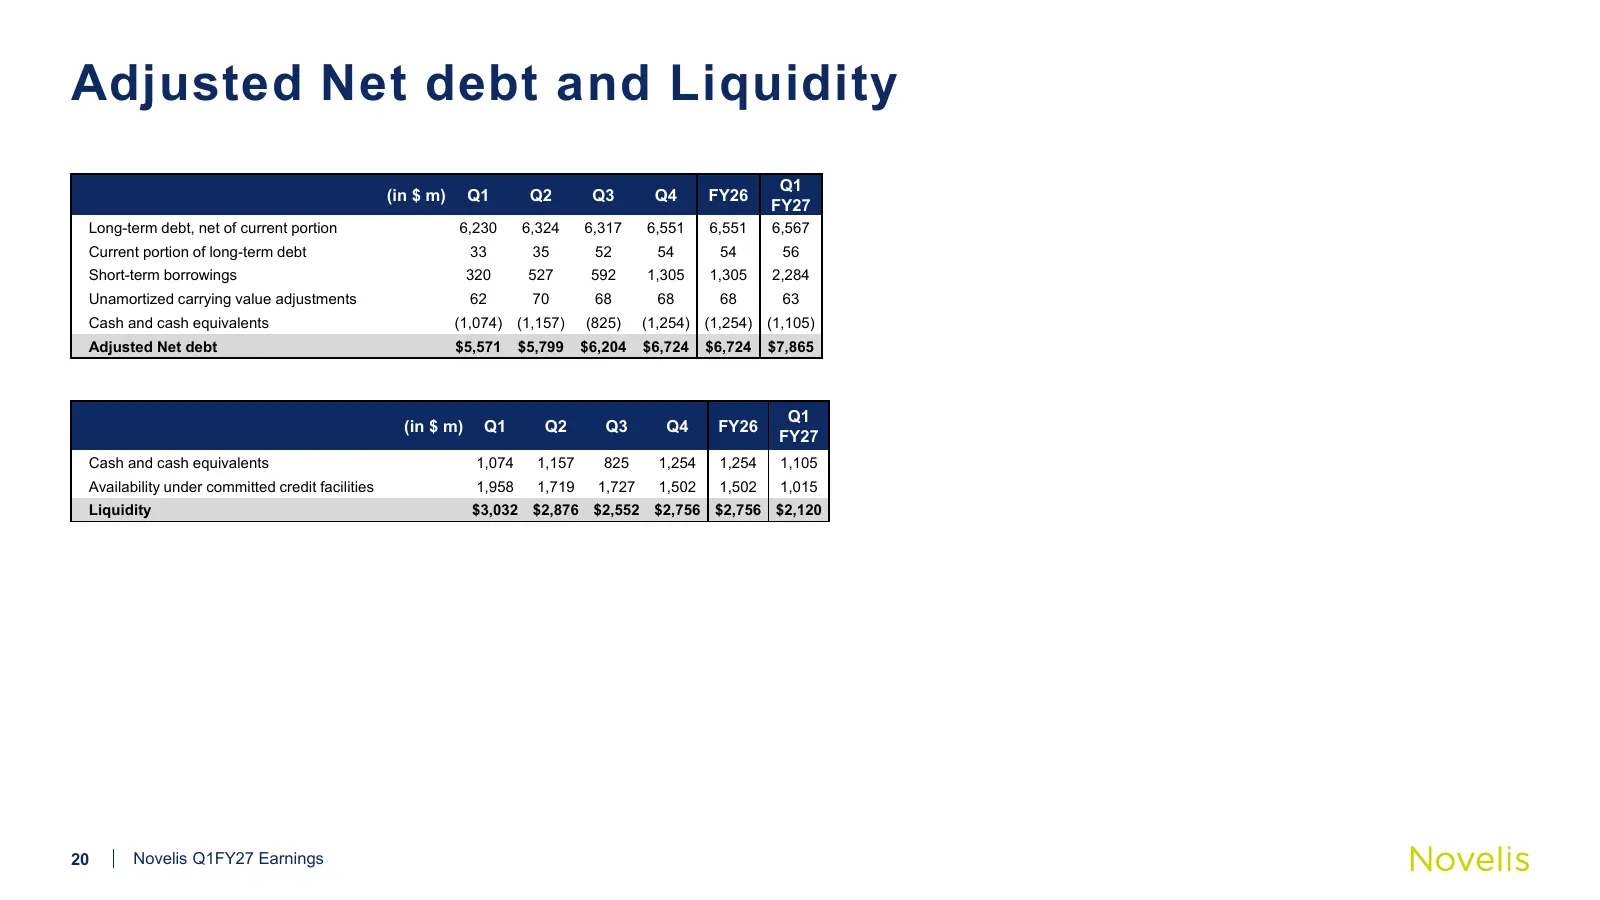
Slide 20: Adjusted Net debt and Liquidity
Adjusted Net debt and Liquidity Q1 (in $ m) Q1 Q2 Q3 Q4 FY26 FY27 Long-term debt, net of current portion 6,230 6,324 6,317 6,551 6,551 6,567 Current portion of long-term debt 33 35 52 54 54 56 Short-term borrowings 320 527 592 1,305 1,305 2,284 Unamortized carrying value adjustments 62 70 68 68 68 6
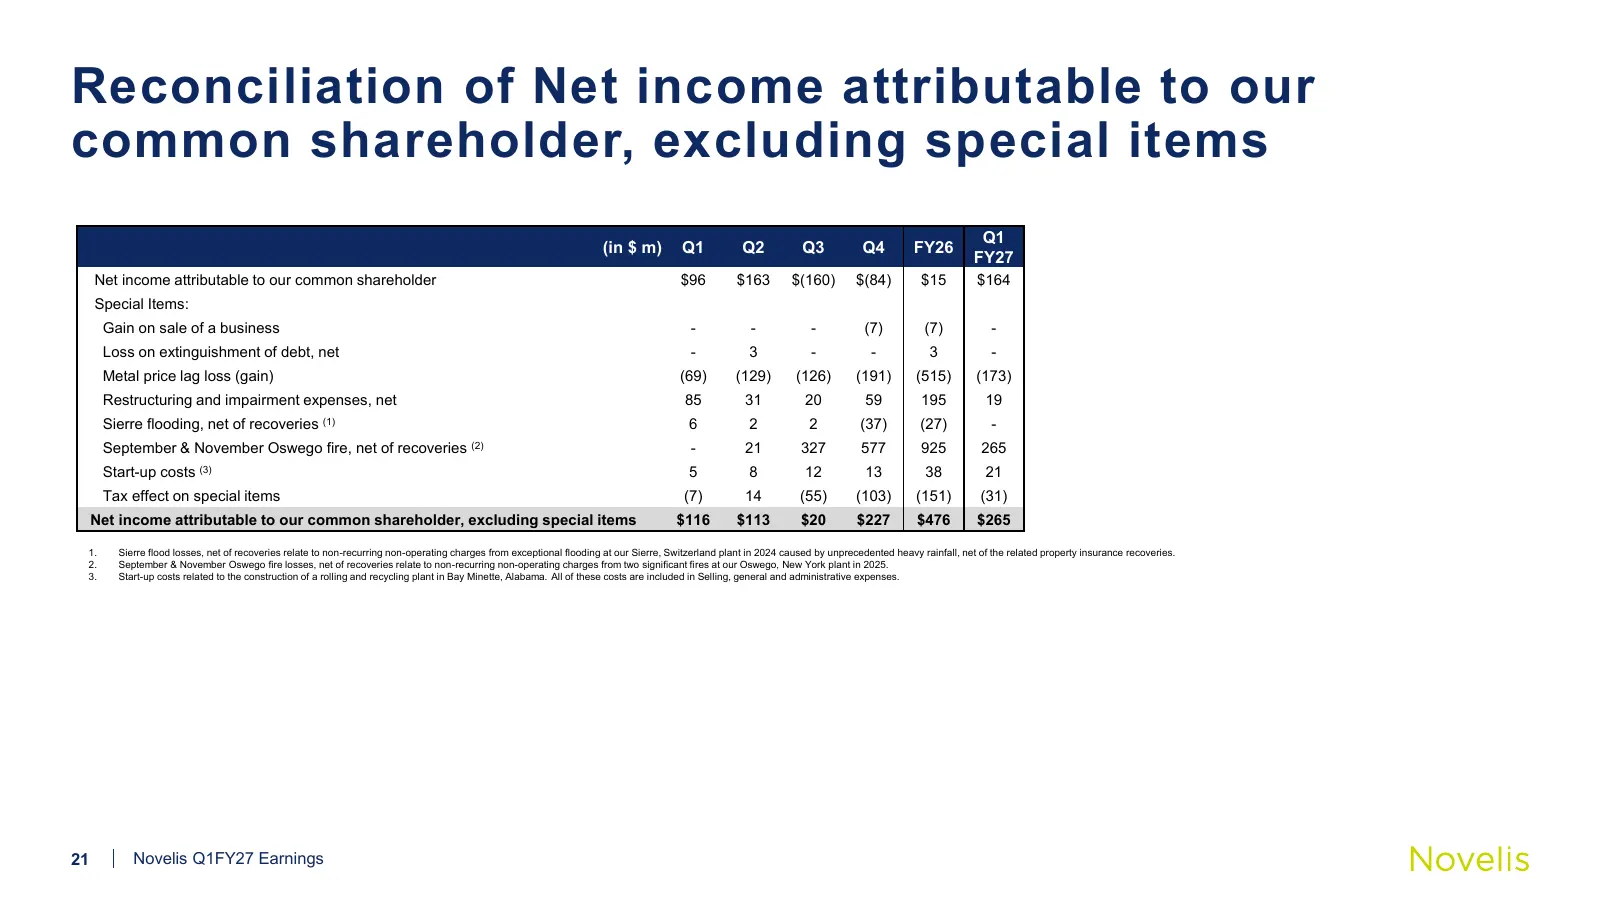
Slide 21: Reconciliation of Net income attributable to our common shareholder, excluding special items
Reconciliation of Net income attributable to our common shareholder, excluding special items Q1 (in $ m) Q1 Q2 Q3 Q4 FY26 FY27 Net income attributable to our common shareholder $96 $163 $(160) $(84) $15 $164 Special Items: Gain on sale of a business - - - (7) (7) - Loss on extinguishment of debt, ne
Source: company website
More decks from Novelis Inc.
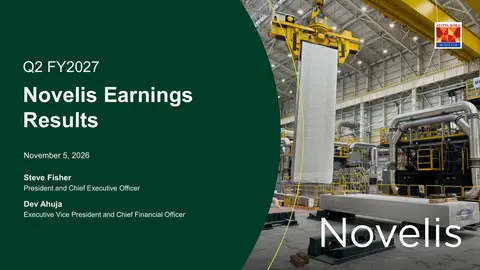 Q2 FY2027 Earnings Presentation20 slides · Nov 5, 2026
 Q2 FY2027 Earnings Presentation31 slides · Nov 5, 2026
 Q1 FY2027 Earnings Presentation31 slides · Aug 5, 2026
 Q4 FY2026 Earnings Presentation33 slides · May 19, 2026
 Q3 FY2026 Earnings Presentation33 slides · Feb 11, 2026
 Q2 FY2026 Earnings Presentation32 slides · Nov 4, 2025