X Financial · NYSE:XYF
X Financial — Q2 2020 Earnings Presentation
24 slides from X Financial's earnings presentation, Aug 21, 2020
Slide 1: 2020 Q2 Earnings Results Presentation
X Financial(NYSE: XYF) 2020 Q2 Earnings Results Presentation
Slide 2: Disclaimer
Disclaimer • This presentation has been prepared by X Financial (the “Company”) solely for information purpose and has not been independently verified. No representations, warranties or undertakings, express or implied, are made by the Company or any of its affiliates, advisers, or representatives o
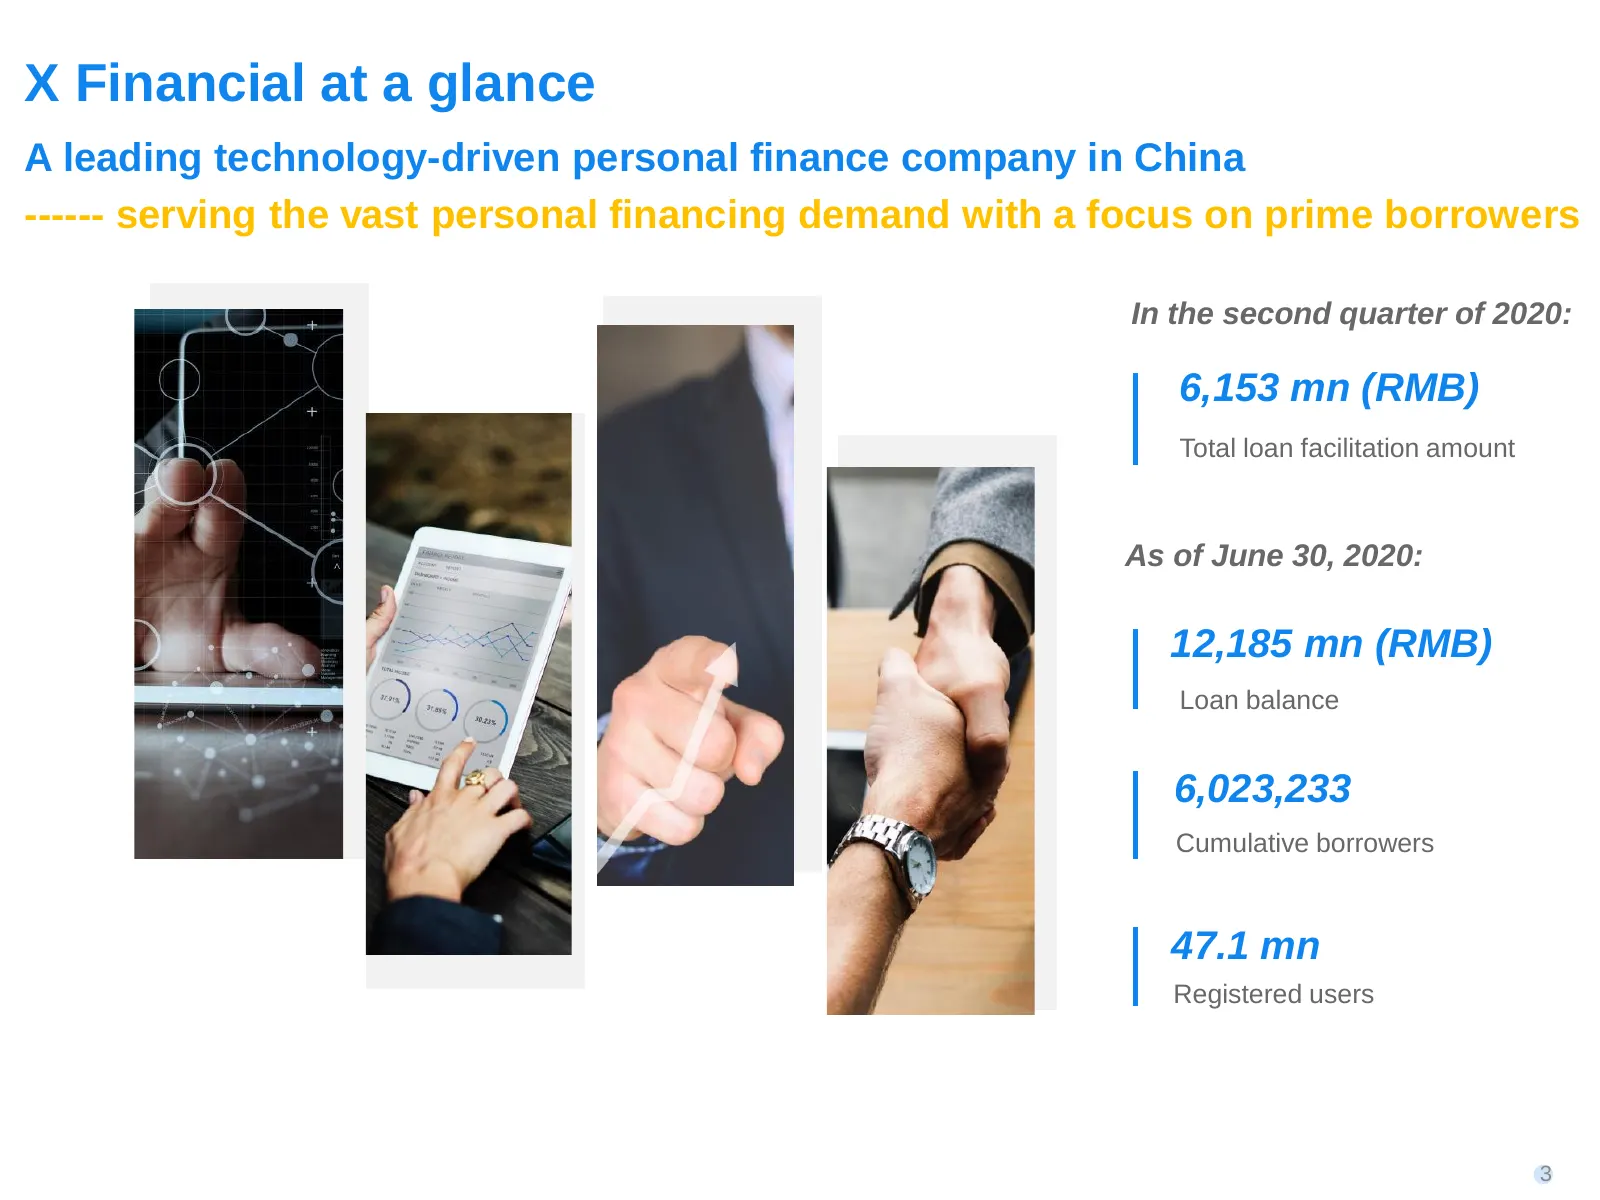
Slide 3: X Financial at a glance
X Financial at a glance A leading technology-driven personal finance company in China ------ serving the vast personal financing demand with a focus on prime borrowers In the second quarter of 2020: 6,153 mn (RMB) Total loan facilitation amount As of June 30, 2020: 12,185 mn (RMB) Loan balance 6,023
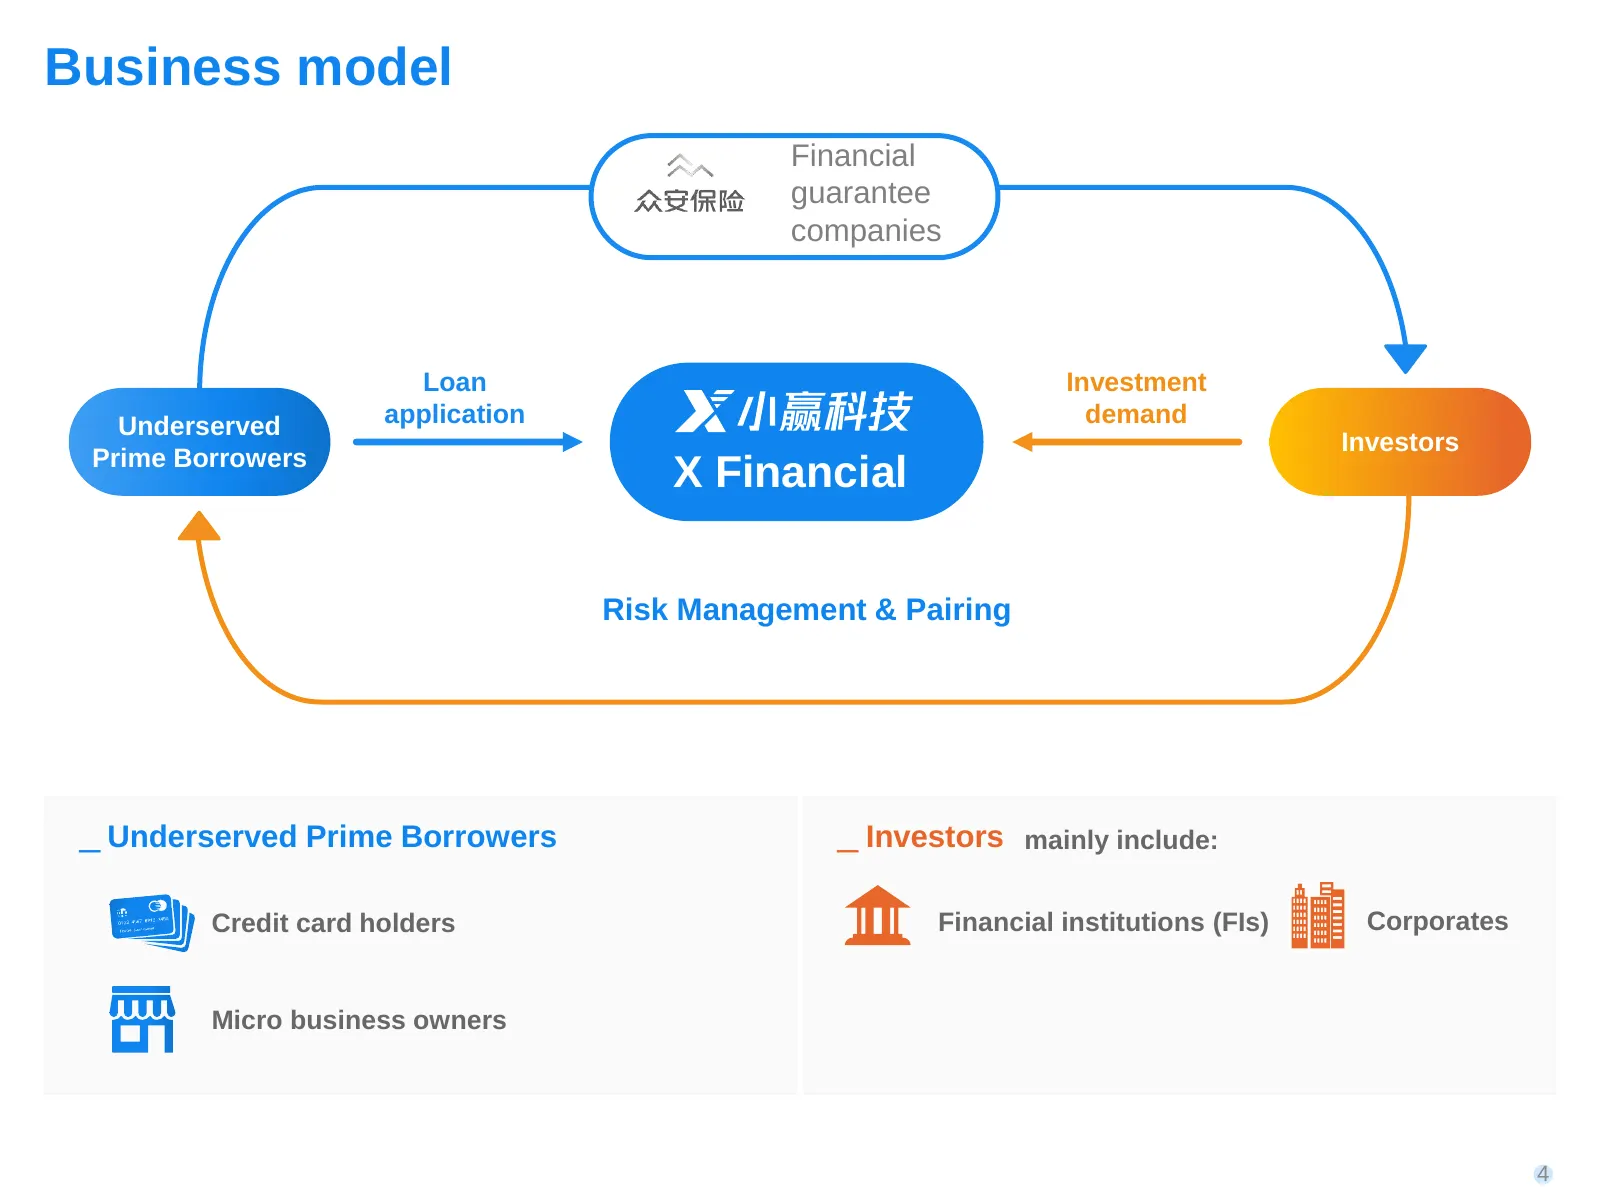
Slide 4: Business model
Business model Financial guarantee companies Loan Investment Underserved application demand Investors Prime Borrowers X Financial Risk Management & Pairing ͟ Underserved Prime Borrowers ͟ Investors mainly include: Credit card holders Financial institutions (FIs) Corporates Micro business owners 4
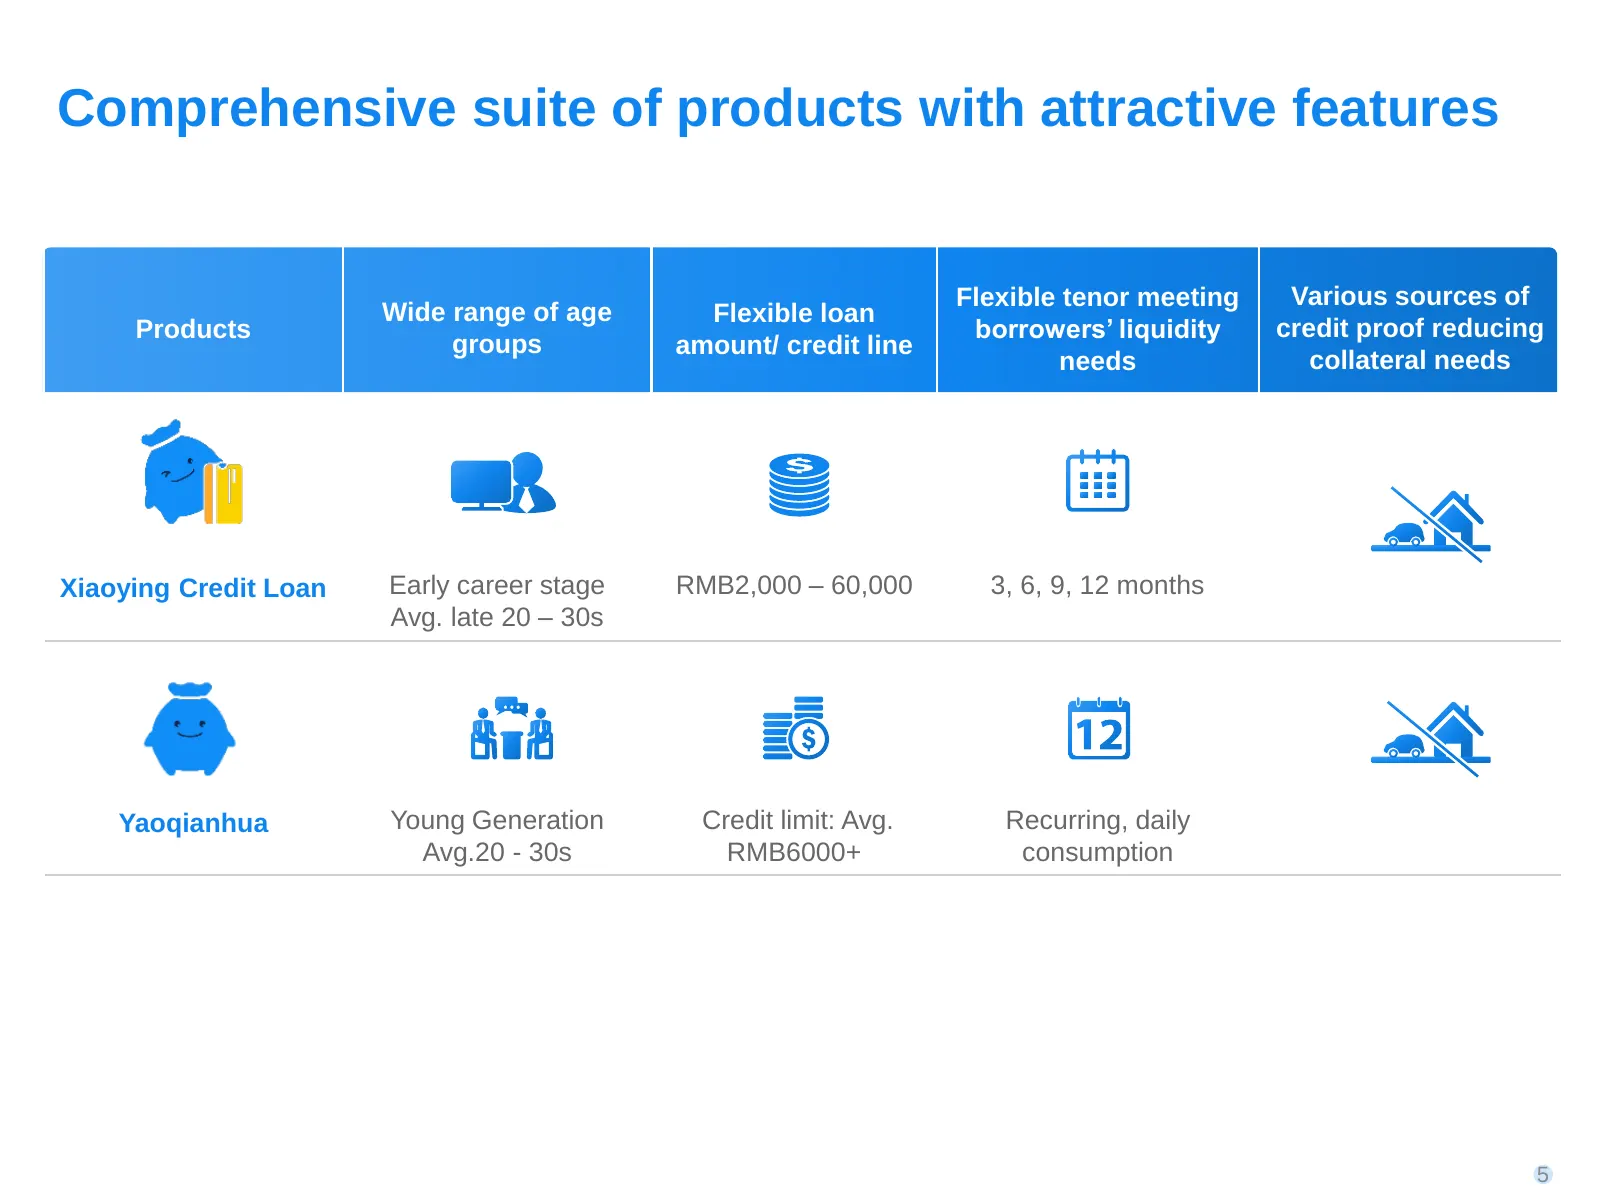
Slide 5: Comprehensive suite of products with attractive features
Comprehensive suite of products with attractive features Flexible tenor meeting Various sources of Wide range of age Flexible loan Products borrowers’ liquidity credit proof reducing groups amount/ credit line needs collateral needs Xiaoying Credit Loan Early career stage RMB2,000 – 60,000 3, 6, 9,
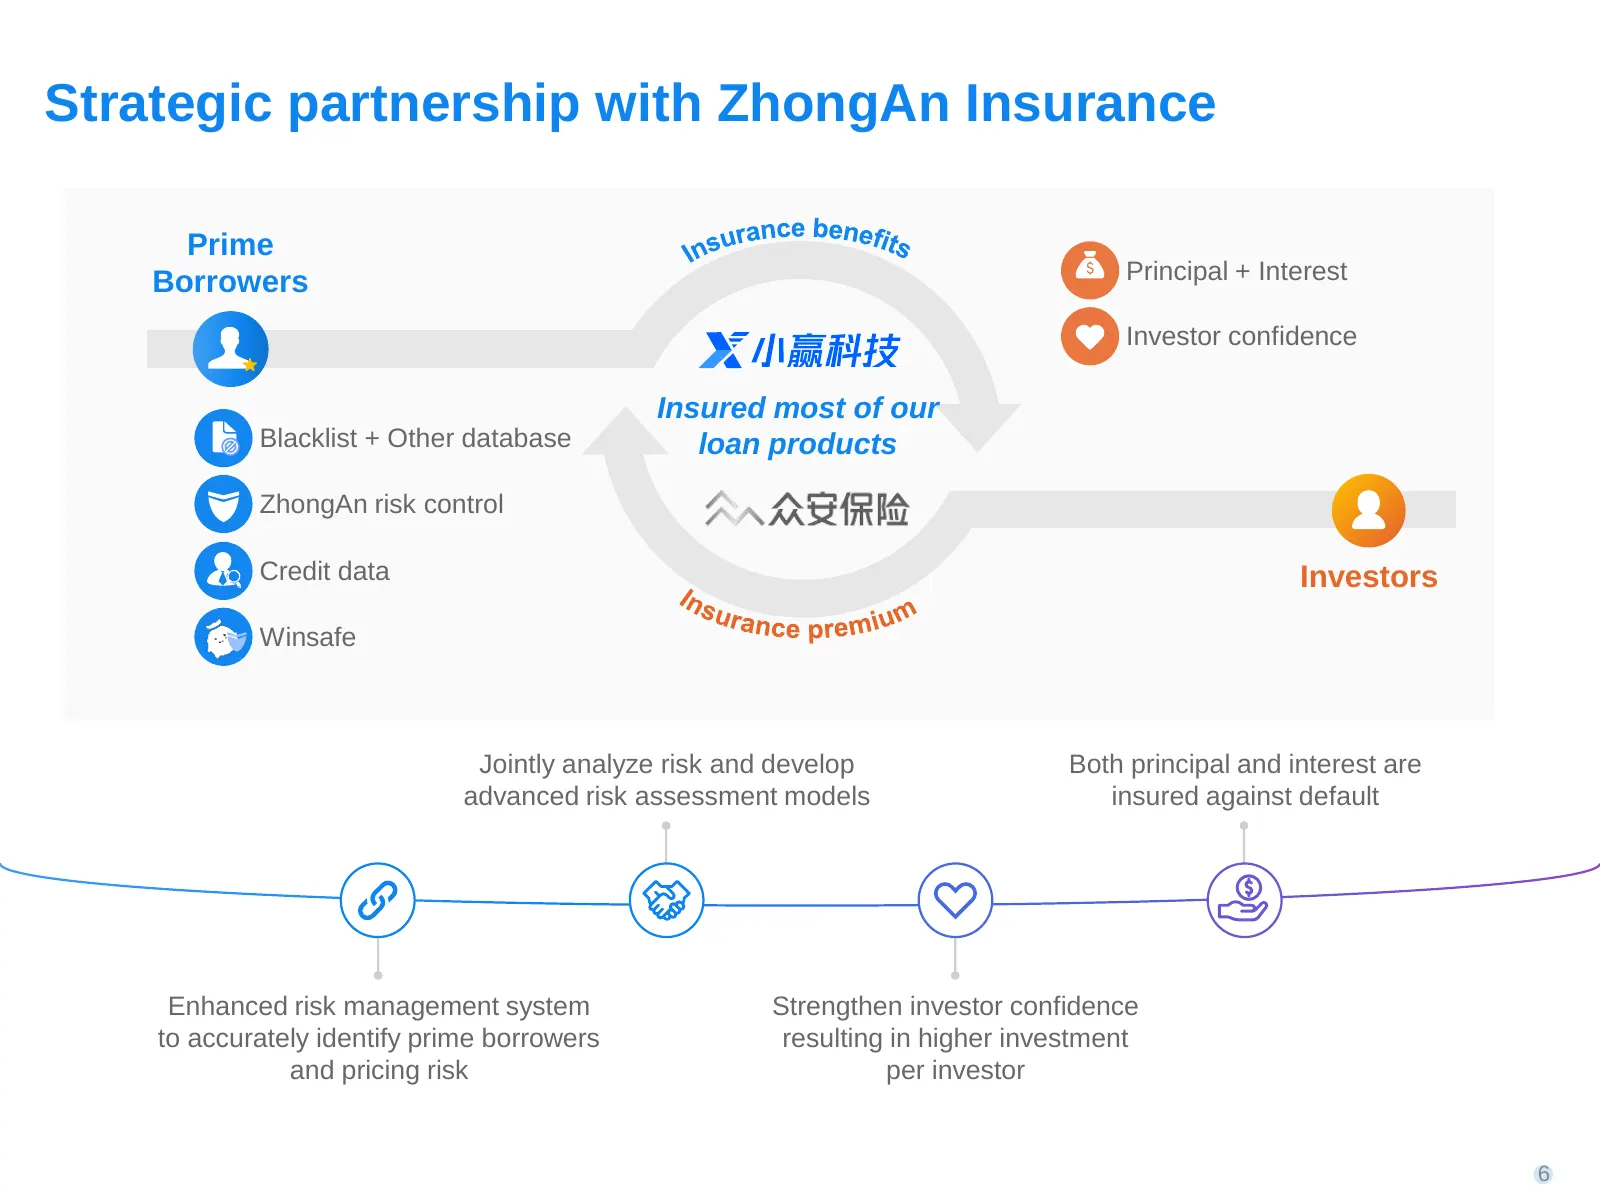
Slide 6: Strategic partnership with ZhongAn Insurance
Strategic partnership with ZhongAn Insurance Prime Borrowers Principal + Interest Investor confidence Insured most of our Blacklist + Other database loan products ZhongAn risk control Credit data Investors Winsafe Jointly analyze risk and develop Both principal and interest are advanced risk assessm
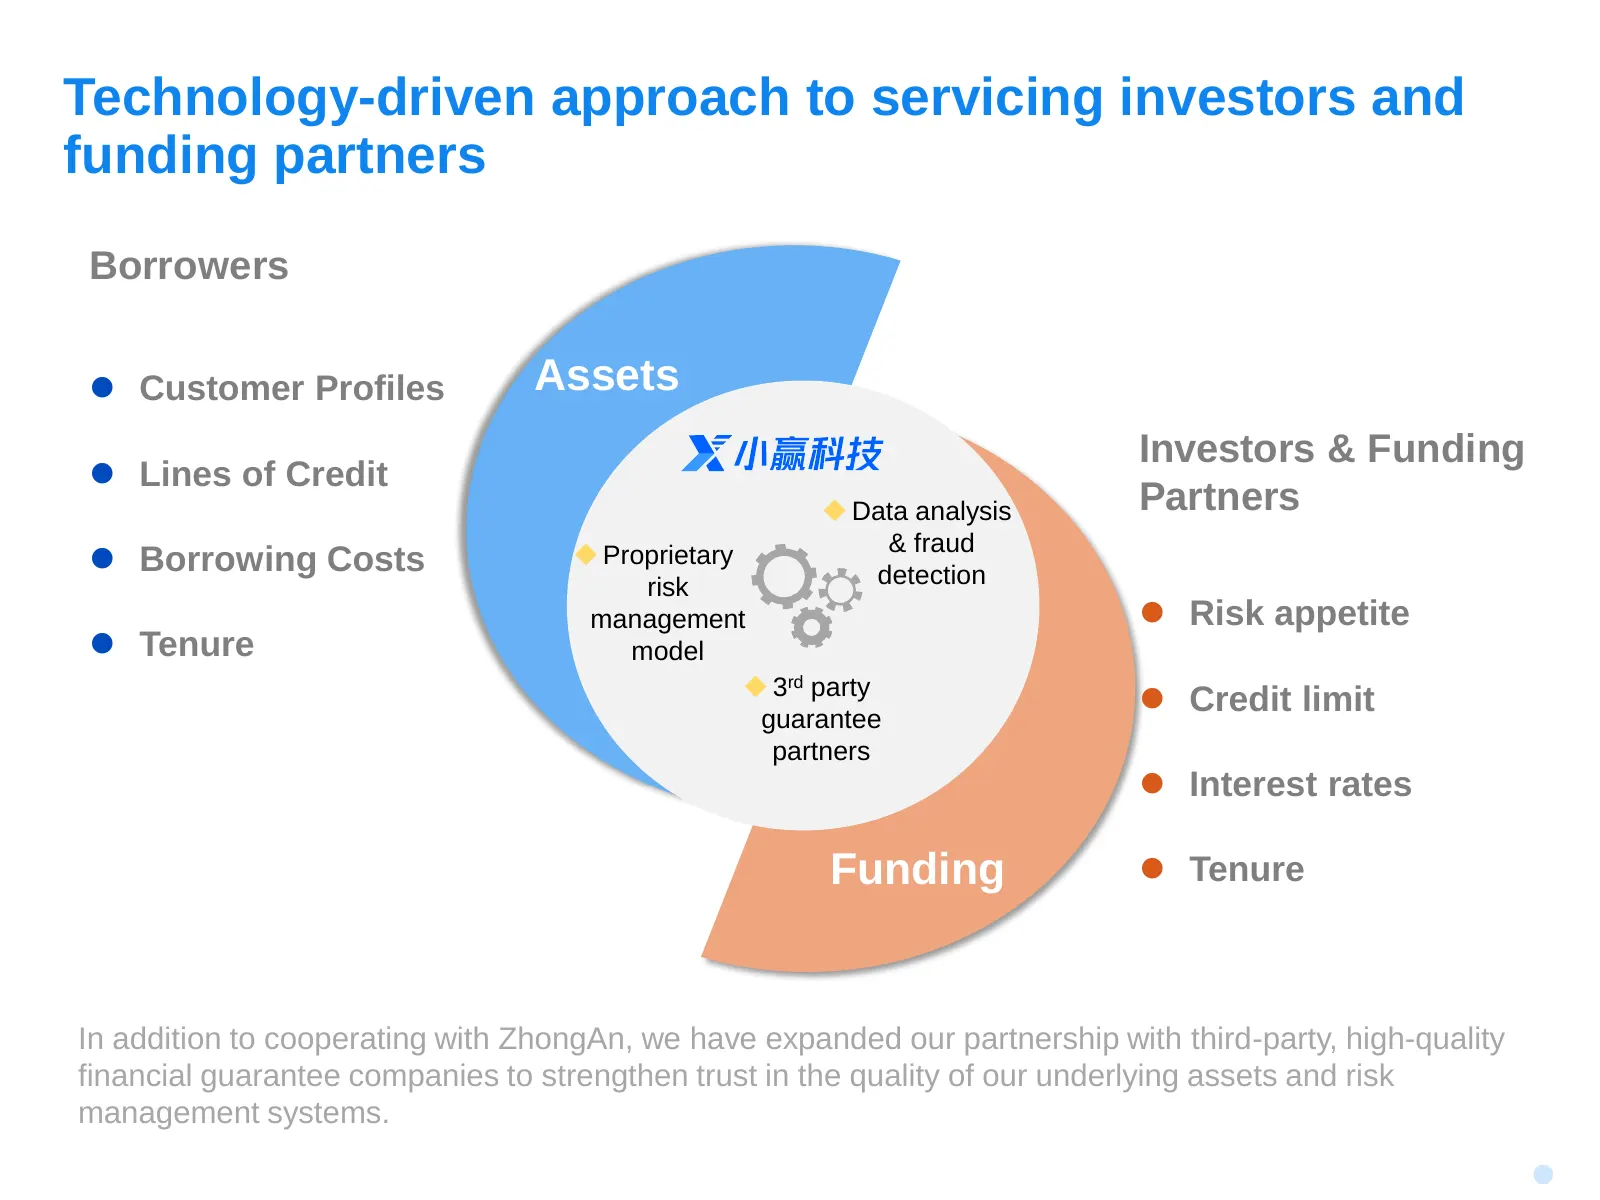
Slide 7: Technology-driven approach to servicing investors and funding partners
Technology-driven approach to servicing investors and funding partners Borrowers ⚫ Customer Profiles Assets Investors & Funding ⚫ Lines of Credit ◆ Data analysis Partners & fraud ⚫ Borrowing Costs ◆ Proprietary detection risk management ⚫ Risk appetite ⚫ Tenure model ◆ 3rd party guarantee ⚫ Credit l
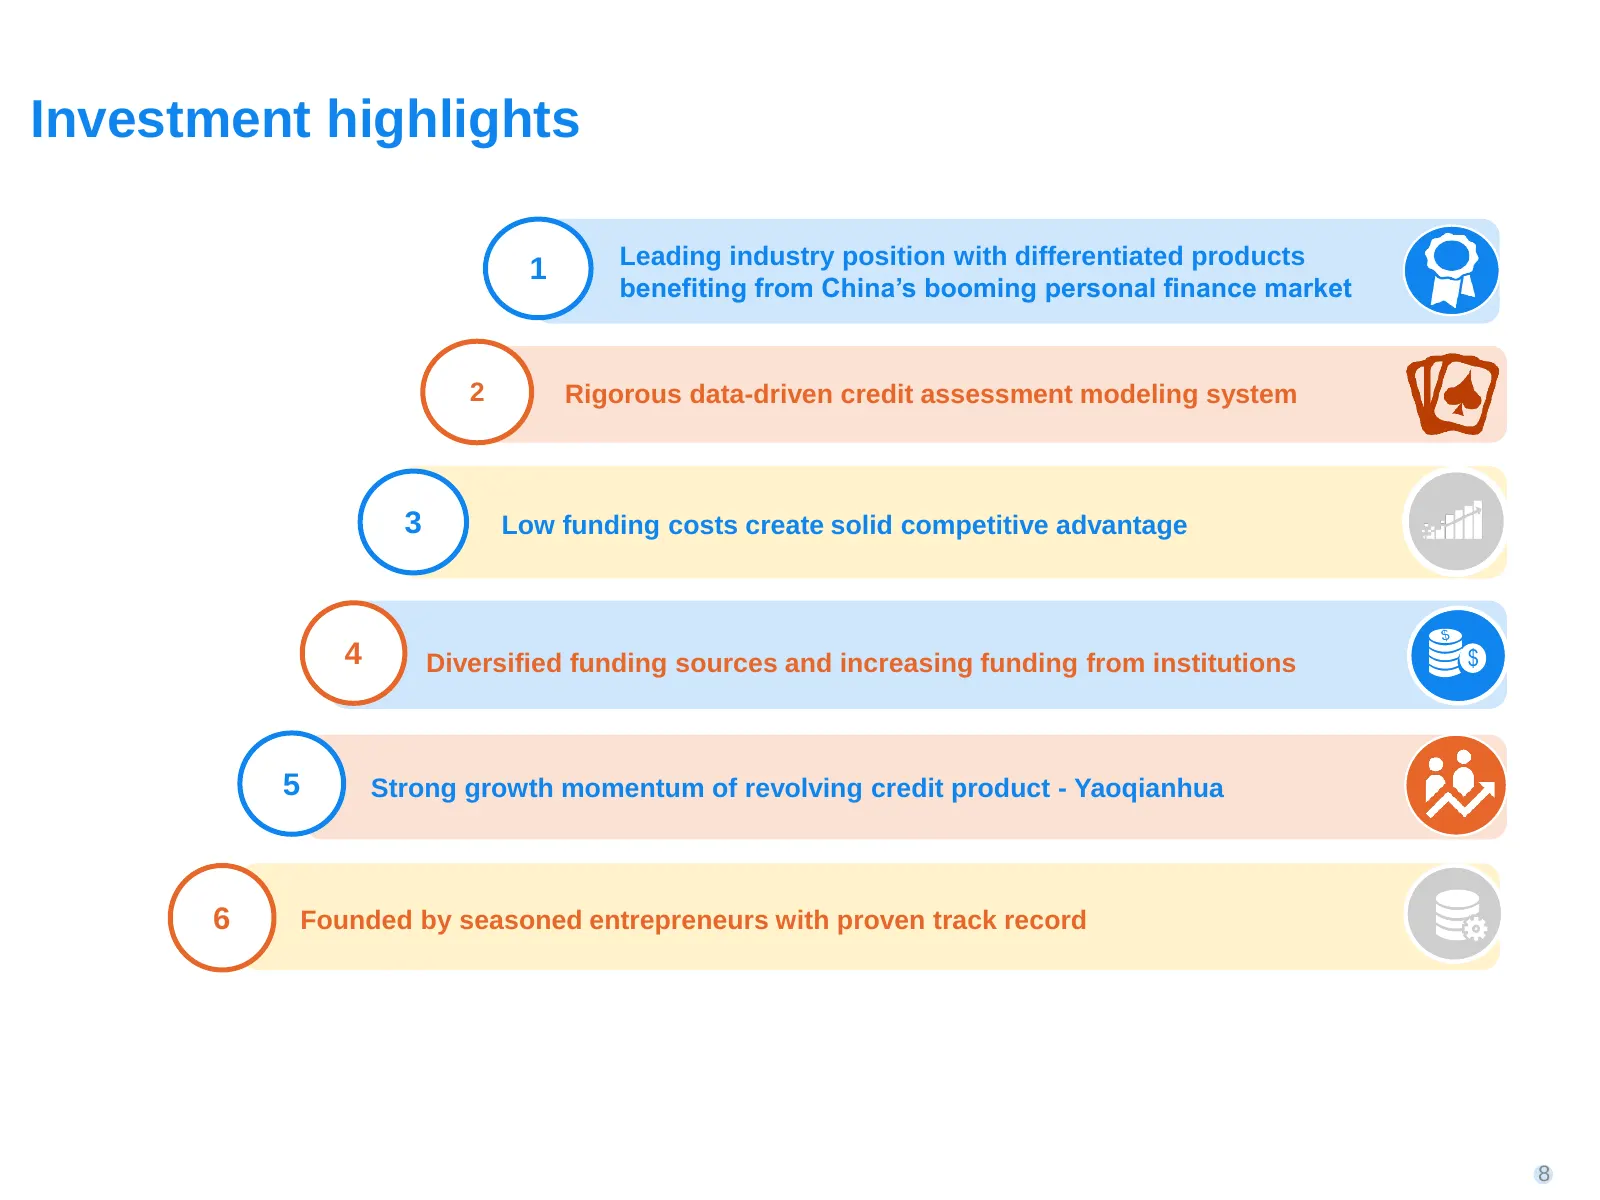
Slide 8: Investment highlights
Investment highlights Leading industry position with differentiated products 1 benefiting from China’s booming personal finance market 2 Rigorous data-driven credit assessment modeling system 3 Low funding costs create solid competitive advantage 4 Diversified funding sources and increasing funding
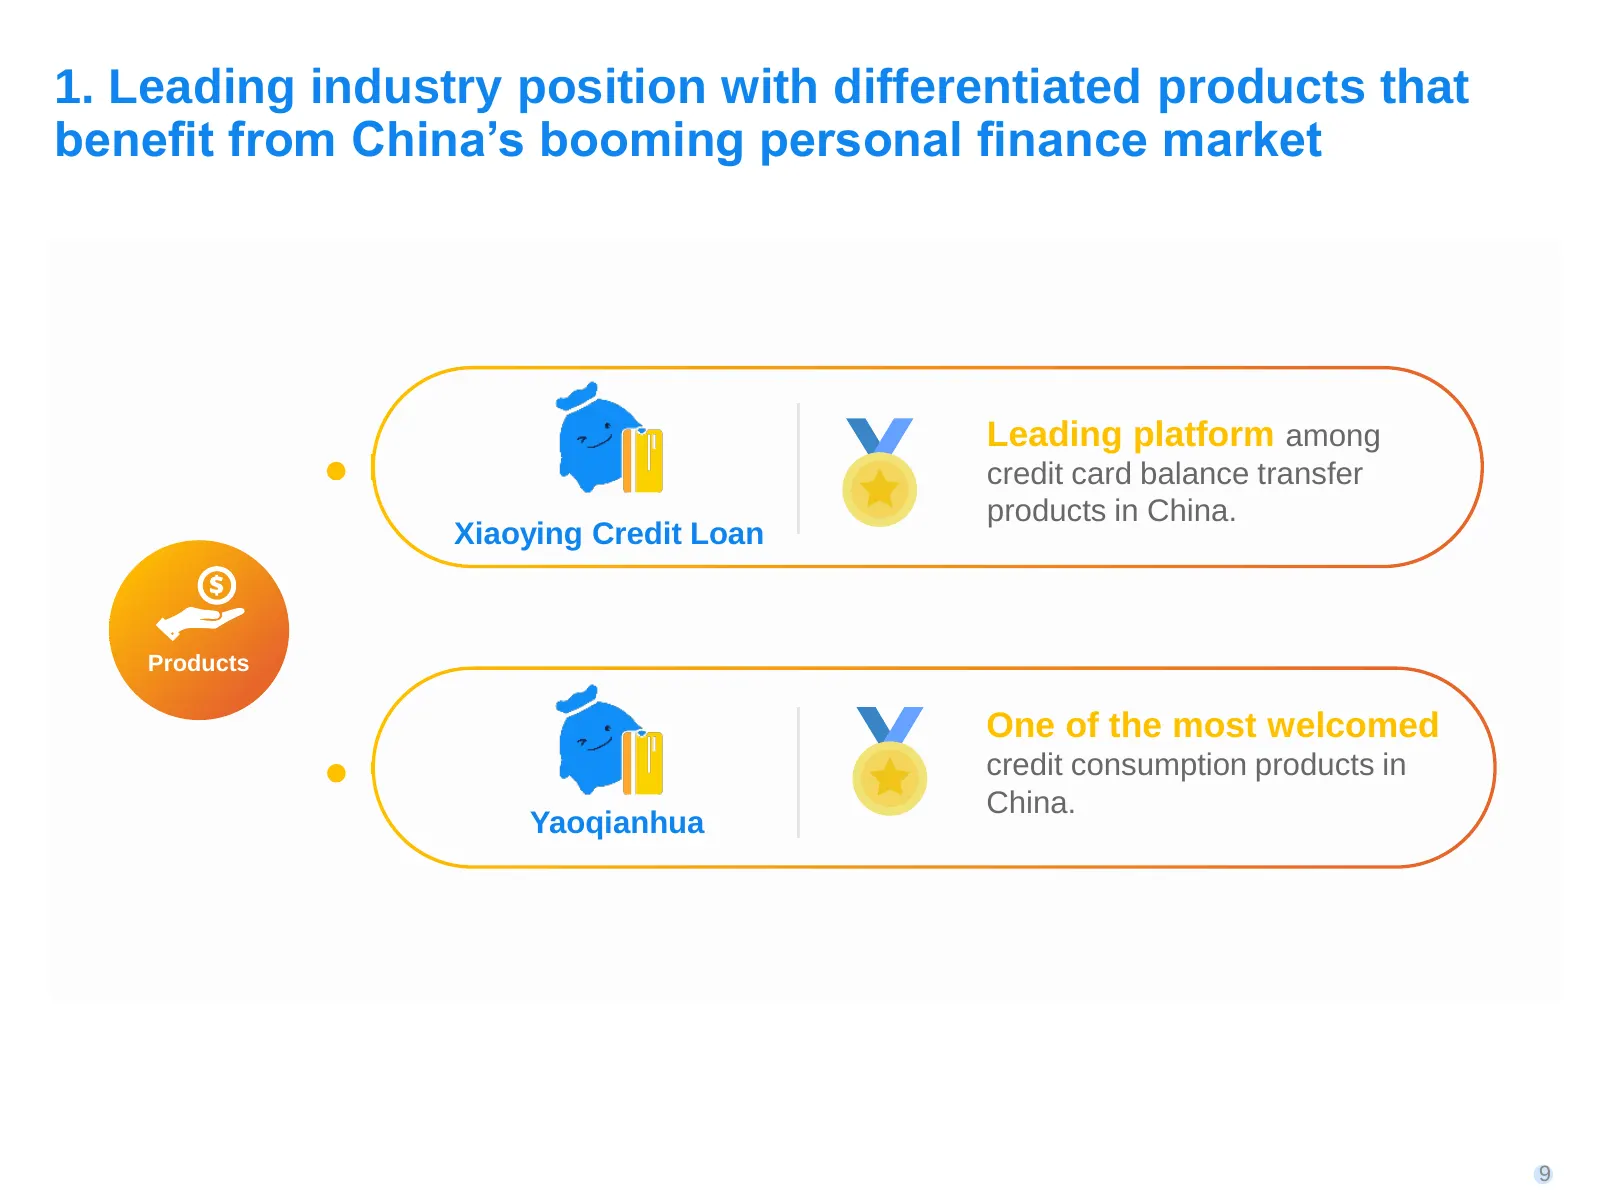
Slide 9: Leading industry position with differentiated products
1. Leading industry position with differentiated products that benefit from China’s booming personal finance market Leading platform among credit card balance transfer products in China. Xiaoying Credit Loan Products One of the most welcomed credit consumption products in China. Yaoqianhua 9
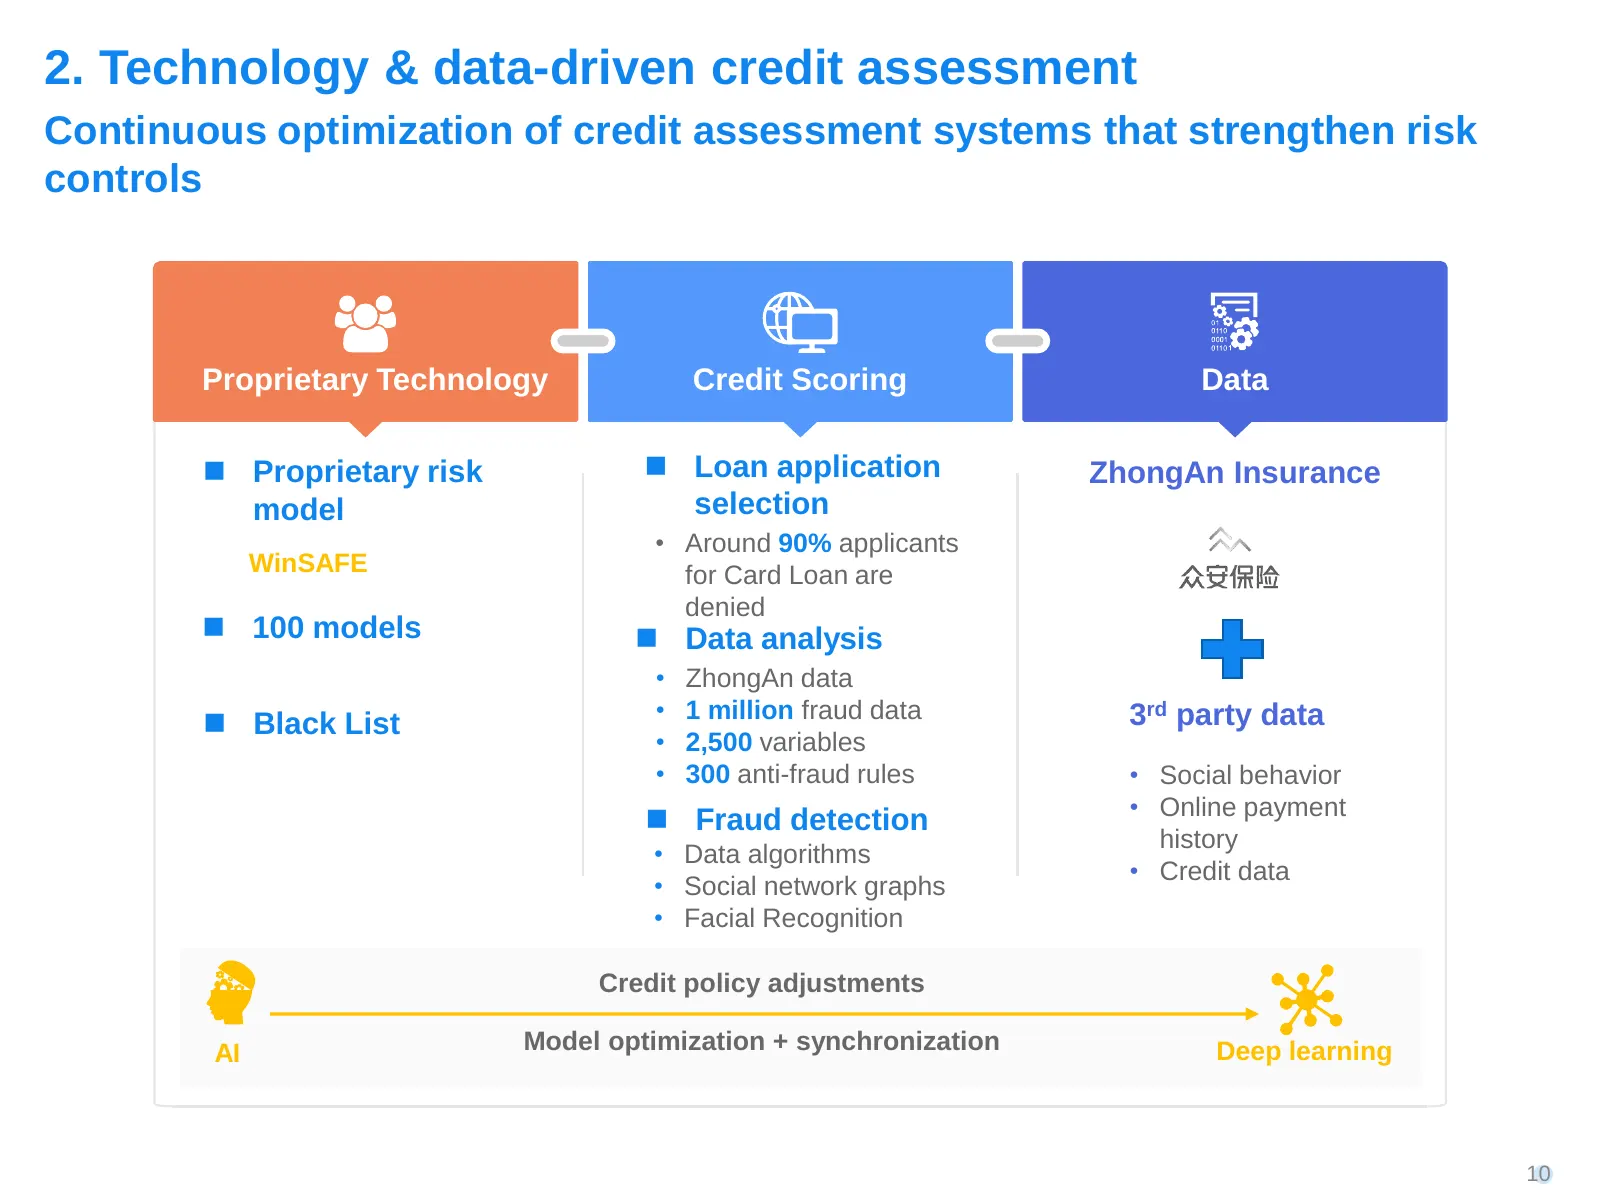
Slide 10: Technology & data-driven credit assessment
2. Technology & data-driven credit assessment Continuous optimization of credit assessment systems that strengthen risk controls Proprietary Technology Credit Scoring Data ◼ Proprietary risk ◼ Loan application ZhongAn Insurance model selection • Around 90% applicants WinSAFE for Card Loan are denied
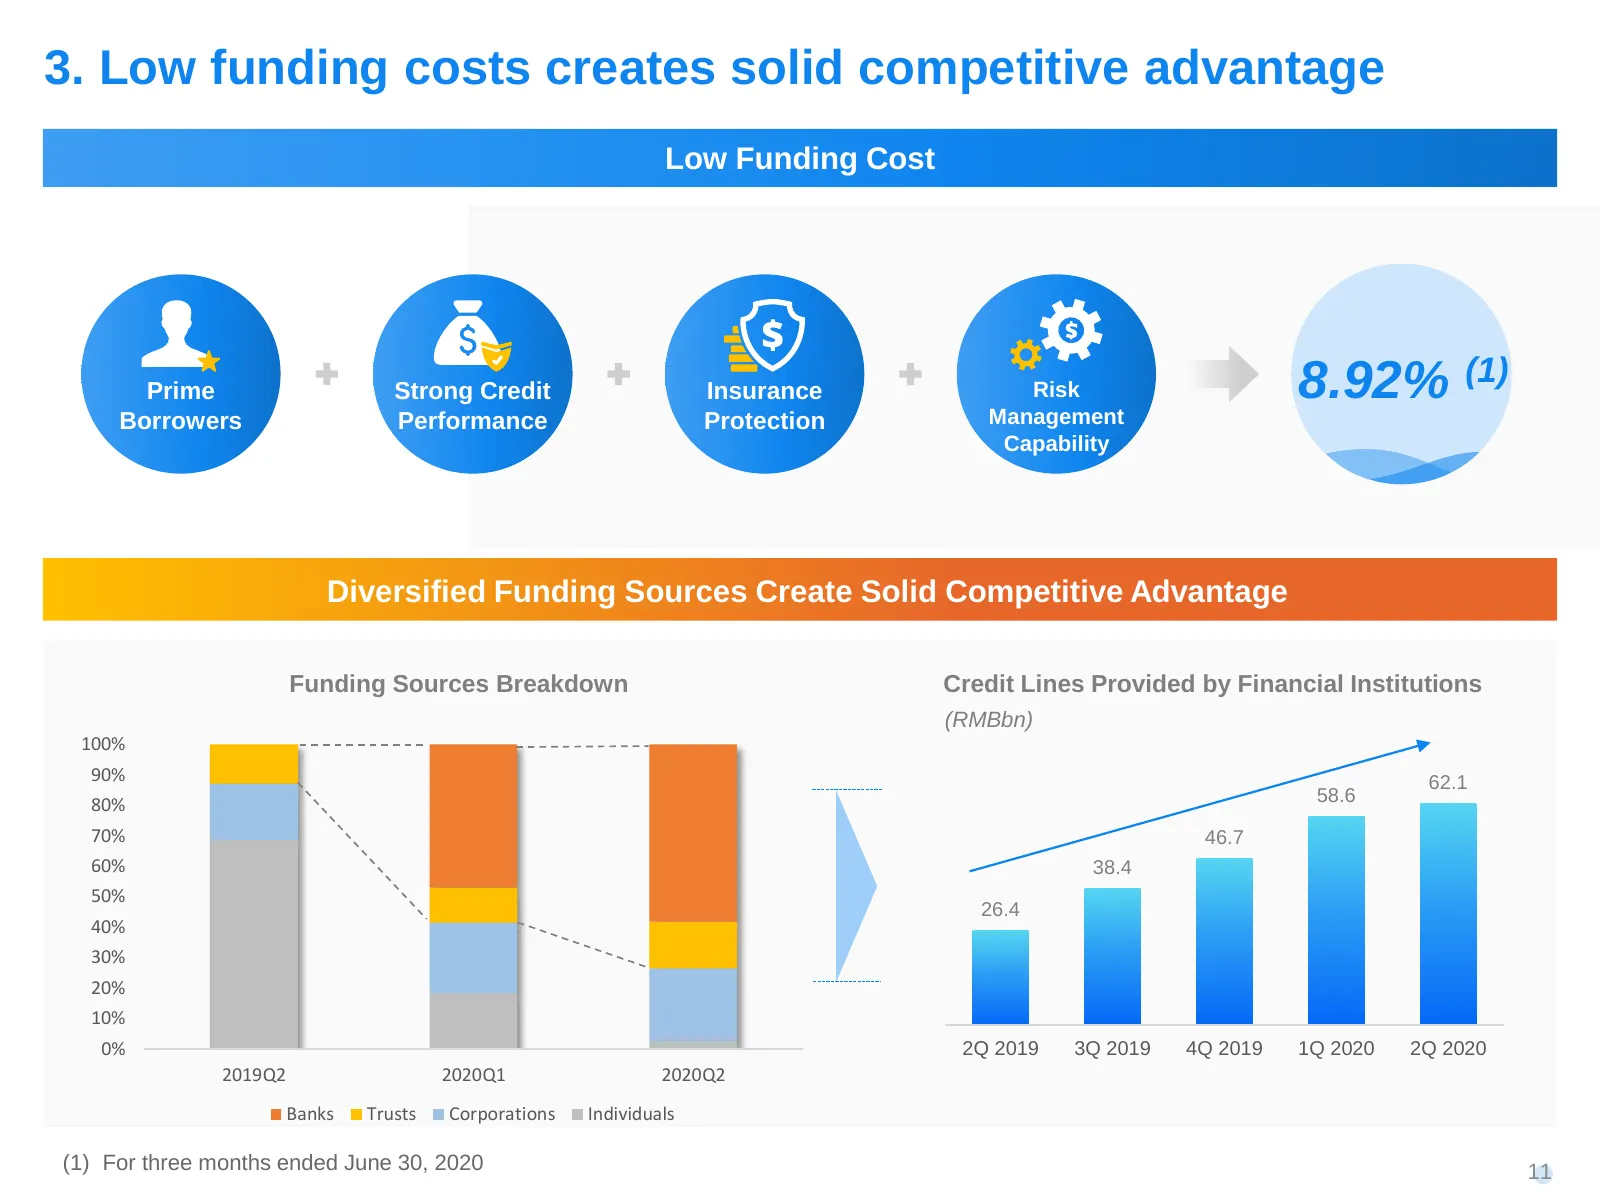
Slide 11: Low funding costs creates solid competitive advantage
3. Low funding costs creates solid competitive advantage Low Funding Cost Prime Strong Credit Insurance Risk Management 8.92% (1) Borrowers Performance Protection Capability Diversified Funding Sources Create Solid Competitive Advantage Funding Sources Breakdown Credit Lines Provided by Financial In
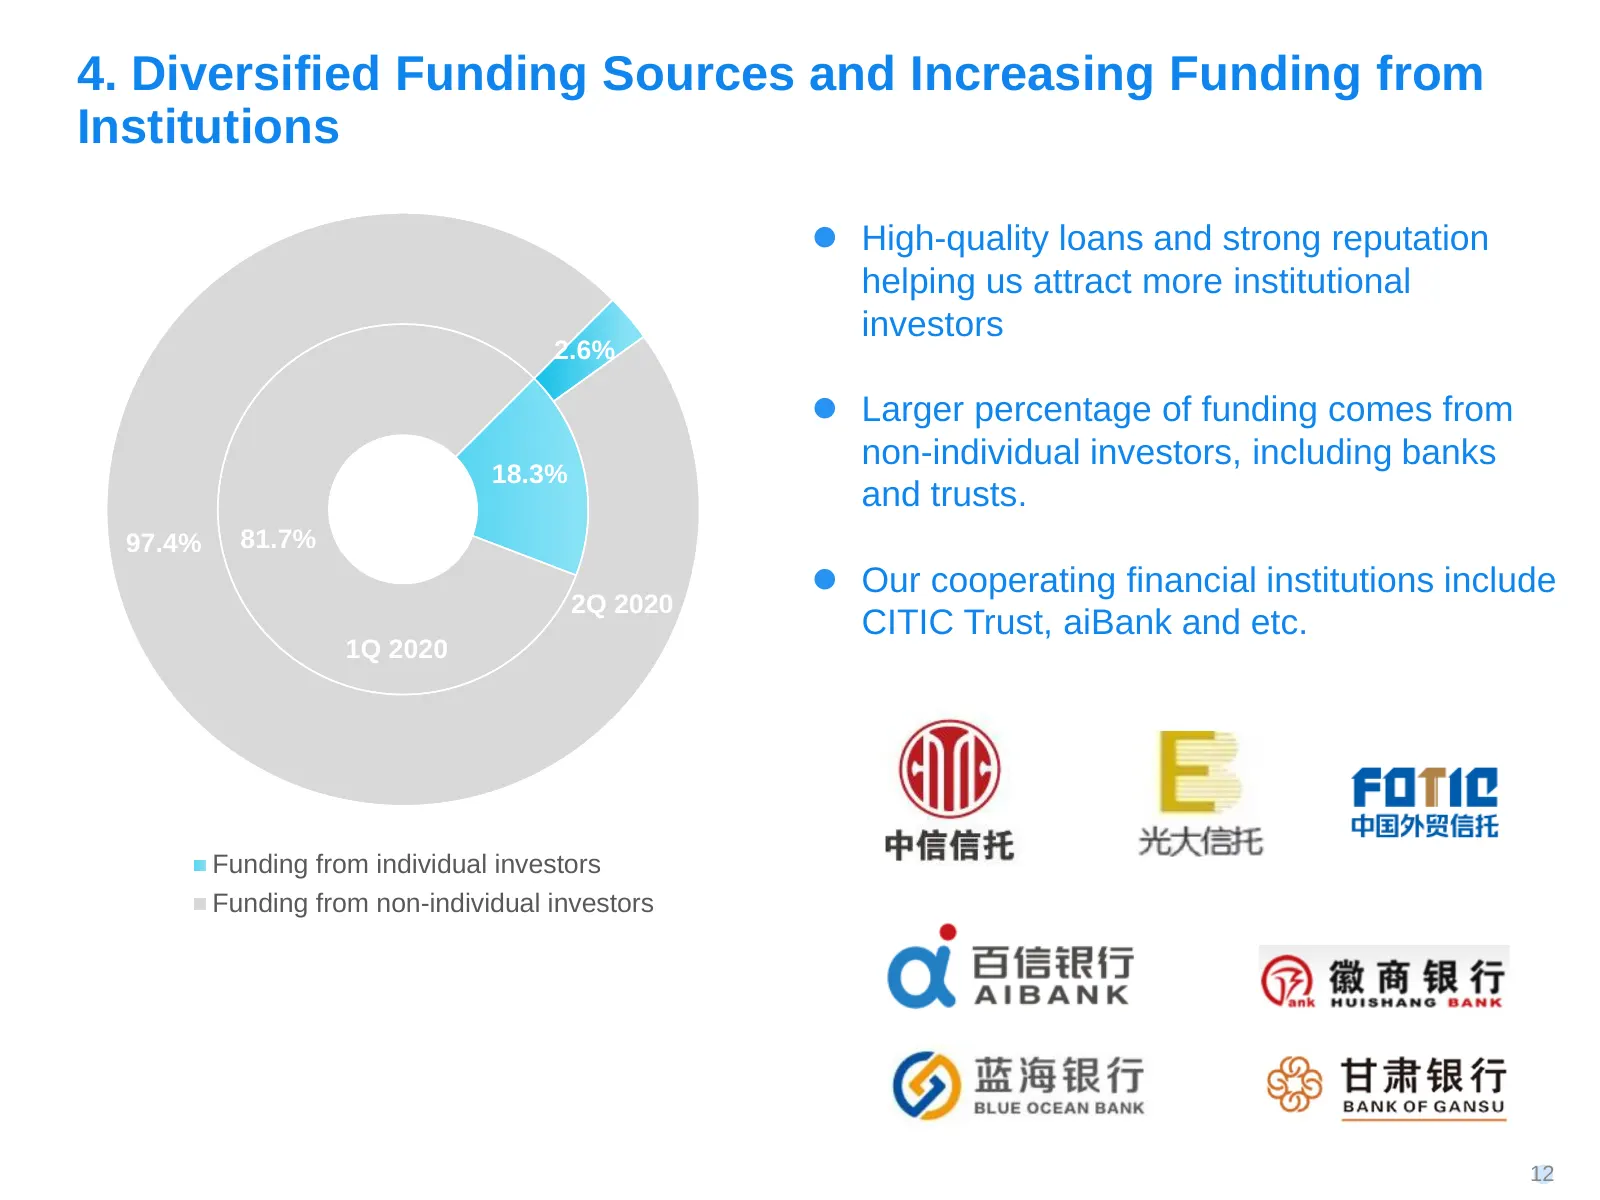
Slide 12: Diversified Funding Sources and Increasing Funding from Institutions
4. Diversified Funding Sources and Increasing Funding from Institutions ⚫ High-quality loans and strong reputation helping us attract more institutional investors 2.6% ⚫ Larger percentage of funding comes from non-individual investors, including banks 18.3% and trusts. 97.4% 81.7% ⚫ Our cooperating
Slide 13: Revolving credit product - Yaoqianhua
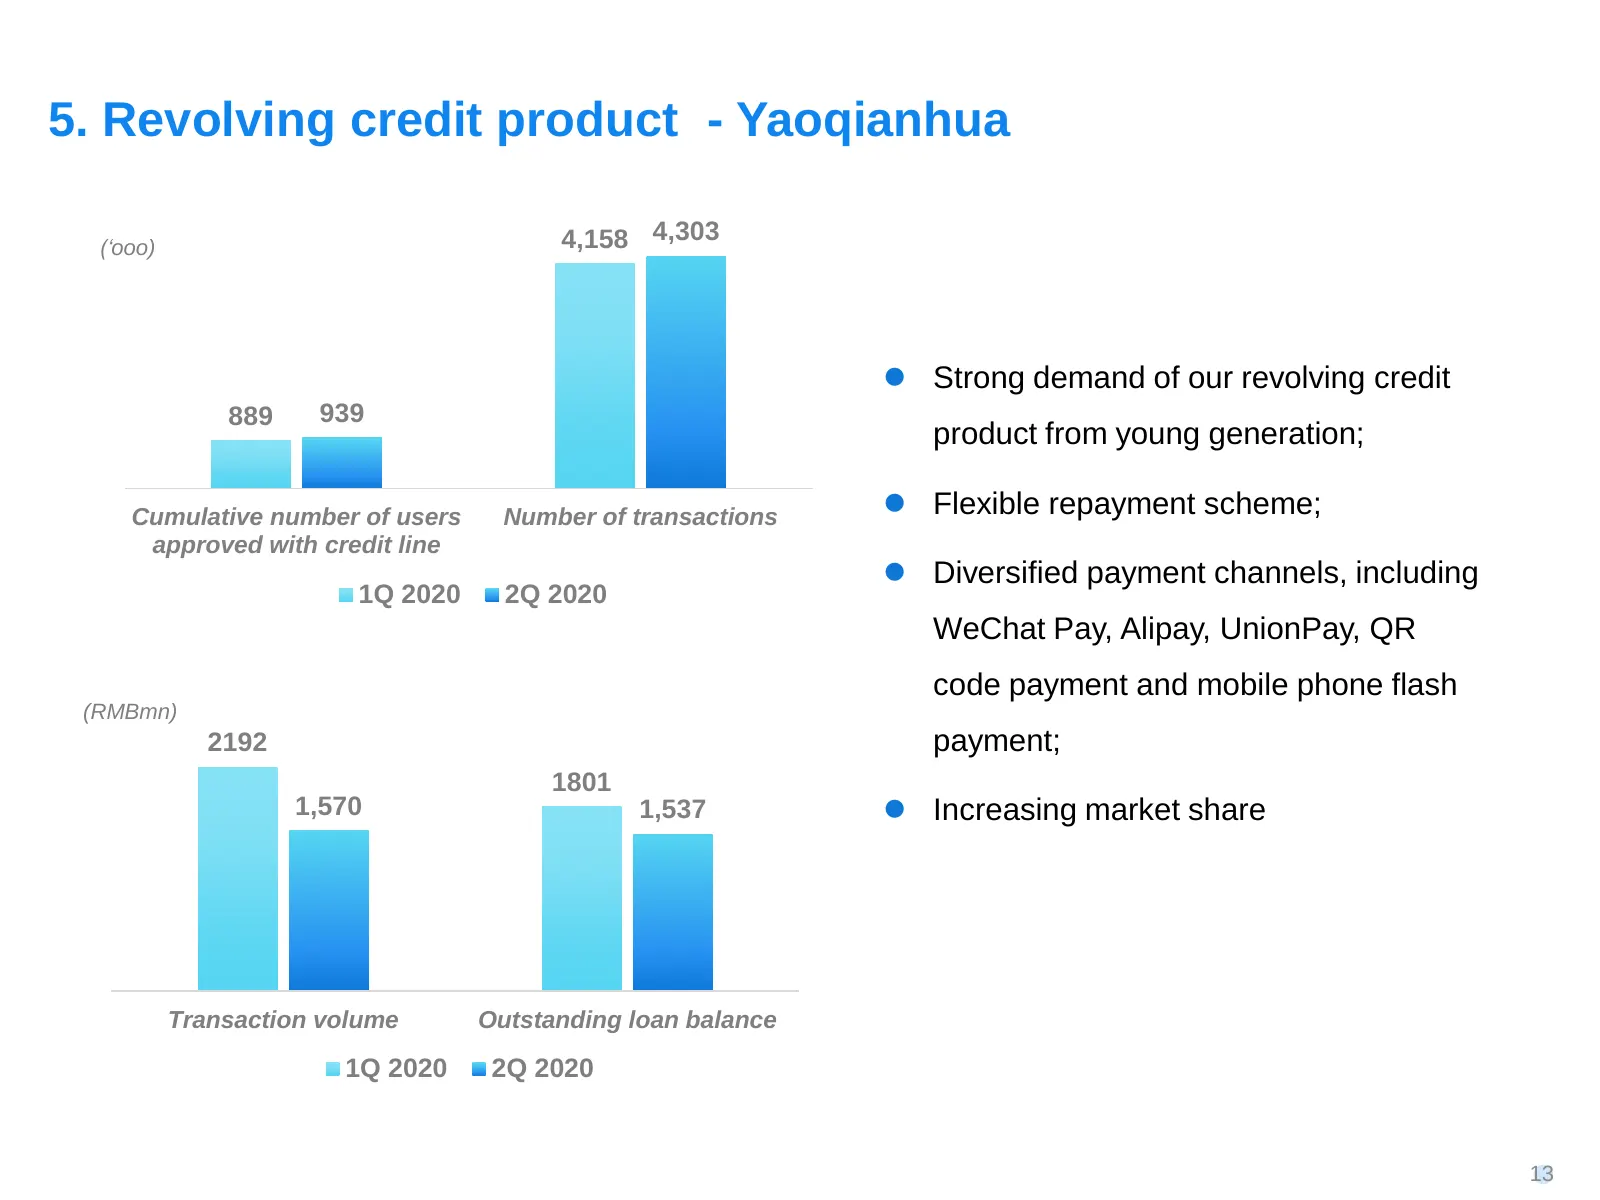
5. Revolving credit product - Yaoqianhua (‘ooo) 4,158 4,303 ⚫ Strong demand of our revolving credit 889 939 product from young generation; Cumulative number of users Number of transactions ⚫ Flexible repayment scheme; approved with credit line ⚫ Diversified payment channels, including 1Q 2020 2Q 202
Slide 14: Seasoned management team
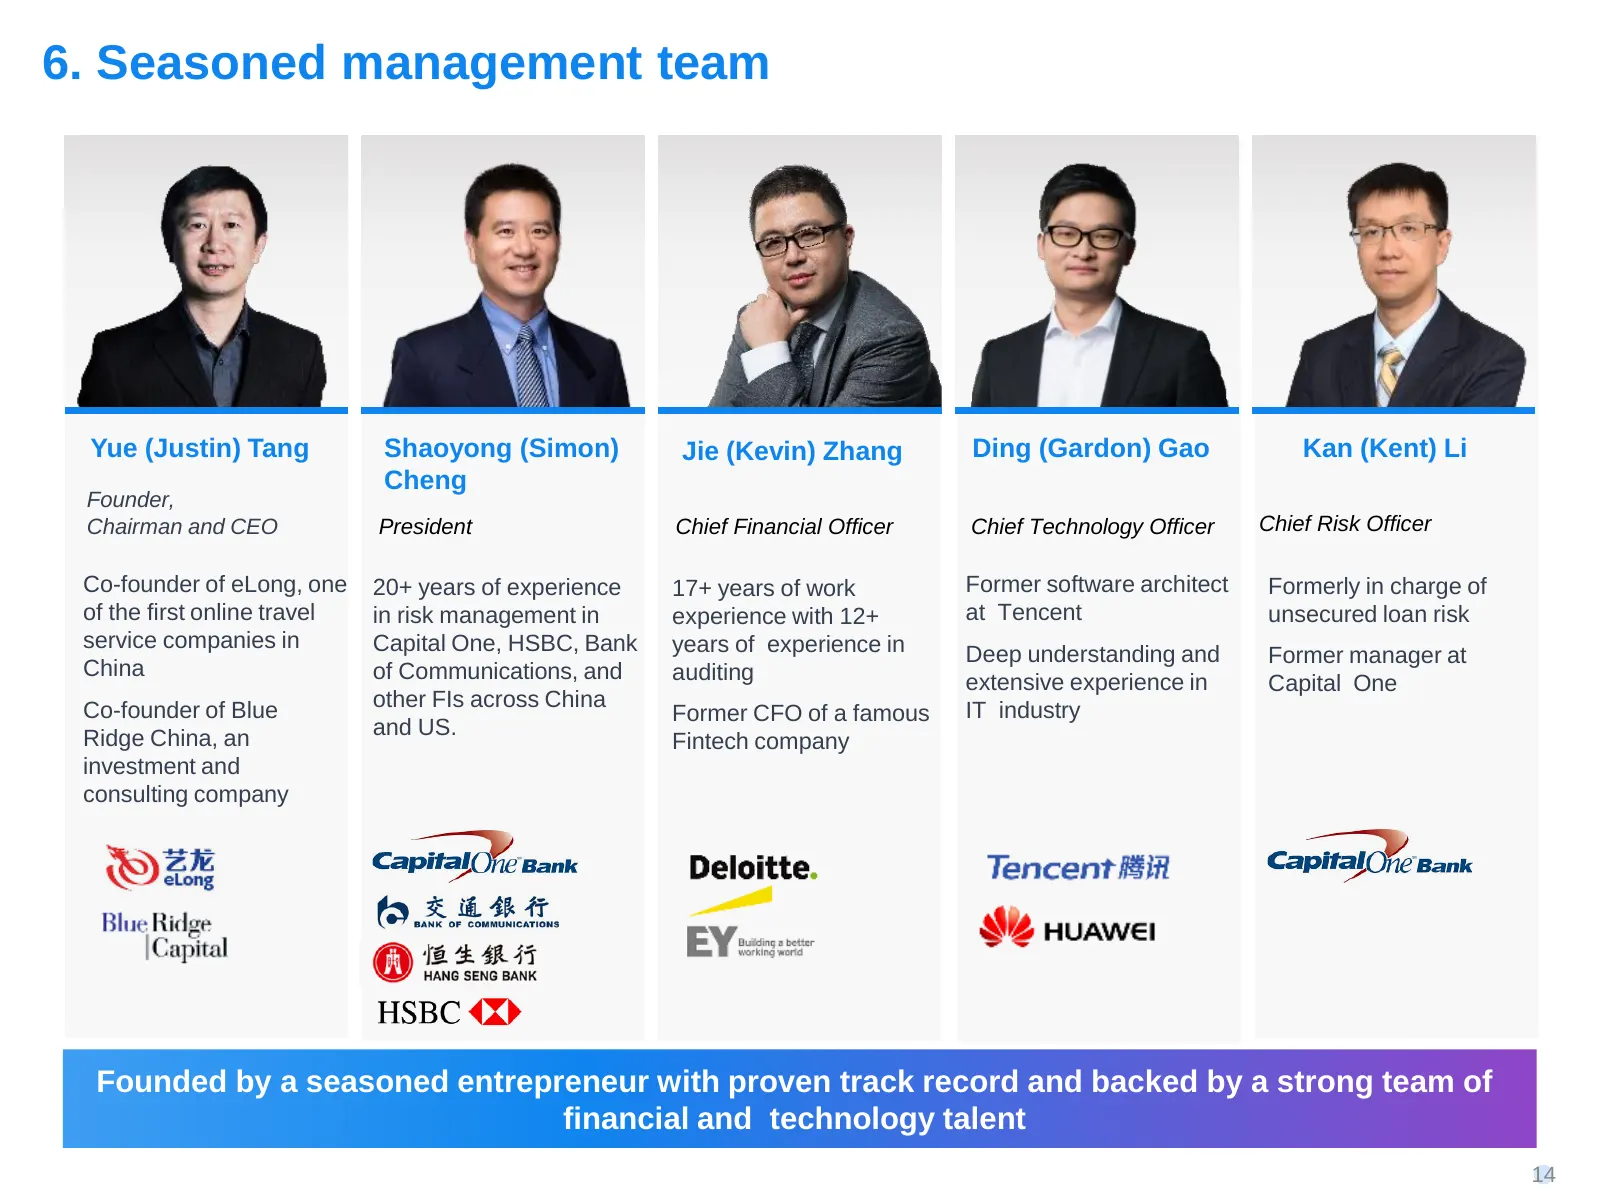
6. Seasoned management team Yue (Justin) Tang Shaoyong (Simon) Jie (Kevin) Zhang Ding (Gardon) Gao Kan (Kent) Li Cheng Founder, Chairman and CEO President Chief Financial Officer Chief Technology Officer Chief Risk Officer Co-founder of eLong, one 20+ years of experience 17+ years of work Former sof
Slide 15: Performance of loan balance and loan facilitation
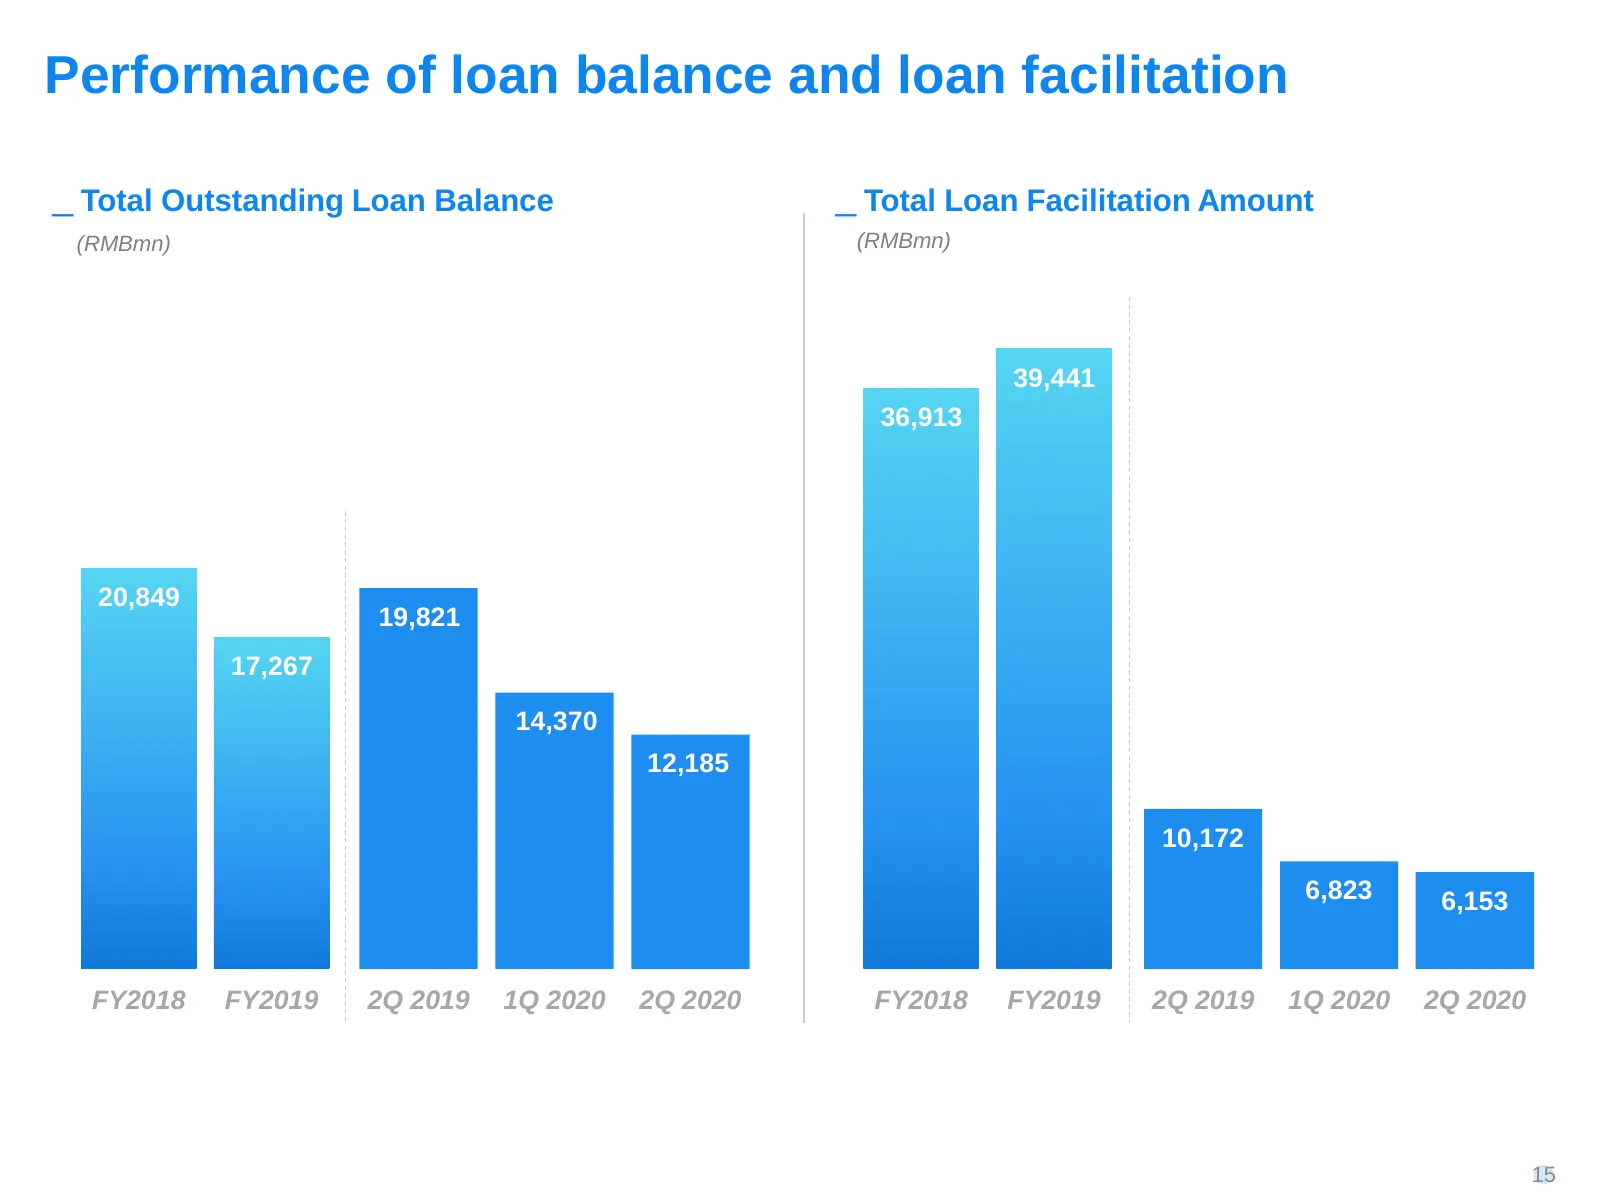
Performance of loan balance and loan facilitation ͟ Total Outstanding Loan Balance ͟ Total Loan Facilitation Amount (RMBmn) (RMBmn) 39,441 36,913 20,849 19,821 17,267 14,370 12,185 10,172 6,823 6,153 FY2018 FY2019 2Q 2019 1Q 2020 2Q 2020 FY2018 FY2019 2Q 2019 1Q 2020 2Q 2020 15
Slide 16: Revenue and non-GAAP adj. net income growth
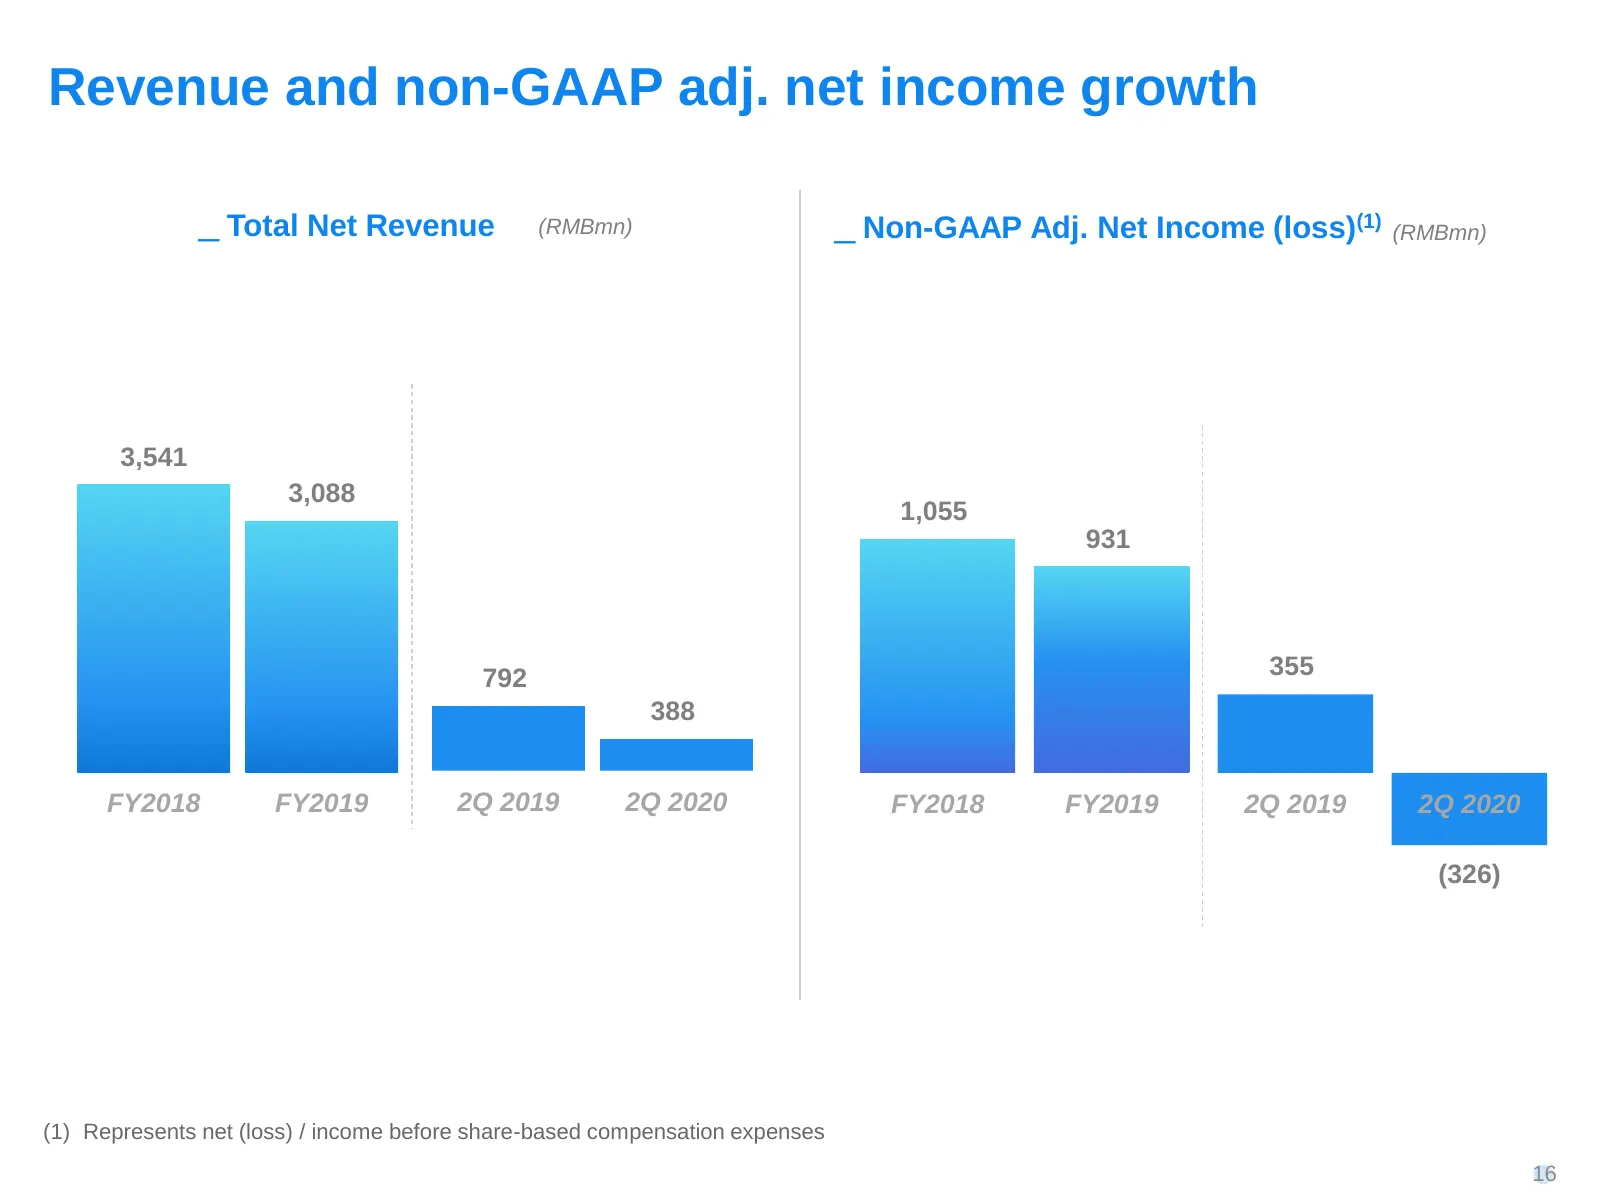
Revenue and non-GAAP adj. net income growth ͟ Total Net Revenue (RMBmn) ͟ Non-GAAP Adj. Net Income (loss)(1) (RMBmn) 3,541 3,088 1,055 931 792 355 388 FY2018 FY2019 2Q 2019 2Q 2020 FY2018 FY2019 2Q 2019 2Q 2020 (326) (1) Represents net (loss) / income before share-based compensation expenses 16
Slide 17: Operational efficiency
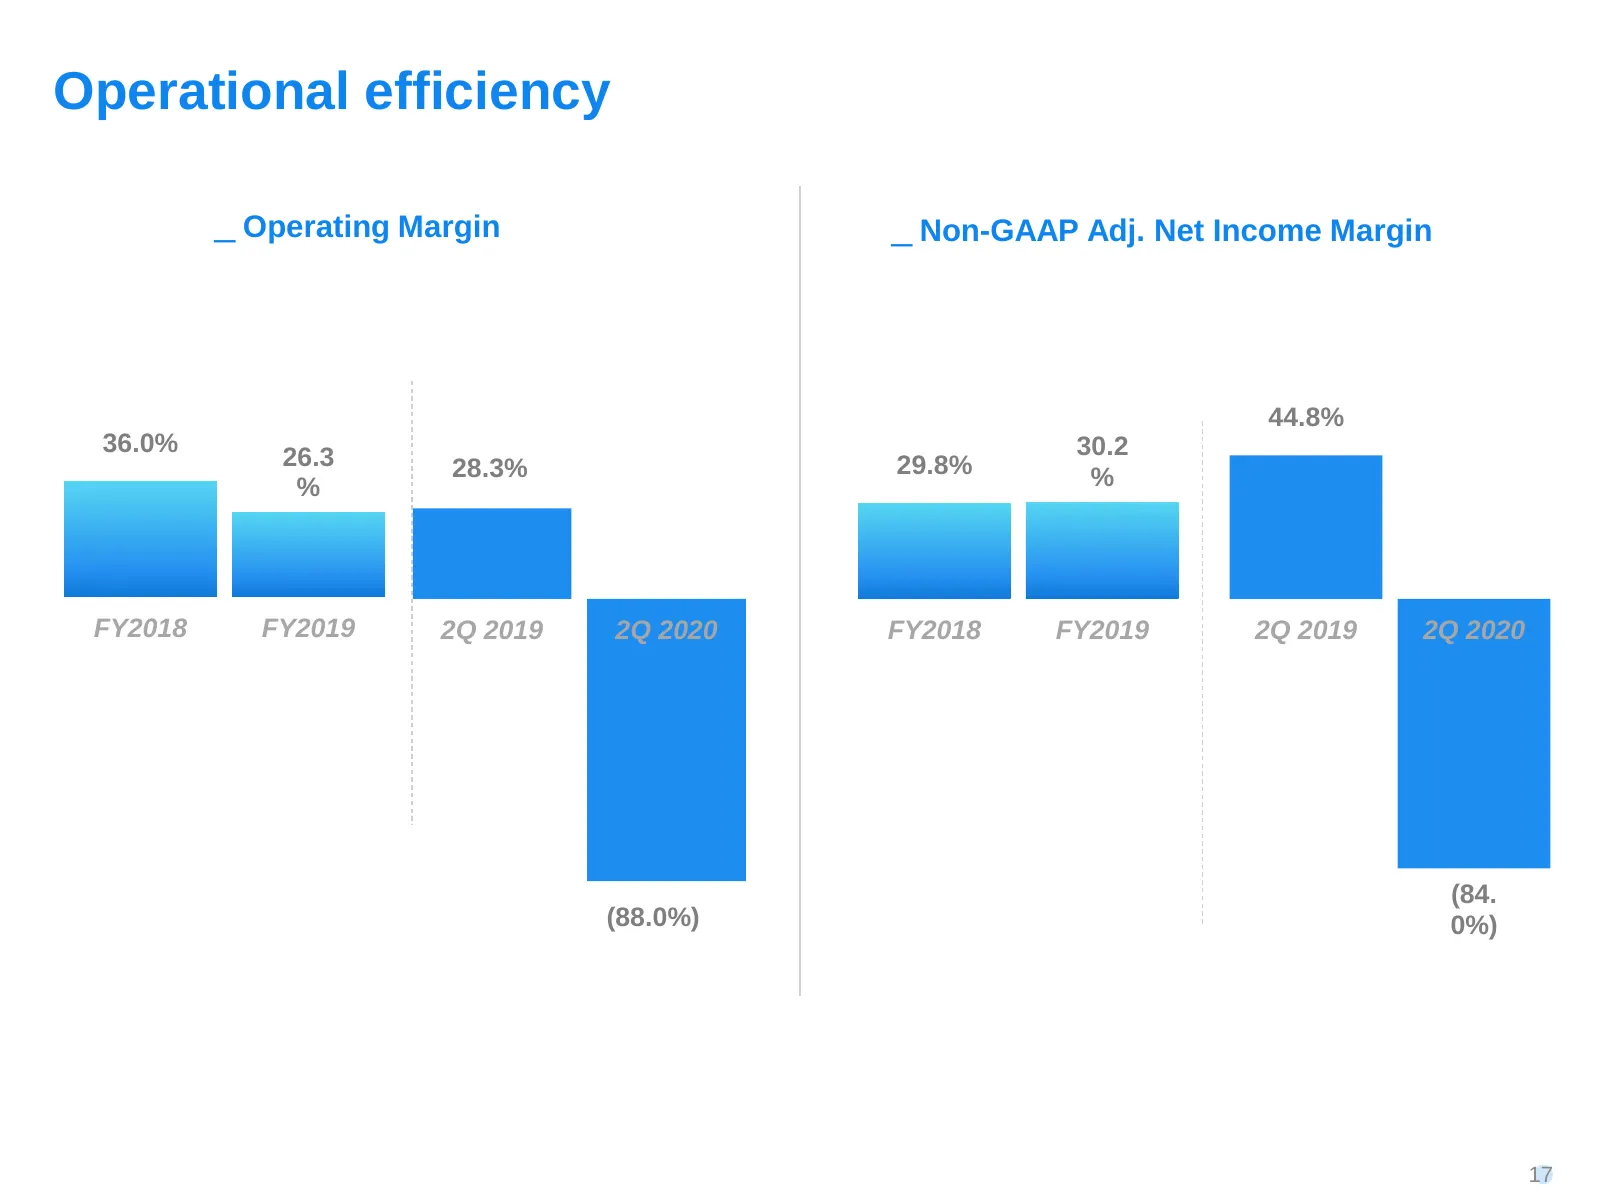
Operational efficiency ͟ Operating Margin ͟ Non-GAAP Adj. Net Income Margin 44.8% 36.0% 30.2 26.3 28.3% 29.8% % % FY2018 FY2019 2Q 2019 2Q 2020 FY2018 FY2019 2Q 2019 2Q 2020 (84. (88.0%) 0%) 17
Slide 18: Net revenue per employee and operating expense
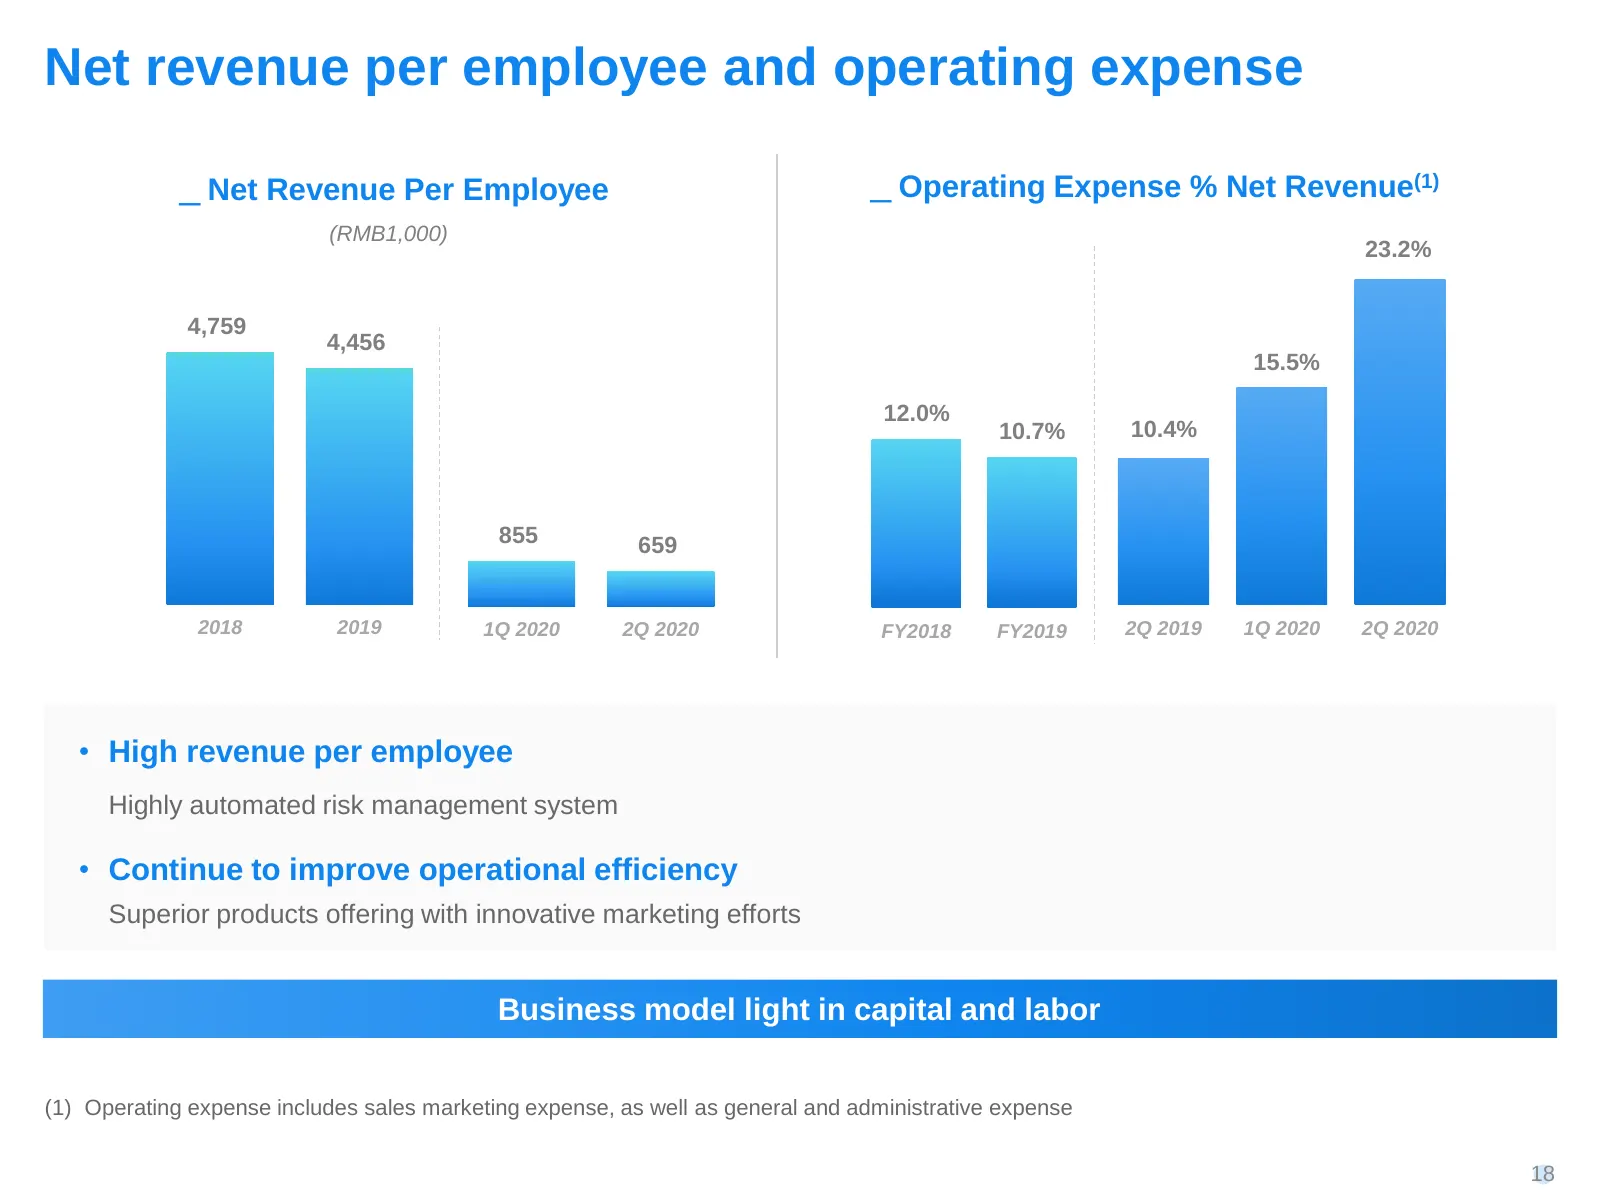
Net revenue per employee and operating expense ͟ Net Revenue Per Employee ͟ Operating Expense % Net Revenue(1) (RMB1,000) 23.2% 4,759 4,456 15.5% 12.0% 10.7% 10.4% 855 659 2018 2019 1Q 2020 2Q 2020 FY2018 FY2019 2Q 2019 1Q 2020 2Q 2020 • High revenue per employee Highly automated risk management sys
Slide 19: Outstanding return on equity performance
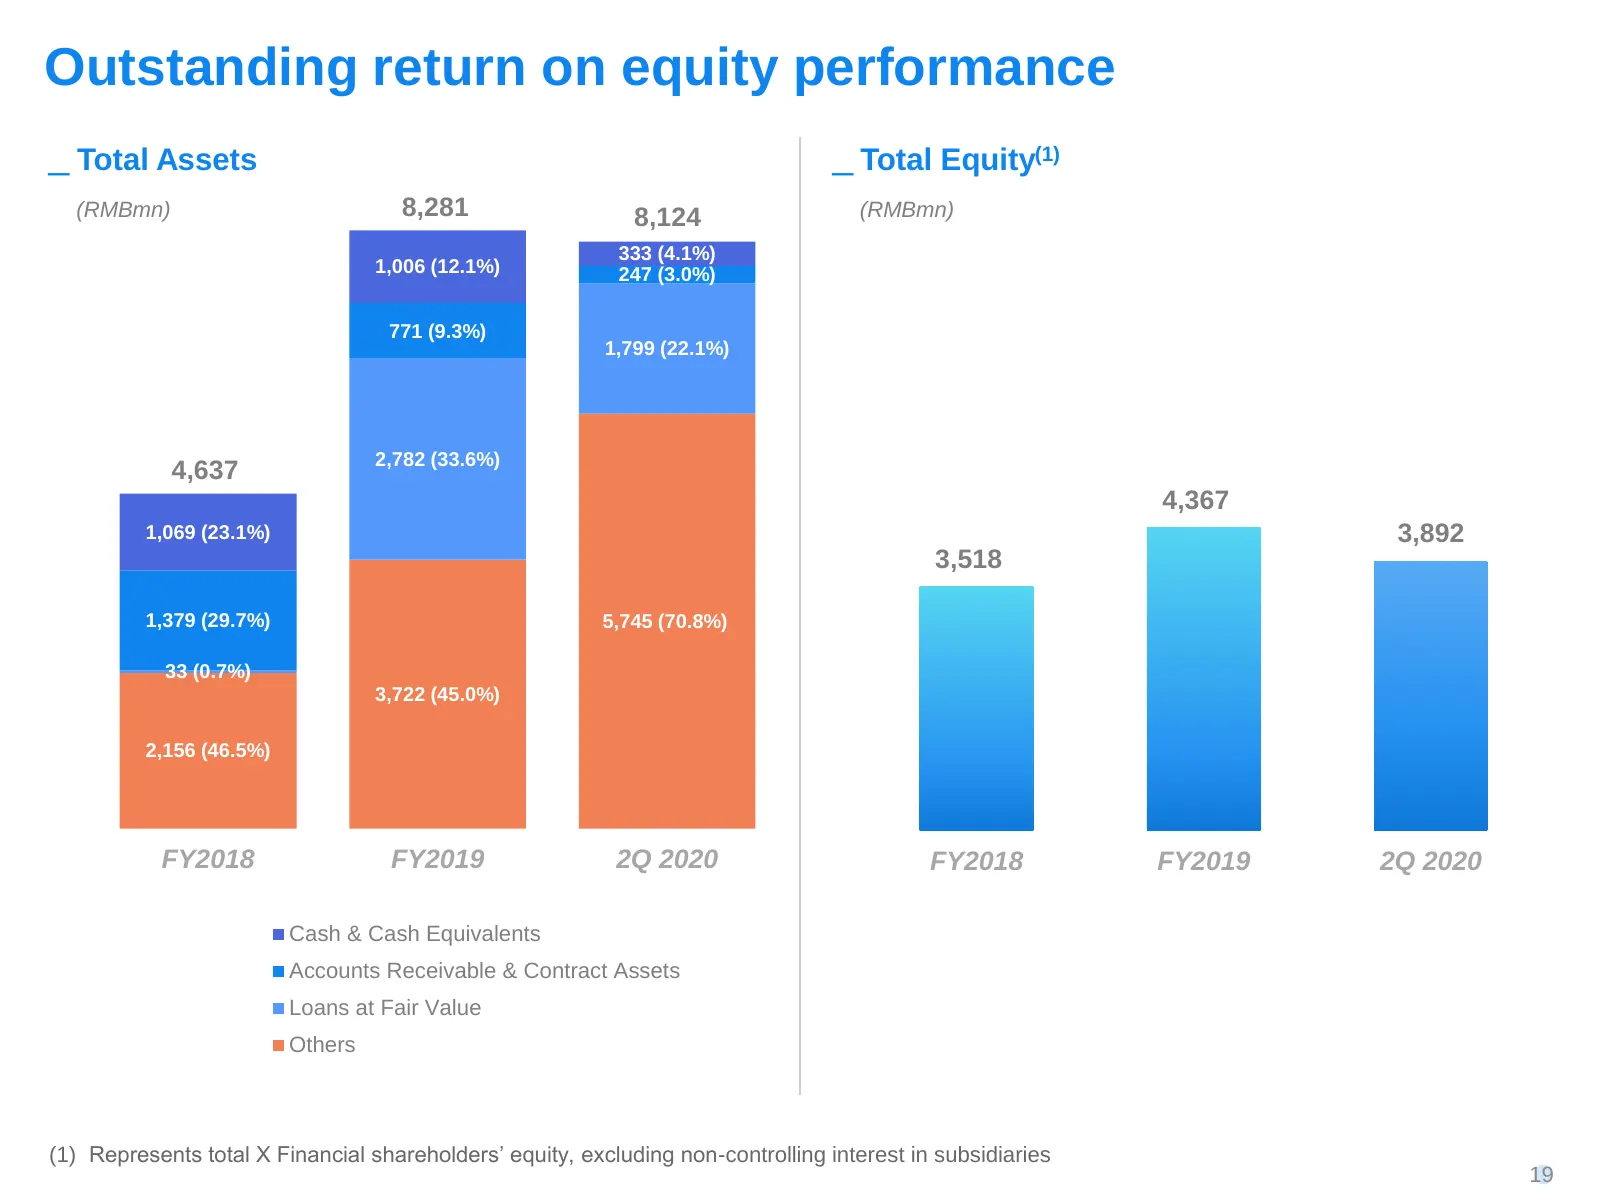
Outstanding return on equity performance ͟ Total Assets ͟ Total Equity(1) (RMBmn) 8,281 8,124 (RMBmn) 333 (4.1%) 1,006 (12.1%) 247 (3.0%) 771 (9.3%) 1,799 (22.1%) 2,782 (33.6%) 4,637 4,367 1,069 (23.1%) 3,892 3,518 1,379 (29.7%) 5,745 (70.8%) 33 (0.7%) 3,722 (45.0%) 2,156 (46.5%) FY2018 FY2019 2Q 20
Slide 20: Our growth strategies
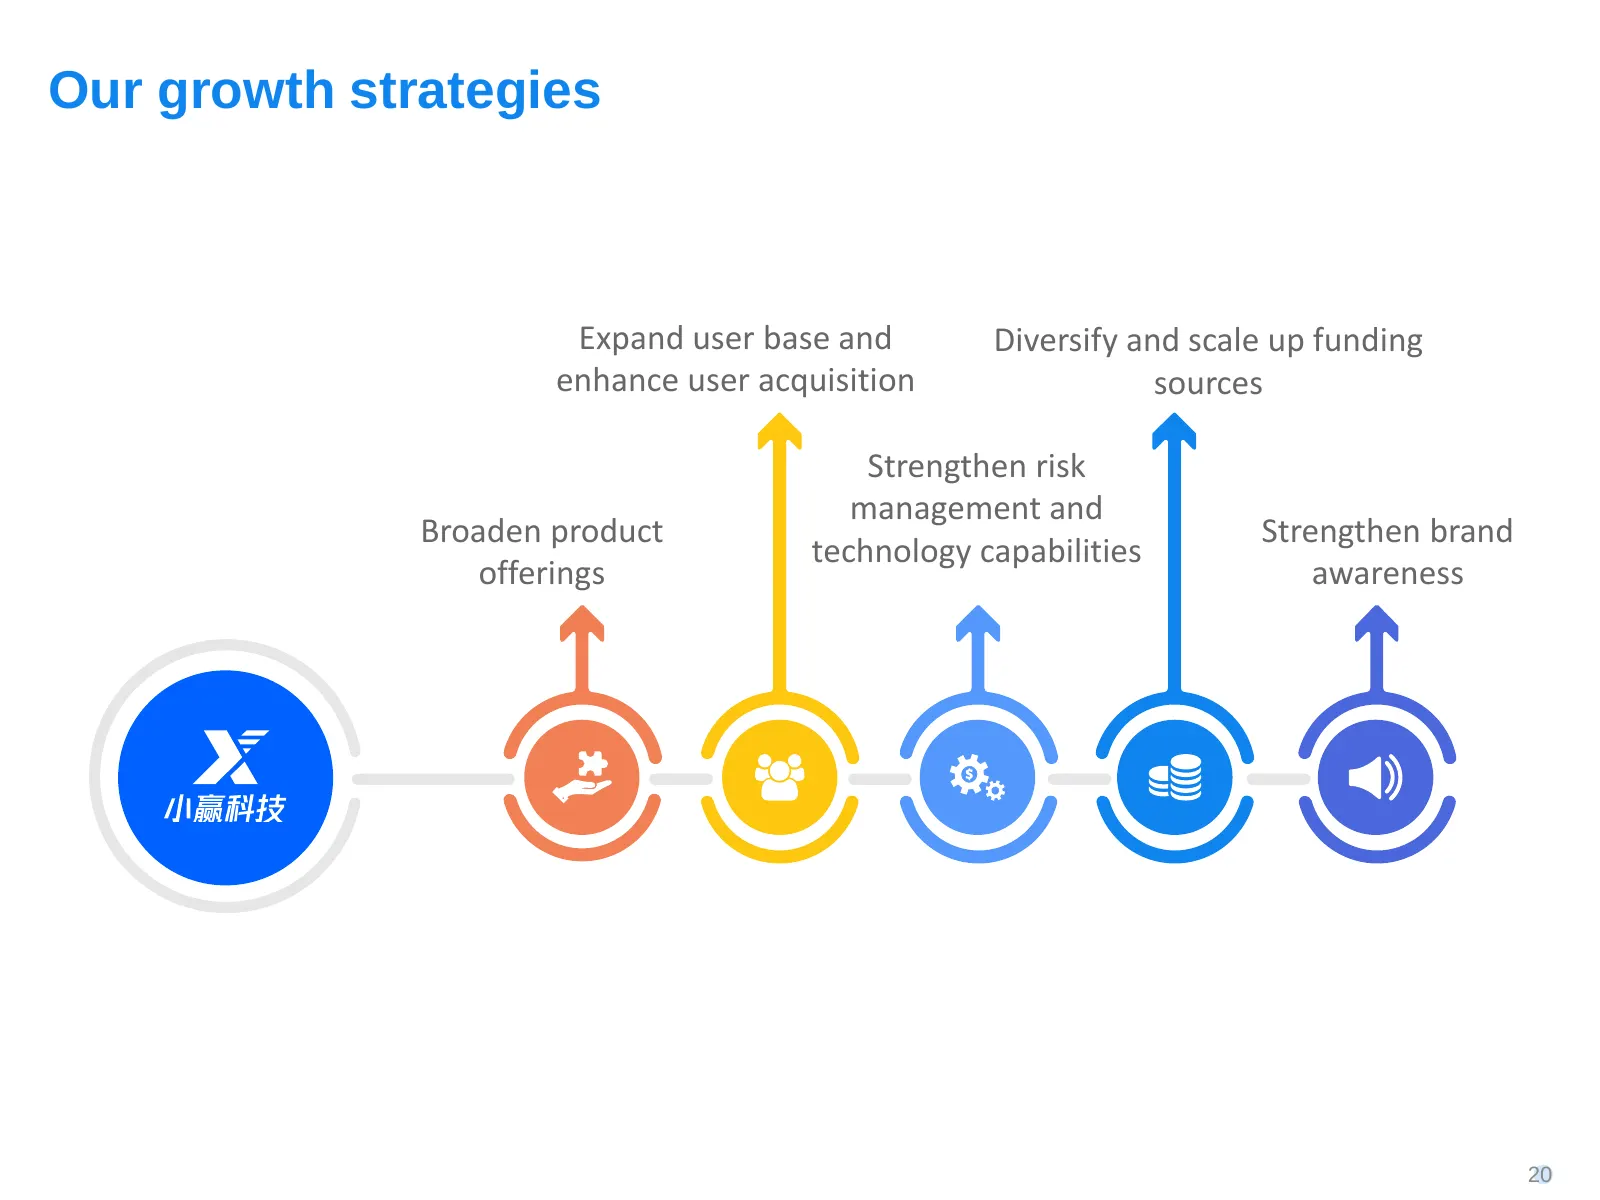
Our growth strategies Expand user base and Diversify and scale up funding enhance user acquisition sources Strengthen risk management and Broaden product Strengthen brand technology capabilities offerings awareness 20
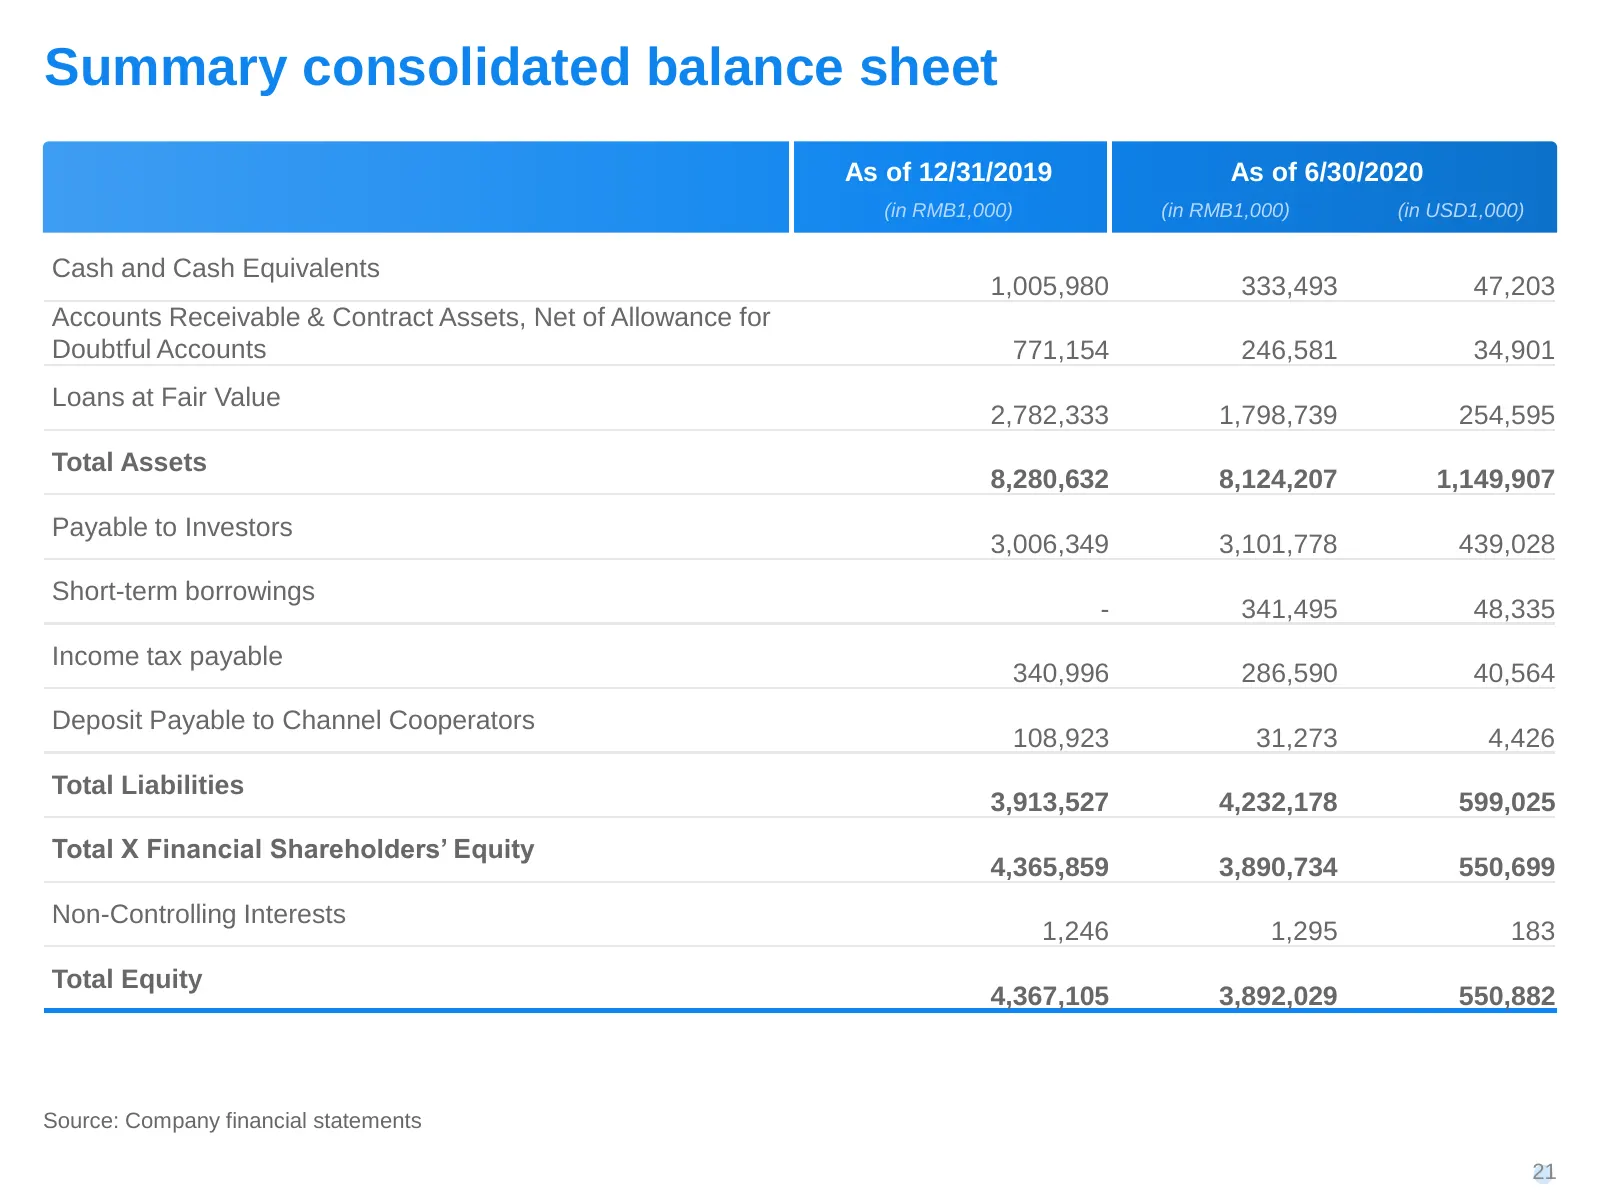
Slide 21: Summary consolidated balance sheet
Summary consolidated balance sheet As of 12/31/2019 As of 6/30/2020 (in RMB1,000) (in RMB1,000) (in USD1,000) Cash and Cash Equivalents 1,005,980 333,493 47,203 Accounts Receivable & Contract Assets, Net of Allowance for Doubtful Accounts 771,154 246,581 34,901 Loans at Fair Value 2,782,333 1,798,73
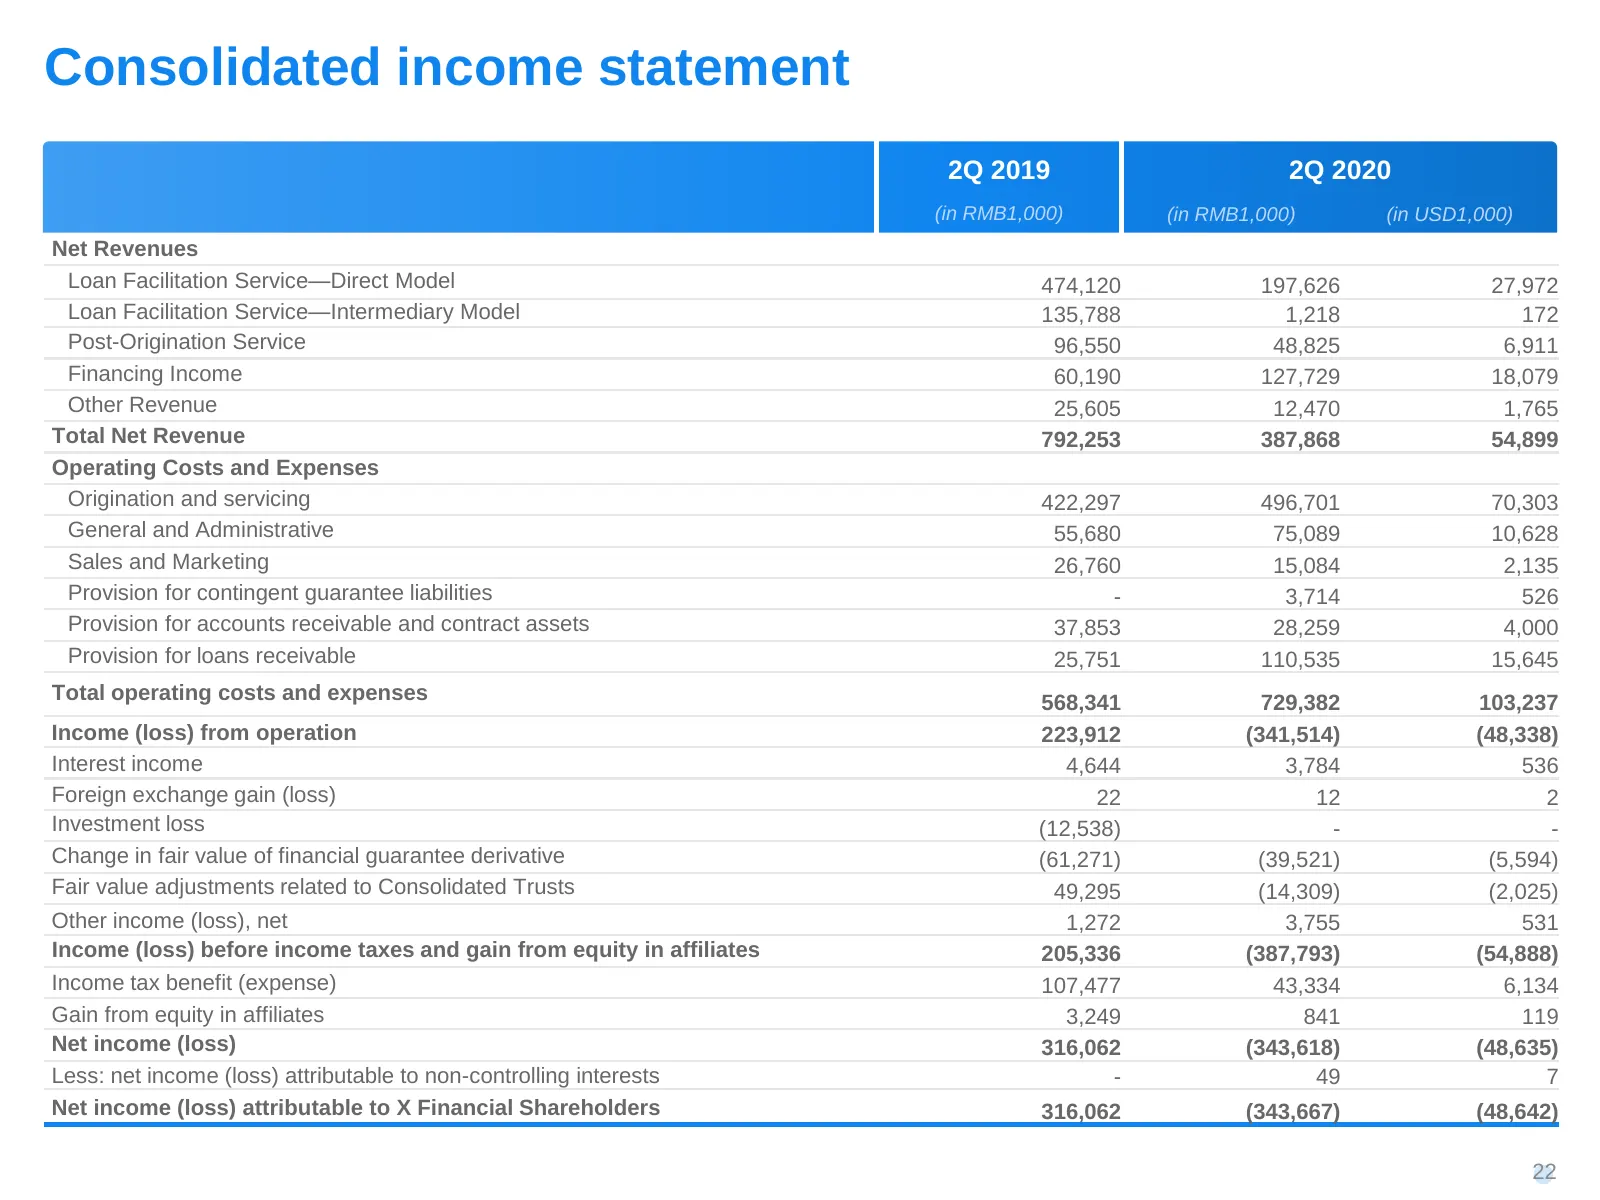
Slide 22: Consolidated income statement
Consolidated income statement 2Q 2019 2Q 2020 (in RMB1,000) (in RMB1,000) (in USD1,000) Net Revenues Loan Facilitation Service—Direct Model 474,120 197,626 27,972 Loan Facilitation Service—Intermediary Model 135,788 1,218 172 Post-Origination Service 96,550 48,825 6,911 Financing Income 60,190 127,7
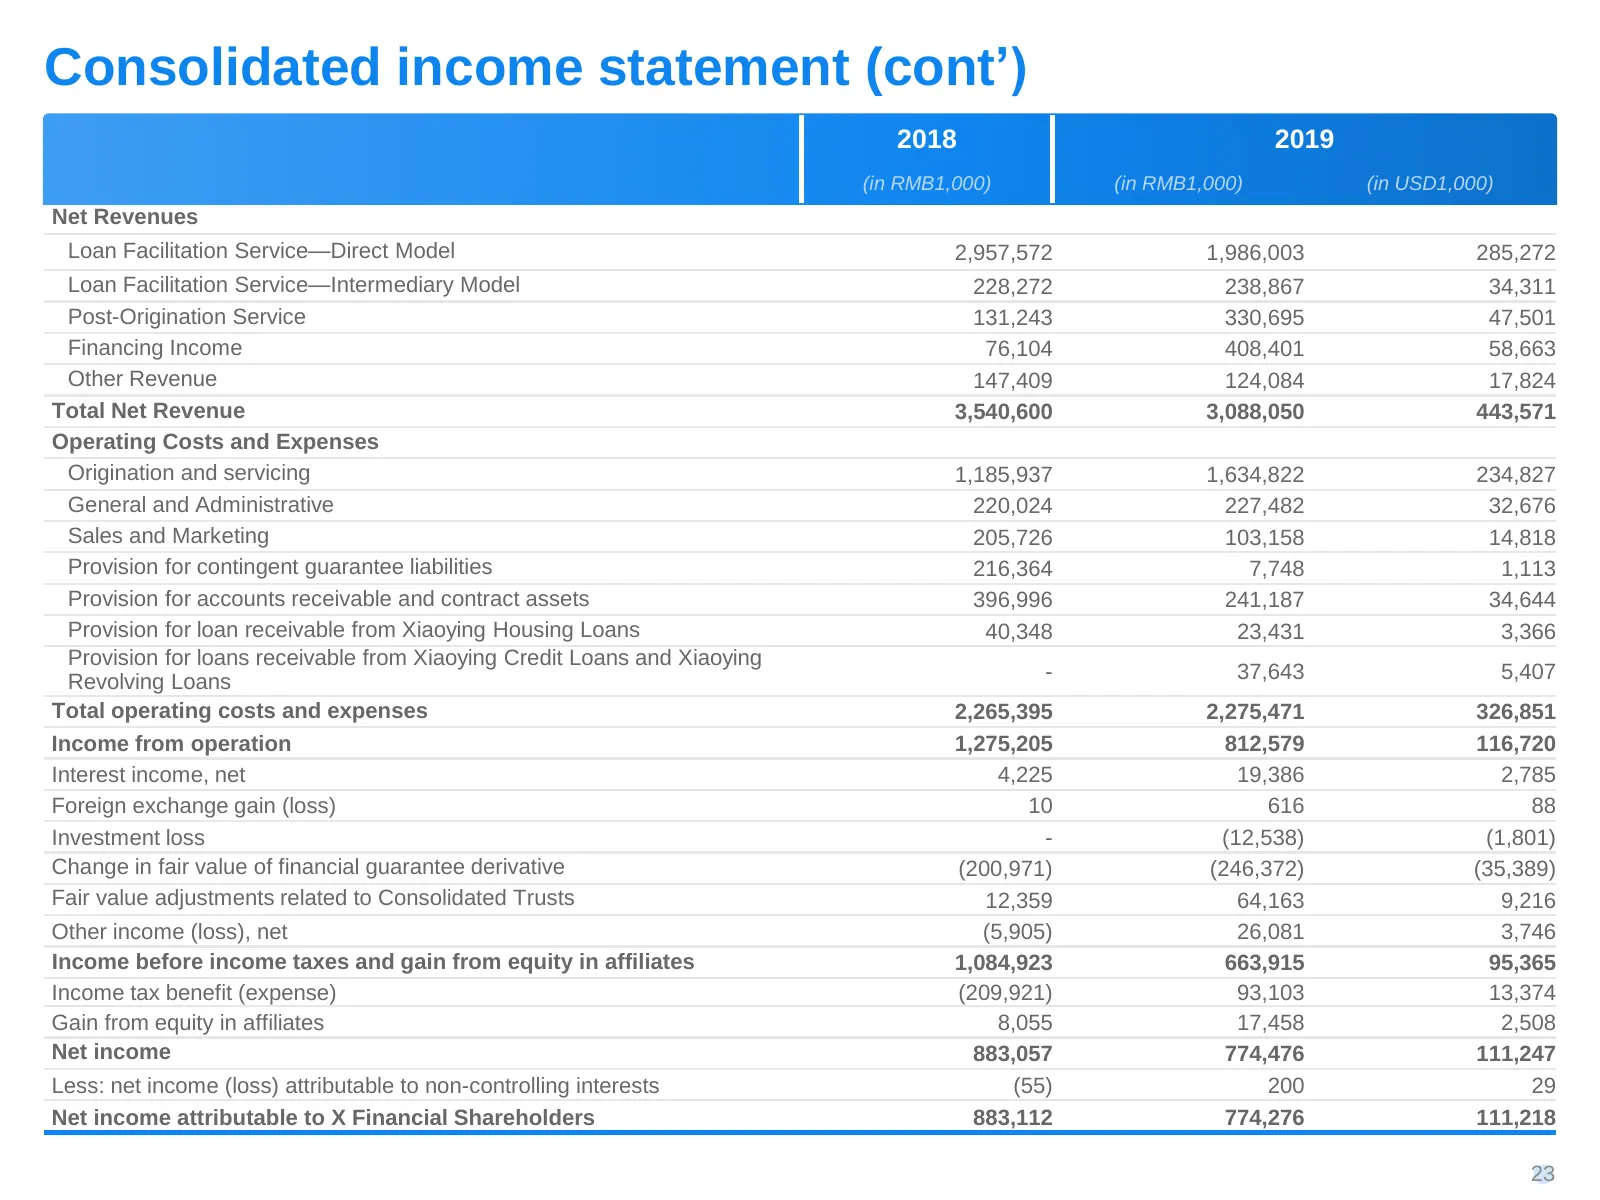
Slide 23: Consolidated income statement (cont'd)
Consolidated income statement (cont’) 2018 2019 (in RMB1,000) (in RMB1,000) (in USD1,000) Net Revenues Loan Facilitation Service—Direct Model 2,957,572 1,986,003 285,272 Loan Facilitation Service—Intermediary Model 228,272 238,867 34,311 Post-Origination Service 131,243 330,695 47,501 Financing Inco
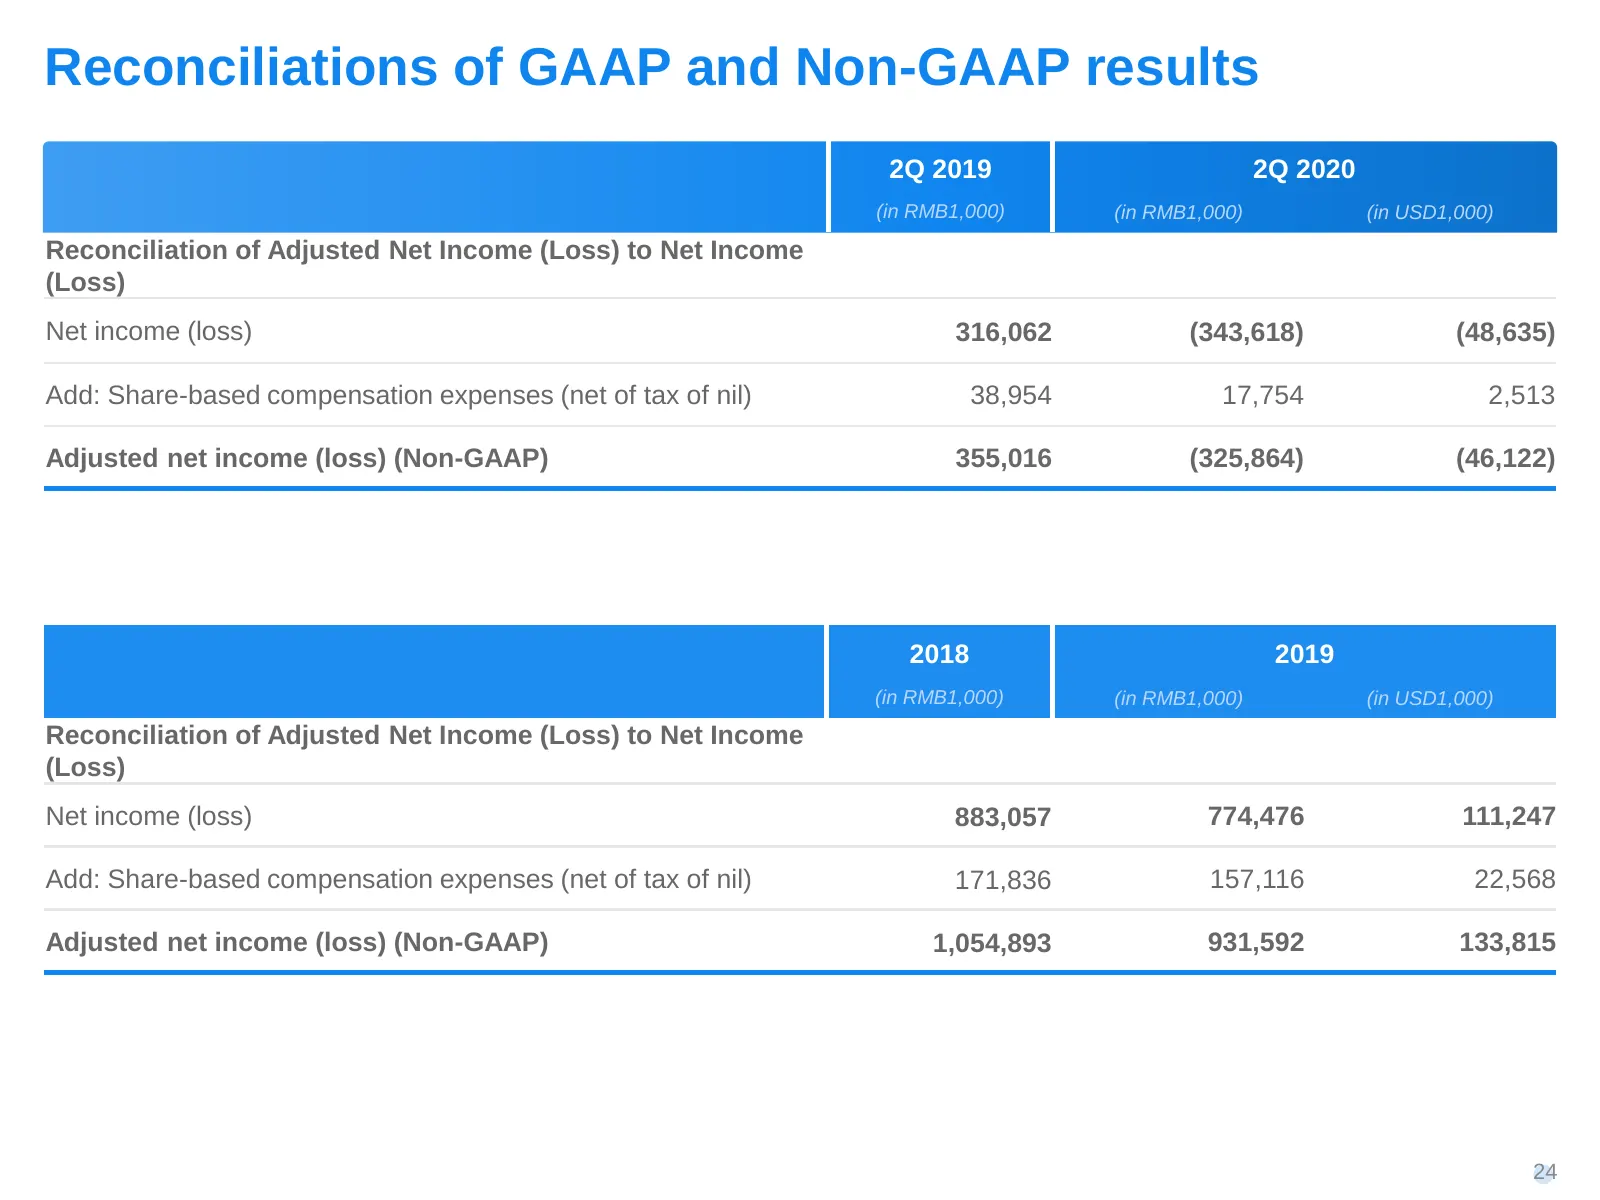
Slide 24: Reconciliations of GAAP and Non-GAAP results
Reconciliations of GAAP and Non-GAAP results 2Q 2019 2Q 2020 (in RMB1,000) (in RMB1,000) (in USD1,000) Reconciliation of Adjusted Net Income (Loss) to Net Income (Loss) Net income (loss) 316,062 (343,618) (48,635) Add: Share-based compensation expenses (net of tax of nil) 38,954 17,754 2,513 Adjuste
Source: EarningsCall slides
More decks from X Financial
 Q2 2026 Earnings Presentation19 slides · Aug 24, 2026
 Q1 2026 Earnings Presentation19 slides · May 28, 2026
 Q4 2025 Earnings Presentation20 slides · Mar 26, 2026
 Q3 2025 Earnings Presentation20 slides · November 2025
 Q2 2025 Earnings Presentation20 slides · Aug 19, 2025
 Q4 2024 Earnings Presentation25 slides · May 20, 2025