X Financial · NYSE:XYF
X Financial — Q2 2025 Earnings Presentation
20 slides from X Financial's earnings presentation, Aug 19, 2025
Slide 1: X Financial
X Financial L] Digital Lending Marketplace == i)

Slide 2: Disclaimer
Disclaimer This presentation has been prepared by X Financial (the “Company”) solely for information purpose and has not been independently verified. No representations, warranties or undertakings, express or implied, are made by the Company or any of its affiliates, advisers, or representatives or
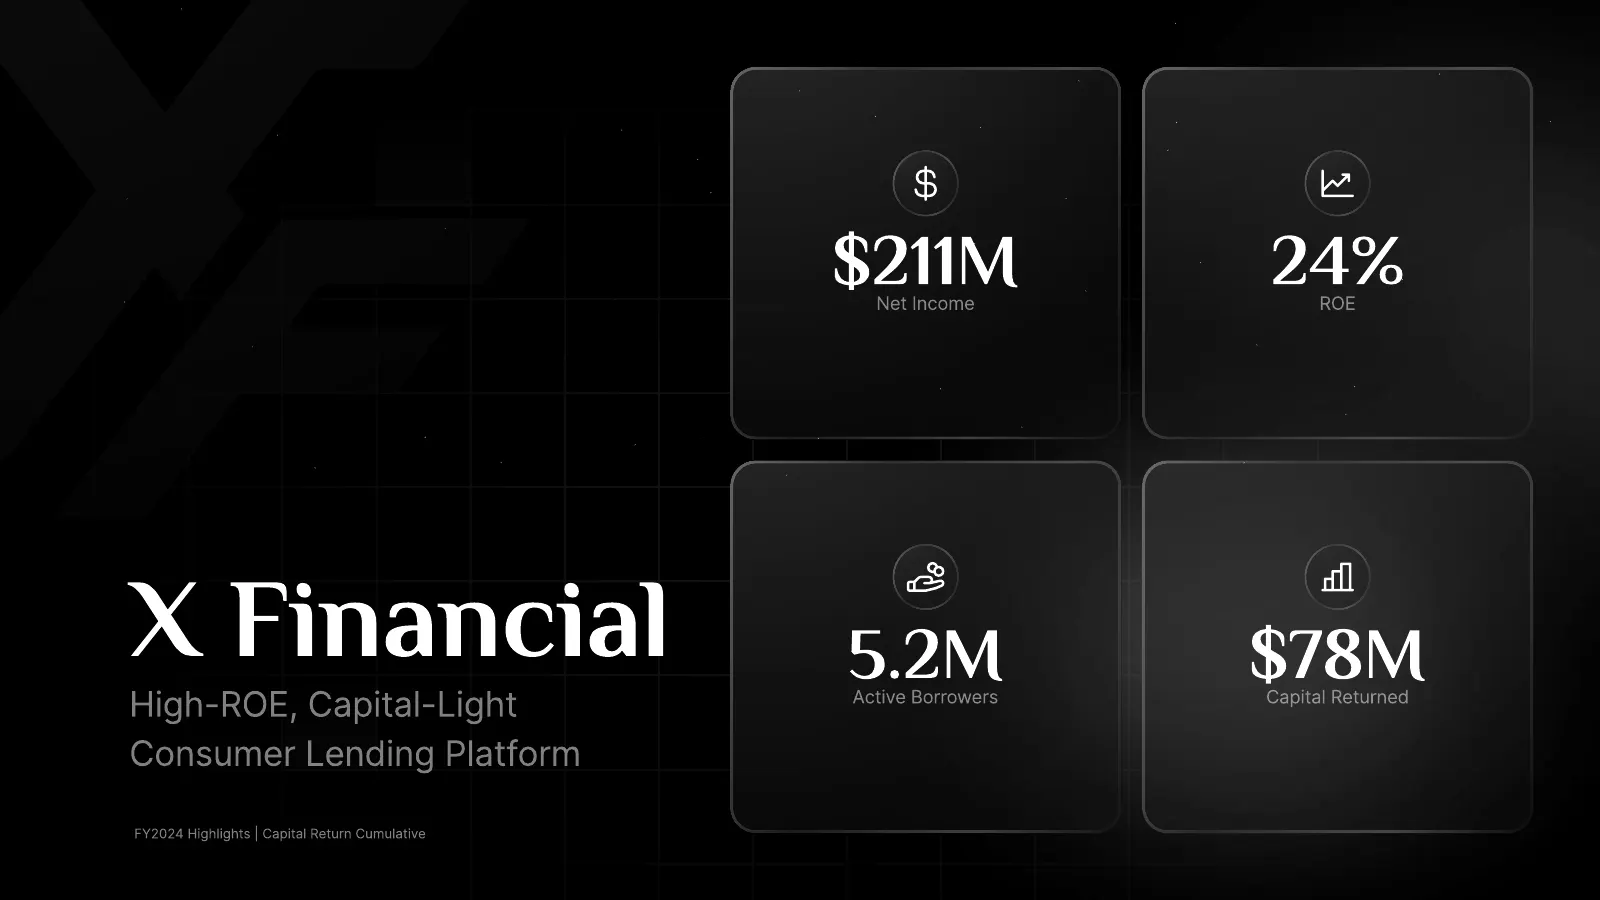
Slide 3: X Financial
$211M 24% X Financial 5.2M $78M
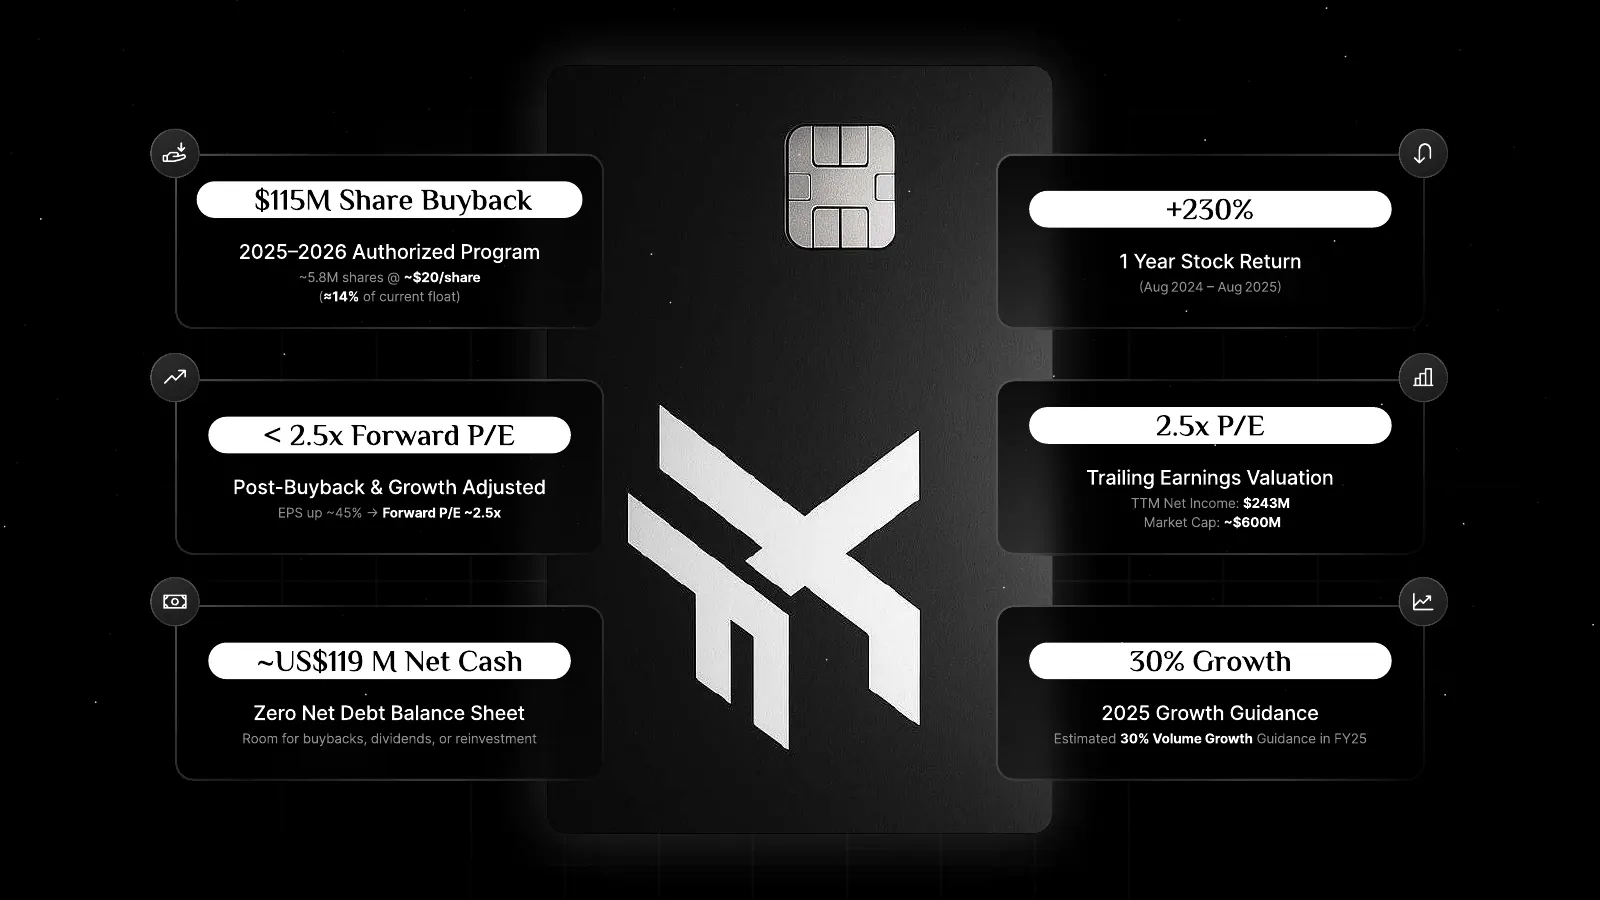
Slide 4: 30% Growth
$115M Share Buyback +230% 2025–2026 Authorized Program 1 Year Stock Return ~5.8M shares @ ~$20/shar< (Aug 2024 – Aug 2025) (≈14% of current float) < 2.5x Forward P/E 2.5x P/E Post-Buyback & Growth Adjusted Trailing Earnings Valuation TTM Net Income: $243 EPS up ~45% → Forward P/E ~2.5x Market Cap: ~
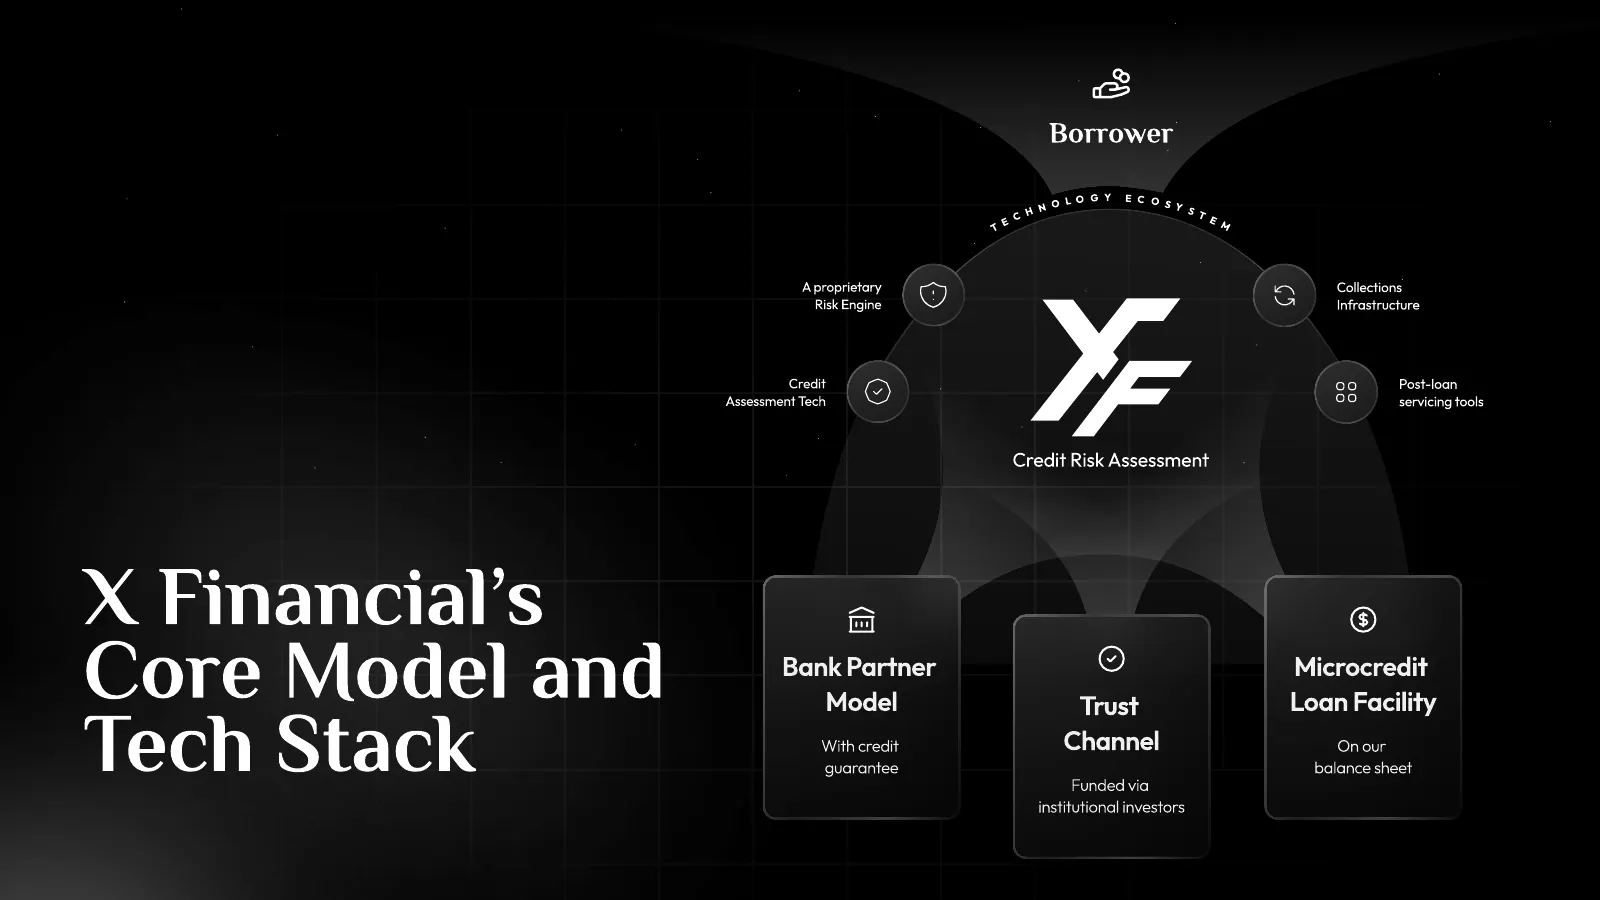
Slide 5: X Financial's core model and tech stack
Borrower o l o g y E c o s y h n s t c e e m T A proprietary Collections Risk Engine Infrastructure Credit Post-loan Assessment Tech servicing tools Credit Risk Assessment X Financial’sr core model andr Bank Partner Model Trust Microcredit Loan Facility tech stack With credit guarantee Channel Funde
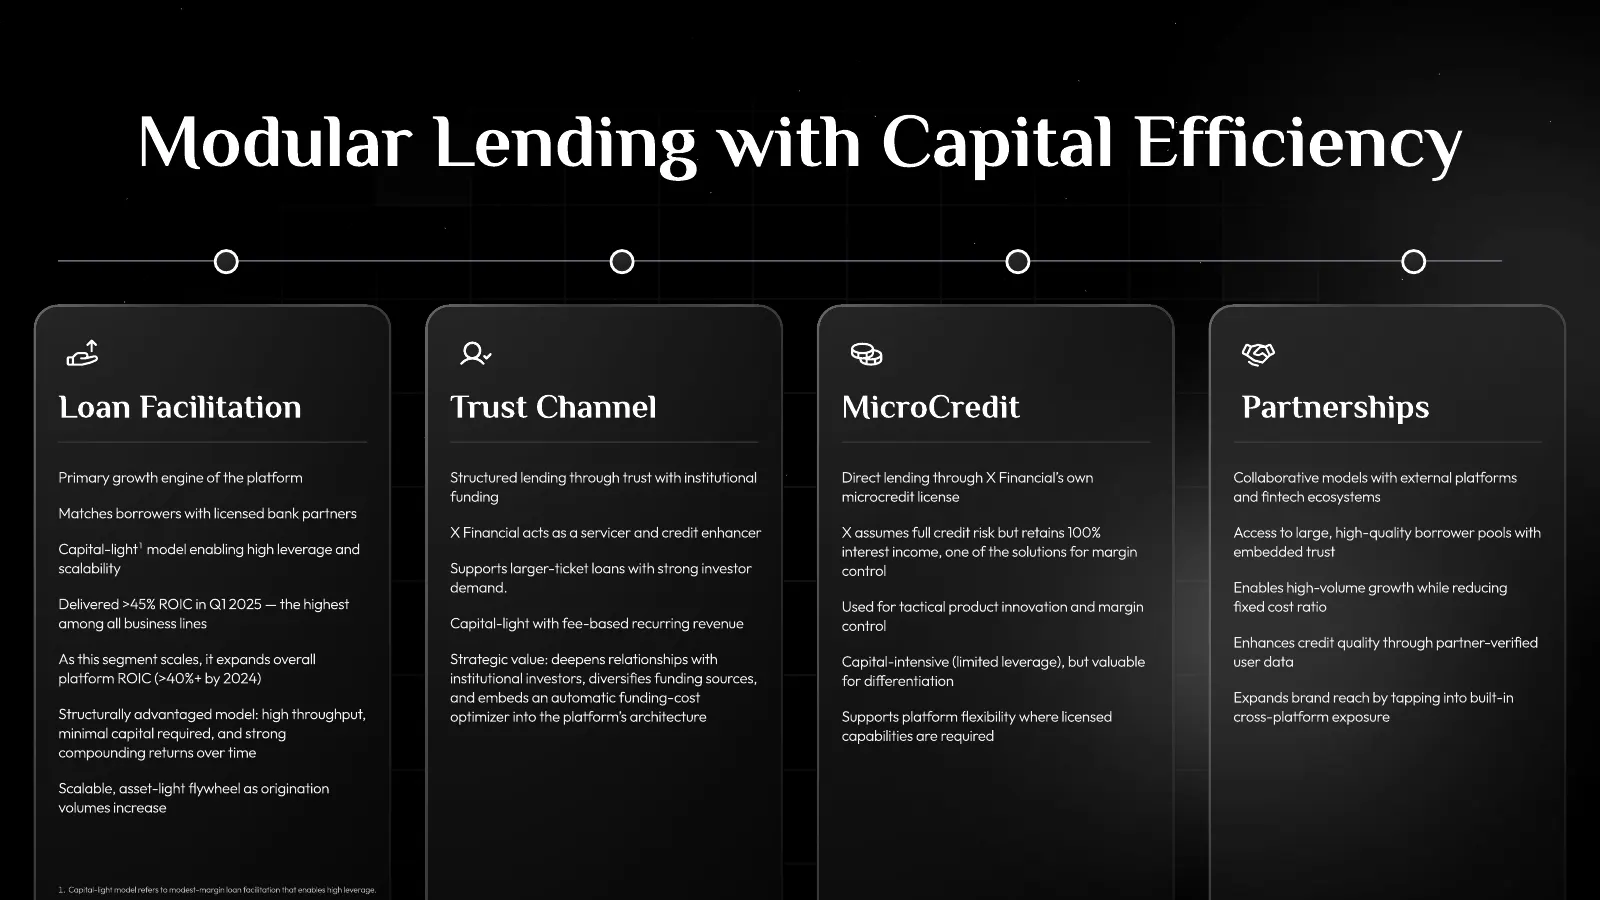
Slide 6: Modular Lending with Capital Efficiency
Modular Lending with Capital Efficiency Loan Facilitation Trust Channel MicroCredit Partnerships Primary growth engine of the platform Structured lending through trust with institutional Direct lending through X Financial’s own Collaborative models with external platforms funding microcredit license
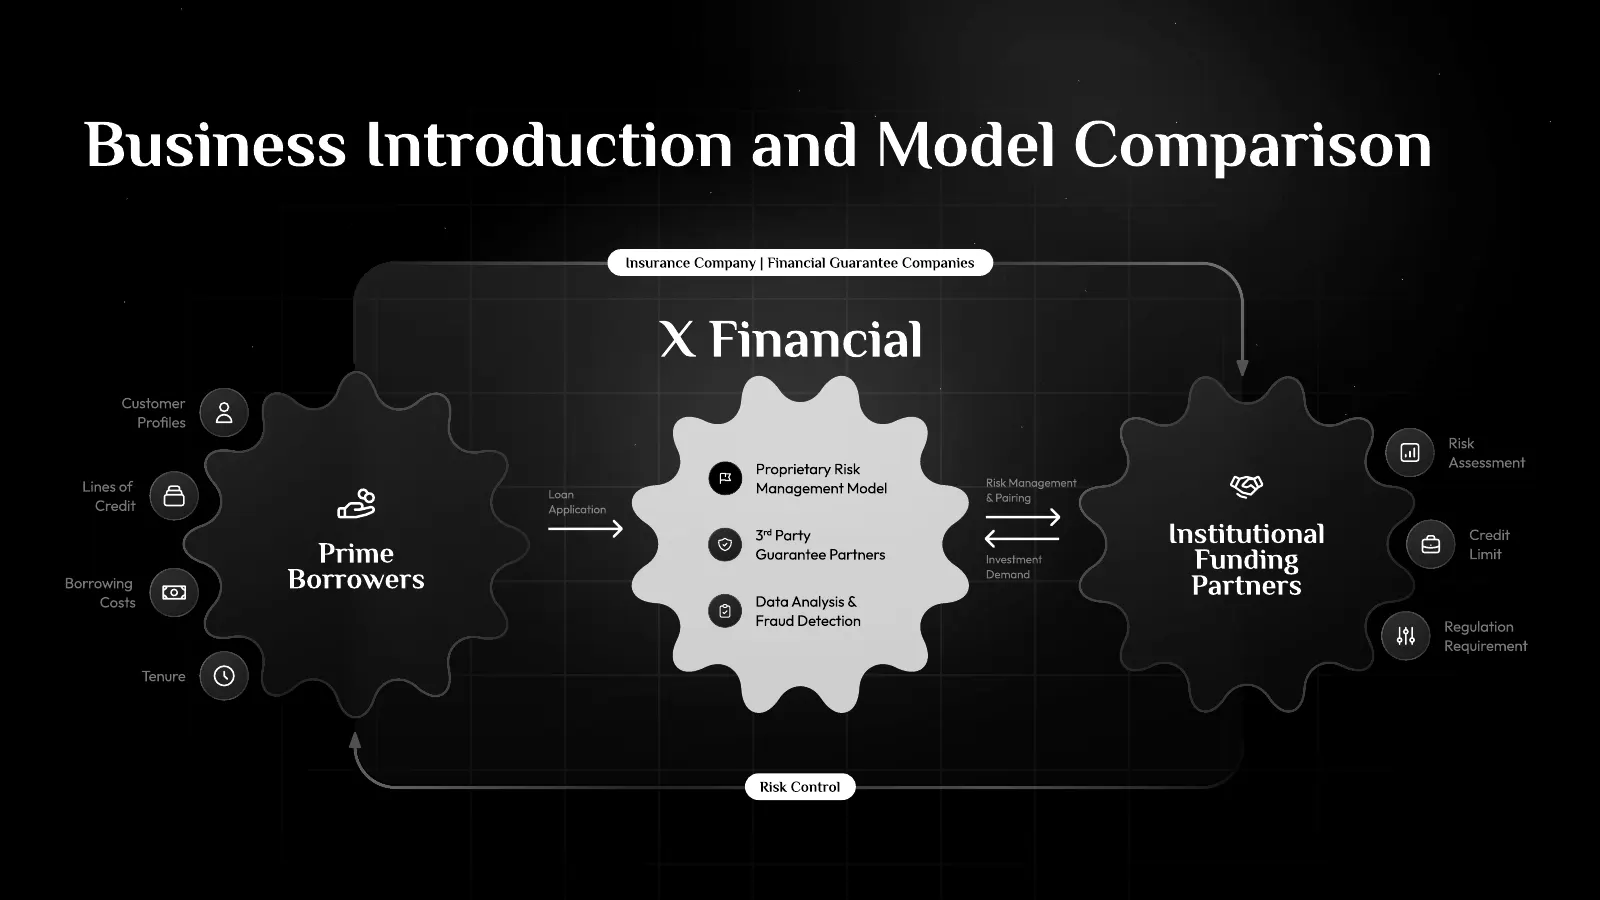
Slide 7: Business introduction and model comparison
Business introduction and model comparison Insurance Company | Financial Guarantee Companies X Financial Custome½ ProÂles Risk Assessment Proprietary Risk Risk Management Lines of Management Model Loan & Pairing Credit Application 3 rd Party Institutional Credit X Financial Prime Guarantee Partners
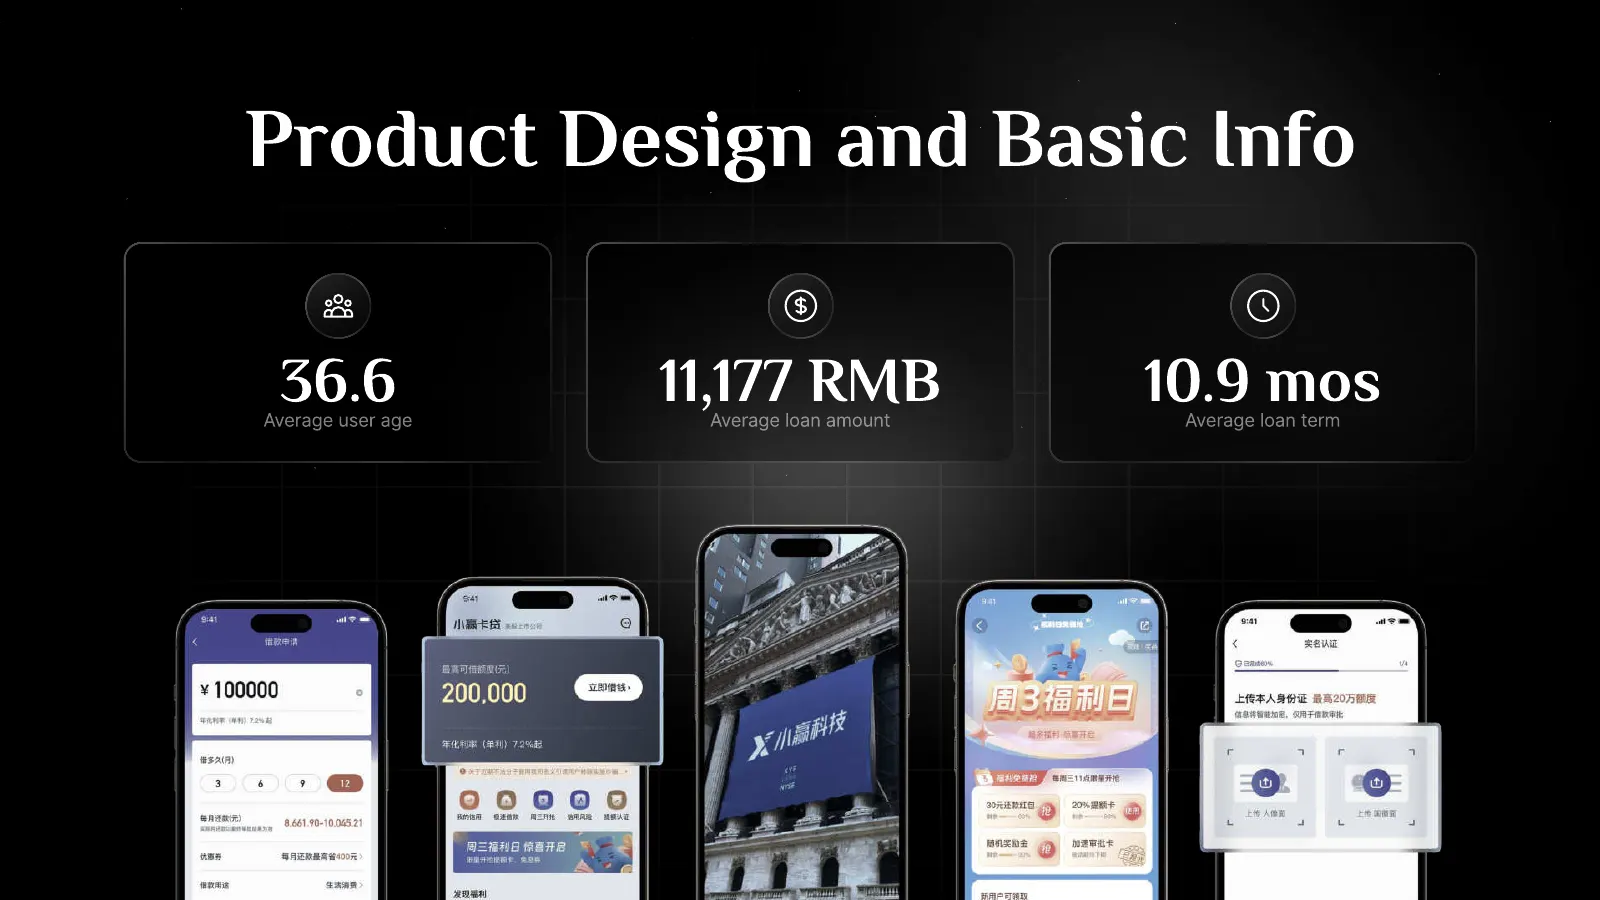
Slide 8: Product design and basic info
product design and basic info 36.6 11,177 RMB 10.9 mos

Slide 9: Advertising Channels
Advertisin Smart Ad Acquisition Performance-focused campaigns across½ China’s top platforms Channels Risk & Intent Modeling& (Privacy-Conscious) Optimized targeting using cross-platform signals (term "federated learning" removed pending tech/ risk con)rmation) Primary Platforms Embedded API Partners
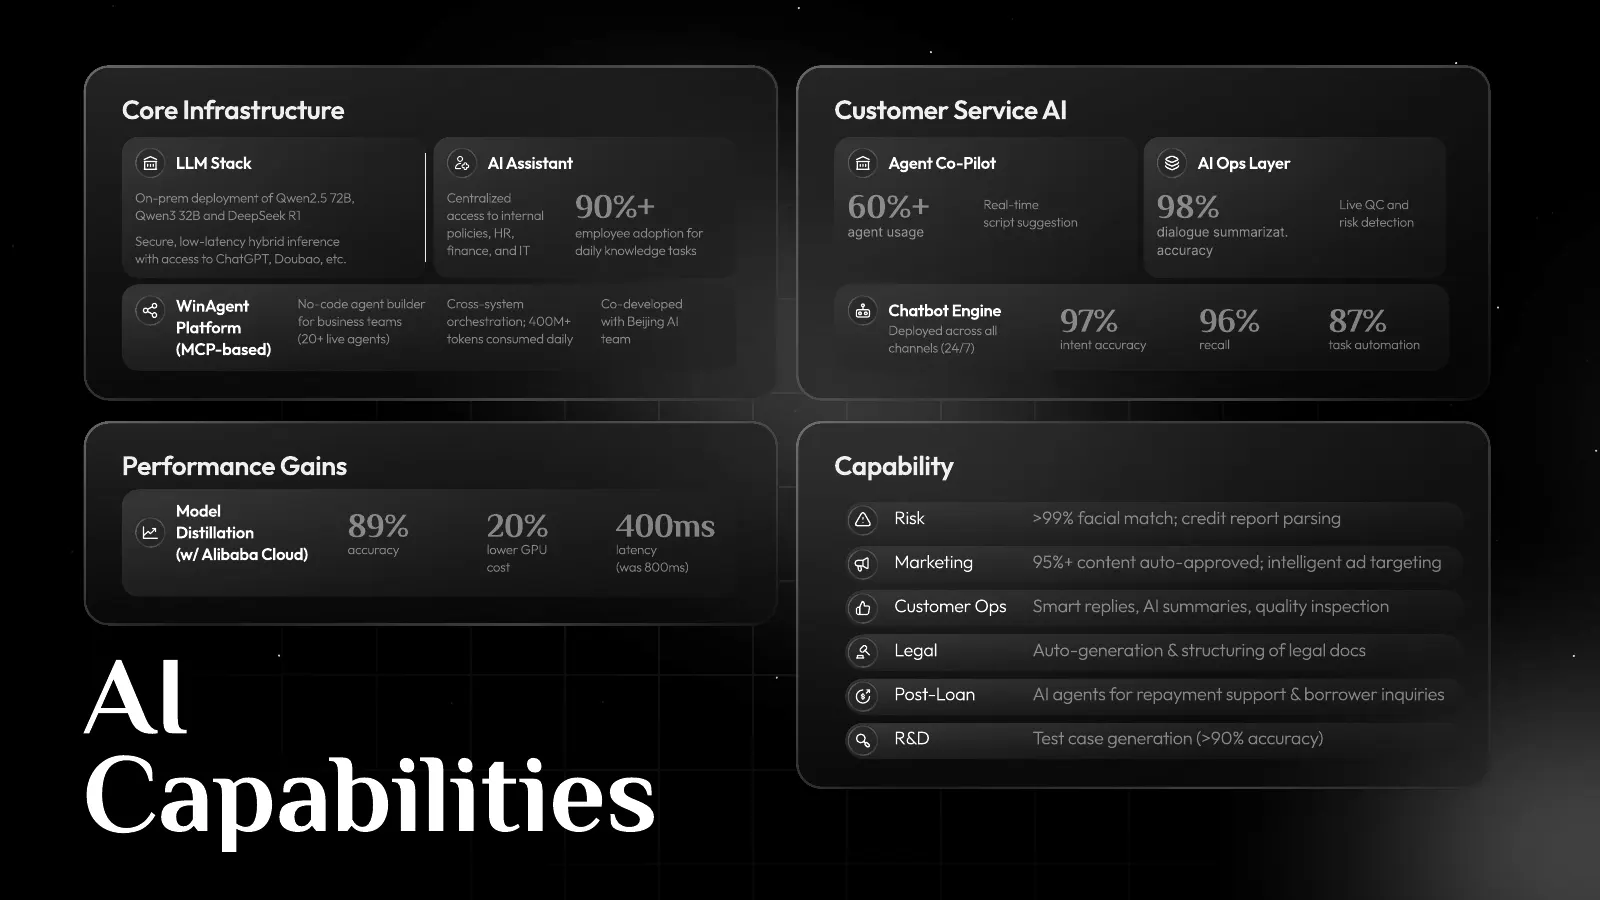
Slide 10: AI Capabilities
Core Infrastructure Customer Service AI LLM Stack AI Assistant Agent Co-Pilot AI Ops Layer On-prem deployment of Qwen2.5 72B,¹ Qwen3 32B and DeepSeek R1 Centralized access to internal 90%+ 60%+ Real-time¹ script suggestion 98% Live QC and risk detection Secure, low-latency hybrid inference¹ policies
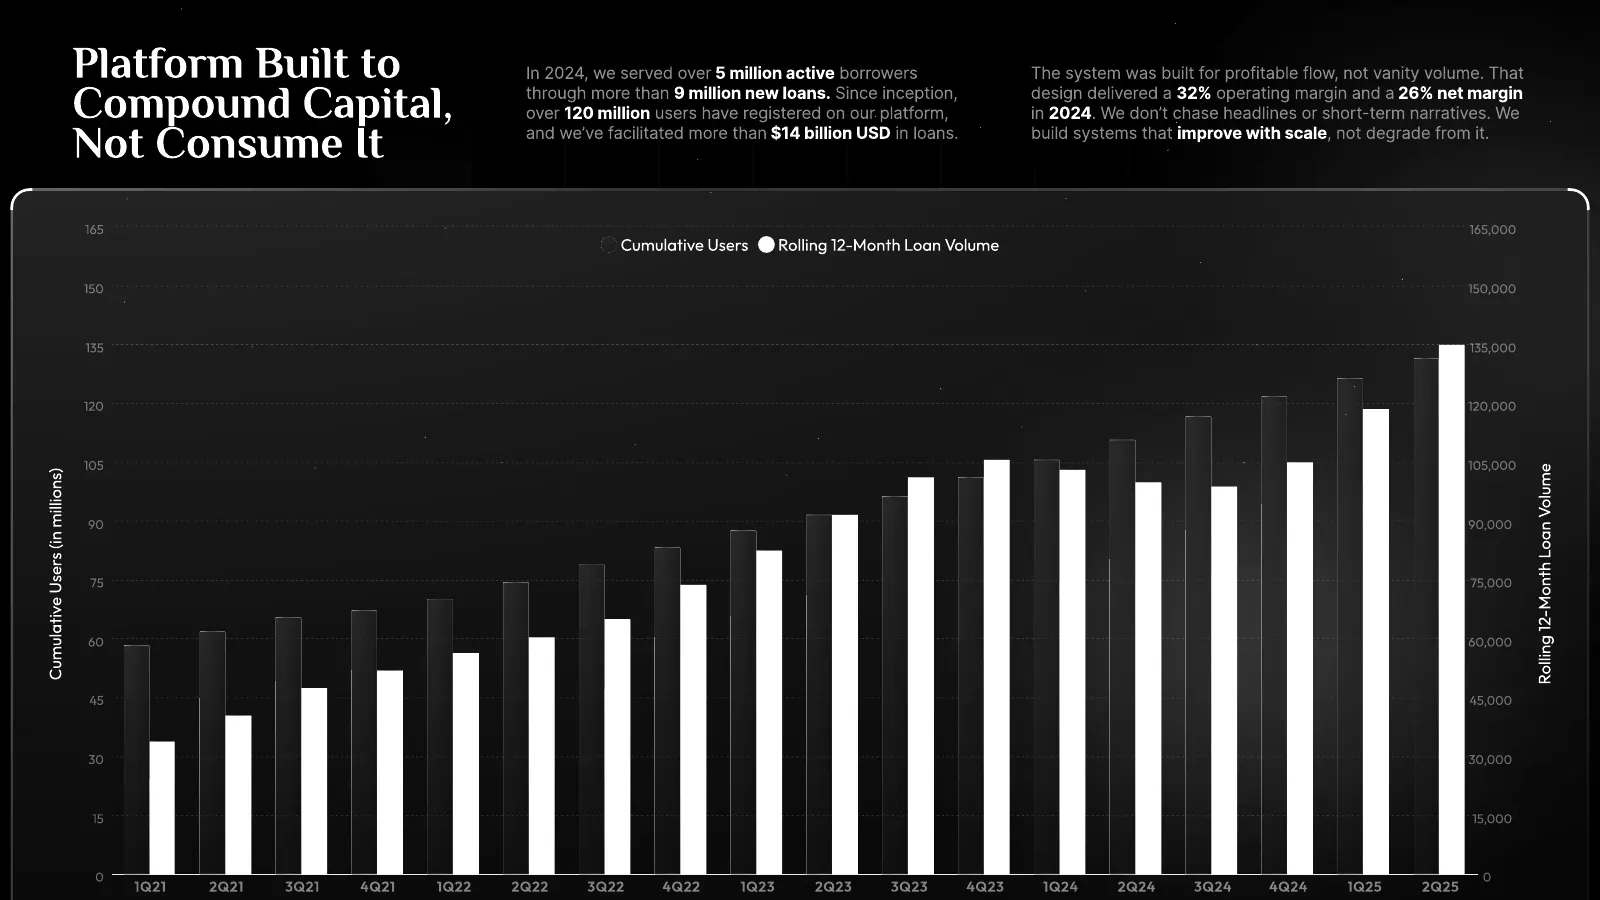
Slide 11: Cumulative Users (in millions)
Platform Built to In 2024, we served over 5 million active borrowers The system was built for profitable flow, not vanity volume. That Compound Capital, through more than 9 million new loans. Since inception, over 120 million users have registered on our platform, design delivered a 32% operating ma
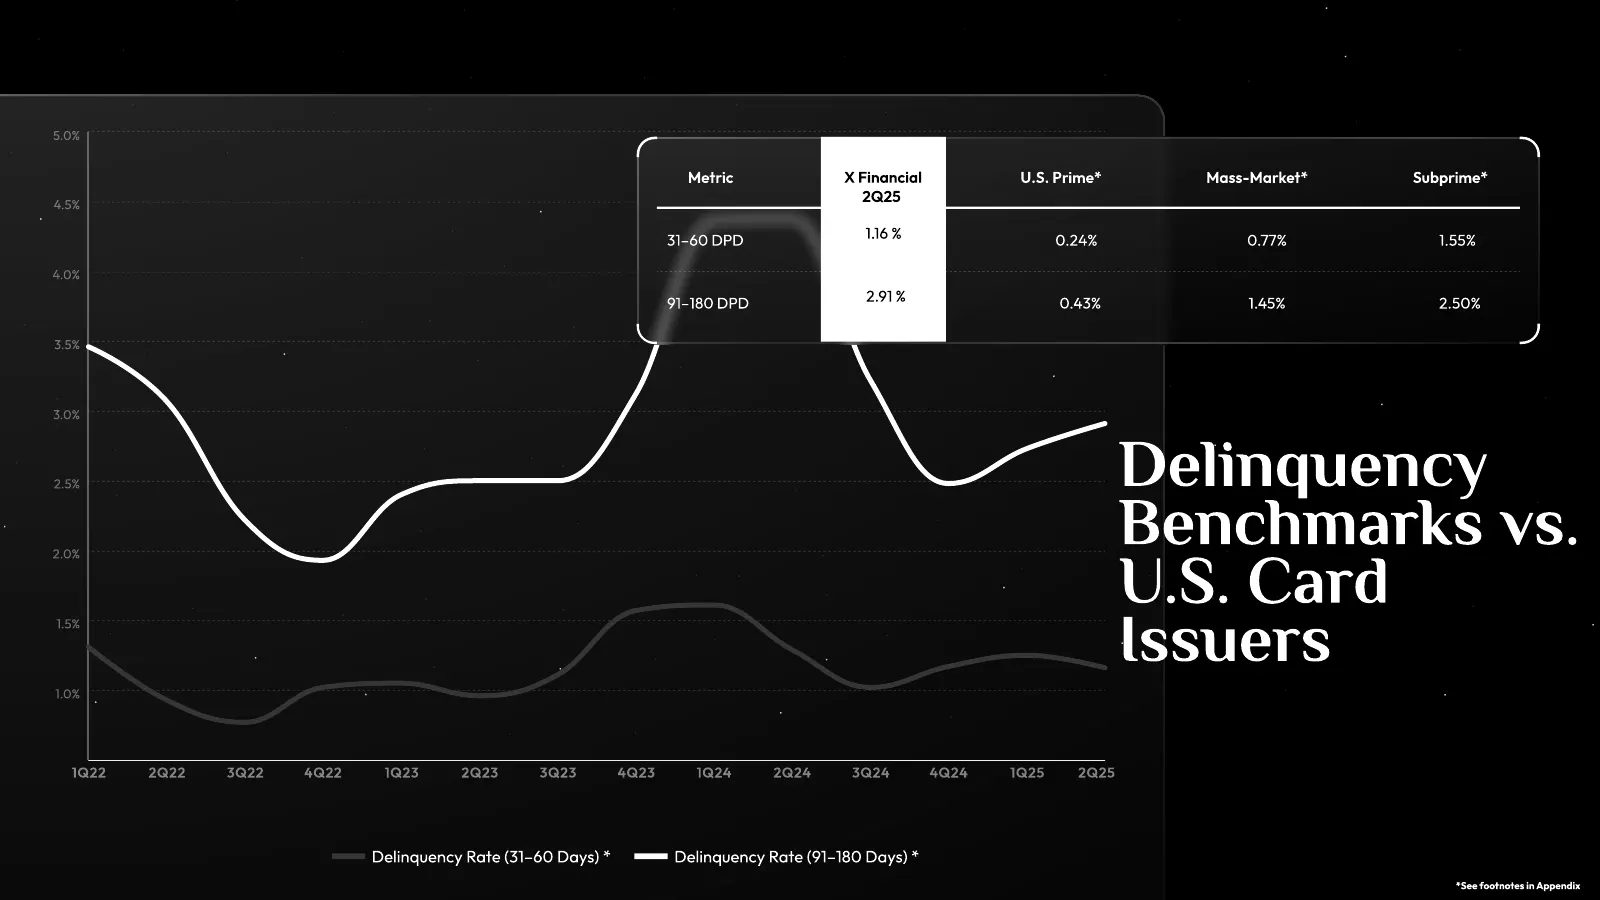
Slide 12: Delinquency Benchmarks vs. U.S. Card Issuers
Metric X Financial U.S. Prime* Mass-Market* Subprime* 2Q25 31–60 DPD 1.16 % 0.24% 0.77% 1.55% 91–180 DPD 2.91 % 0.43% 1.45% 2.50% Delinquency Benchmarks vs.6 U.S. Card Issuers Delinquency Rate (31–60 Days) * Delinquency Rate (91–180 Days) * *See footnotes in Appendix
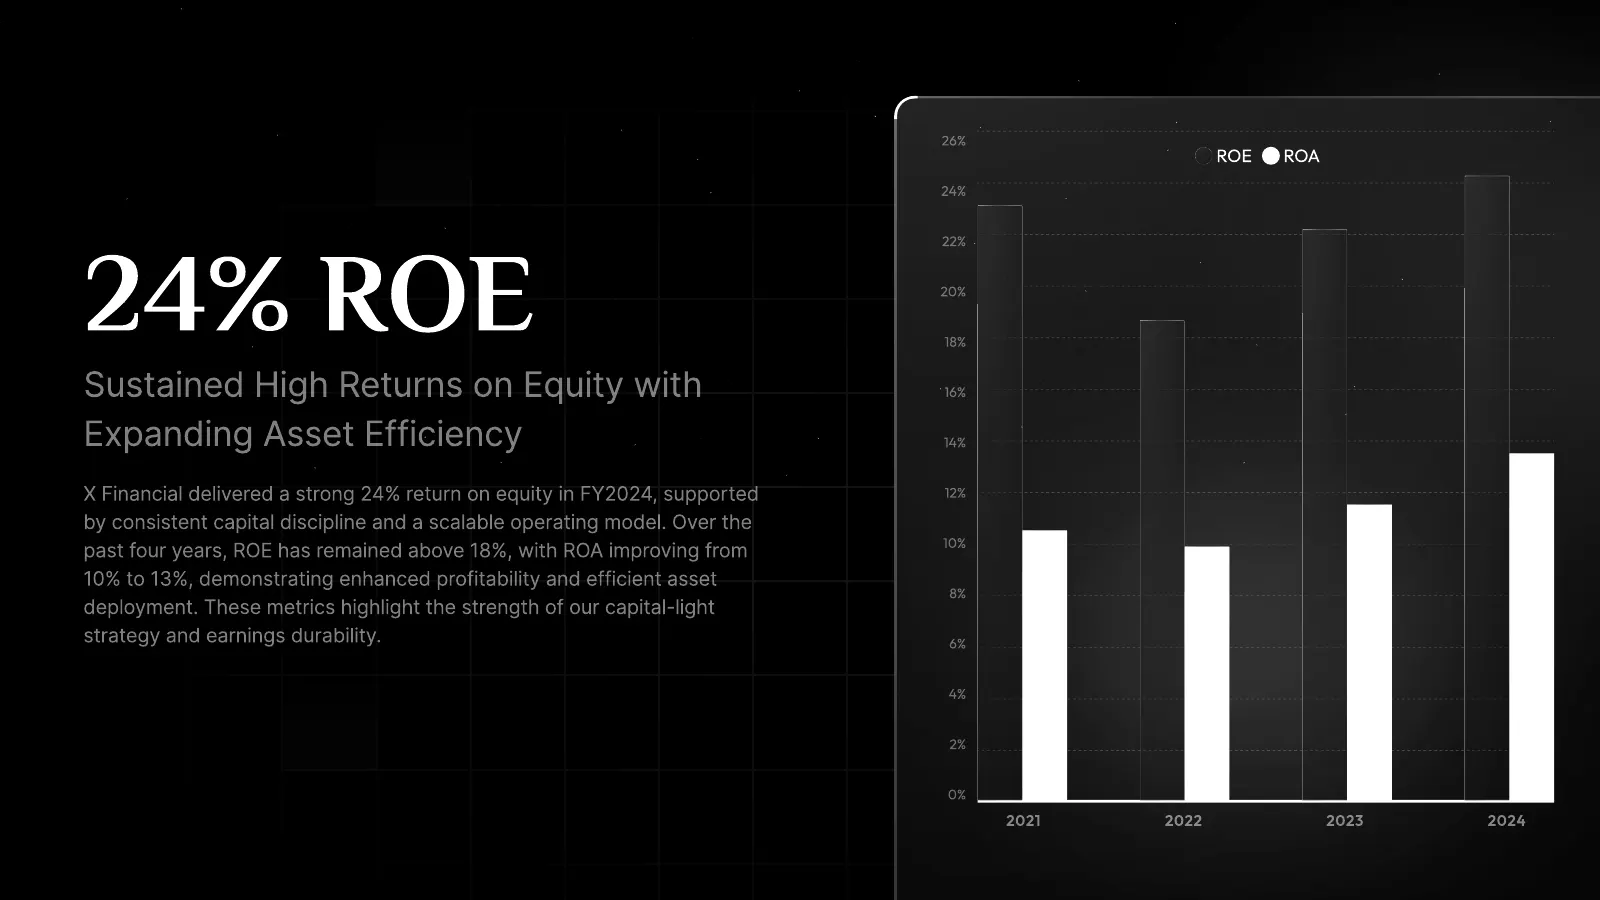
Slide 13: 24% ROE
24% ROE Sustained High Returns on Equity with Expanding Asset Efficiency X Financial delivered a strong 24% return on equity in FY2024, supported by consistent capital discipline and a scalable operating model. Over the past four years, ROE has remained above 18%, with ROA improving from 10% to 13%,
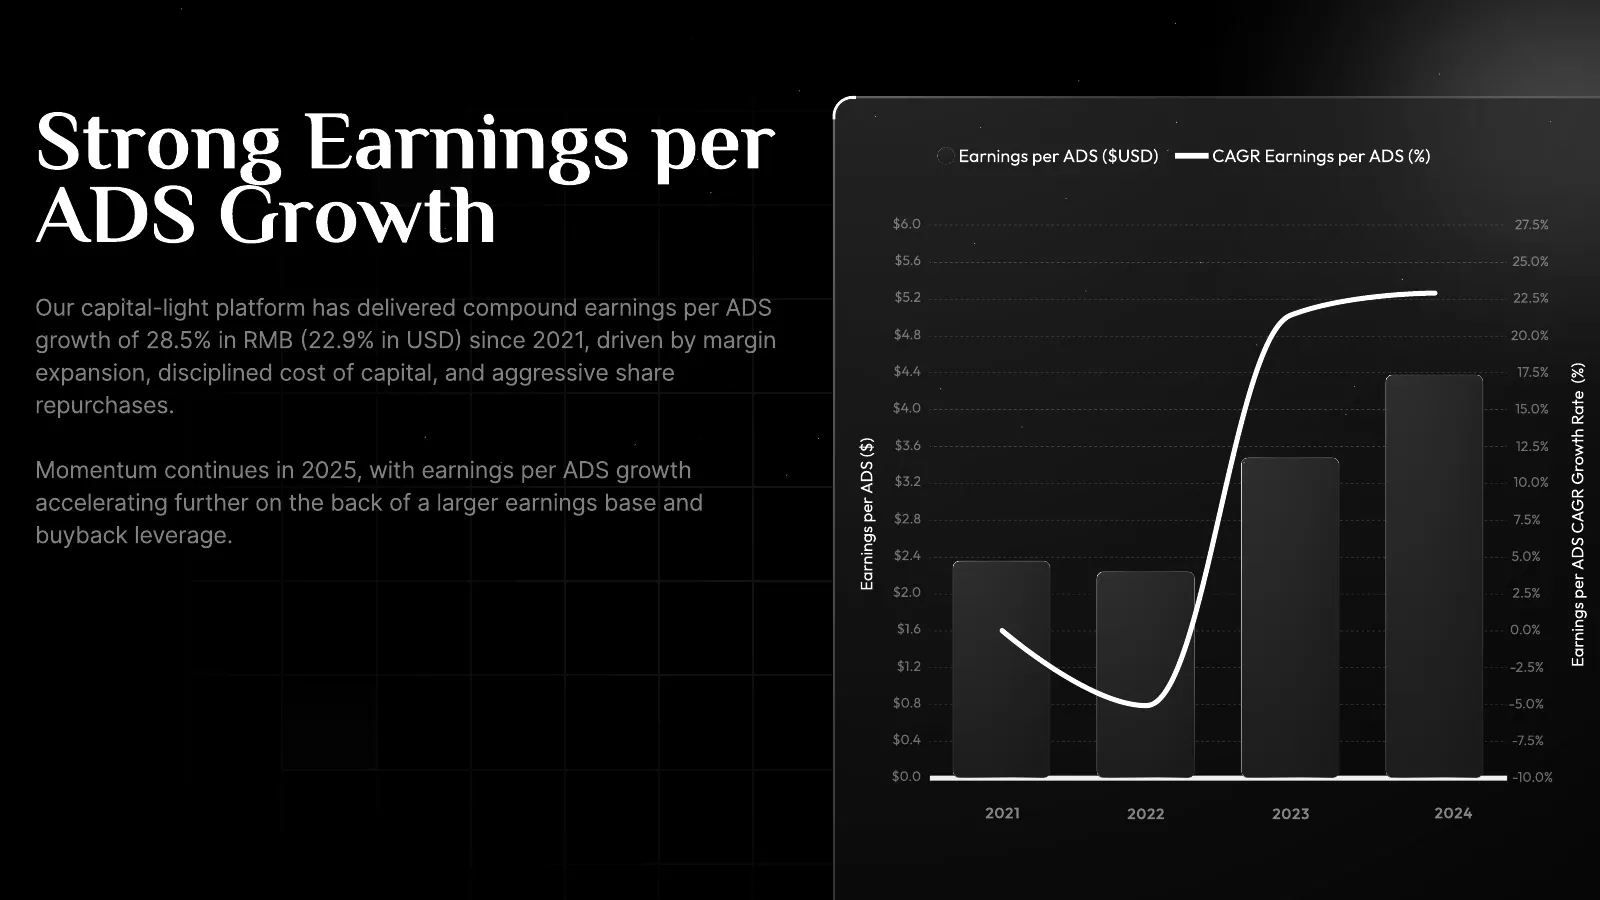
Slide 14: Strong Earnings and ADS Growth
Strong Earnings peD Earnings per ADS ($USD) CAGR Earnings per ADS (%) ADS Growth Earnings per ADS CAGR Growth Rate (%) Earnings per ADS ($)
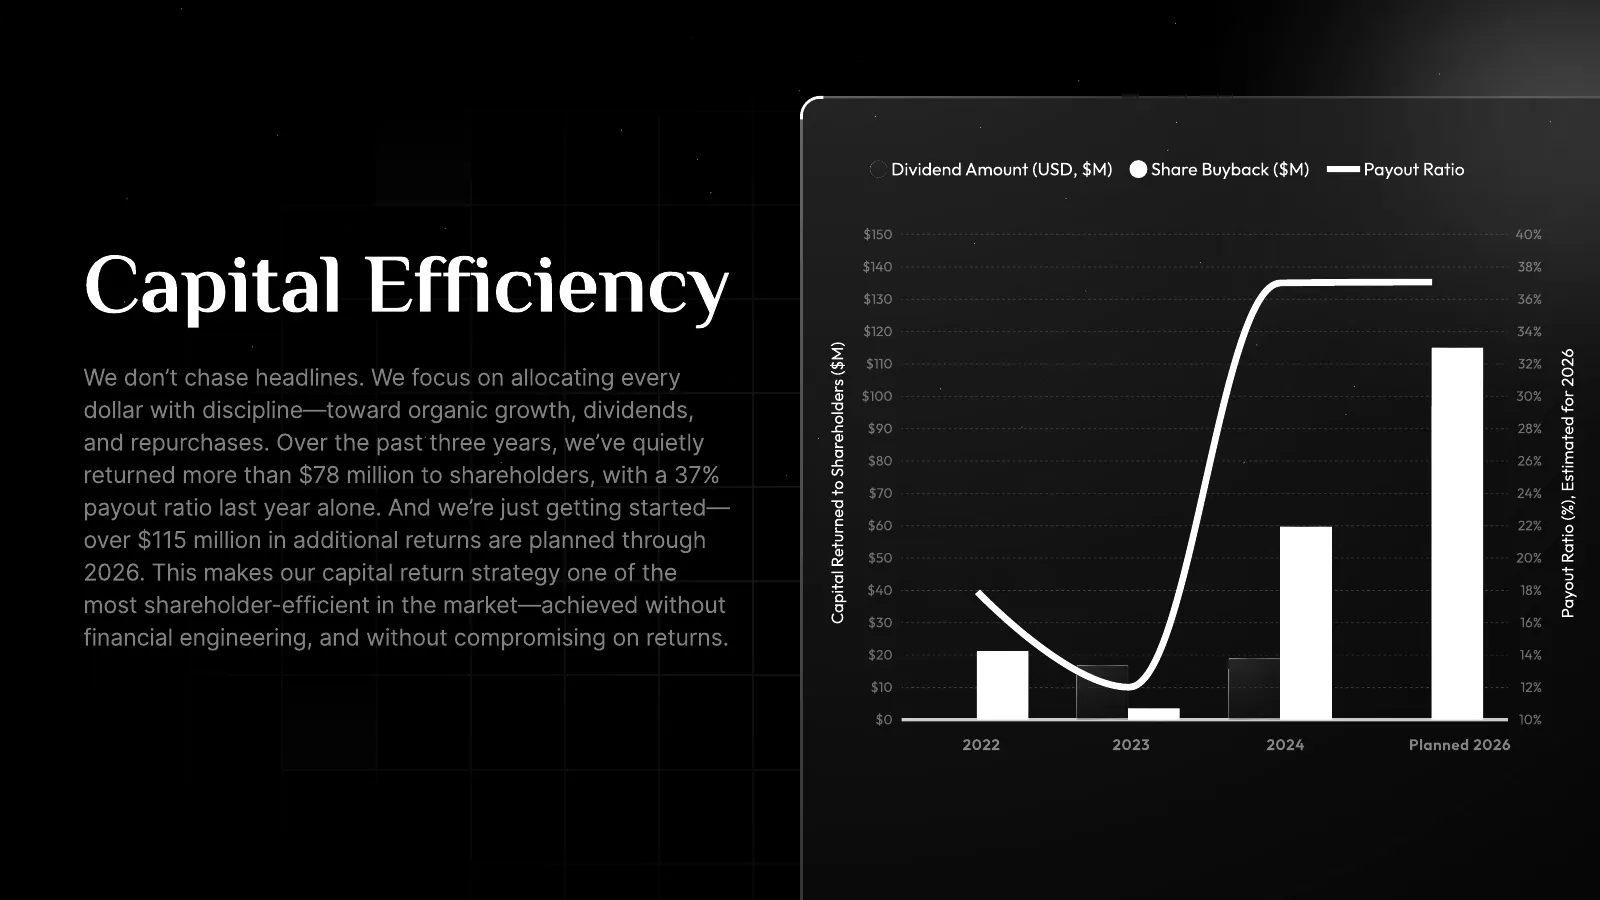
Slide 15: Capital Efficiency
Dividend Amount (USD, $M) Share Buyback ($M) Payout Ratio Capital Efficiency Capital Returned to Shareholders ($M) Payout Ratio (%), Estimated for 2026
Slide 16: Justin Yue Tang
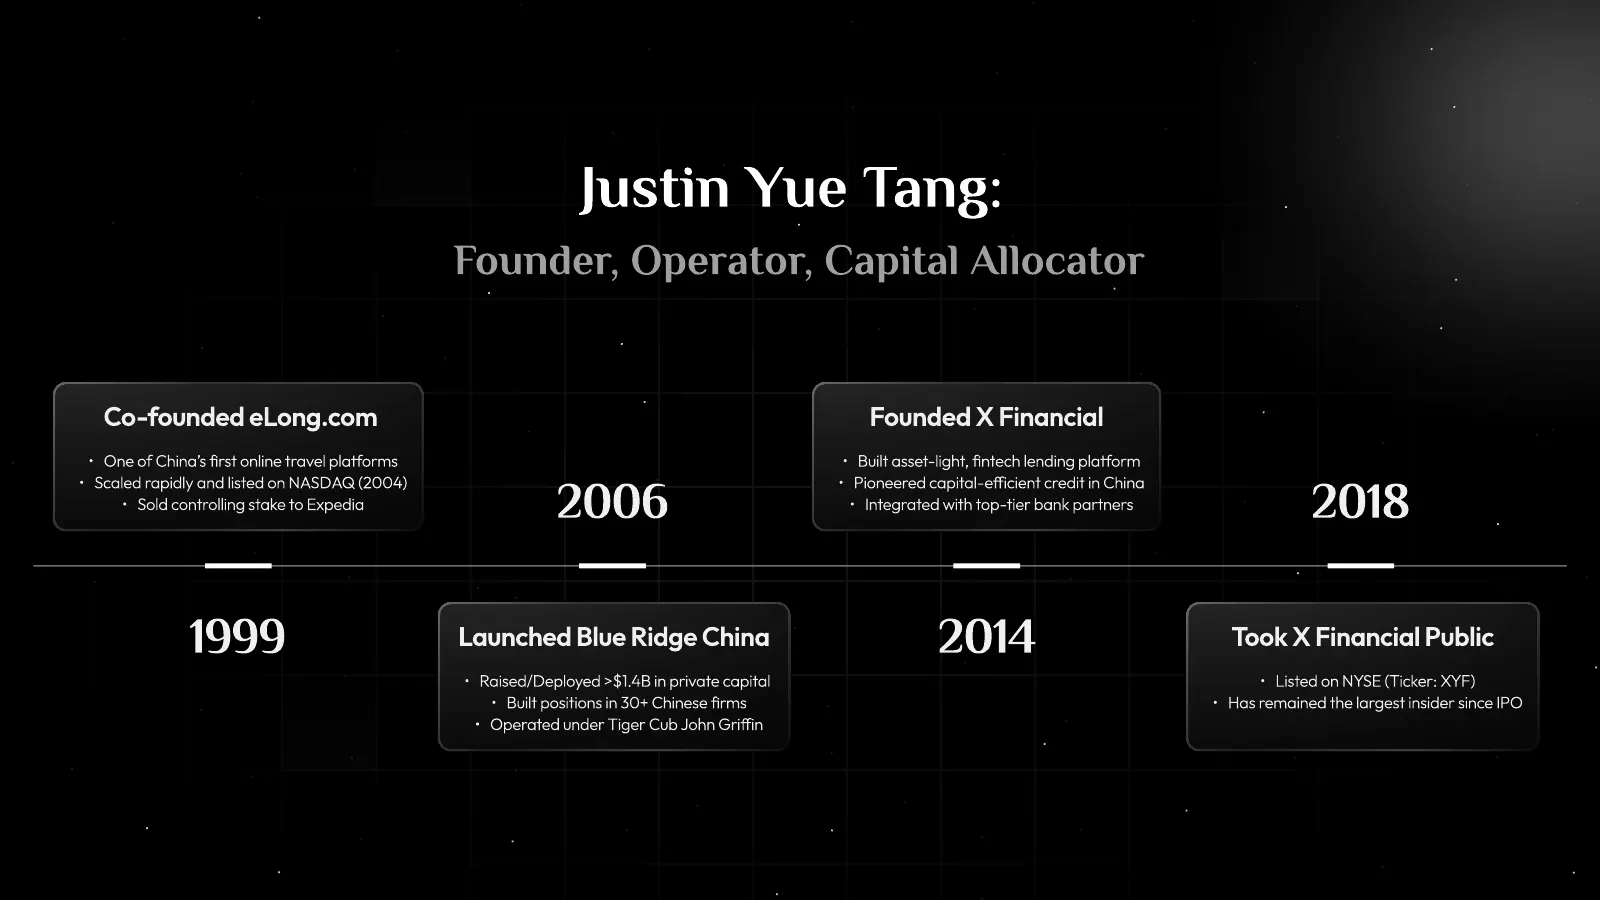
Justin Yue Tang:Õ Founder, Operator, Capital Allocator Co-founded eLong.com Founded X Financial 0 One of China’s rst online travel platformQ 0 Built asset-light, ntech lending platfor( 2006 2018 0 Scaled rapidly and listed on NASDAQ (2004 0 Pioneered capital-eicient credit in Chin" 0 Sold controlli
Slide 17: Leadership Team with Global Financial Track Record
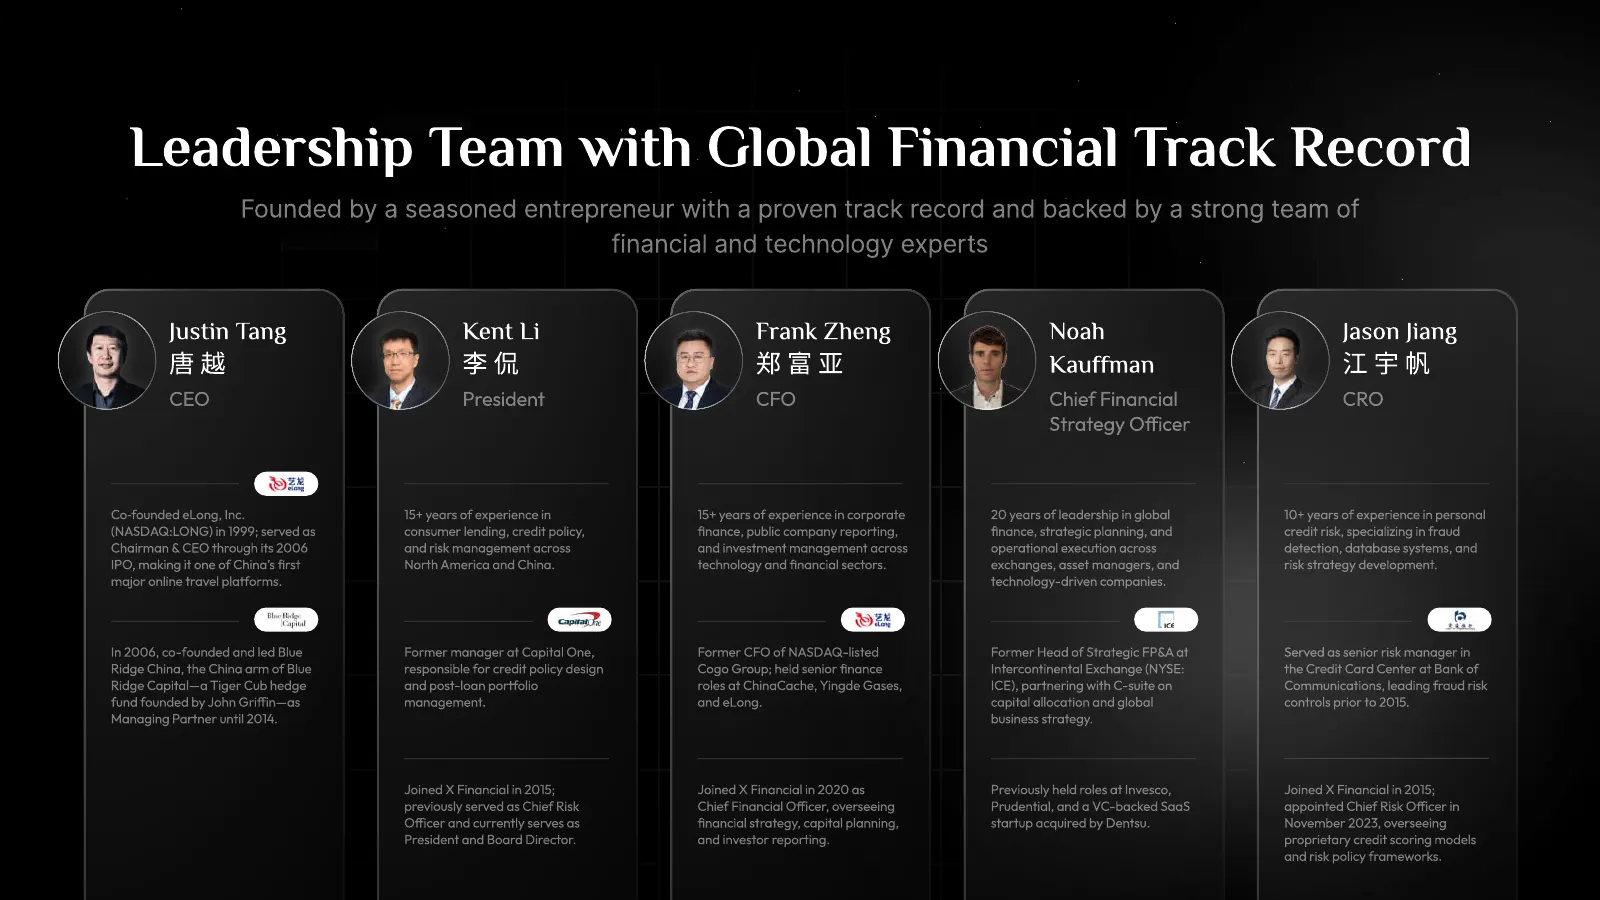
Leadership Team with Global Financial Track Record Justin Tangb Kent Lib Frank Zhengb No ah o Jas n Jiangb 唐 越 李 侃 郑 富 亚 Kau ffm an 江宇帆 CEO President CFO Chief Financial CRO Strategy Oicer Co‑founded eLong, Inc. 15+ years of experience in 15+ years of experience in corporate 20 years of leadership i
Slide 18: Consolidated Income Statement
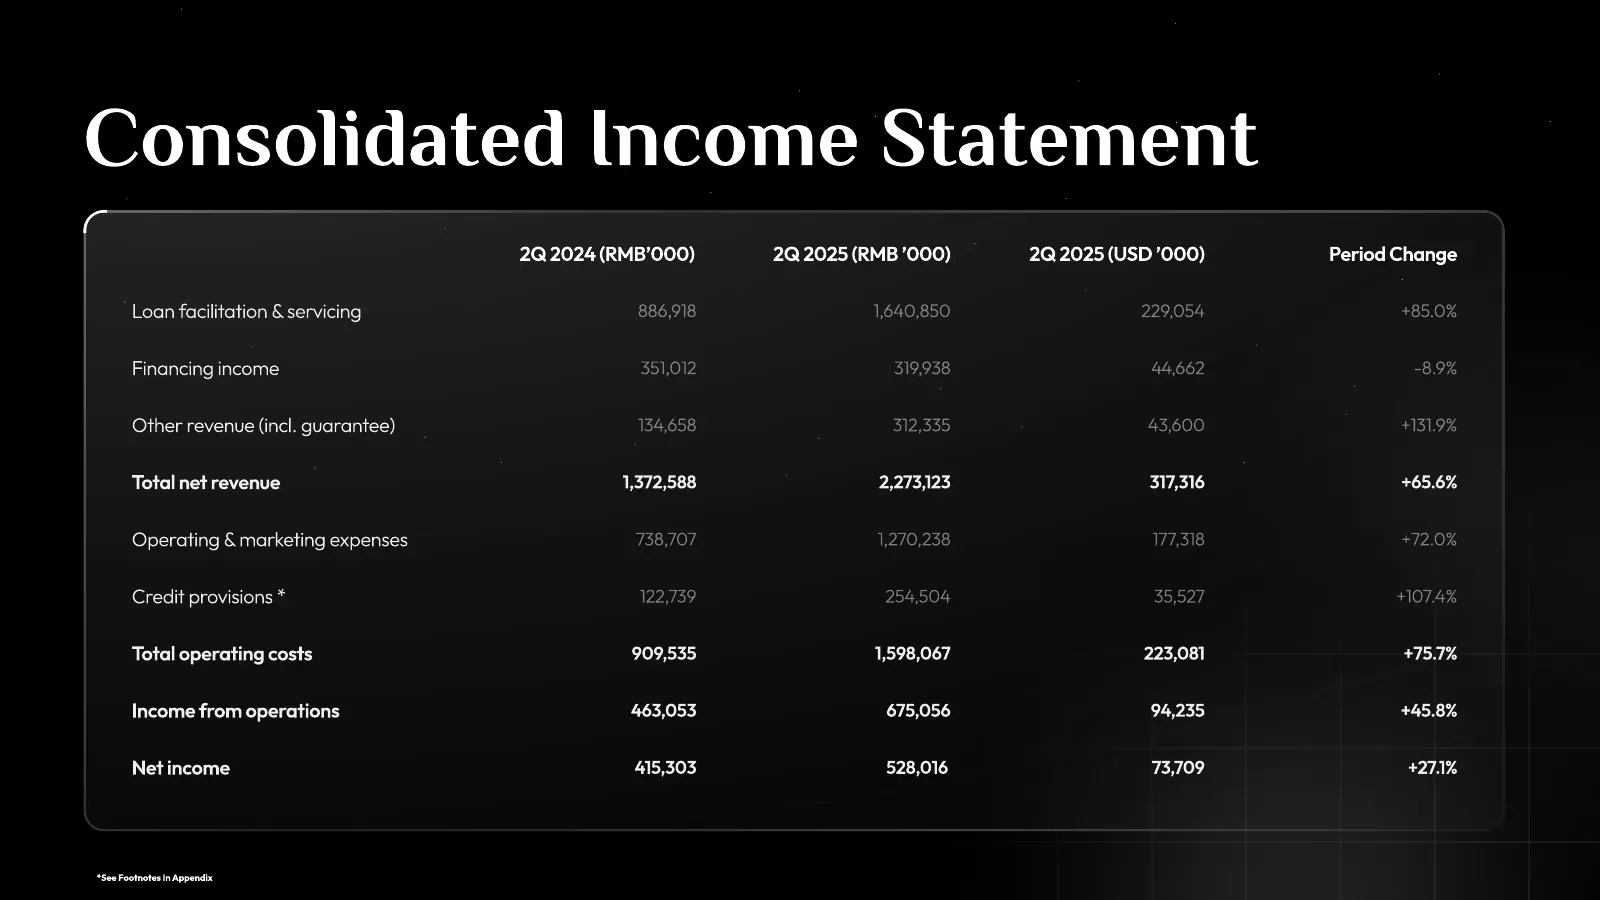
Consolidated Income Statement 2Q 2024 (RMB’000) 2Q 2025 (RMB ’000) 2Q 2025 (USD ’000) Period Change Loan facilitation & servicing 886,918 1,640,850 229,054 +85.0% Financing income 351,012 319,938 44,662 -8.9% Other revenue (incl. guarantee) 134,658 312,335 43,600 +131.9% Total net revenue 1,372,588
Slide 19: Consolidated Balance Sheet
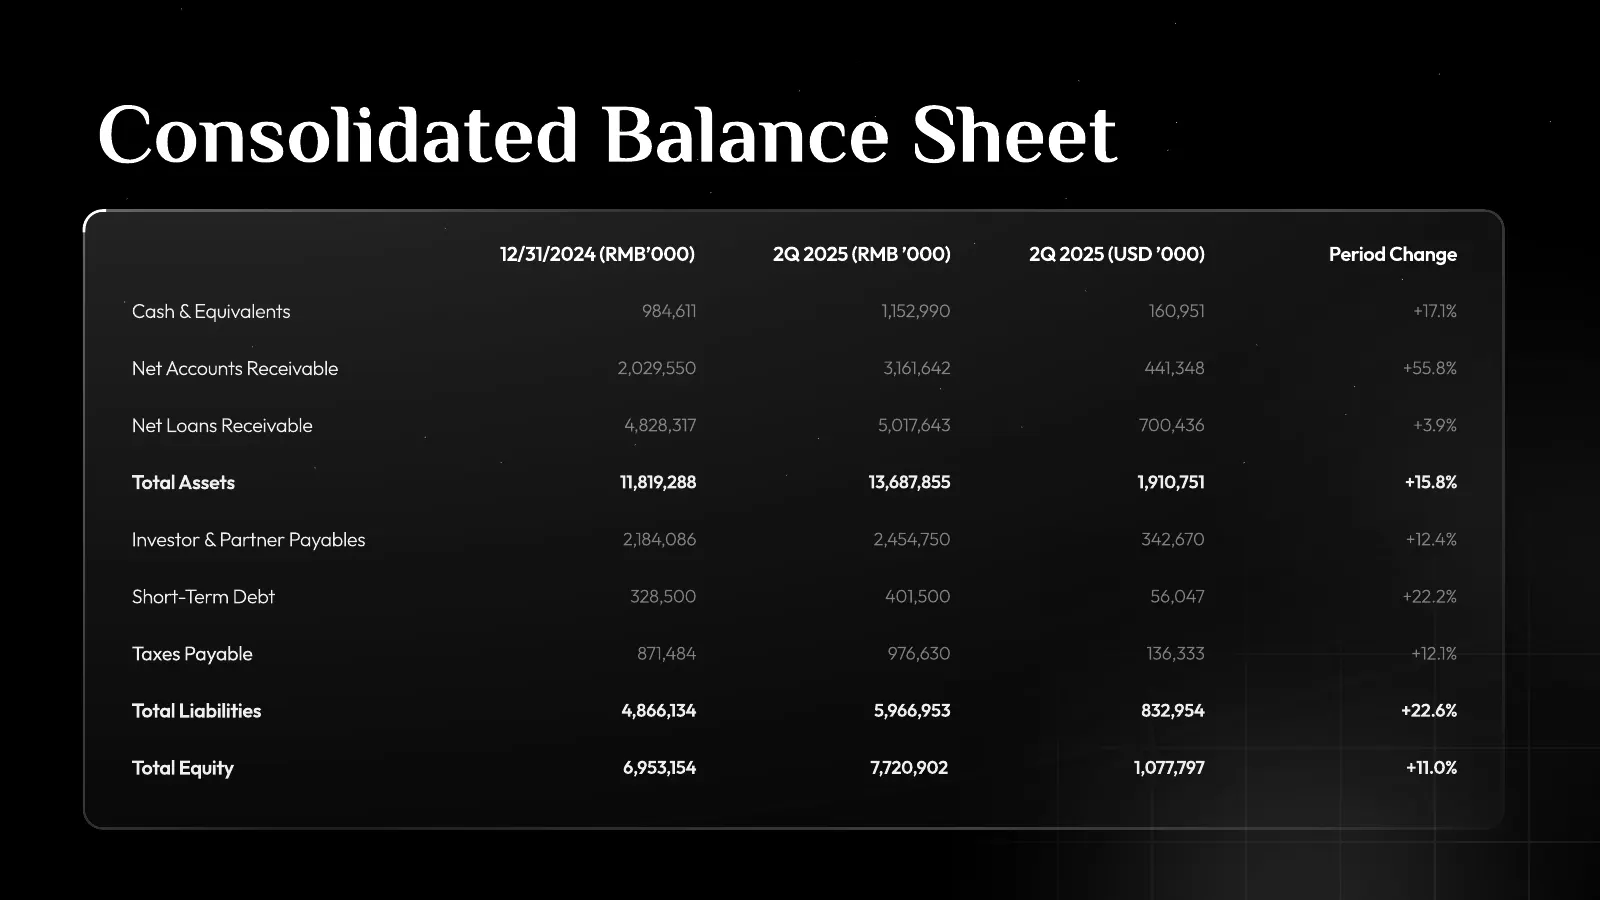
Consolidated Balance Sheet 12/31/2024 (RMB’000) 2Q 2025 (RMB ’000) 2Q 2025 (USD ’000) Period Change Cash & Equivalents 984,611 1,152,990 160,951 +17.1% Net Accounts Receivable 2,029,550 3,161,642 441,348 +55.8% Net Loans Receivable 4,828,317 5,017,643 700,436 +3.9% Total Assets 11,819,288 13,687,855
Slide 20: Footnotes
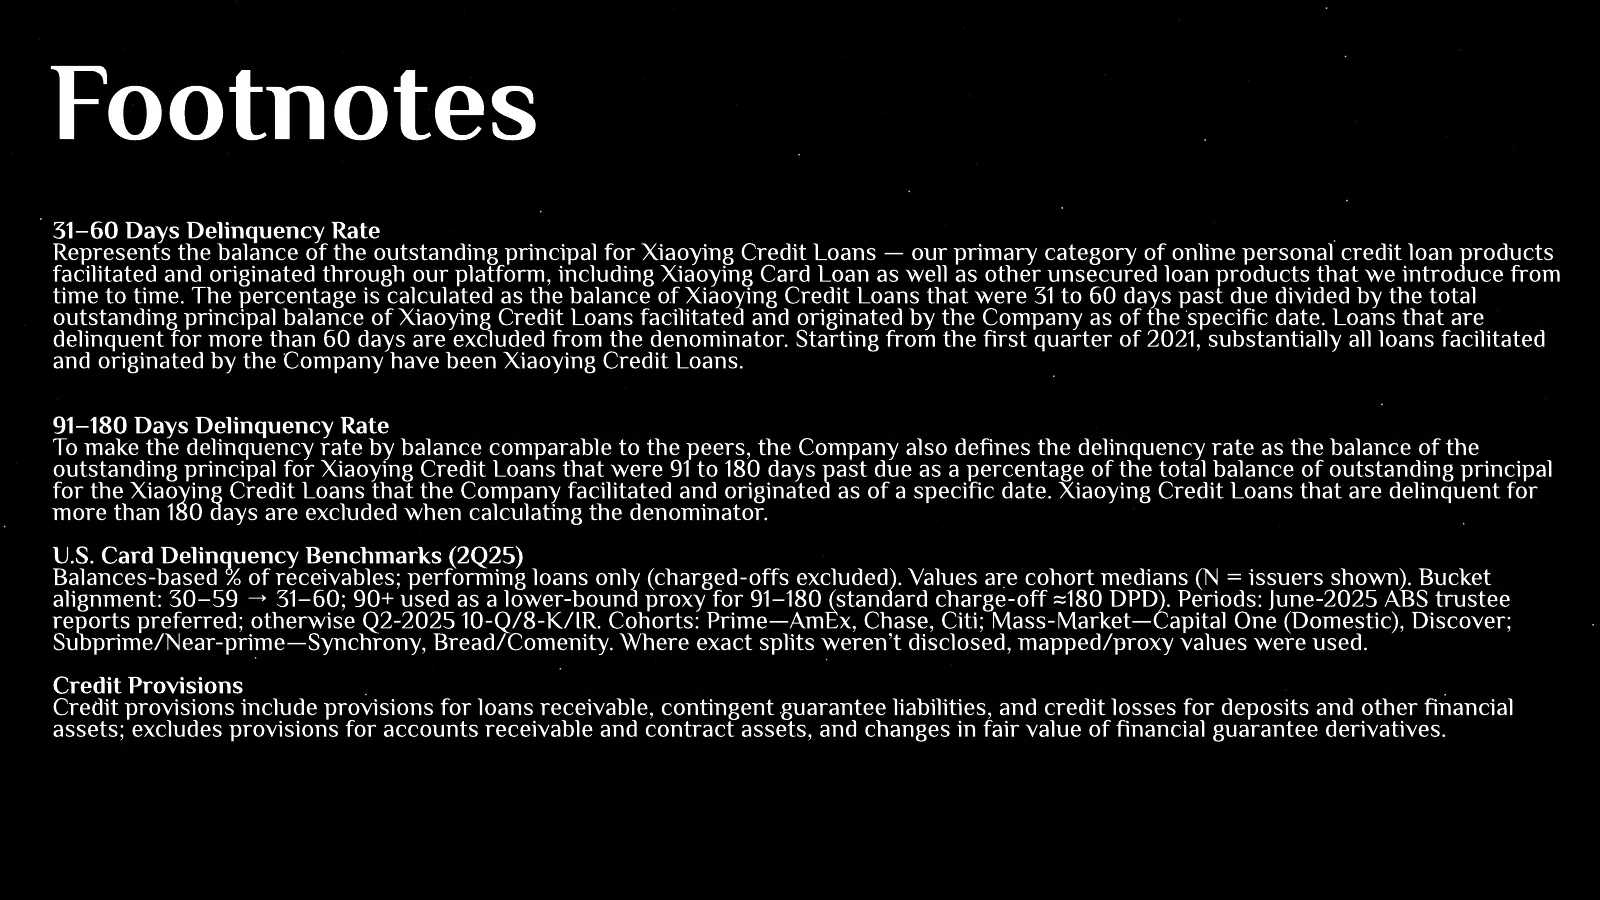
Footnotes 31–60 Days Delinquency Rat] Represents the balance of the outstanding principal for Xiaoying Credit Loans — our primary category of online personal credit loan products facilitated and originated through our platform, including Xiaoying Card Loan as well as other unsecured loan products th
Source: EarningsCall slides
More decks from X Financial
 Q2 2026 Earnings Presentation19 slides · Aug 24, 2026
 Q1 2026 Earnings Presentation19 slides · May 28, 2026
 Q4 2025 Earnings Presentation20 slides · Mar 26, 2026
 Q3 2025 Earnings Presentation20 slides · November 2025
 Q4 2024 Earnings Presentation25 slides · May 20, 2025
 Q1 2025 Earnings Presentation25 slides · May 2025