Novelis — Q2 FY2014 Earnings Presentation
28 slides from Novelis's earnings presentation, Nov 12, 2013
Slide 1: Novelis Q2 Fiscal Year 2014 Earnings Conference Call
©2013Novelis Inc. 1 November 11, 2013 Philip Martens President and Chief Executive Officer Steve Fisher Senior Vice President and Chief Financial Officer Novelis Q2 Fiscal Year 2014 Earnings Conference Call Exhibit 99.2
Slide 2: Safe Harbor Statement
©2013Novelis Inc. 2 Safe Harbor Statement Forward-Looking Statements Statements made in this presentation which describe Novelis' intentions, expectations, beliefs or predictions may be forward-looking statements within the meaning of securities laws. Forward-looking statements include statements pr
Slide 3: Agenda
©2013Novelis Inc. 3 Agenda Business Review Novelis Strategy Detailed Financial Performance Summary & Outlook

Slide 4: Business Review
©2013Novelis Inc. 4 Business Review
Slide 5: Second Quarter Highlights
©2013Novelis Inc. 5 Second Quarter Highlights Global Shipments Up 1% Sequentially Record Auto Shipments Record Production in South America Lighter than Expected Can Demand in North America & Europe Positive Free Cash Flow Excellent Progress on Strategic Expansions Stable Performance Ah
Slide 6: Regional Business Highlights
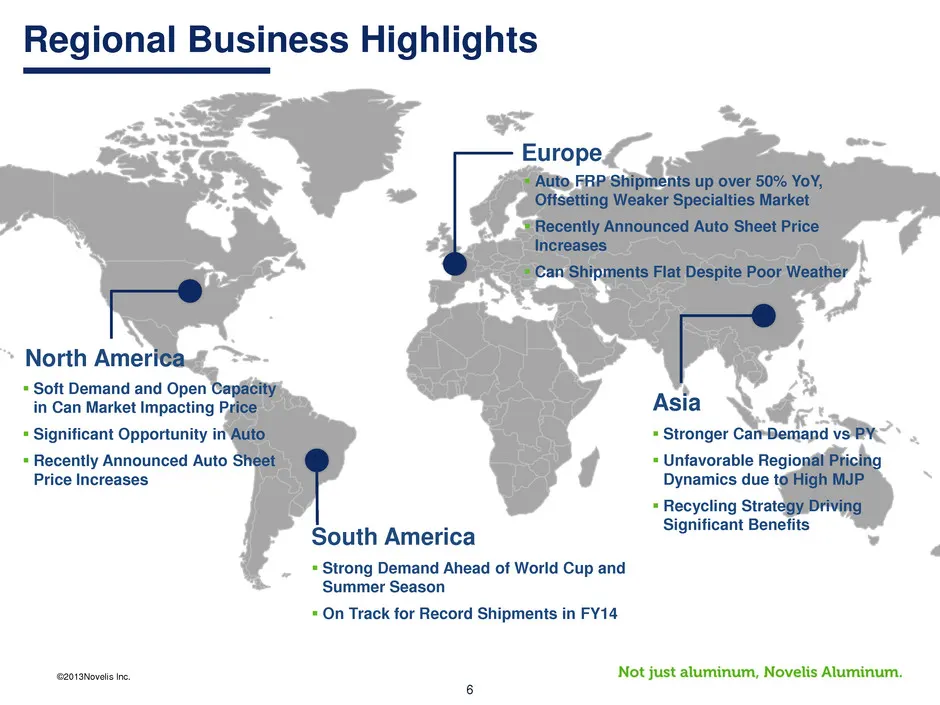
©2013Novelis Inc. 6 Regional Business Highlights Europe Auto FRP Shipments up over 50% YoY, Offsetting Weaker Specialties Market Recently Announced Auto Sheet Price Increases Can Shipments Flat Despite Poor Weather Asia North America South America Stronger Can Demand vs PY Unfavorable Regi
Slide 7: Novelis' Strategy
©2013Novelis Inc. 7 Novelis’ Strategy
Slide 8: Leading the Industry with Bold Moves
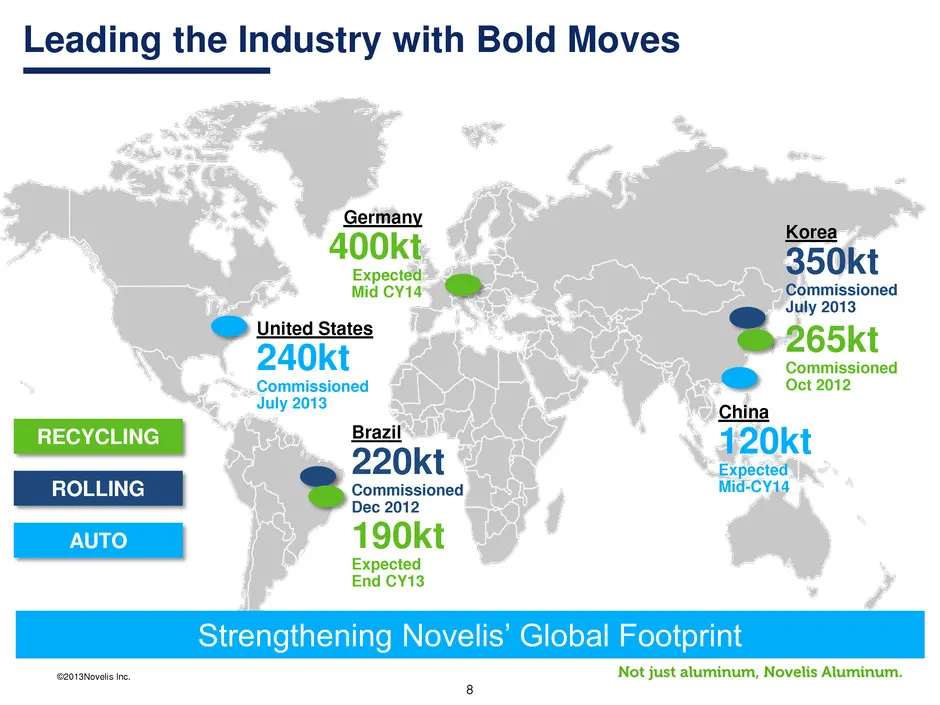
©2013Novelis Inc. 8 Leading the Industry with Bold Moves RECYCLING ROLLING AUTO REC CLING 190kt Expected End CY13 Germany 400kt Expected Mid CY14 265kt Commissioned Oct 2012 Brazil 220kt Commissioned Dec 2012 Korea 350kt Commissioned July 2013 United States 240kt Commissioned July 2013 China 120kt E
Slide 9: Strategic Results: South America
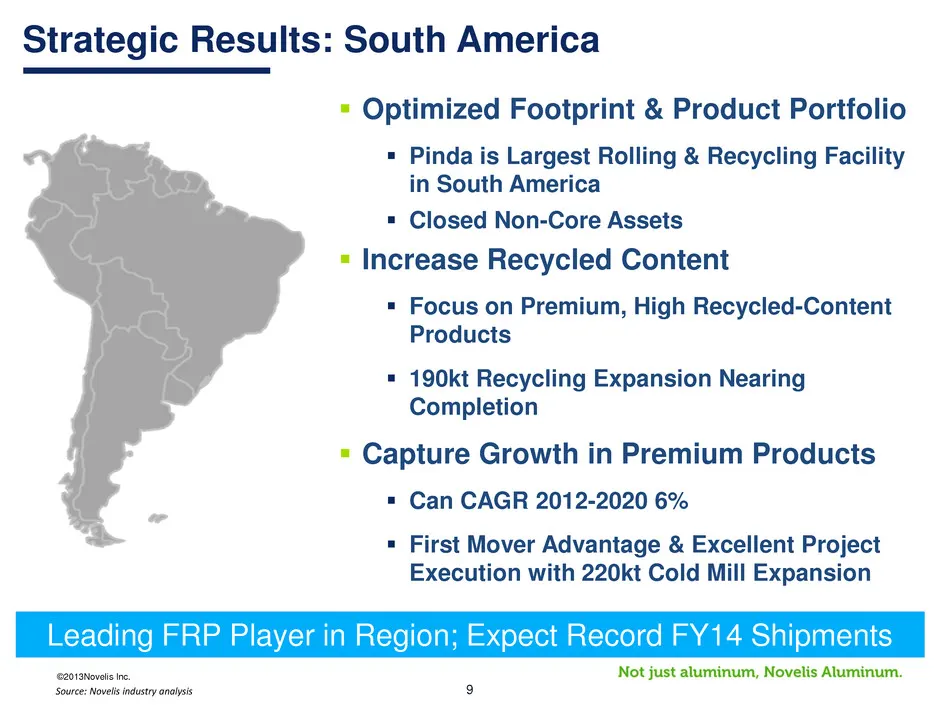
©2013Novelis Inc. 9 Strategic Results: South America Optimized Footprint & Product Portfolio Pinda is Largest Rolling & Recycling Facility in South America Closed Non-Core Assets Increase Recycled Content Focus on Premium, High Recycled-Content Products 190kt Recycling Expansion Nearing
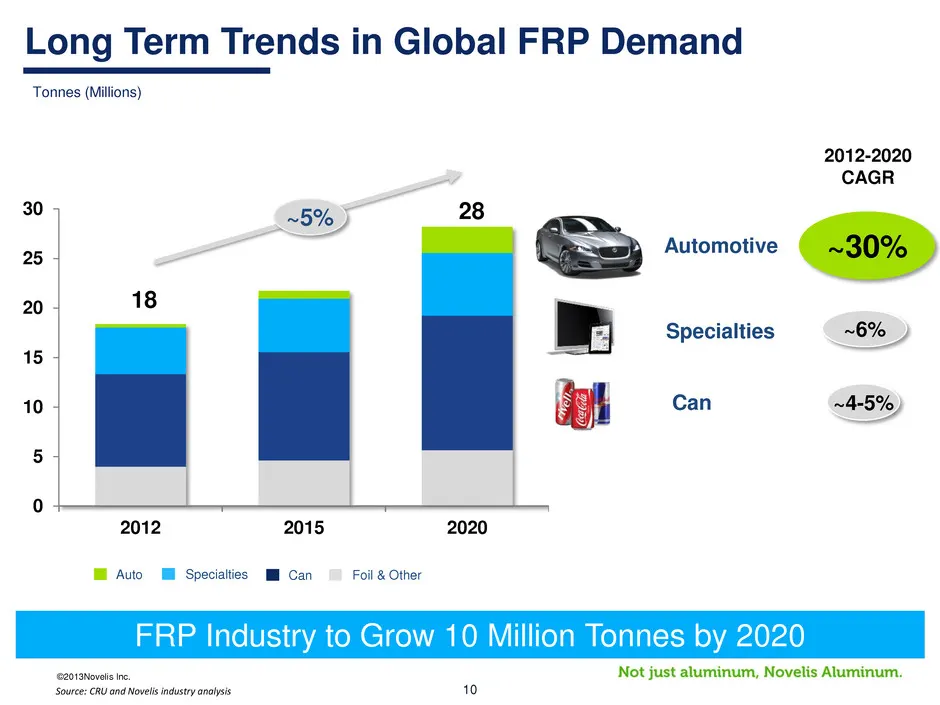
Slide 10: Long Term Trends in Global FRP Demand
©2013Novelis Inc. 10 Long Term Trends in Global FRP Demand FRP Industry to Grow 10 Million Tonnes by 2020 ~30% Automotive ~4-5% Can 0 5 10 15 20 25 30 2012 2015 2020 ~5% ~6% Specialties 18 28 Source: CRU and Novelis industry analysis Tonnes (Millions) 2012-2020 CAGR Specialties Auto Foil & Other Can
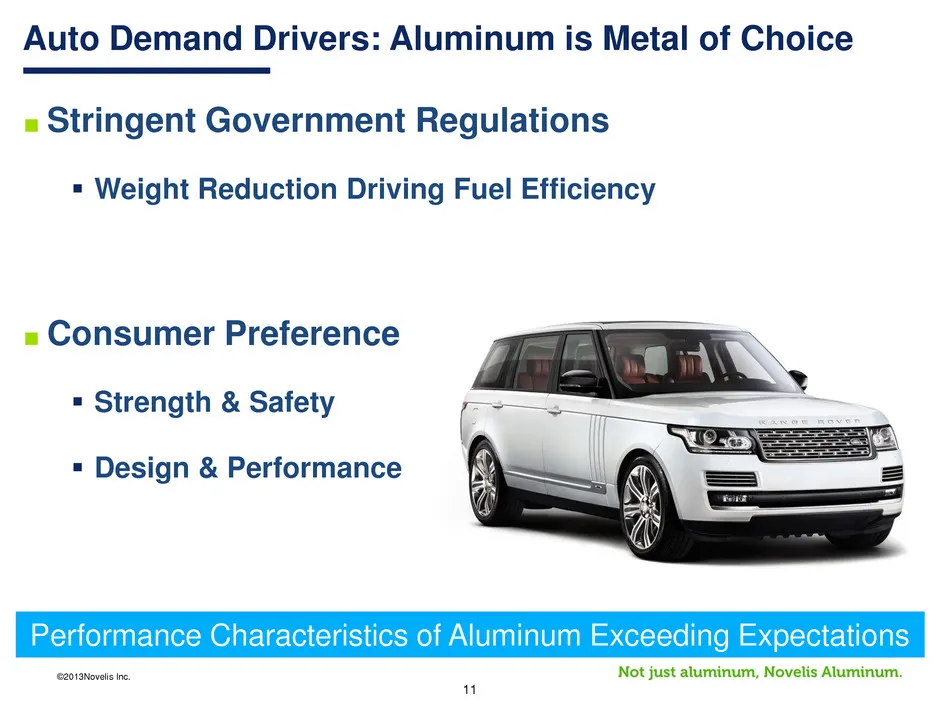
Slide 11: Auto Demand Drivers: Aluminum is Metal of Choice
©2013Novelis Inc. 11 Auto Demand Drivers: Aluminum is Metal of Choice ■ Stringent Government Regulations Weight Reduction Driving Fuel Efficiency ■Consumer Preference Strength & Safety Design & Performance Performance Characteristics of Aluminum Exceeding Expectations
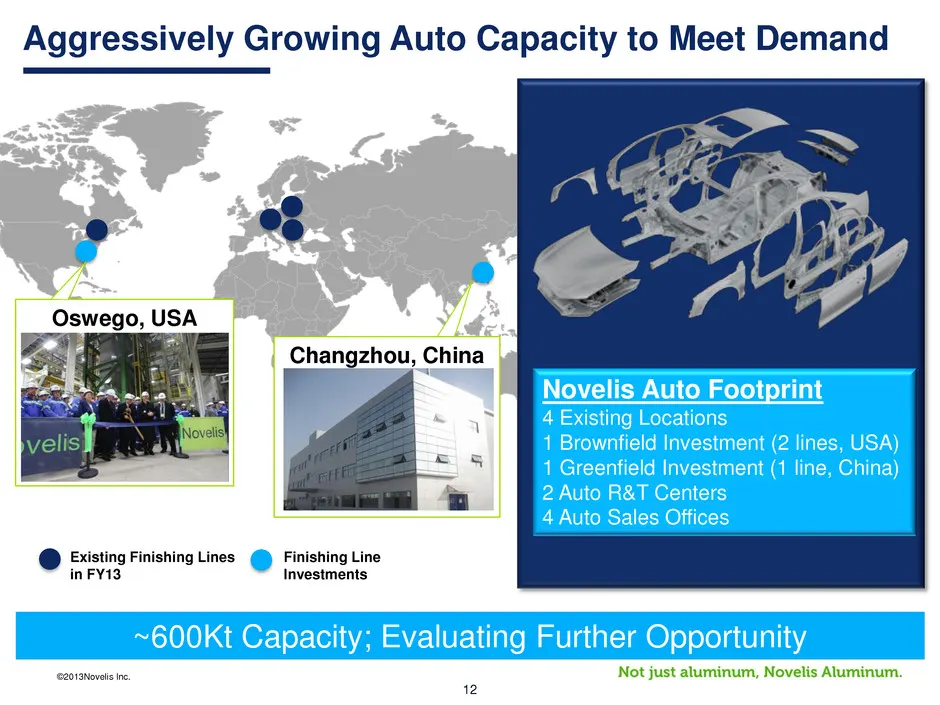
Slide 12: Aggressively Growing Auto Capacity to Meet Demand
©2013Novelis Inc. 12 Oswego, USA Aggressively Growing Auto Capacity to Meet Demand Existing Finishing Lines in FY13 Finishing Line Investments ~600Kt Capacity; Evaluating Further Opportunity Changzhou, China Novelis Auto Footprint 4 Existing Locations 1 Brownfield Investment (2 lines, USA) 1 Greenfi
Slide 13: Why Is Novelis the Supplier of Choice?
©2013Novelis Inc. 13 Why Is Novelis the Supplier of Choice? ■ First Mover Advantage ■ Global Footprint and Enhanced Recycling System ■ Investment in Technical Leadership ■ State of the Art Research & Technology Center Houses World’s Most Advanced Pilot Auto Pre-Treatment Line Novelis is the World Le

Slide 14: Detailed Financial Performance
©2013Novelis Inc. 14 Detailed Financial Performance
Slide 15: Second Quarter Highlights
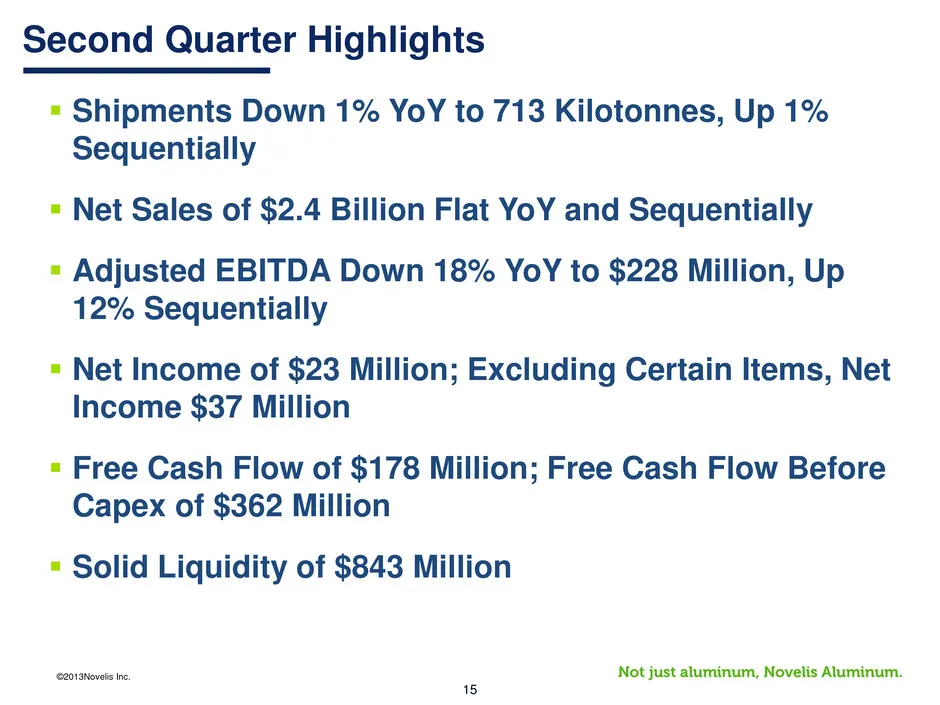
©2013Novelis Inc. 15 Second Quarter Highlights Shipments Down 1% YoY to 713 Kilotonnes, Up 1% Sequentially Net Sales of $2.4 Billion Flat YoY and Sequentially Adjusted EBITDA Down 18% YoY to $228 Million, Up 12% Sequentially Net Income of $23 Million; Excluding Certain Items, Net Income $37
Slide 16: Shipments by Region
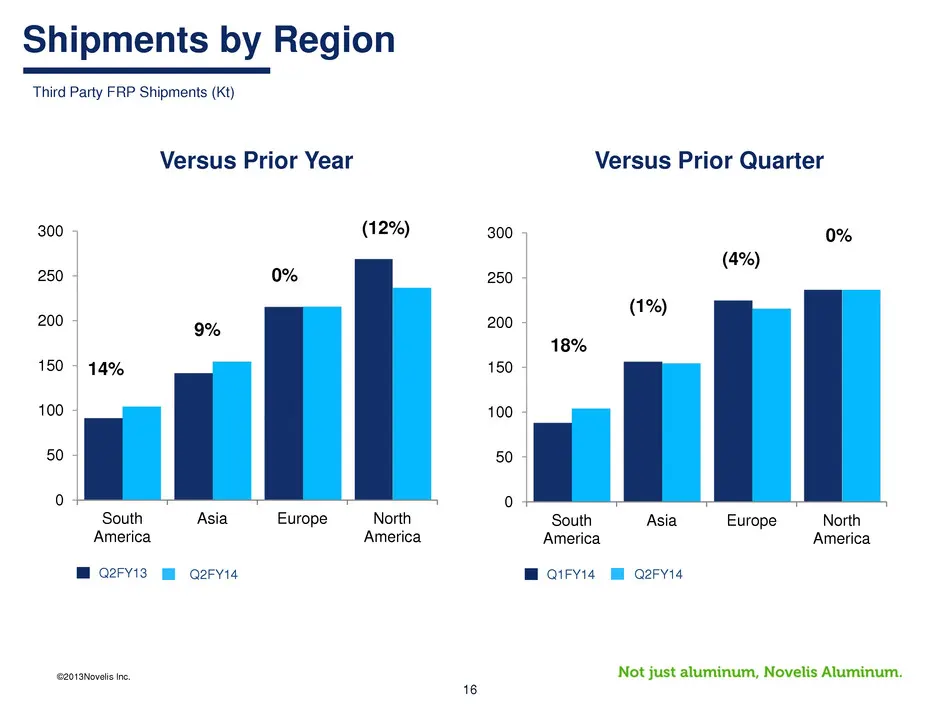
©2013Novelis Inc. 16 0 50 100 150 200 250 300 South America Asia Europe North America Q2FY14 Q1FY14 (1%) (4%) 0% 18% Third Party FRP Shipments (Kt) Shipments by Region Versus Prior Quarter 0 50 100 150 200 250 300 South America Asia Europe North America Versus Prior Year Q2FY14 Q2FY13 9% 0% (12%) 14
Slide 17: Adjusted EBITDA & Shipment Trend
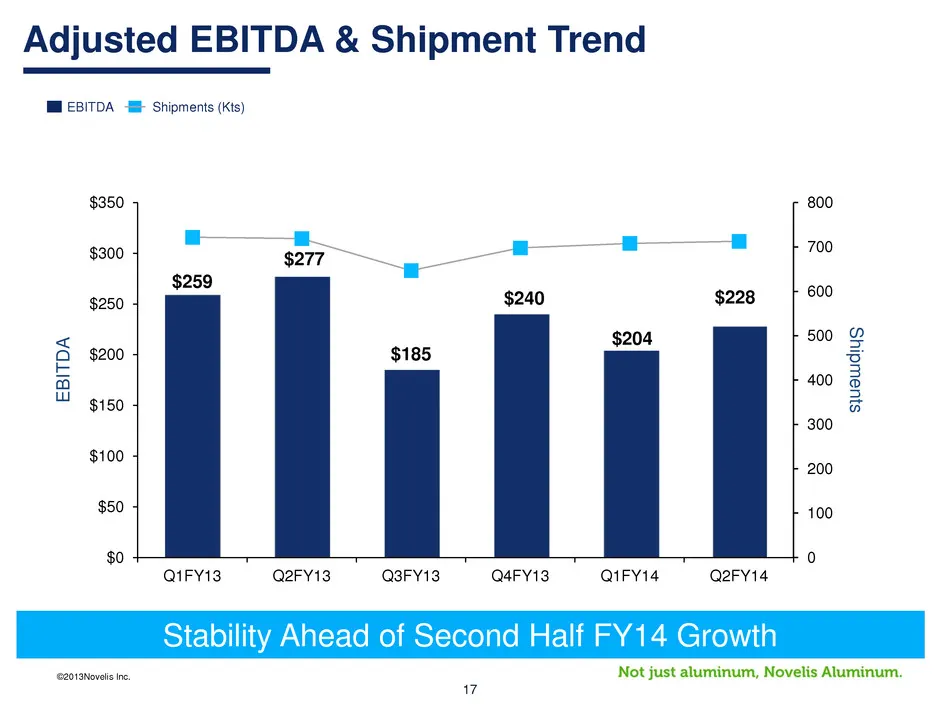
©2013Novelis Inc. 17 $259 $277 $185 $240 $204 $228 0 100 200 300 400 500 600 700 800 $0 $50 $100 $150 $200 $250 $300 $350 Q1FY13 Q2FY13 Q3FY13 Q4FY13 Q1FY14 Q2FY14 EB IT D A Ship m en ts EBITDA Adjusted EBITDA & Shipment Trend Stability Ahead of Second Half FY14 Growth Shipments (Kts)
Slide 18: Q2FY14 Adjusted EBITDA Bridge
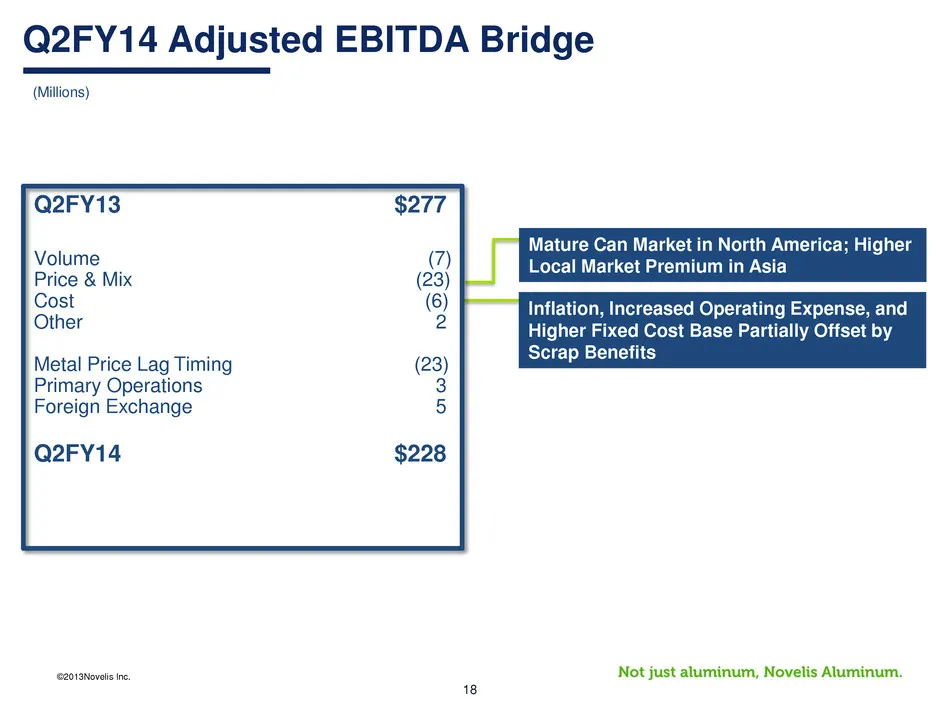
©2013Novelis Inc. 18 Q2FY14 Adjusted EBITDA Bridge (Millions) Q2FY13 $277 Volume (7) Price & Mix (23) Cost (6) Other 2 Metal Price Lag Timing (23) Primary Operations 3 Foreign Exchange 5 Q2FY14 $228 Mature Can Market in North America; Higher Local Market Premium in Asia Inflation, Increased Operatin
Slide 19: Capital Expenditures & Free Cash Flow Before CapEx
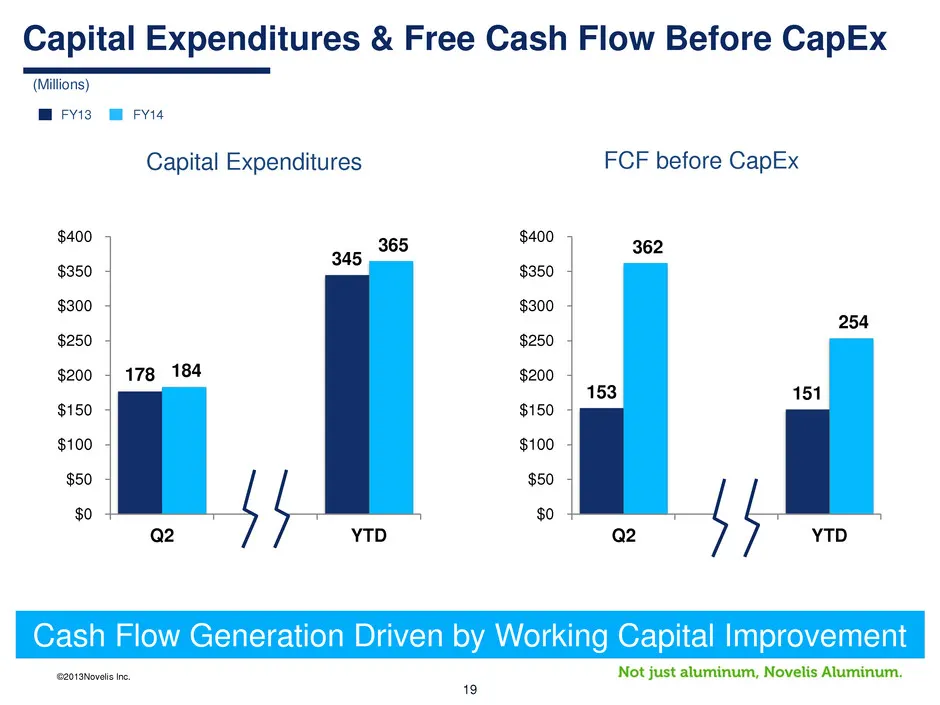
©2013Novelis Inc. 19 (Millions) Capital Expenditures & Free Cash Flow Before CapEx FY14 FY13 153 151 362 254 $0 $50 $100 $150 $200 $250 $300 $350 $400 Q2 YTD 178 345 184 365 $0 $50 $100 $150 $200 $250 $300 $350 $400 Q2 YTD Capital Expenditures FCF before CapEx Cash Flow Generation Driven by Working

Slide 20: Summary & Outlook
©2013Novelis Inc. 20 Summary & Outlook
Slide 21: Summary & FY14 Outlook
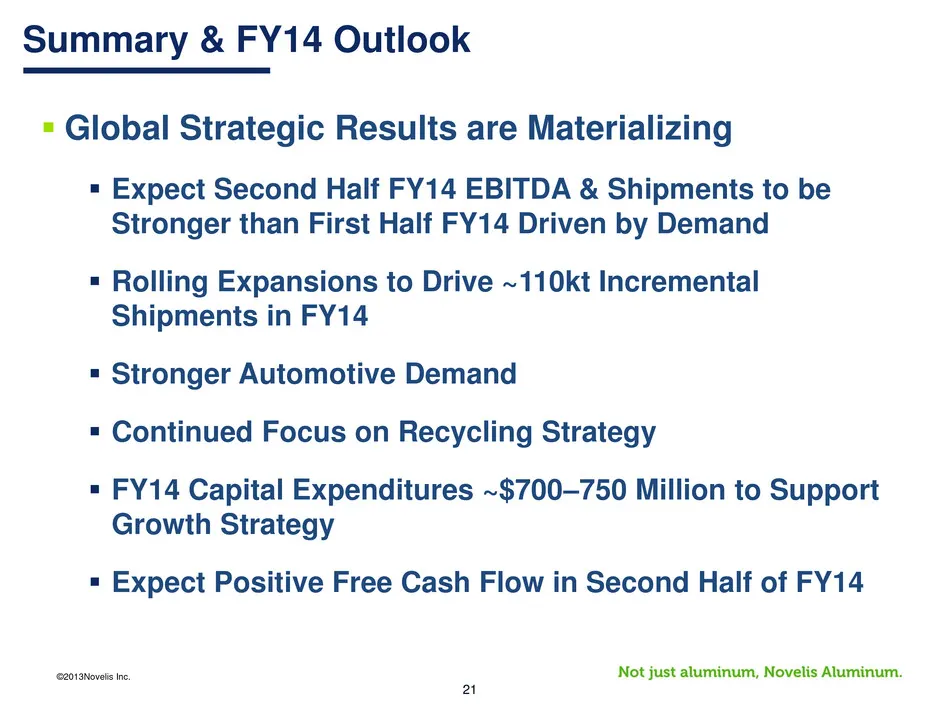
©2013Novelis Inc. 21 Summary & FY14 Outlook Global Strategic Results are Materializing Expect Second Half FY14 EBITDA & Shipments to be Stronger than First Half FY14 Driven by Demand Rolling Expansions to Drive ~110kt Incremental Shipments in FY14 Stronger Automotive Demand Continued Focus

Slide 22: Questions & Answers
©2013Novelis Inc. 22 Questions & Answers

Slide 23: Appendix
©2013Novelis Inc. 23 Appendix
Slide 24: Adjusted EBITDA Reconciliation
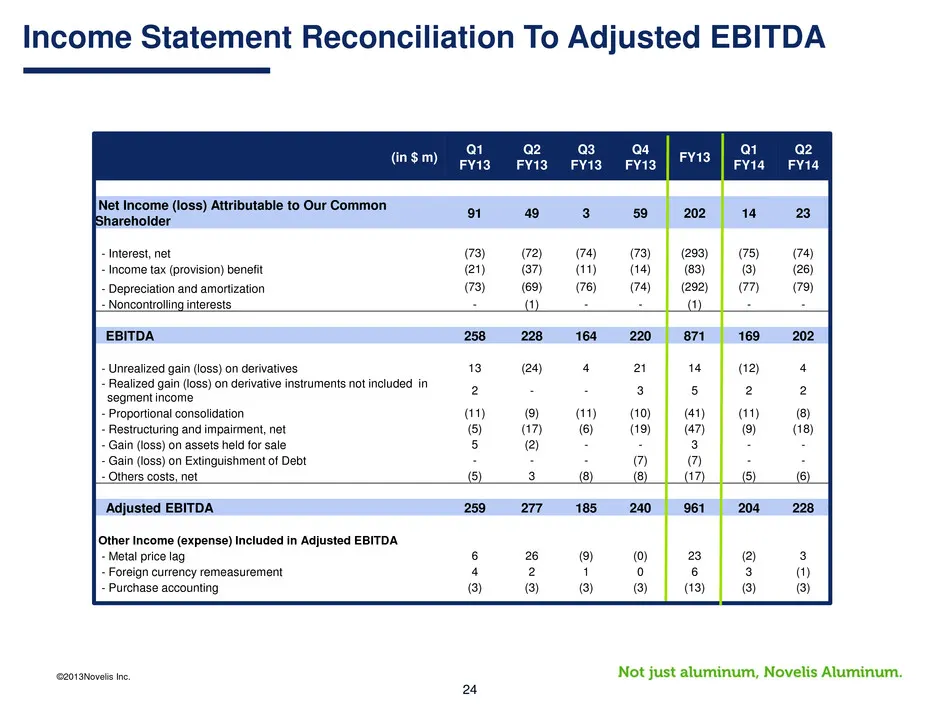
©2013Novelis Inc. 24 (in $ m) Q1 FY13 Q2 FY13 Q3 FY13 Q4 FY13 FY13 Q1 FY14 Q2 FY14 Net Income (loss) Attributable to Our Common Shareholder 91 49 3 59 202 14 23 - Interest, net (73) (72) (74) (73) (293) (75) (74) - Income tax (provision) benefit (21) (37) (11) (14) (83) (3) (26) - Depreciation and a
Slide 25: Free Cash Flow Reconciliation
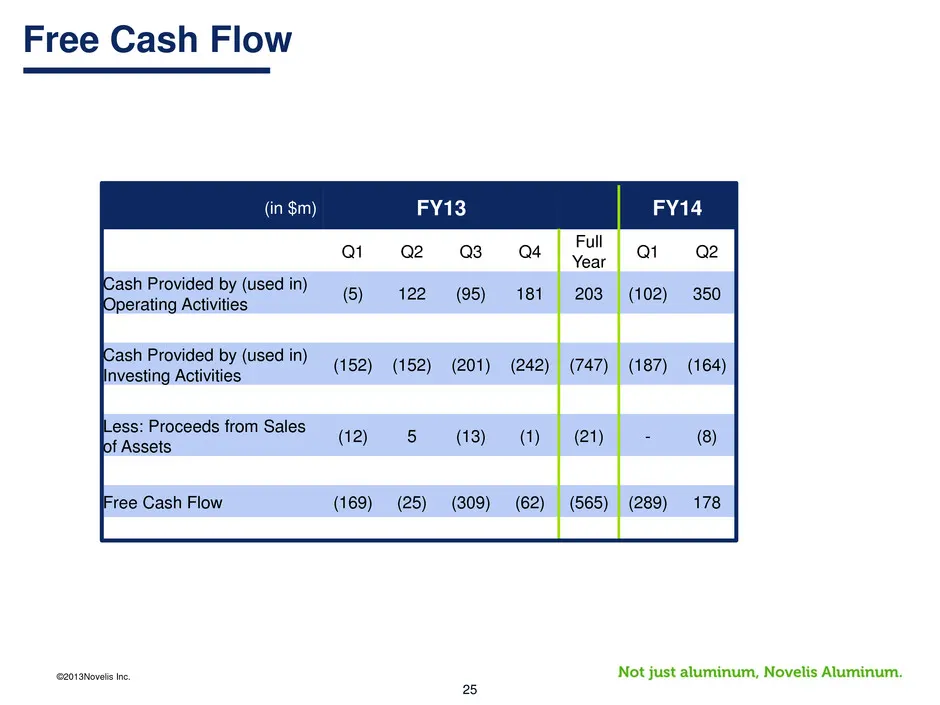
©2013Novelis Inc. 25 (in $m) FY13 FY14 Q1 Q2 Q3 Q4 Full Year Q1 Q2 Cash Provided by (used in) Operating Activities (5) 122 (95) 181 203 (102) 350 Cash Provided by (used in) Investing Activities (152) (152) (201) (242) (747) (187) (164) Less: Proceeds from Sales of Assets (12) 5 (13) (1) (21) - (8) F
Slide 26: Adjusted EBITDA Item Definitions
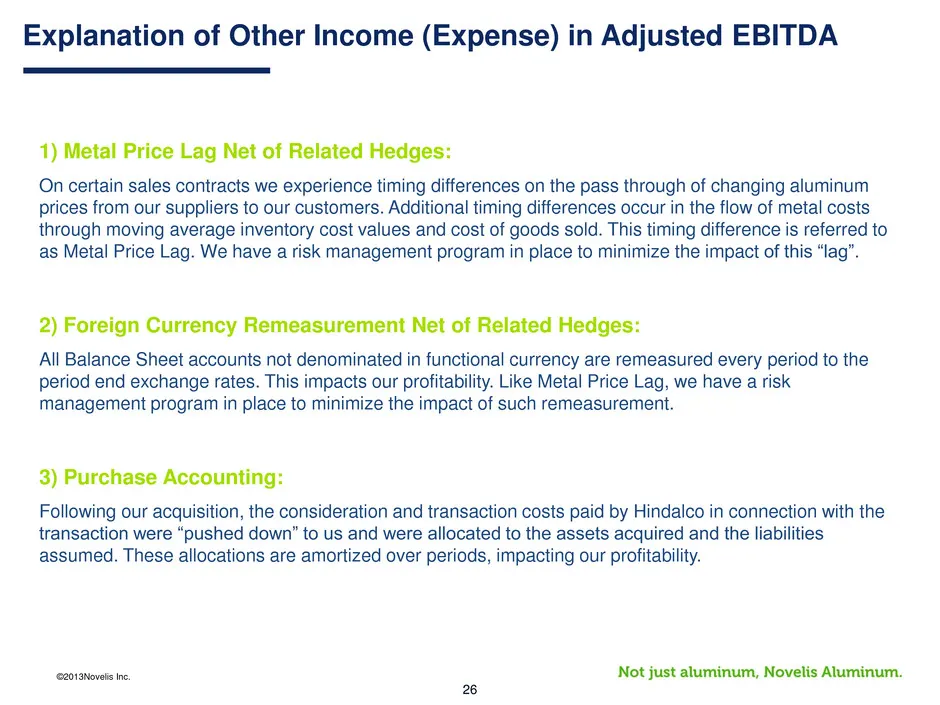
©2013Novelis Inc. 26 1) Metal Price Lag Net of Related Hedges: On certain sales contracts we experience timing differences on the pass through of changing aluminum prices from our suppliers to our customers. Additional timing differences occur in the flow of metal costs through moving average invent
Slide 27: Non-GAAP Financial Measures
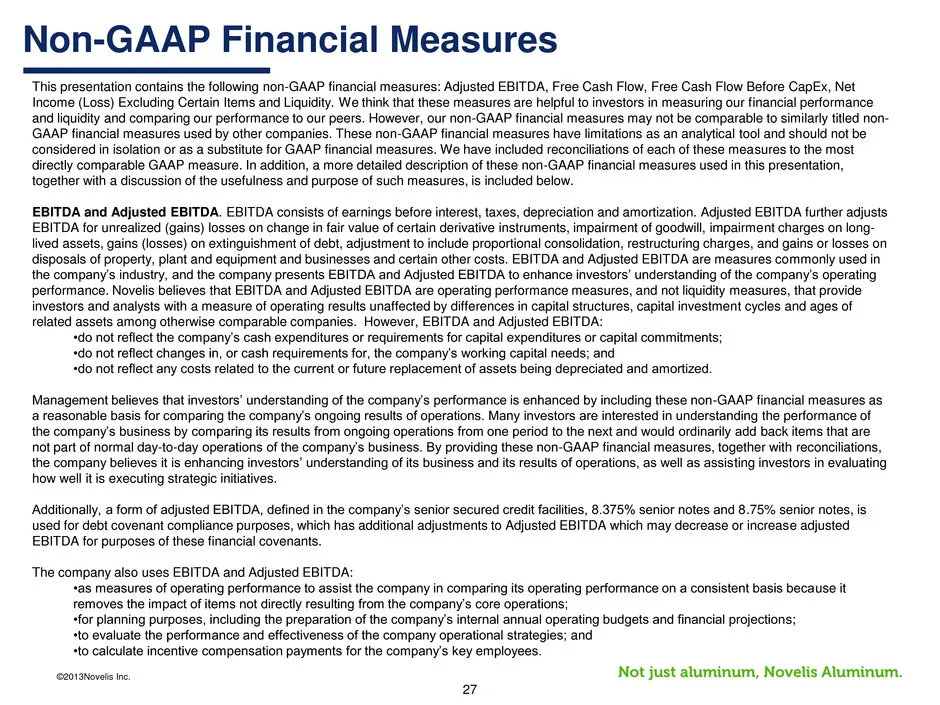
©2013Novelis Inc. 27 Non-GAAP Financial Measures This presentation contains the following non-GAAP financial measures: Adjusted EBITDA, Free Cash Flow, Free Cash Flow Before CapEx, Net Income (Loss) Excluding Certain Items and Liquidity. We think that these measures are helpful to investors in measu
Slide 28: Non-GAAP Financial Measures: Free Cash Flow
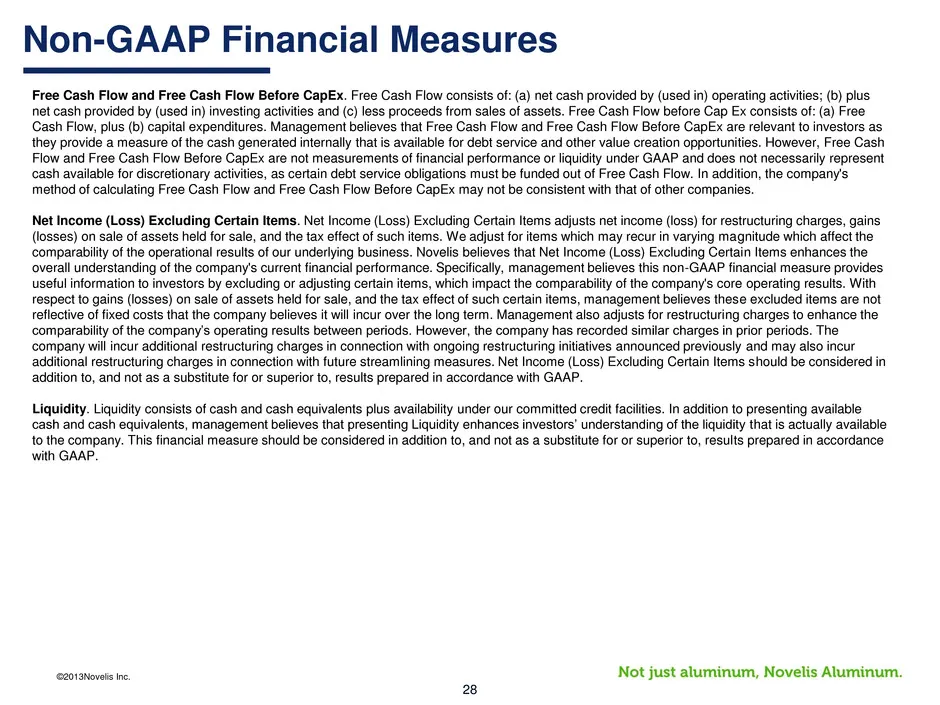
©2013Novelis Inc. 28 Non-GAAP Financial Measures Free Cash Flow and Free Cash Flow Before CapEx. Free Cash Flow consists of: (a) net cash provided by (used in) operating activities; (b) plus net cash provided by (used in) investing activities and (c) less proceeds from sales of assets. Free Cash Flo
Source: SEC EDGAR · 8-K filed Nov 12, 2013
More decks from Novelis Inc.
 Q2 FY2027 Earnings Presentation20 slides · Nov 5, 2026
 Q2 FY2027 Earnings Presentation31 slides · Nov 5, 2026
 Q1 FY2027 Earnings Presentation21 slides · Aug 5, 2026
 Q1 FY2027 Earnings Presentation31 slides · Aug 5, 2026
 Q4 FY2026 Earnings Presentation33 slides · May 19, 2026
 Q3 FY2026 Earnings Presentation33 slides · Feb 11, 2026