Cirrus Logic, Inc. · NASDAQ:CRUS
Cirrus Logic — Investor Presentation (January 2019)
28 slides from Cirrus Logic's investor presentation, Jan 30, 2019

Slide 1: Investor Relations Update
Investor Relations Update As of January 30, 2019
Slide 2: Safe Harbor Statement
Safe Harbor Statement Except for historical information contained herein, the matters set forth in this presentation contain forward- looking statements, including industry market projections; our revenue growth opportunities; our ability to grow revenue by expanding content and share in smartphones
Slide 3: Cirrus Logic at a Glance
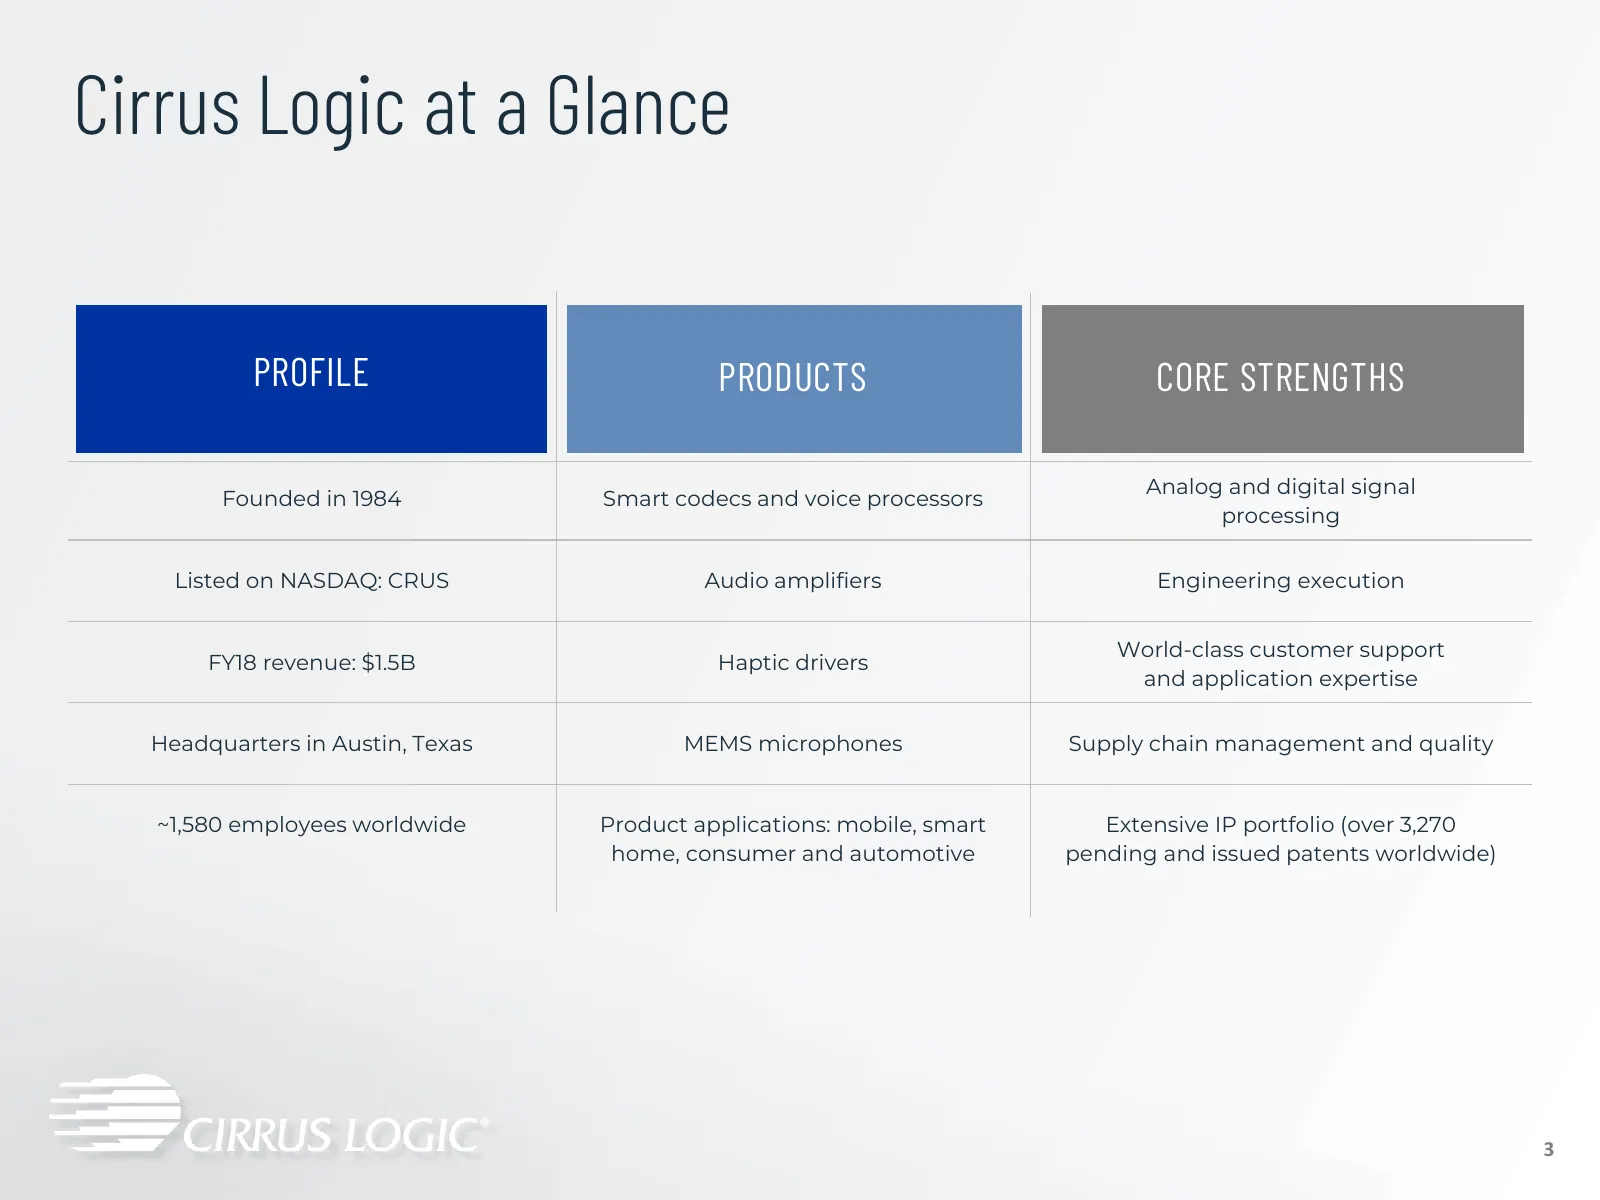
Cirrus Logic at a Glance PROFILE PRODUCTS CORE STRENGTHS Analog and digital signal Founded in 1984 Smart codecs and voice processors processing Listed on NASDAQ: CRUS Audio amplifiers Engineering execution World-class customer support FY18 revenue: $1.5B Haptic drivers and application expertise Head
Slide 4: Compelling Business Strategy
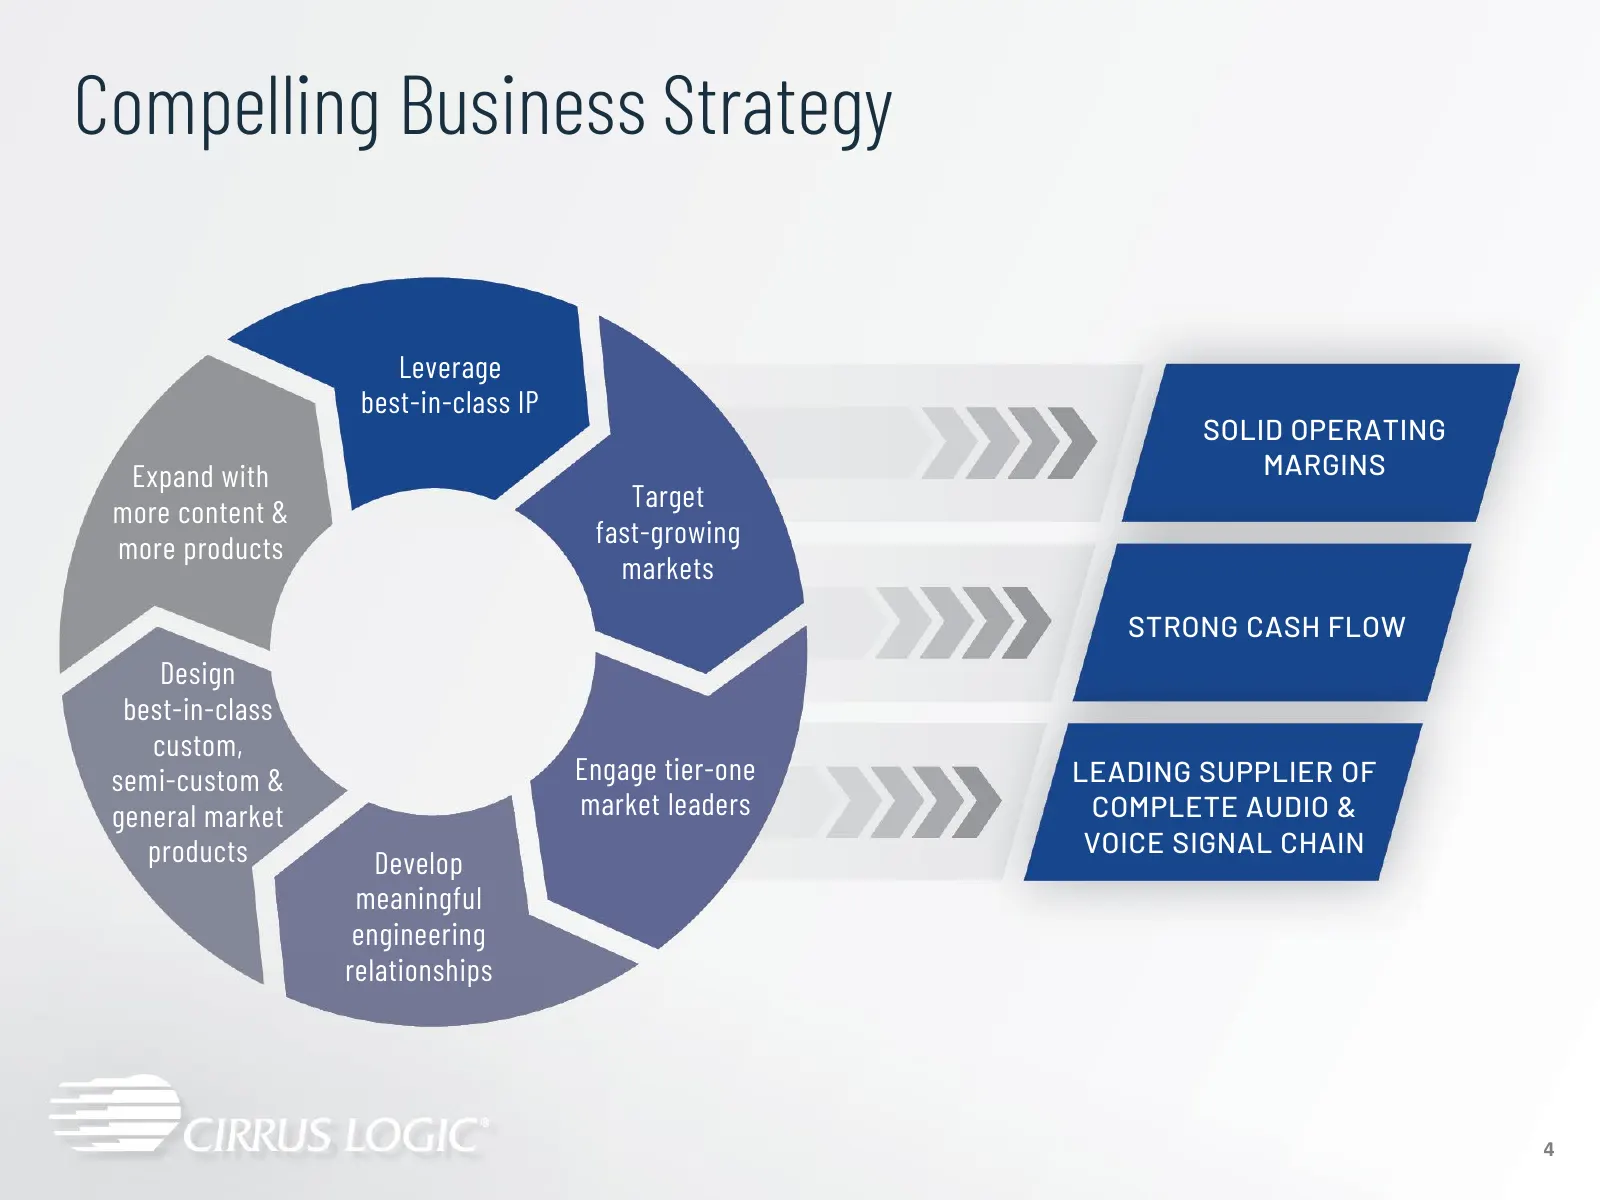
Compelling Business Strategy Leverage best-in-class IP SOLID OPERATING Expand with MARGINS more content & Target more products fast-growing markets STRONG CASH FLOW Design best-in-class custom, semi-custom & Engage tier-one LEADING SUPPLIER OF general market market leaders COMPLETE AUDIO & products
Slide 5: Focus on Market-Leading Customers
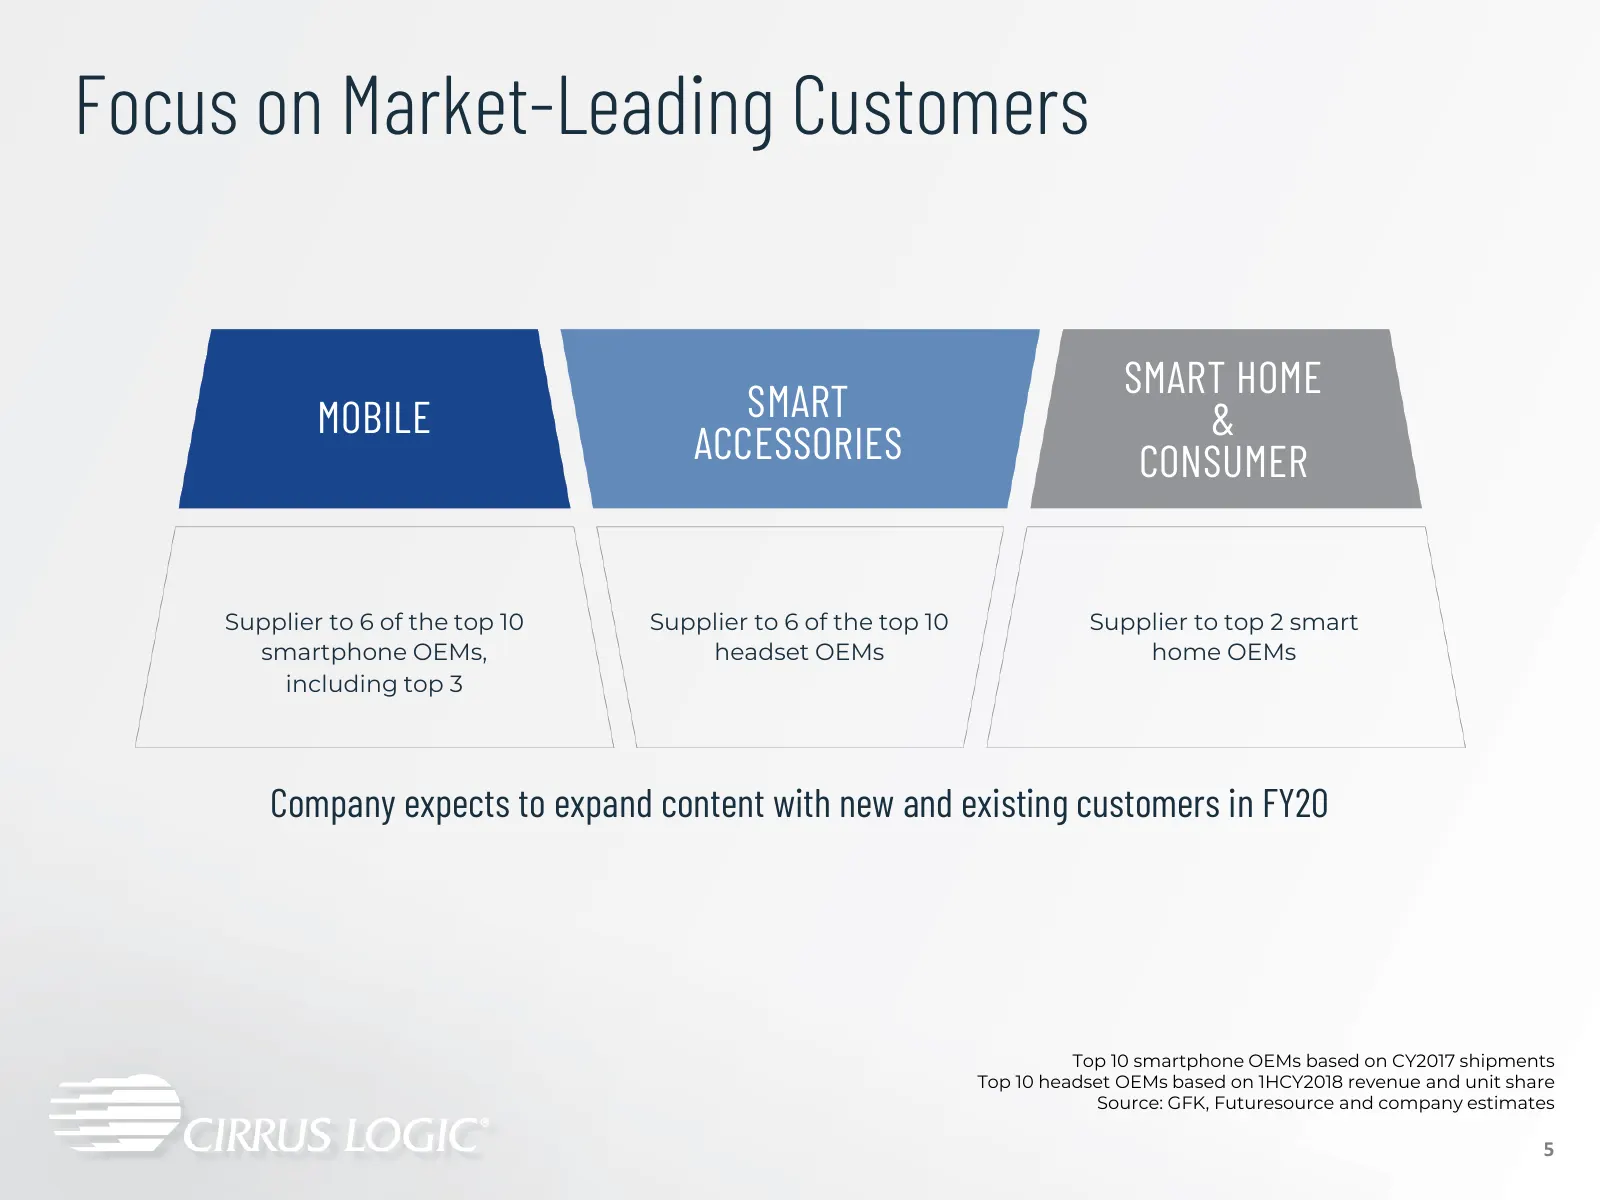
Focus on Market-Leading Customers SMART HOME MOBILE SMART & ACCESSORIES CONSUMER Supplier to 6 of the top 10 Supplier to 6 of the top 10 Supplier to top 2 smart smartphone OEMs, headset OEMs home OEMs including top 3 Company expects to expand content with new and existing customers in FY20 Top 10 sm

Slide 6: Work Hard, Play Hard
ORK HARD,/PLAY HARD a f Unique Corporate Culture Great |Best Workplaces™ Place Medium Businesses To Work 2 USA 2018 pied Best Workplaces” To. Medium Category Work. [ii 2018 COMMUNITY SUPPOR t y eh

Slide 7: Technology & Market Overview
Technology & Market Overview 7
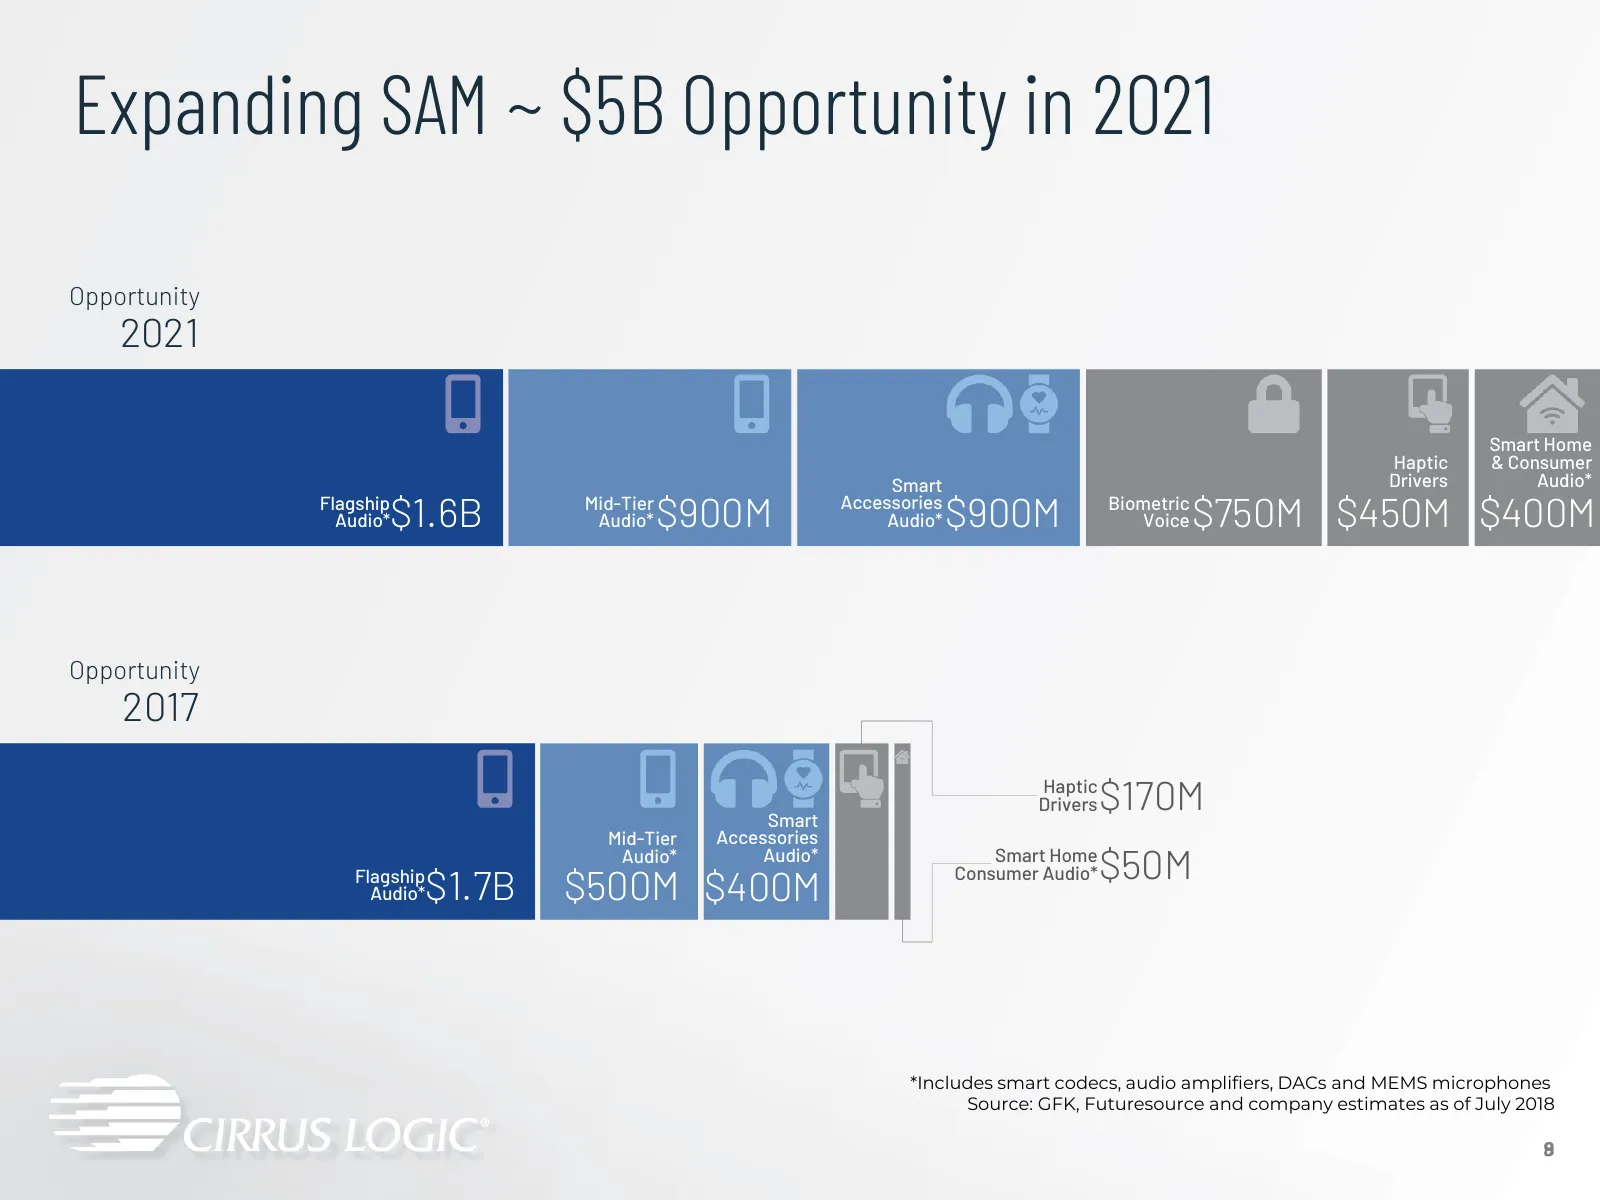
Slide 8: Expanding SAM ~ $5B Opportunity in 2021
Expanding SAM ~ $5B Opportunity in 2021 Opportunity 2021 Smart Home Haptic & Consumer Smart Drivers Audio* Flagship Audio* $1.6B Mid-Tier Audio* $900M Accessories Audio* $900M Biometric Voice $750M $450M $400M Opportunity 2017 Smart Haptic Drivers $170M Mid-Tier Accessories Audio* Audio* Smart Home
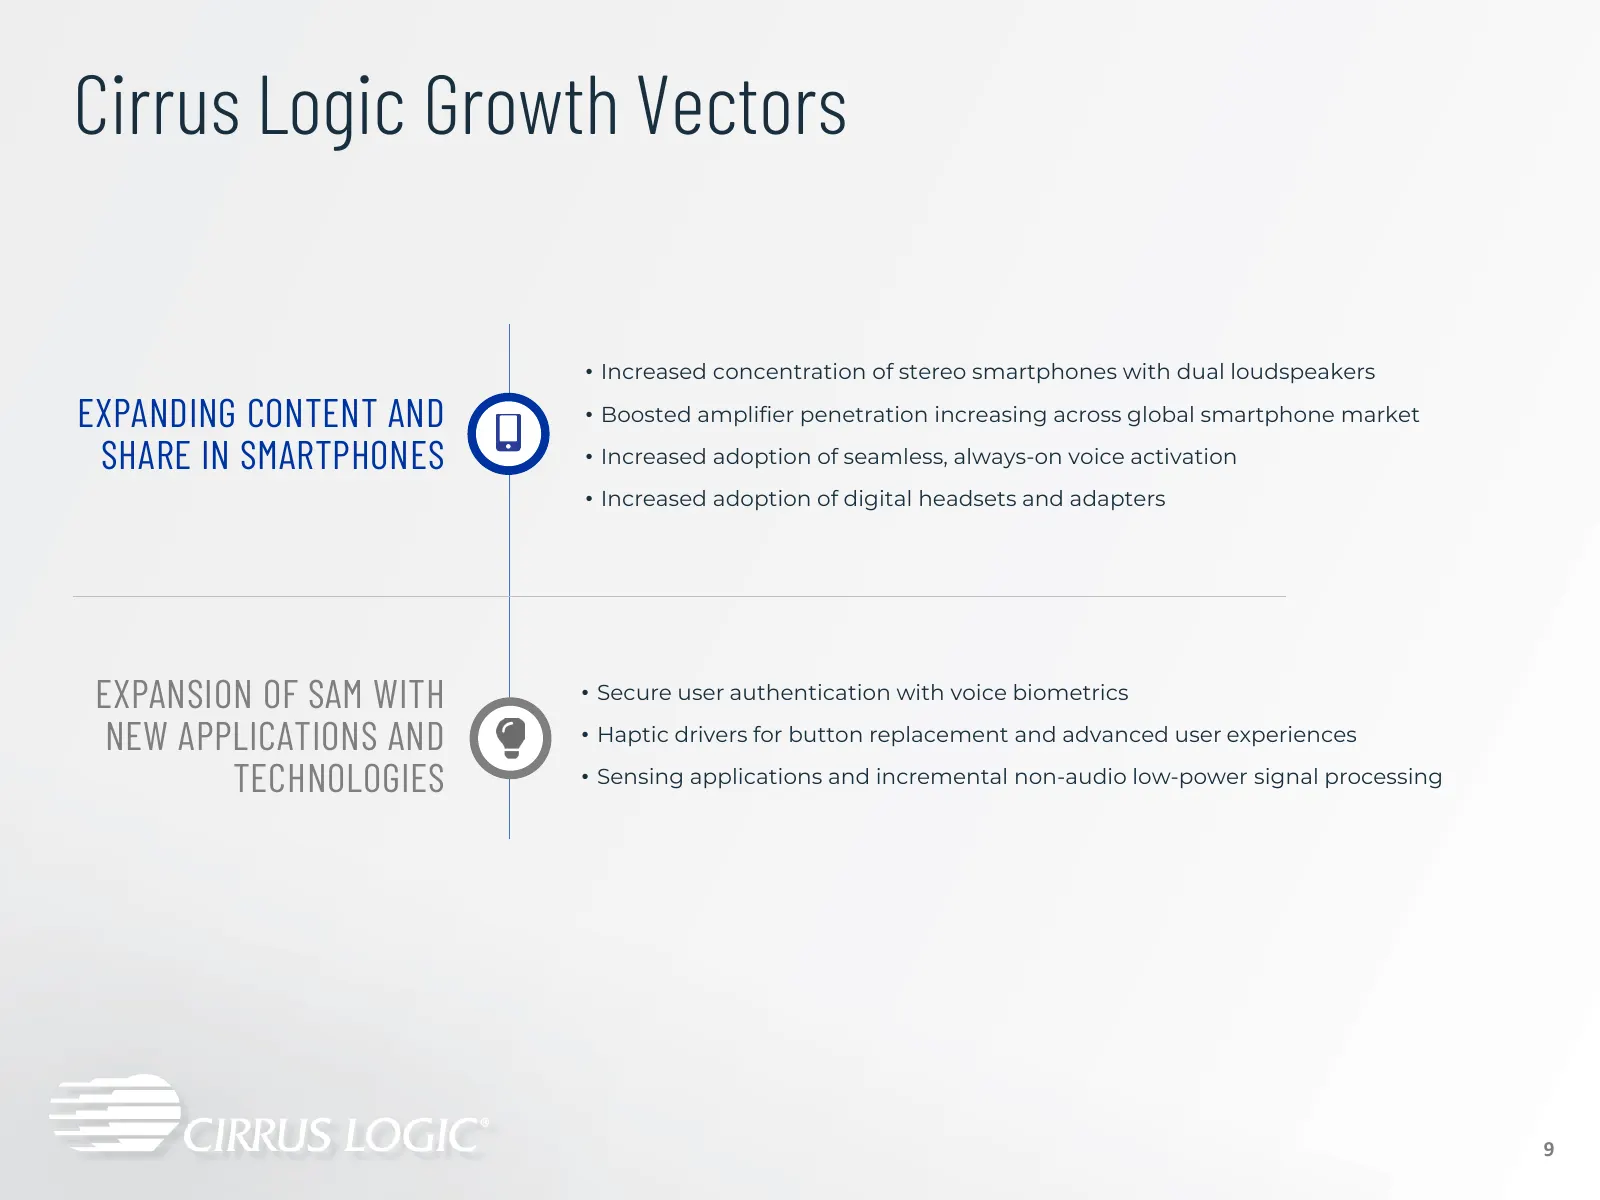
Slide 9: Cirrus Logic Growth Vectors
Cirrus Logic Growth Vectors • Increased concentration of stereo smartphones with dual loudspeakers EXPANDING CONTENT AND • Boosted amplifier penetration increasing across global smartphone market SHARE IN SMARTPHONES • Increased adoption of seamless, always-on voice activation • Increased adoption o
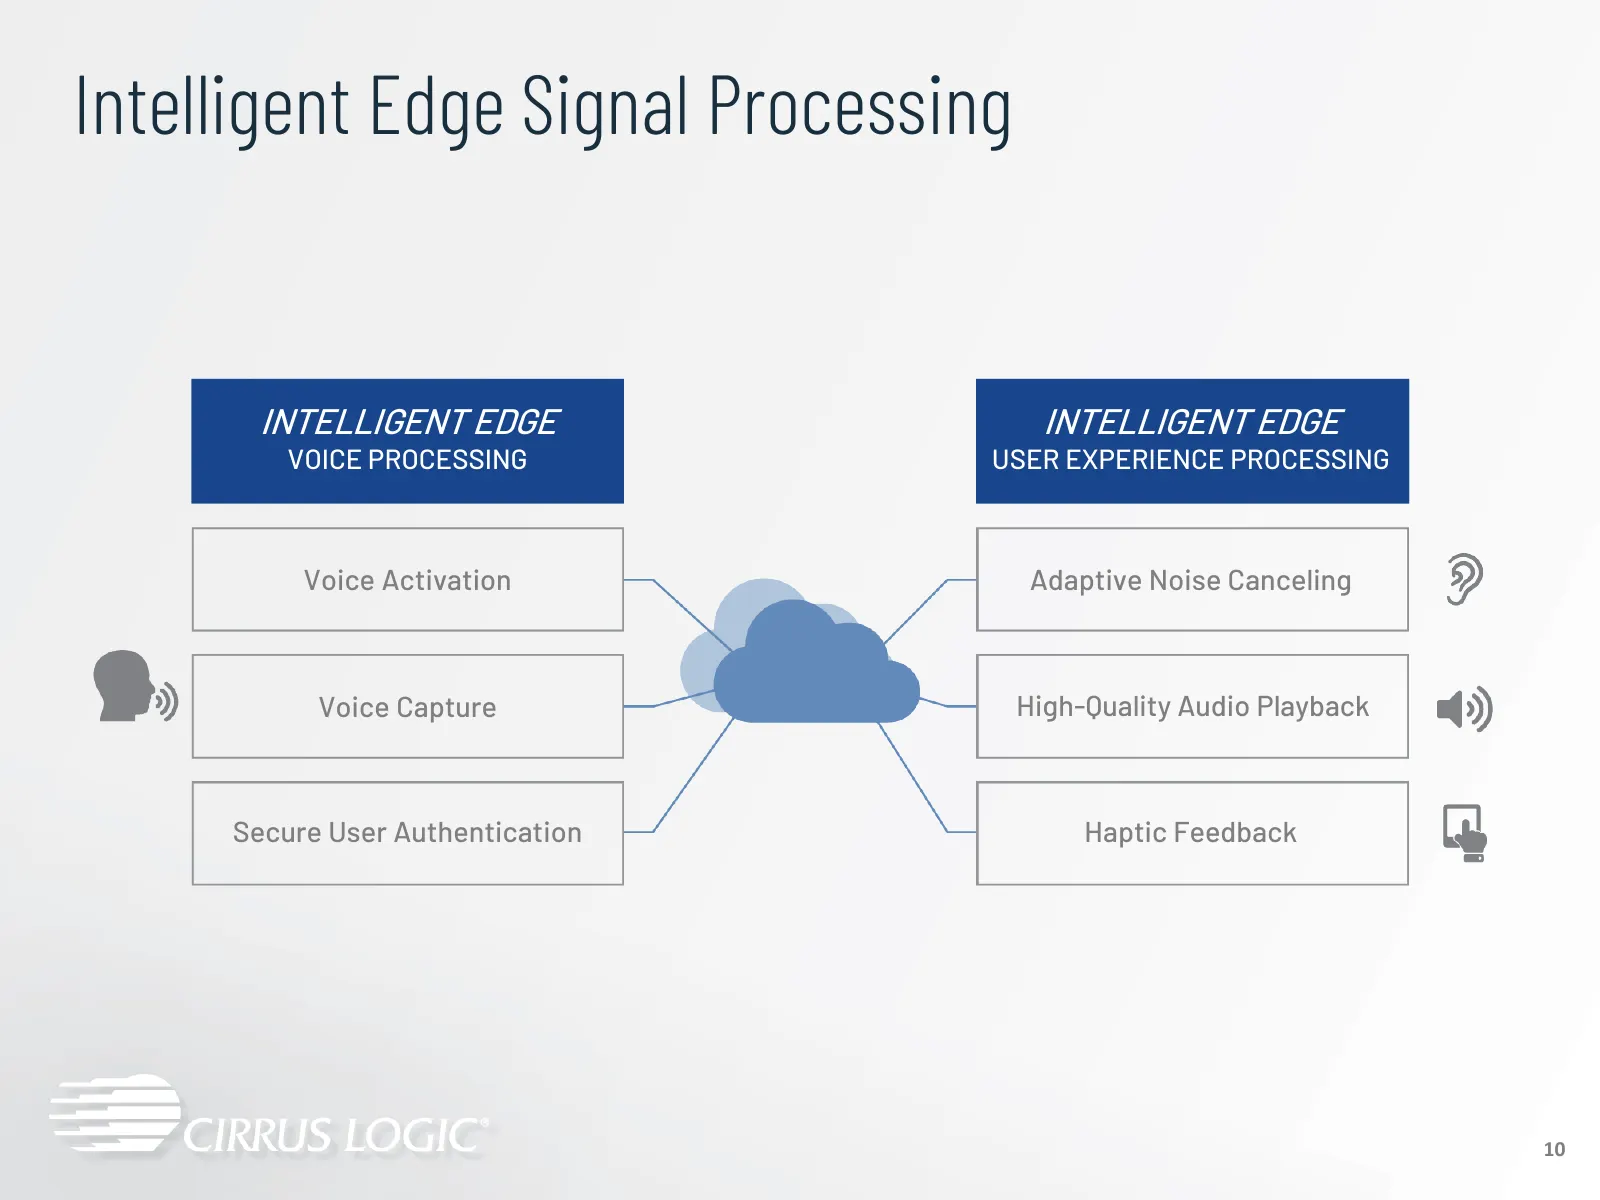
Slide 10: Intelligent Edge Signal Processing
Intelligent Edge Signal Processing INTELLIGENT EDGE INTELLIGENT EDGE VOICE PROCESSING USER EXPERIENCE PROCESSING Voice Activation Adaptive Noise Canceling Voice Capture High-Quality Audio Playback Secure User Authentication Haptic Feedback 10
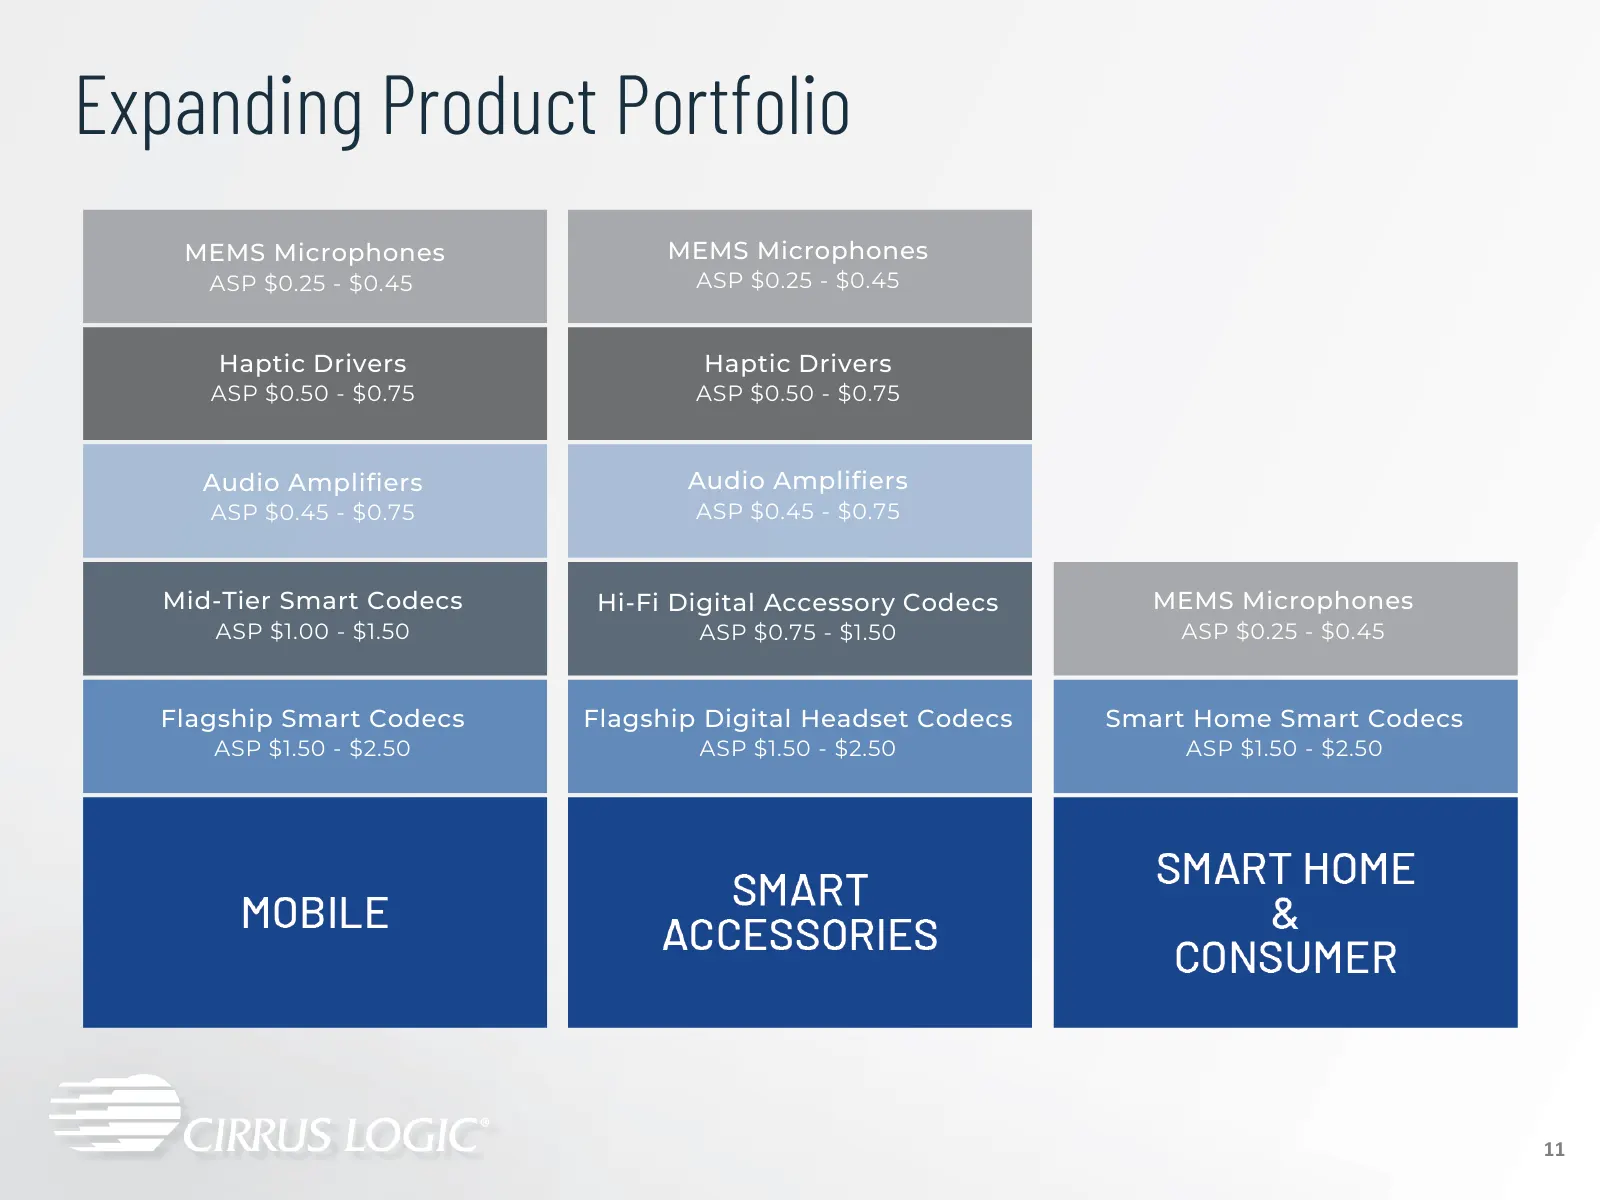
Slide 11: Expanding Product Portfolio
Expanding Product Portfolio MEMS Microphones MEMS Microphones ASP $0.25 - $0.45 ASP $0.25 - $0.45 Haptic Drivers Haptic Drivers ASP $0.50 - $0.75 ASP $0.50 - $0.75 Audio Amplifiers Audio Amplifiers ASP $0.45 - $0.75 ASP $0.45 - $0.75 Mid-Tier Smart Codecs Hi-Fi Digital Accessory Codecs MEMS Micropho
Slide 12: Product Overview
Product Overview Yijiiijisiess... bpp trea gs
Slide 13: Audio Amplifiers
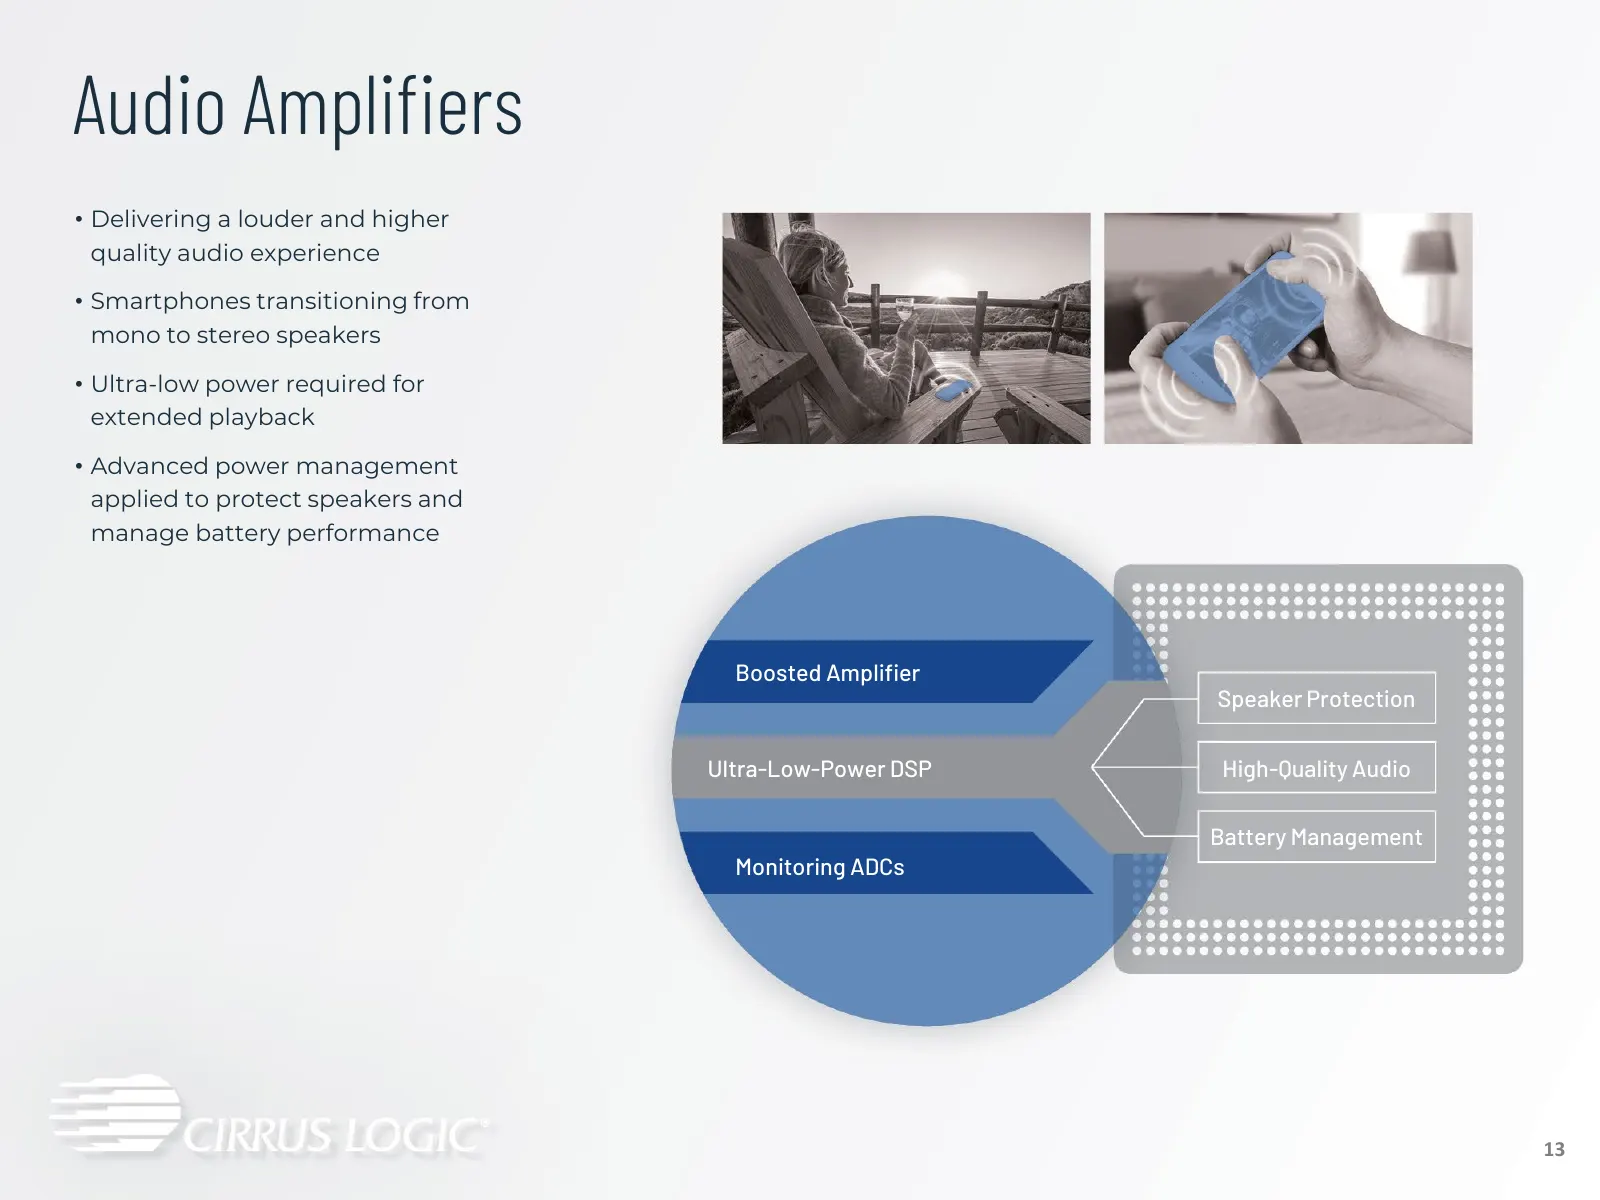
Audio Amplifiers • Delivering a louder and higher quality audio experience • Smartphones transitioning from mono to stereo speakers • Ultra-low power required for extended playback • Advanced power management applied to protect speakers and manage battery performance Boosted Amplifier Speaker Protec
Slide 14: Haptic Drivers
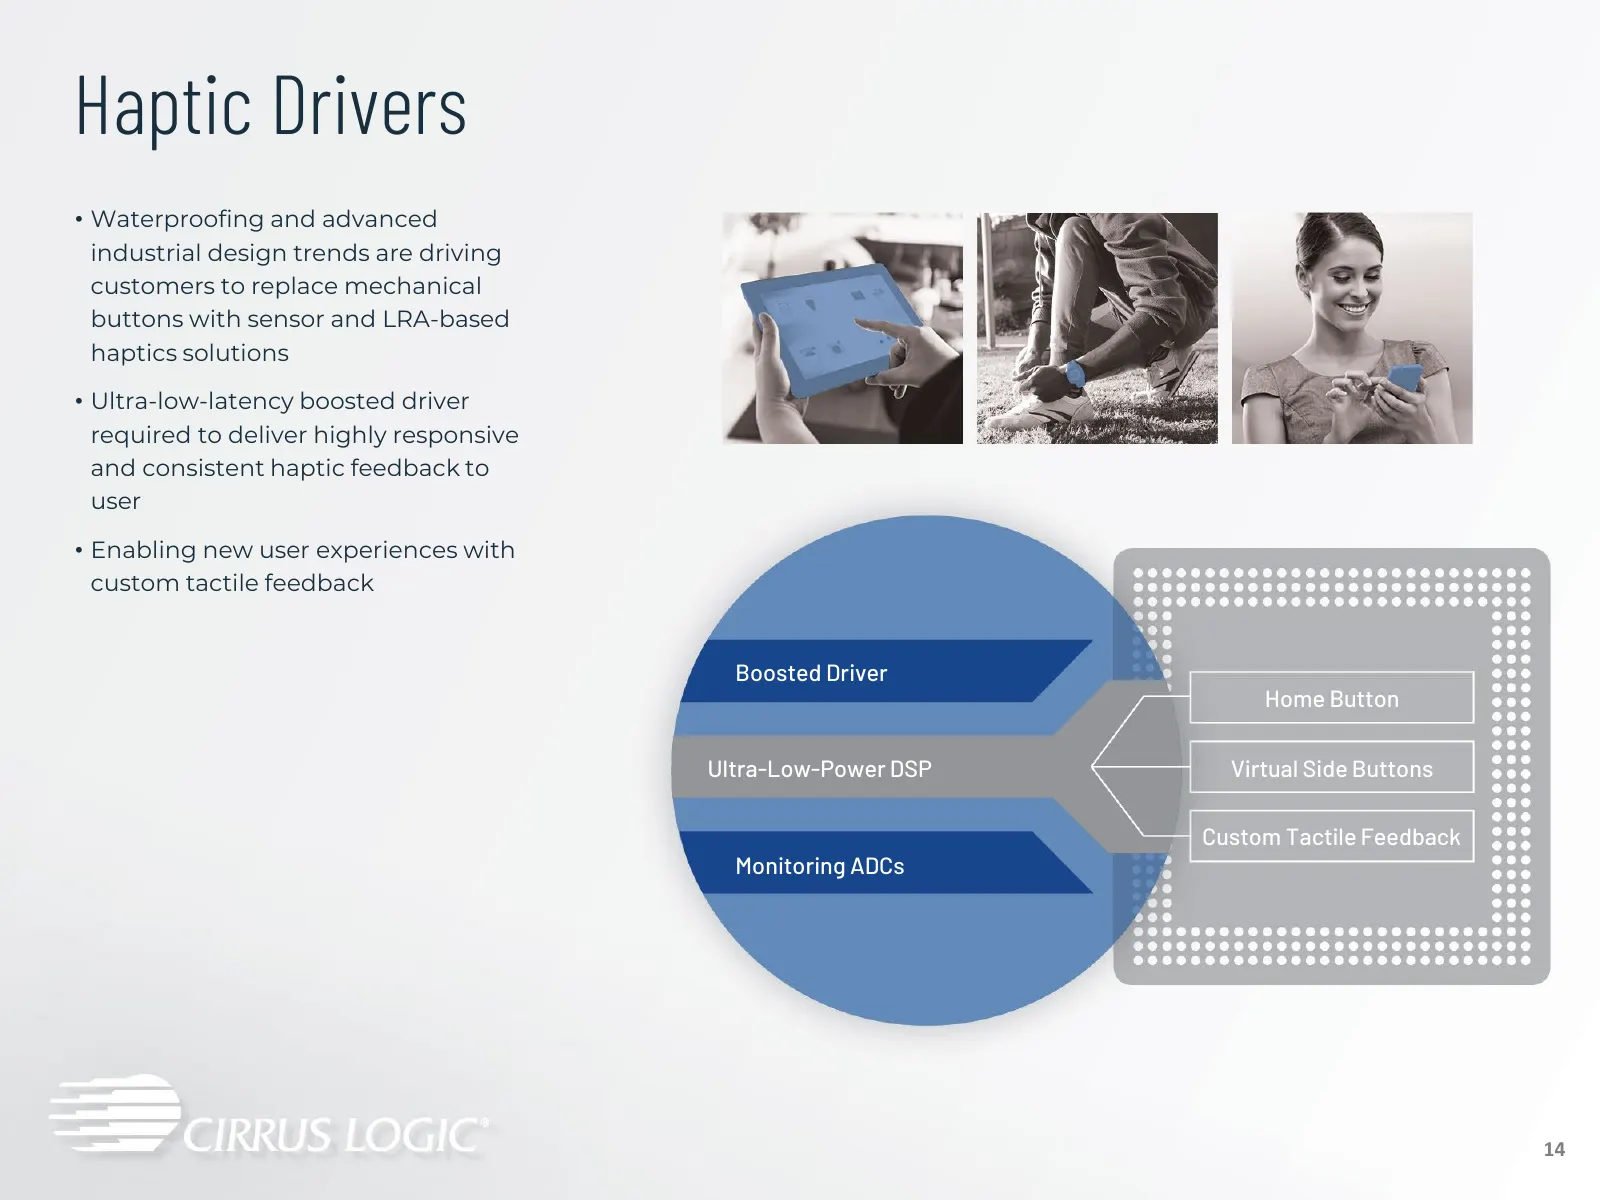
Haptic Drivers • Waterproofing and advanced industrial design trends are driving customers to replace mechanical buttons with sensor and LRA-based haptics solutions • Ultra-low-latency boosted driver required to deliver highly responsive and consistent haptic feedback to user • Enabling new user exp
Slide 15: Smart Codecs & Voice Processors
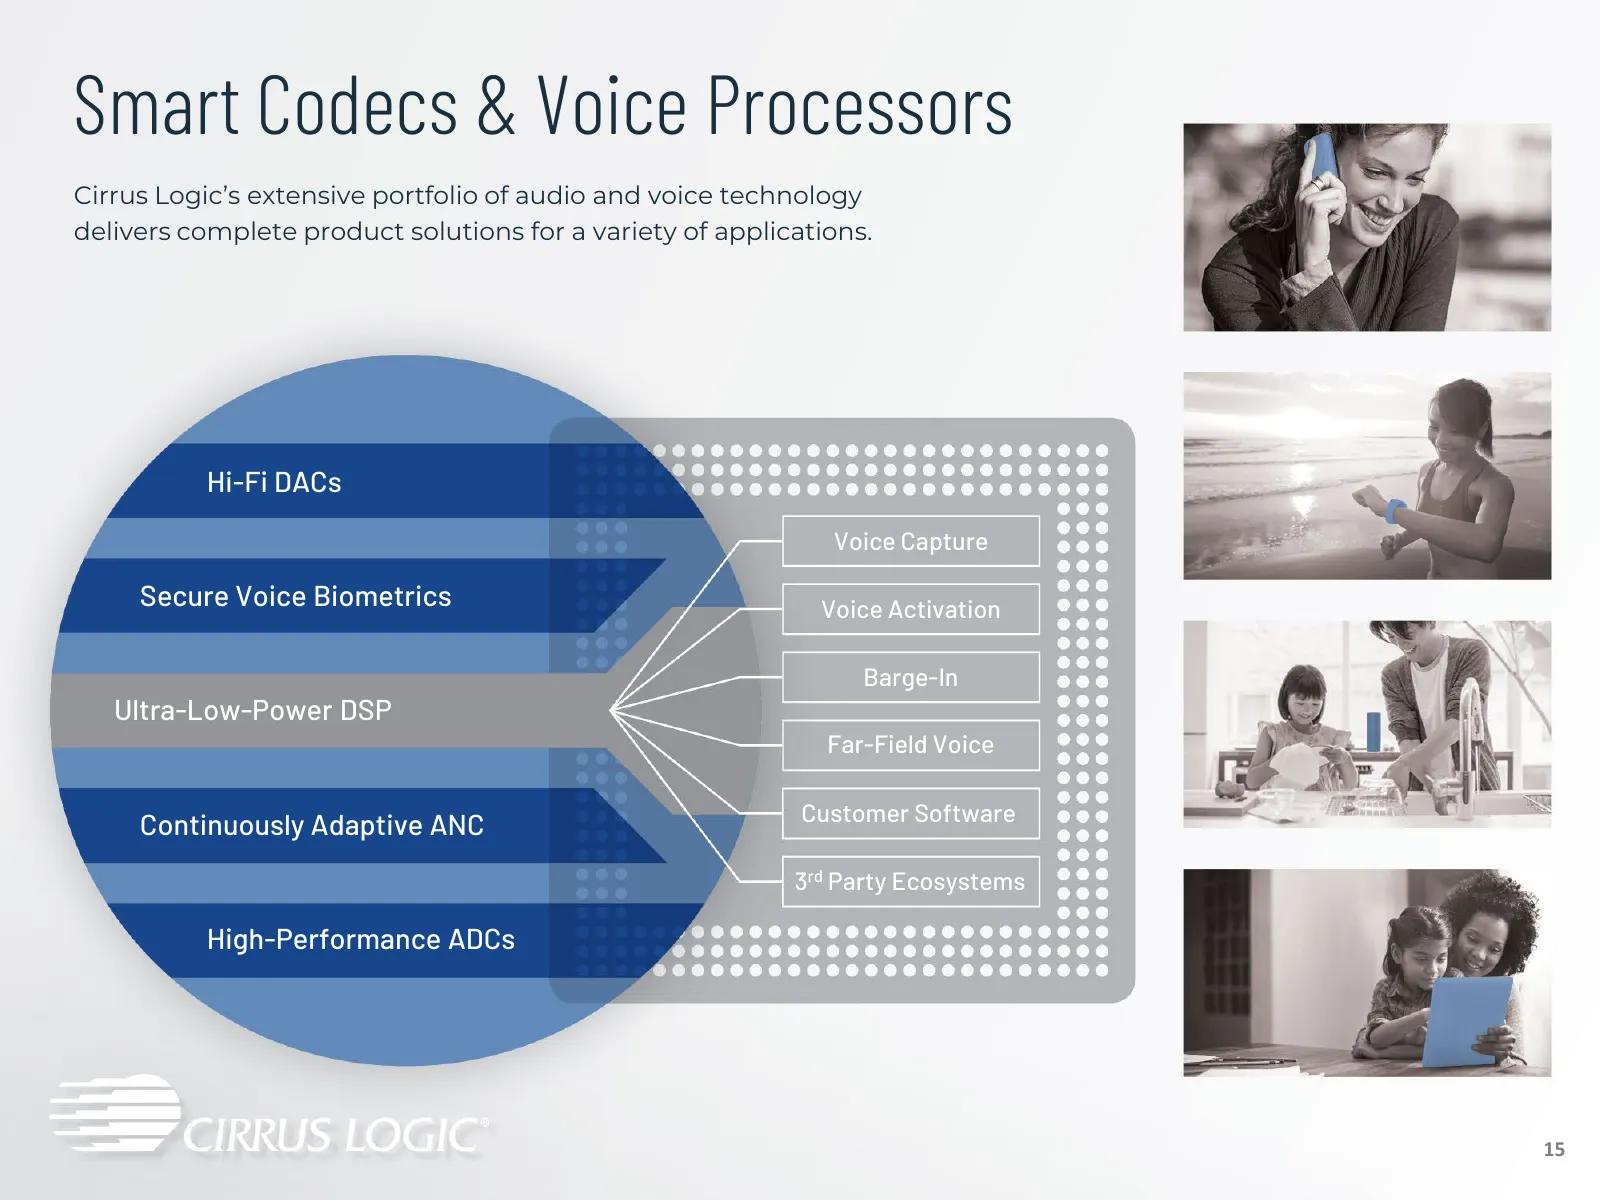
Smart Codecs & Voice Processors Cirrus Logic’s extensive portfolio of audio and voice technology delivers complete product solutions for a variety of applications. Hi-Fi DACs Voice Capture Secure Voice Biometrics Voice Activation Barge-In Ultra-Low-Power DSP Far-Field Voice Customer Software Continu
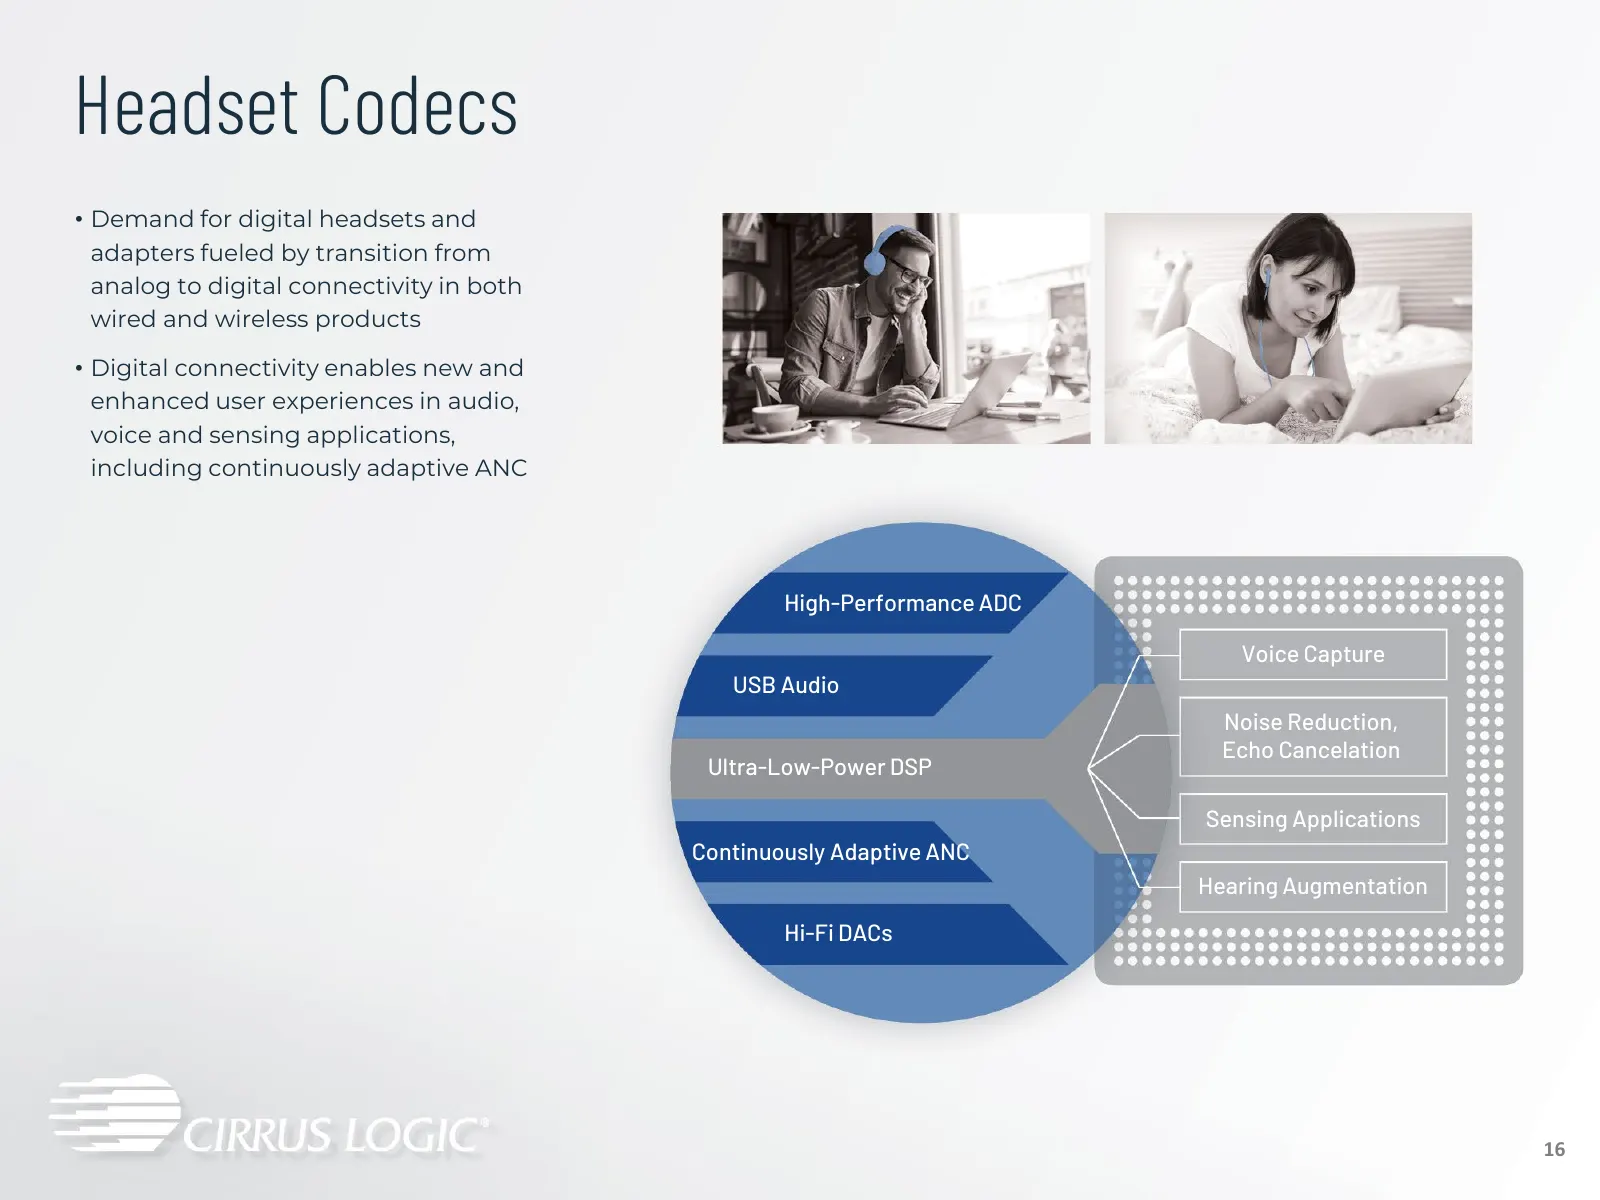
Slide 16: Headset Codecs
Headset Codecs • Demand for digital headsets and adapters fueled by transition from analog to digital connectivity in both wired and wireless products • Digital connectivity enables new and enhanced user experiences in audio, voice and sensing applications, including continuously adaptive ANC High-P
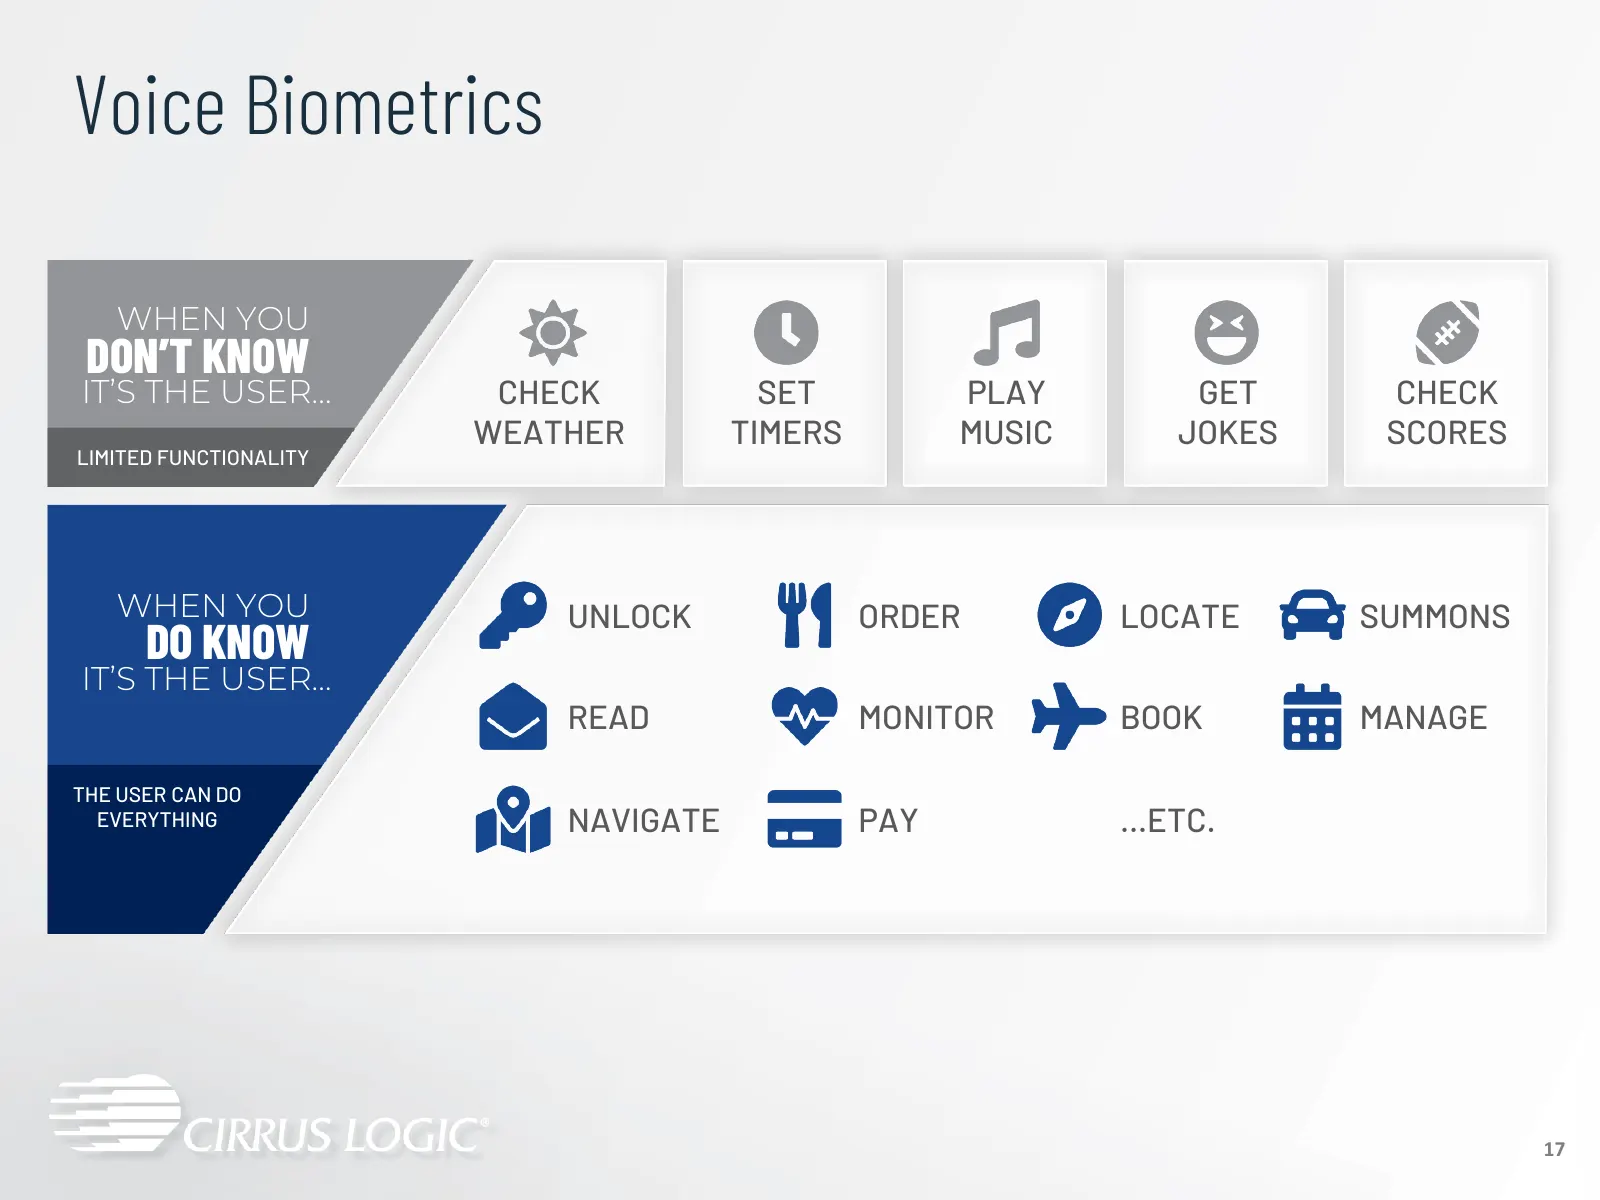
Slide 17: Voice Biometrics
Voice Biometrics WHEN YOU DON’T KNOW IT’S THE USER… CHECK SET PLAY GET CHECK WEATHER TIMERS MUSIC JOKES SCORES LIMITED FUNCTIONALITY WHEN YOU UNLOCK ORDER LOCATE SUMMONS DO KNOW IT’S THE USER… READ MONITOR BOOK MANAGE THE USER CAN DO EVERYTHING NAVIGATE PAY …ETC. 17
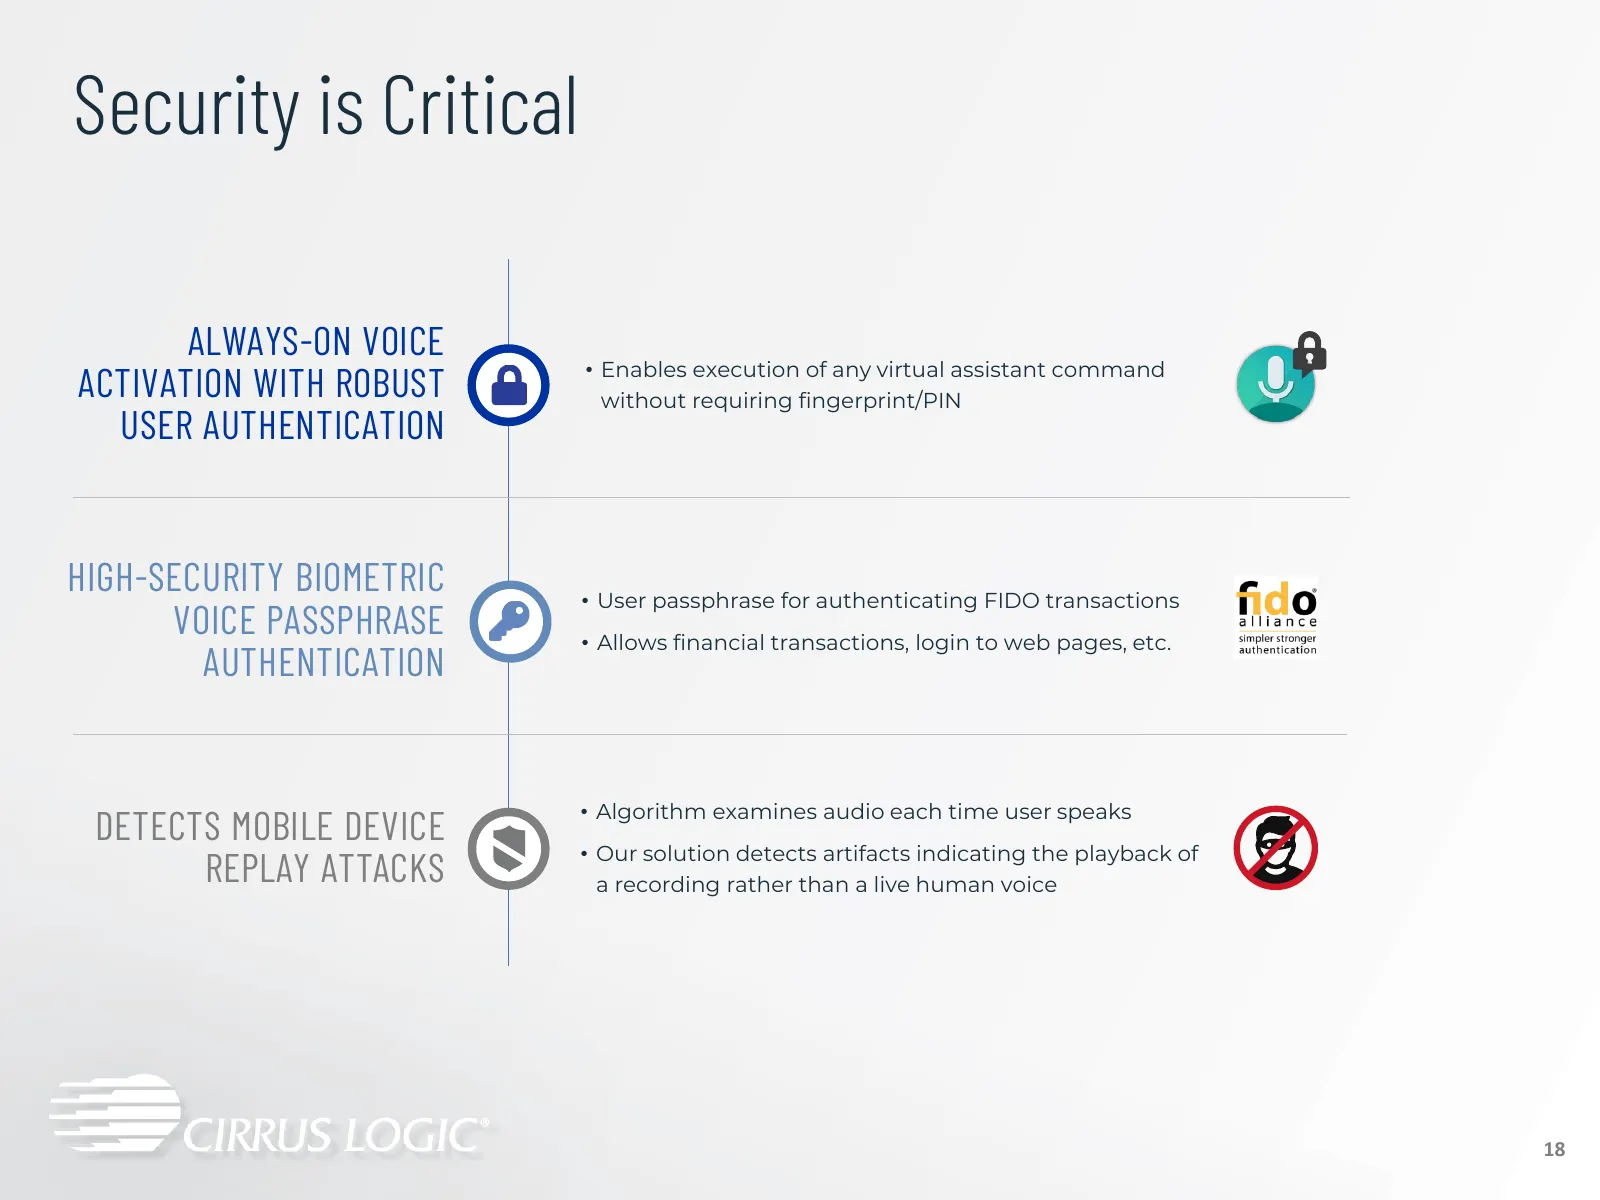
Slide 18: Security is Critical
Security is Critical ALWAYS-ON VOICE ACTIVATION WITH ROBUST • Enables execution of any virtual assistant command without requiring fingerprint/PIN USER AUTHENTICATION HIGH-SECURITY BIOMETRIC • User passphrase for authenticating FIDO transactions VOICE PASSPHRASE • Allows financial transactions, logi
Slide 19: Positioned for Long-Term Growth
Positioned for Long-Term Growth • Multiple vectors for content and application expansion driving significant growth in SAM • Leveraging mixed-signal expertise to penetrate adjacent technology opportunities • Investment in innovative R&D projects expected to extend market leadership in audio, voice a

Slide 20: Financials
Financials 20
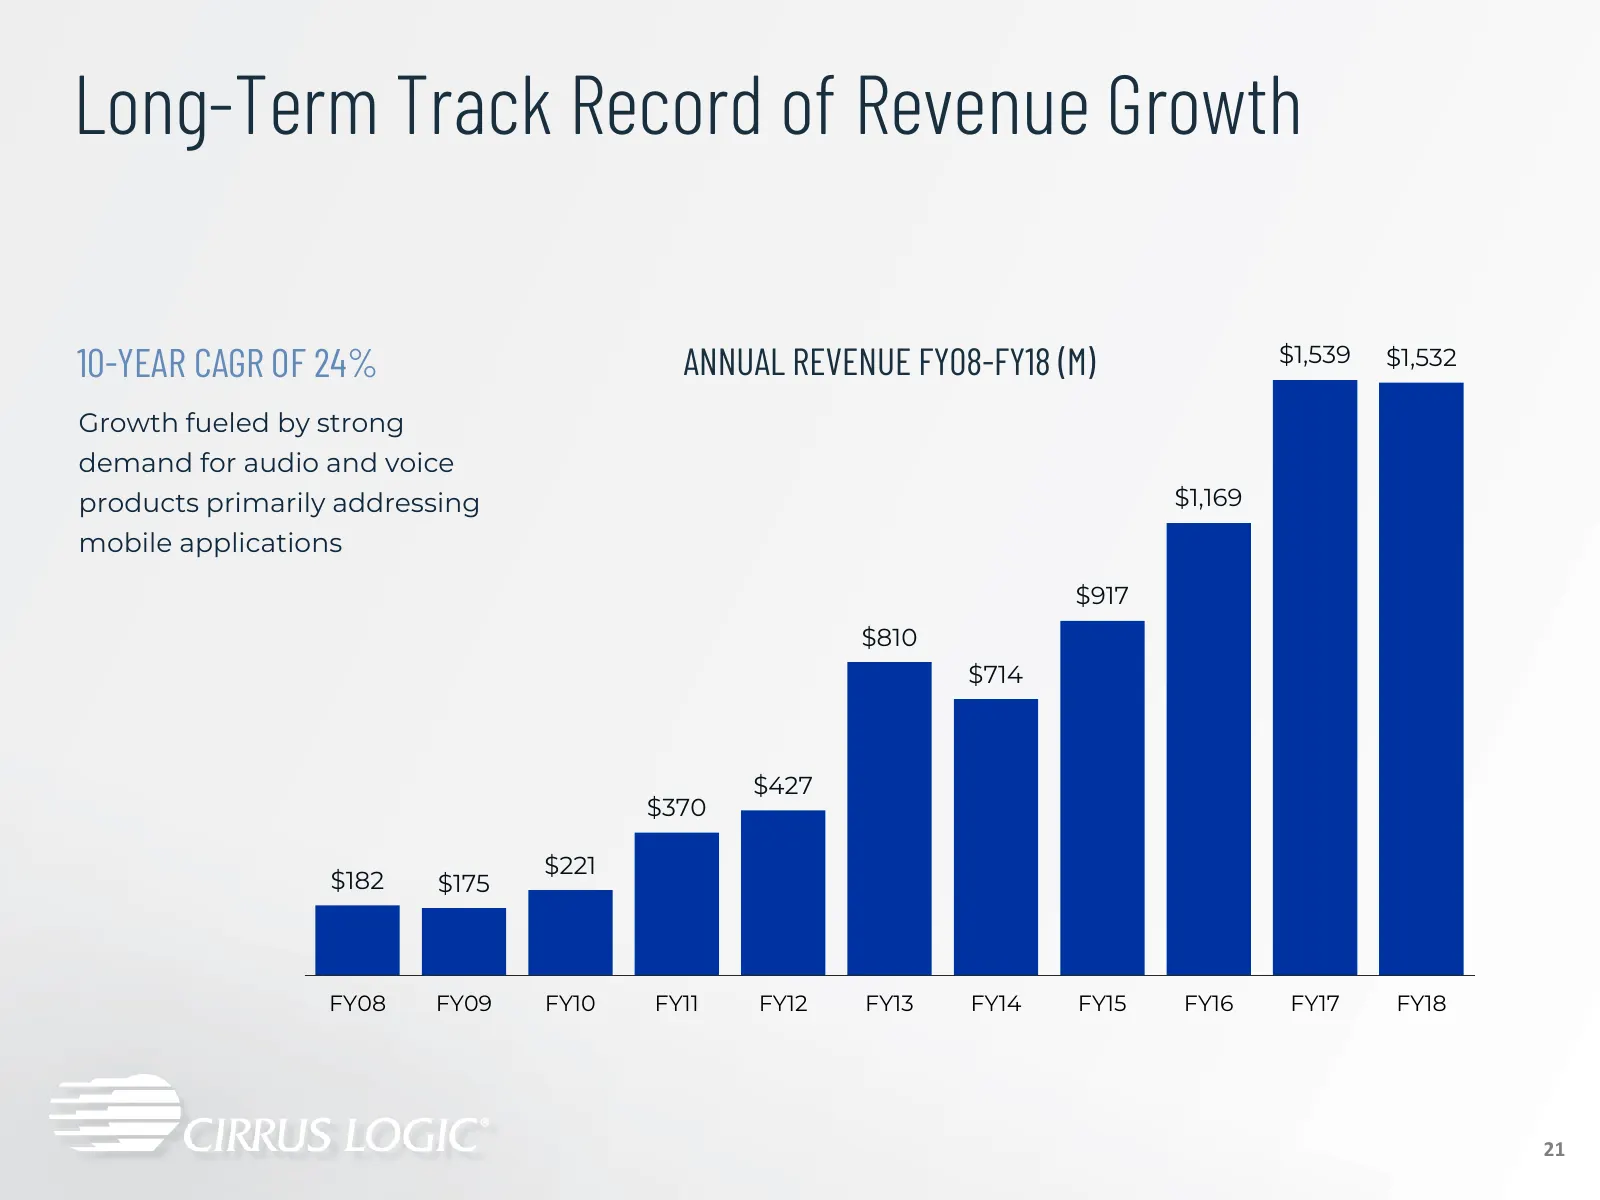
Slide 21: Long-Term Track Record of Revenue Growth
Long-Term Track Record of Revenue Growth 10-YEAR CAGR OF 24% ANNUAL REVENUE FY08-FY18 (M) $1,539 $1,532 Growth fueled by strong demand for audio and voice products primarily addressing $1,169 mobile applications $917 $810 $714 $427 $370 $221 $182 $175 FY08 FY09 FY10 FY11 FY12 FY13 FY14 FY15 FY16 FY1
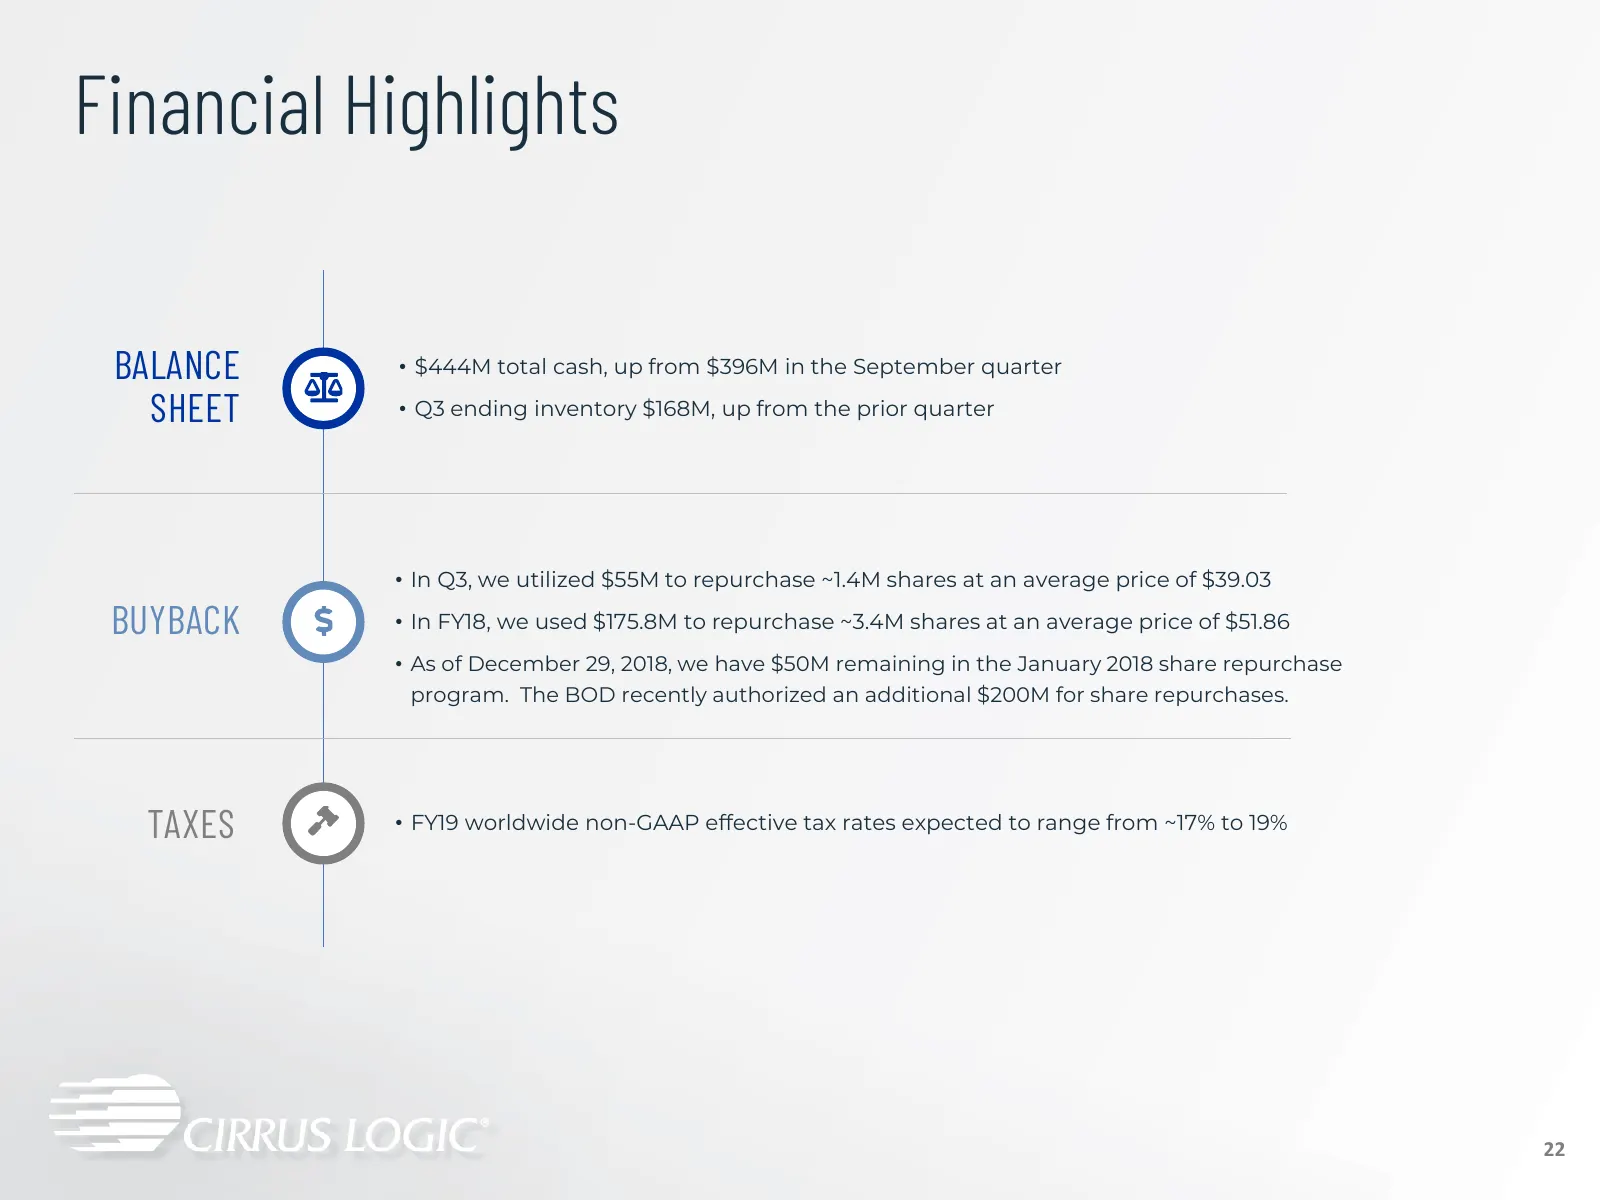
Slide 22: Financial Highlights
Financial Highlights BALANCE • $444M total cash, up from $396M in the September quarter SHEET • Q3 ending inventory $168M, up from the prior quarter • In Q3, we utilized $55M to repurchase ~1.4M shares at an average price of $39.03 BUYBACK • In FY18, we used $175.8M to repurchase ~3.4M shares at an
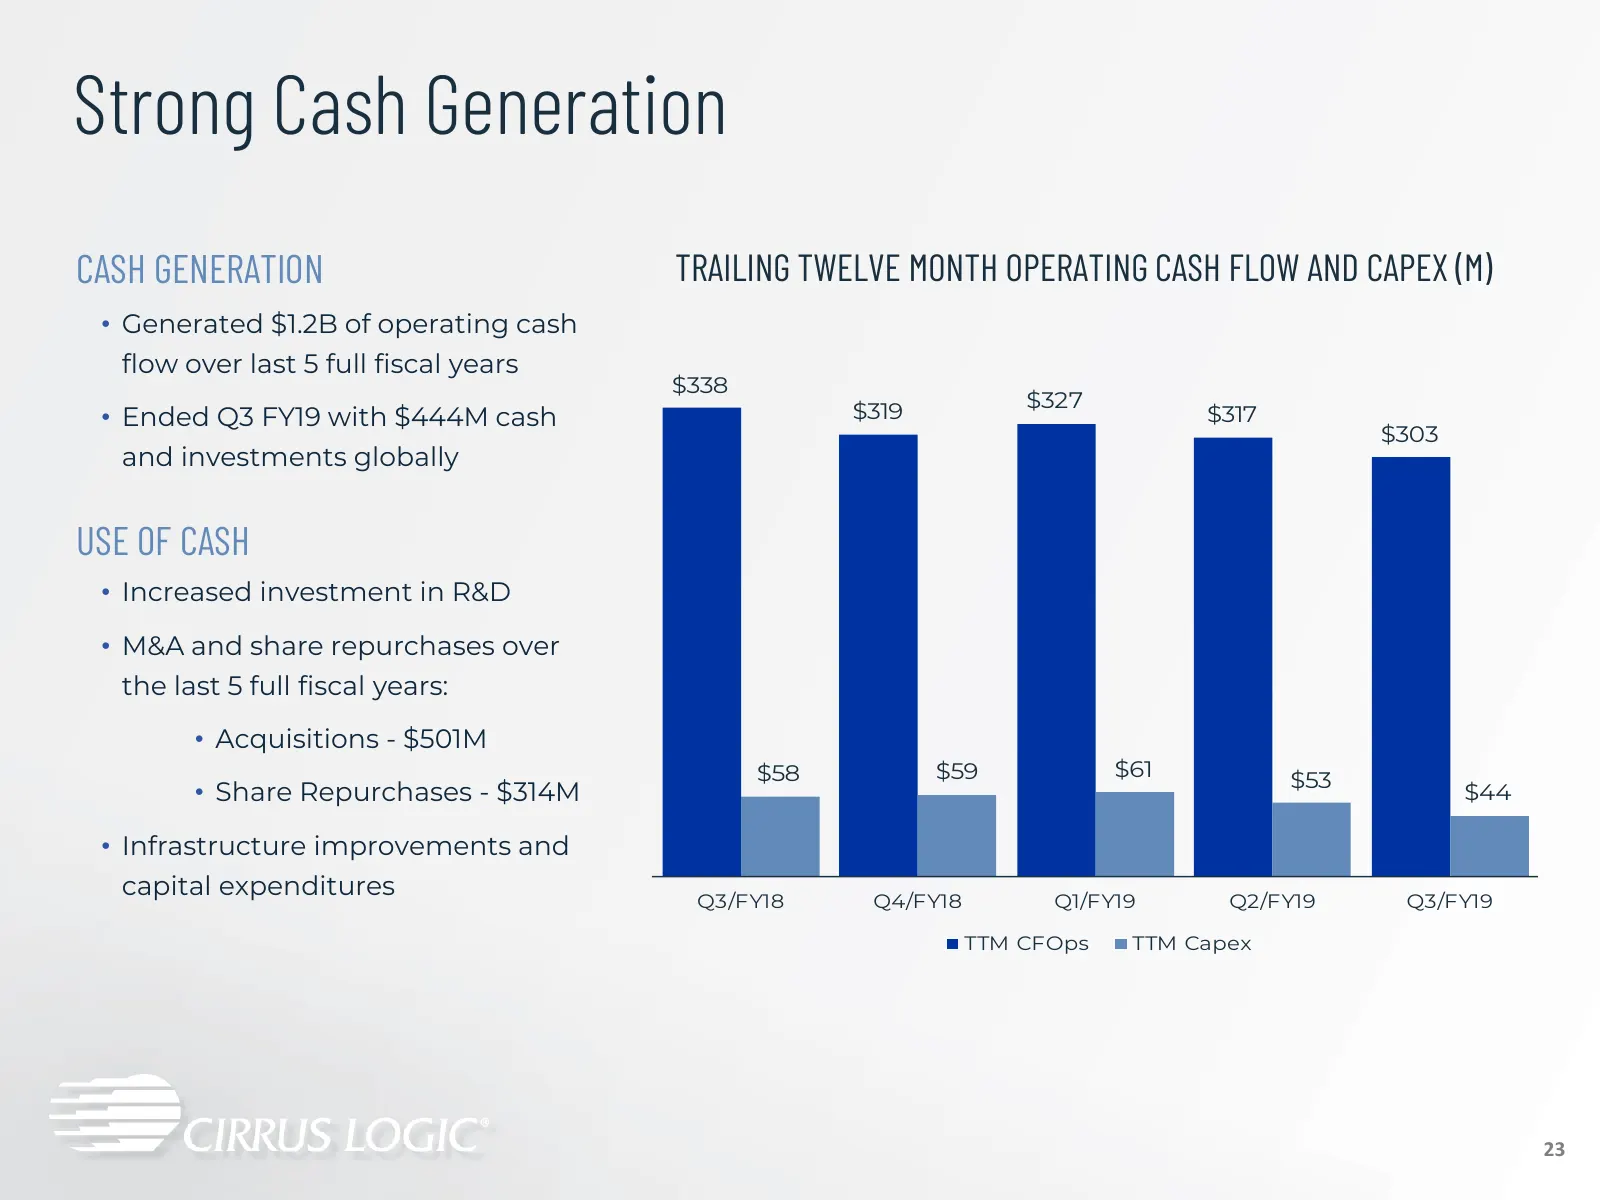
Slide 23: Strong Cash Generation
Strong Cash Generation CASH GENERATION TRAILING TWELVE MONTH OPERATING CASH FLOW AND CAPEX (M) • Generated $1.2B of operating cash flow over last 5 full fiscal years $338 $319 $327 • Ended Q3 FY19 with $444M cash $317 $303 and investments globally USE OF CASH • Increased investment in R&D • M&A and
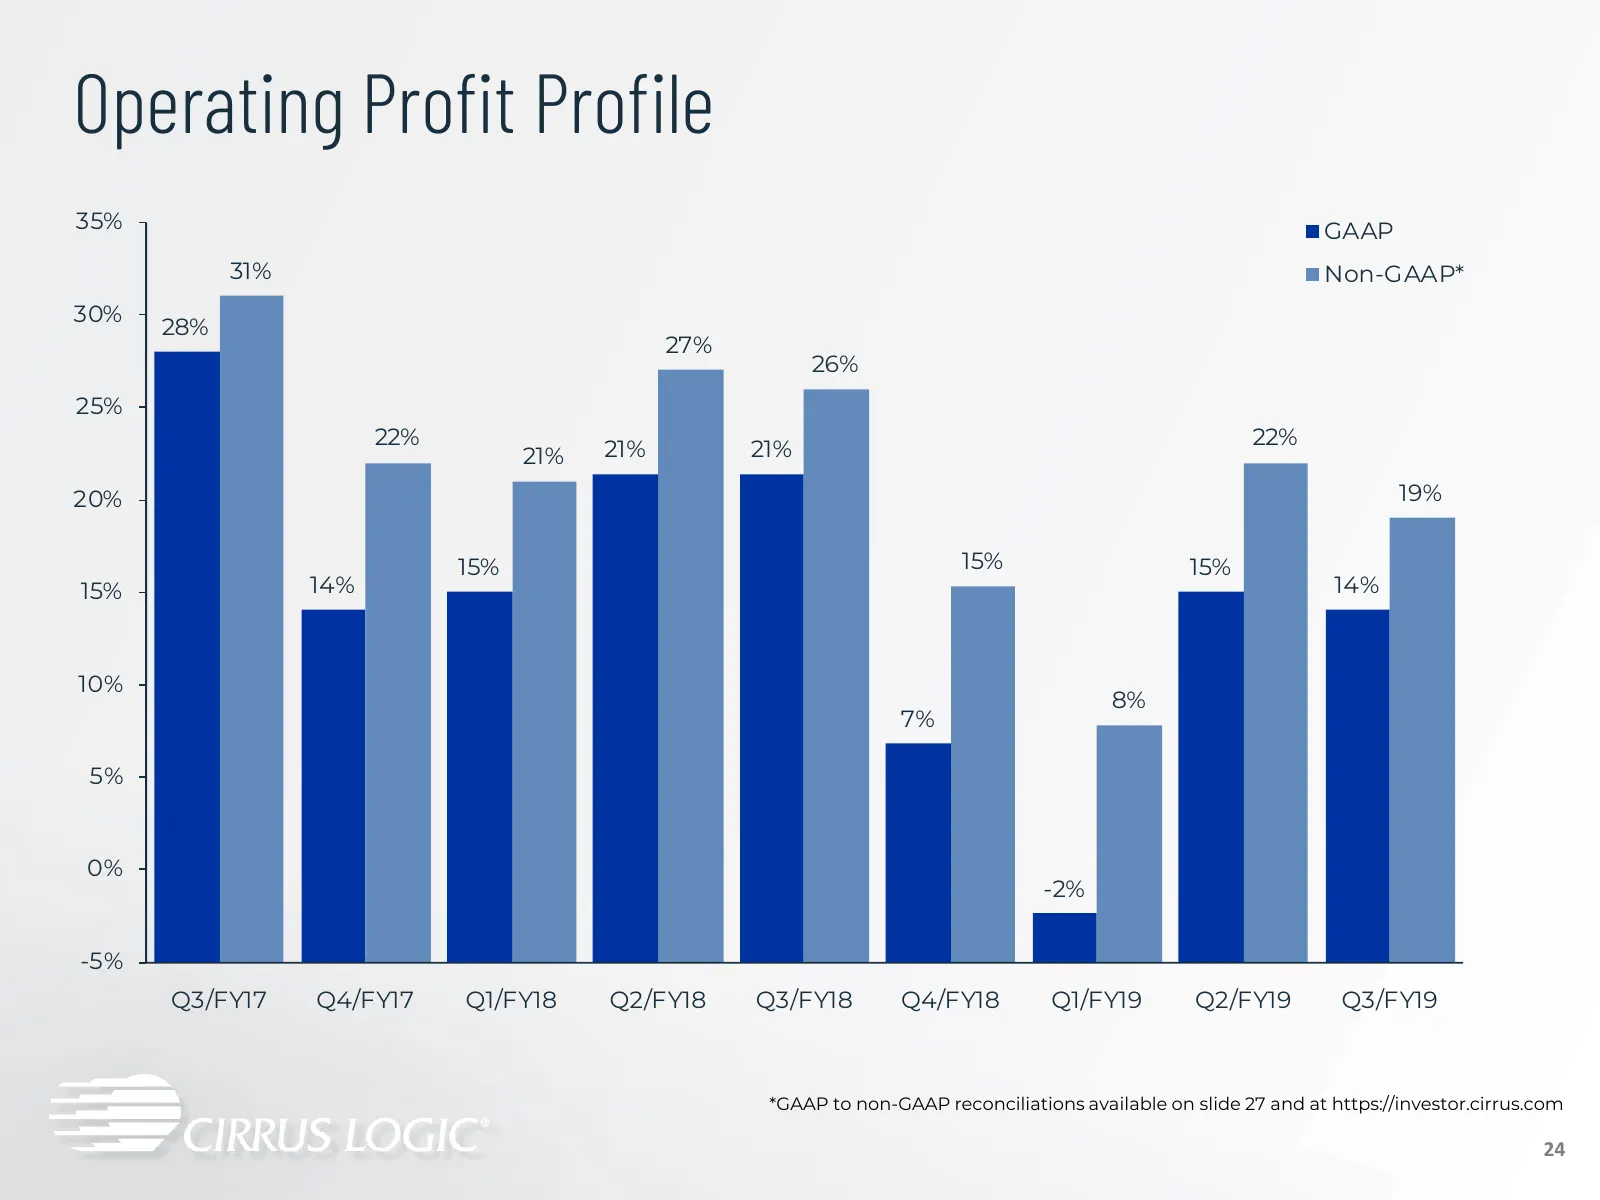
Slide 24: Operating Profit Profile
Operating Profit Profile 35% GAAP 31% Non-GAAP* 30% 28% 27% 26% 25% 22% 21% 21% 22% 21% 20% 19% 15% 15% 15% 15% 14% 14% 10% 8% 7% 5% 0% -2% -5% Q3/FY17 Q4/FY17 Q1/FY18 Q2/FY18 Q3/FY18 Q4/FY18 Q1/FY19 Q2/FY19 Q3/FY19 *GAAP to non-GAAP reconciliations available on slide 27 and at https://investor.cirr
Slide 25: Financial Results and Outlook
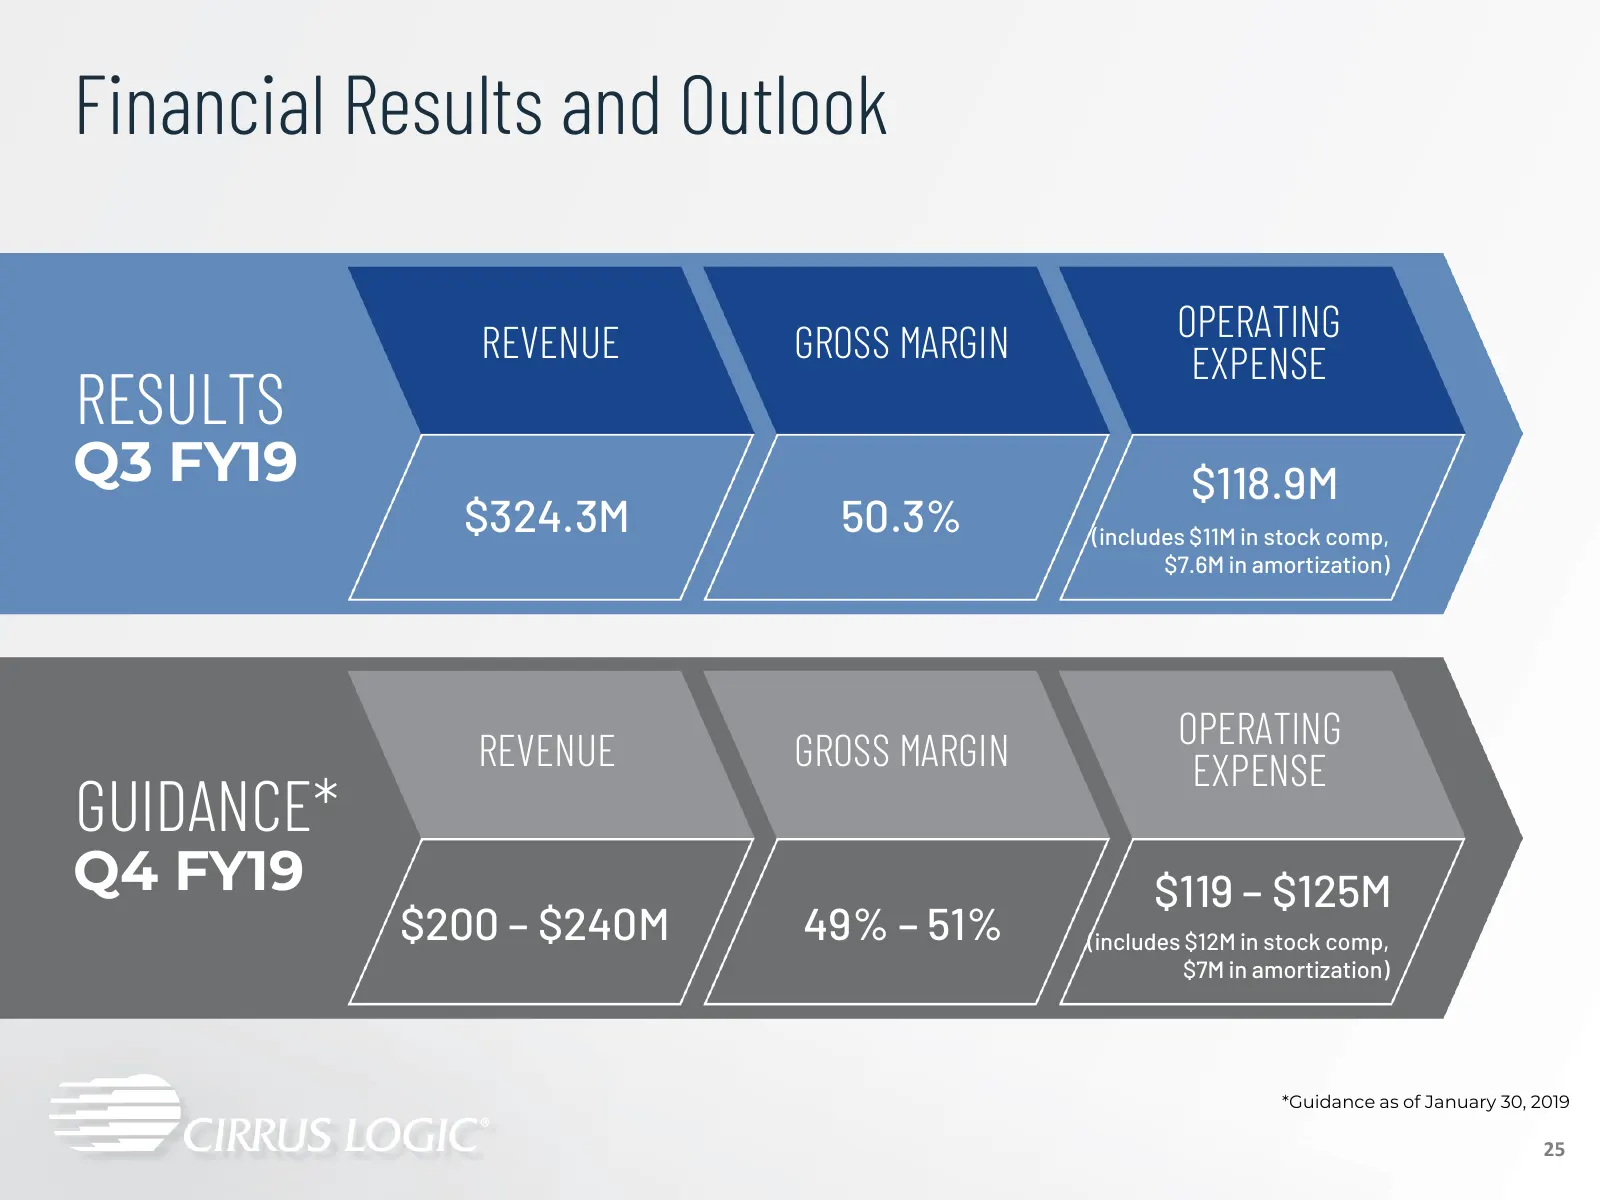
Financial Results and Outlook REVENUE GROSS MARGIN OPERATING EXPENSE RESULTS Q3 FY19 $118.9M $324.3M 50.3% (includes $11M in stock comp, $7.6M in amortization) REVENUE GROSS MARGIN OPERATING EXPENSE GUIDANCE* Q4 FY19 $119 – $125M $200 – $240M 49% – 51% (includes $12M in stock comp, $7M in amortizati
Slide 26: Quarterly Revenue and EPS
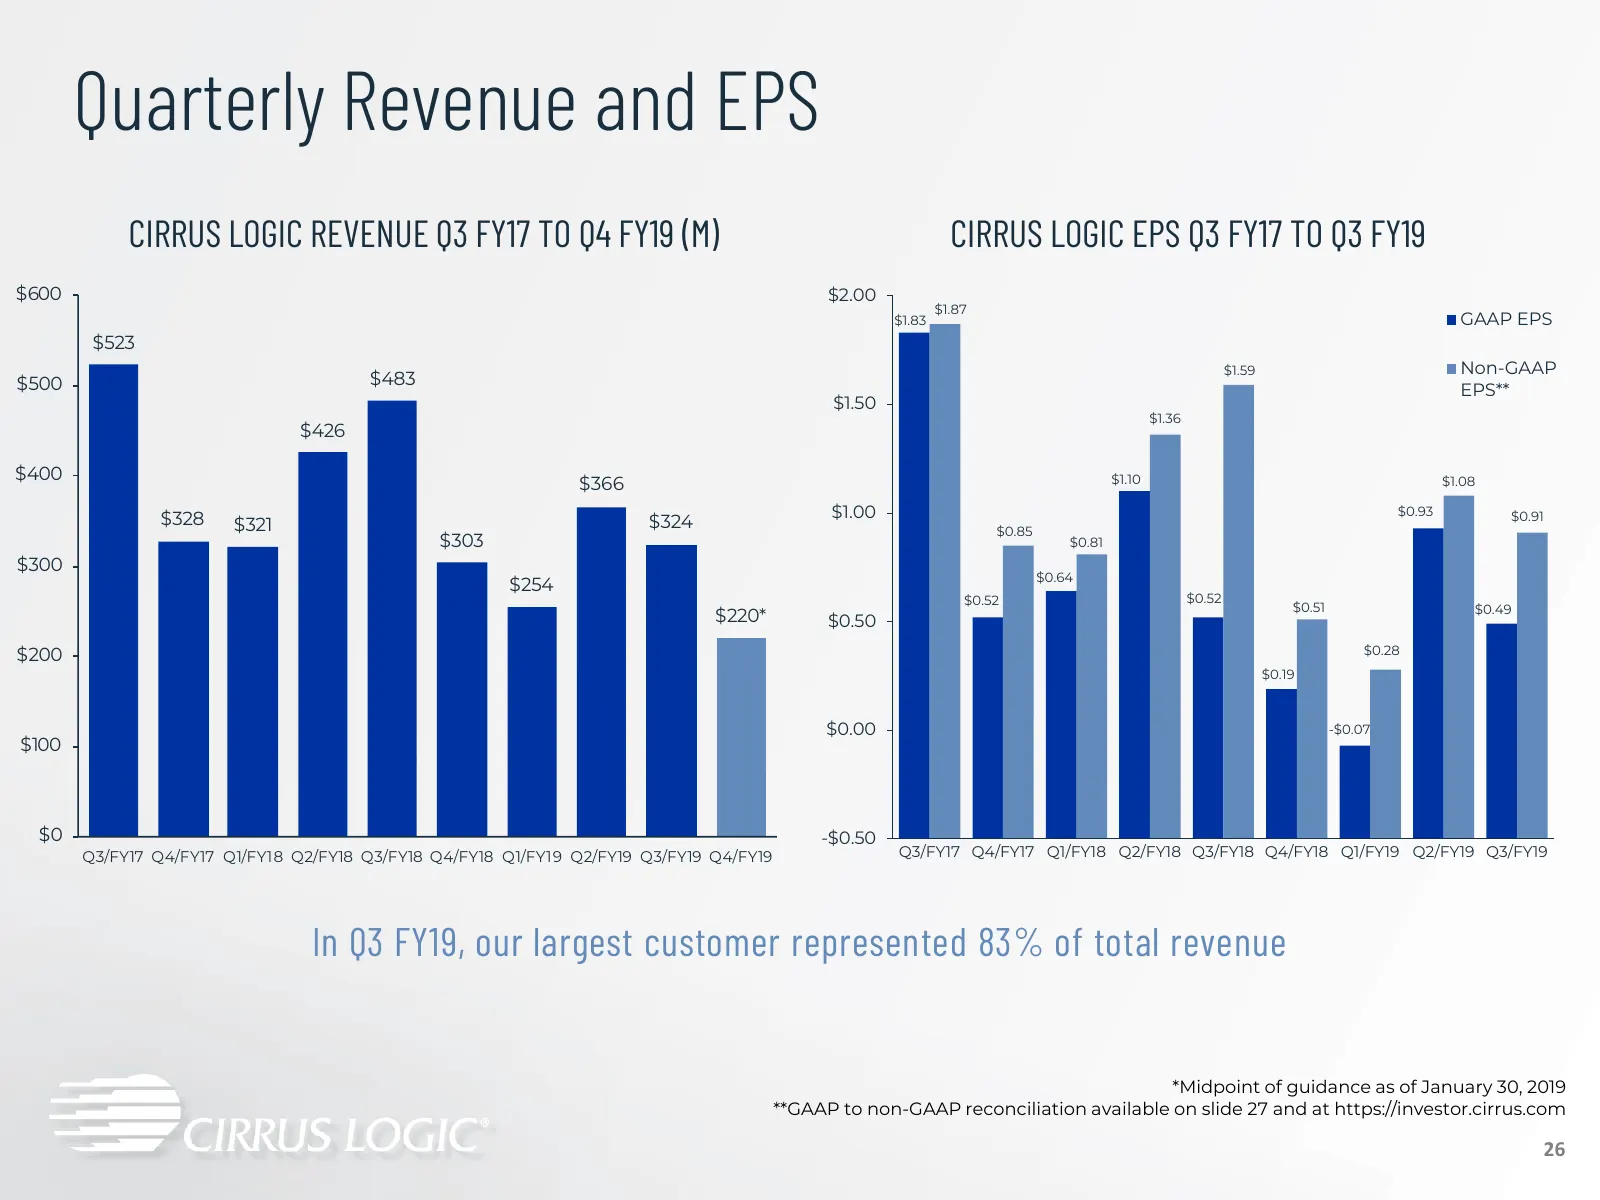
Quarterly Revenue and EPS CIRRUS LOGIC REVENUE Q3 FY17 TO Q4 FY19 (M) CIRRUS LOGIC EPS Q3 FY17 TO Q3 FY19 $600 $2.00 $1.87 $1.83 GAAP EPS $523 $1.59 Non-GAAP $500 $483 EPS** $1.50 $1.36 $426 $400 $1.10 $366 $1.08 $328 $1.00 $0.93 $0.91 $321 $324 $0.85 $303 $0.81 $300 $0.64 $254 $0.52 $0.52 $0.51 $0.
Slide 27: GAAP to Non-GAAP Reconciliation
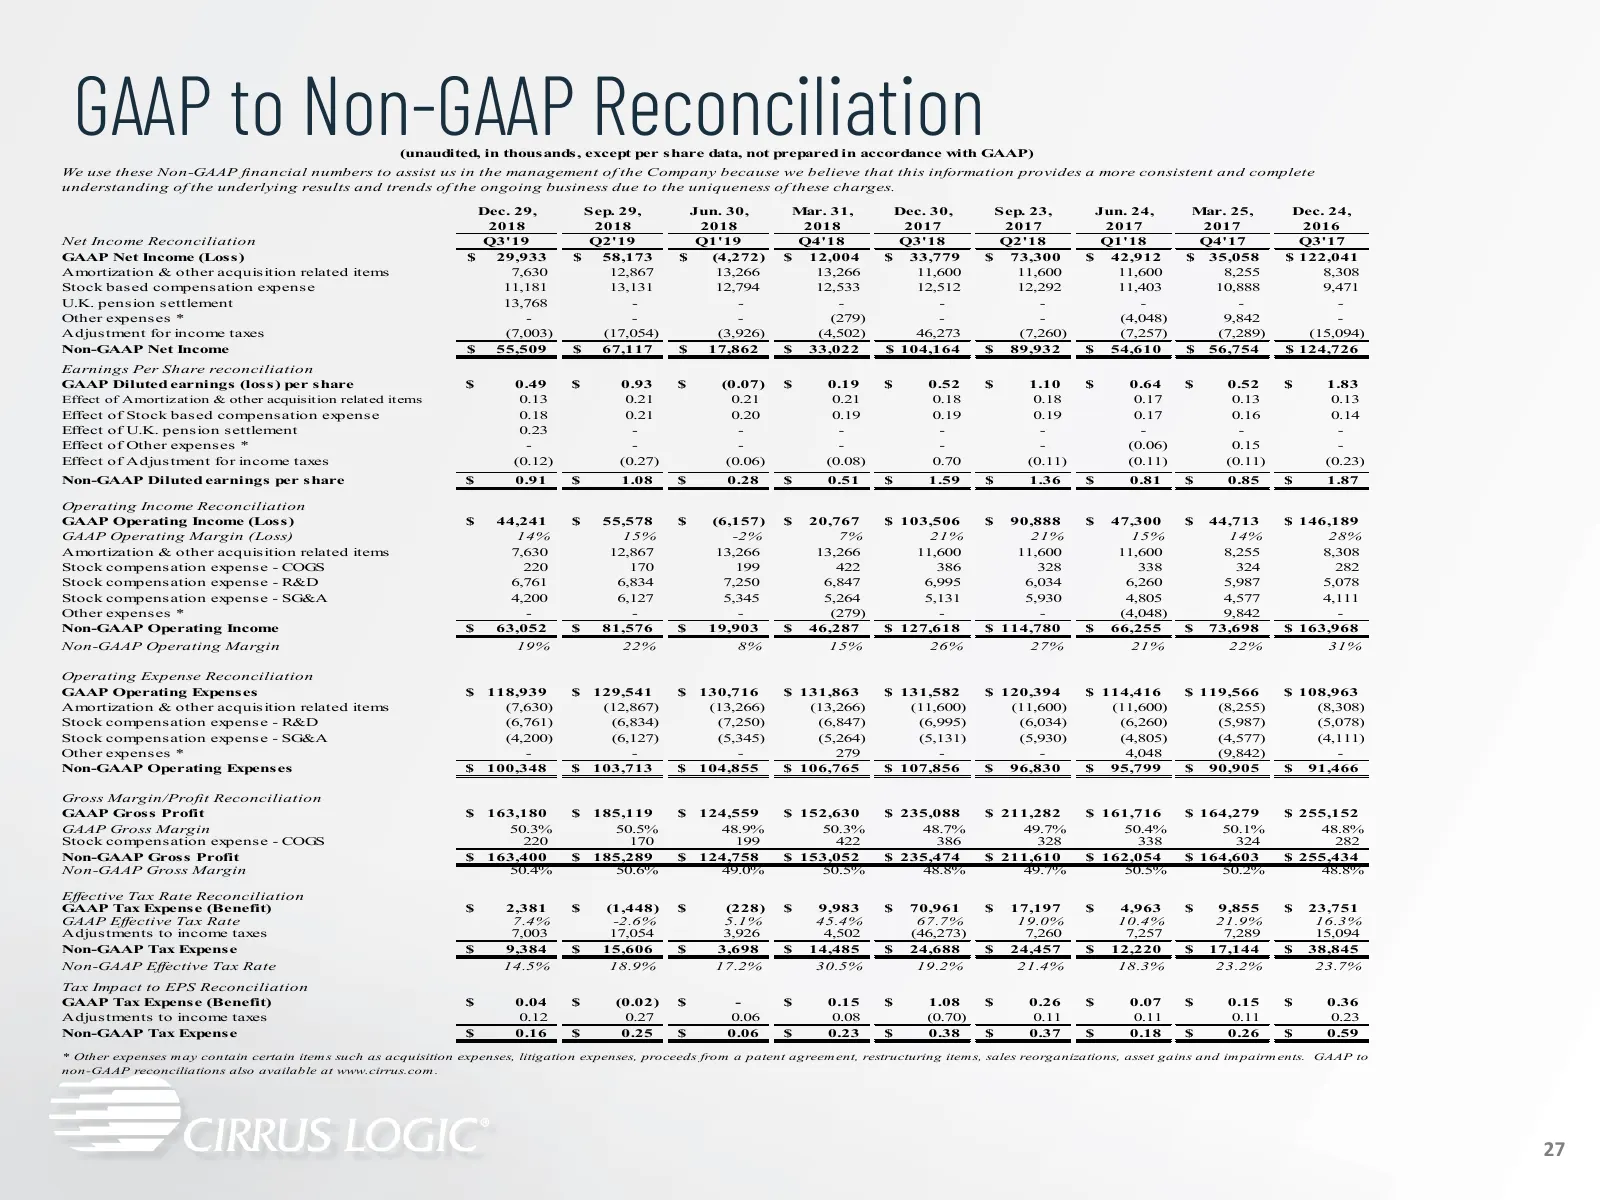
GAAP to Non-GAAP Reconciliation (unaudited, in thous ands , except per s hare data, not prepared in accordance with GAAP) We use these Non-GAAP financial numbers to assist us in the management of the Company because we believe that this information provides a more consistent and complete understandi

Slide 28: Cirrus Logic
CIRKUS LOGI Gs
Source: Internet Archive copy of s21.q4cdn.com
More decks from Cirrus Logic, Inc.
 Q1 2026 Earnings Presentation26 slides · Aug 5, 2026
 Q3 2026 Earnings Presentation25 slides · Feb 3, 2026
 Q1 FY2026 Earnings Presentation25 slides · Aug 5, 2025
 Q4 2025 Earnings Presentation27 slides · May 6, 2025
 Q2 FY25 Earnings Presentation26 slides · Nov 4, 2024
 Q1 FY25 Earnings Presentation26 slides · Aug 6, 2024