Velan Inc. · TSX:VLN
Velan — Q2 FY2023 Earnings Presentation
14 slides from Velan's earnings presentation, Oct 14, 2022

Slide 1: Q2-F2023 Investor Presentation
Q2-F2023 Investor Presentation October 14th, 2022
Slide 2: Disclaimer
Disclaimer The following investor presentation provides an analysis of the consolidated operating results and financial position of Velan Inc. (“the Company”) for the quarter ended August 31, 2022. This investor presentation should be read in conjunction with the Company’s audited consolidated finan
Slide 3: Presenters
Presenters Thank you for your attendance to our Q2 FY23 Financial Results Investor Call. We will be happy to take questions at the end of the presentation. Bruno Carbonaro Rishi Sharma CEO and President Chief Financial Officer +1 438 817-7593 +1 438 817-4430 bruno.carbonaro@velan.com rishi.sharma@ve
Slide 4: Our markets
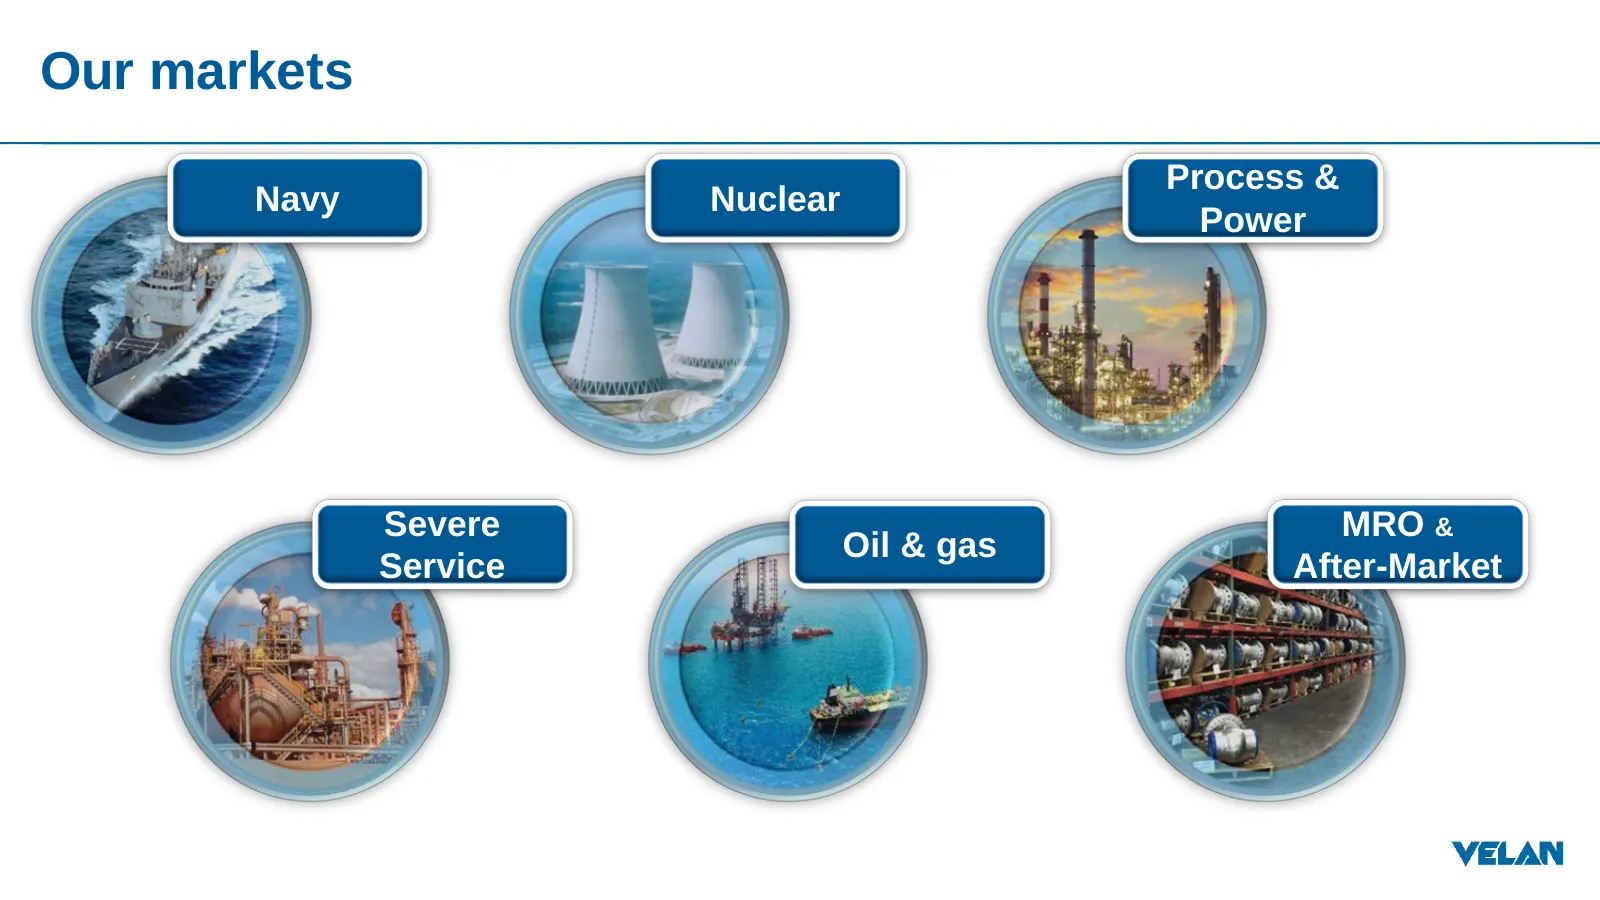
Our markets Process & Navy Nuclear Power Severe MRO & Oil & gas Service After-Market
Slide 5: Our Board of directors
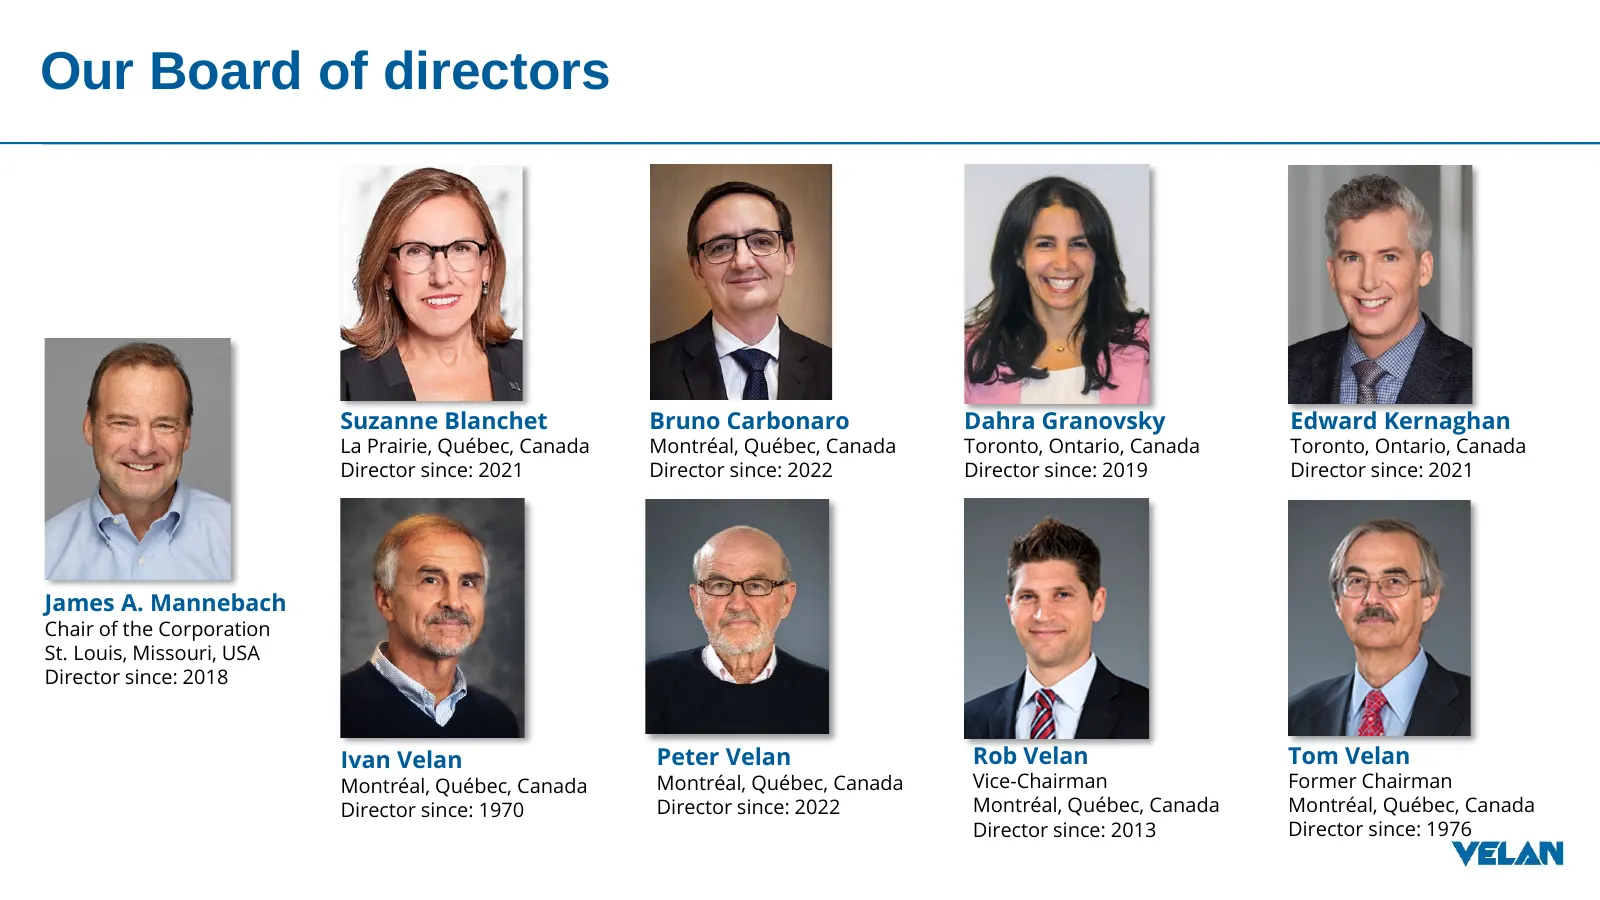
Our Board of directors Suzanne Blanchet Bruno Carbonaro Dahra Granovsky Edward Kernaghan La Prairie, Québec, Canada Montréal, Québec, Canada Toronto, Ontario, Canada Toronto, Ontario, Canada Director since: 2021 Director since: 2022 Director since: 2019 Director since: 2021 James A. Mannebach Chair
Slide 6: Key Highlights – Q2
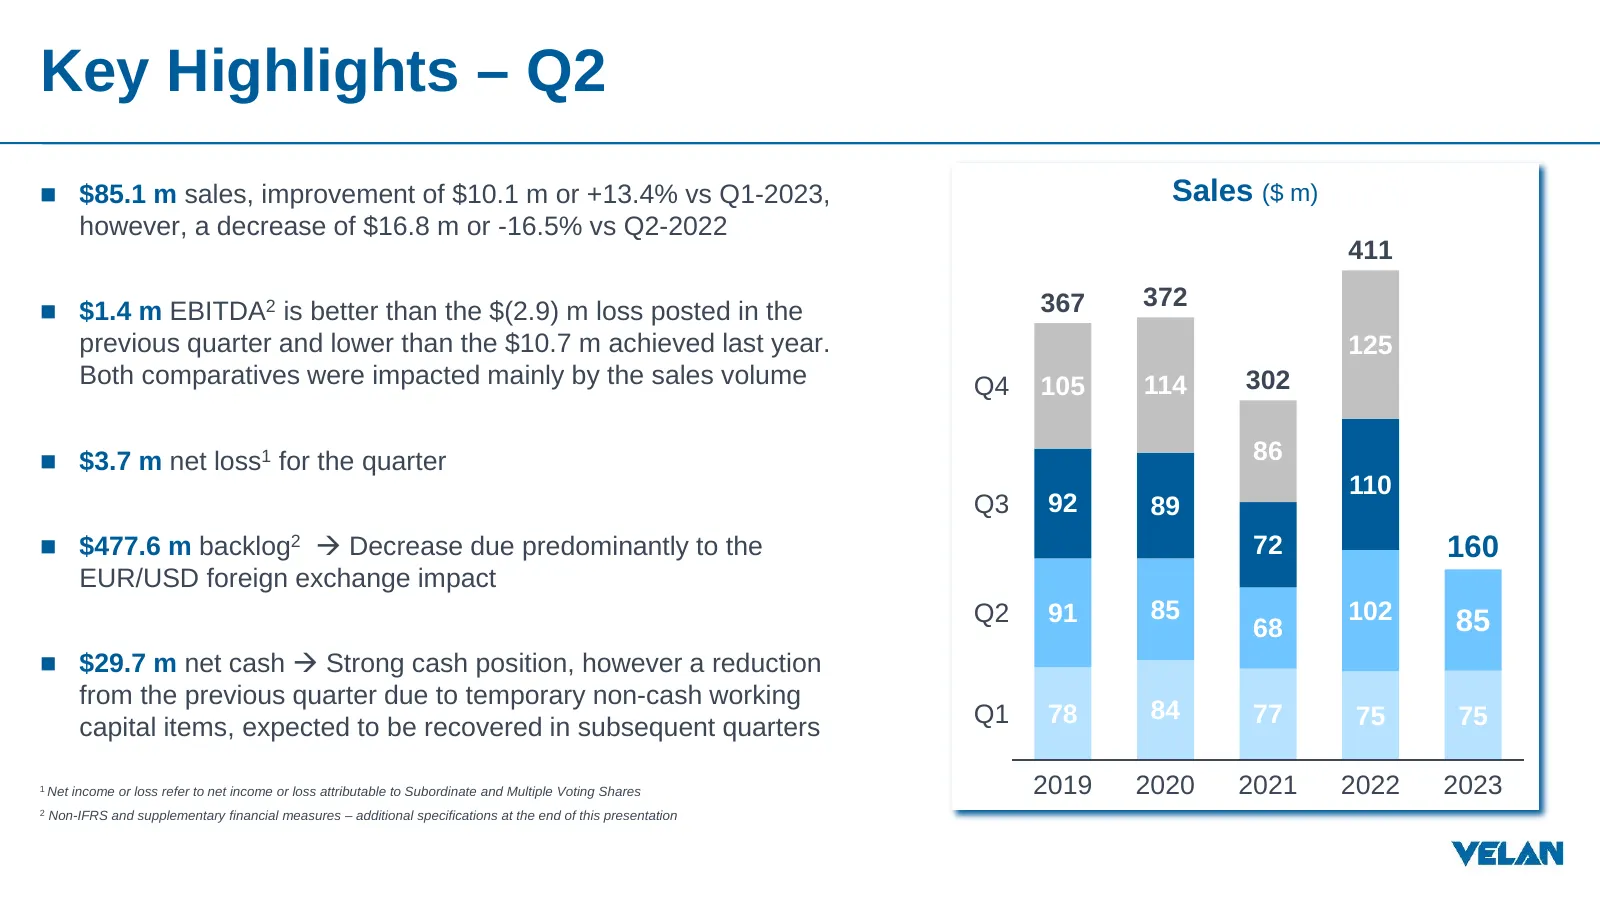
Key Highlights – Q2 $85.1 m sales, improvement of $10.1 m or +13.4% vs Q1-2023, Sales ($ m) however, a decrease of $16.8 m or -16.5% vs Q2-2022 411 367 372 $1.4 m EBITDA2 is better than the $(2.9) m loss posted in the previous quarter and lower than the $10.7 m achieved last year. 125 Both compa
Slide 7: Backlog
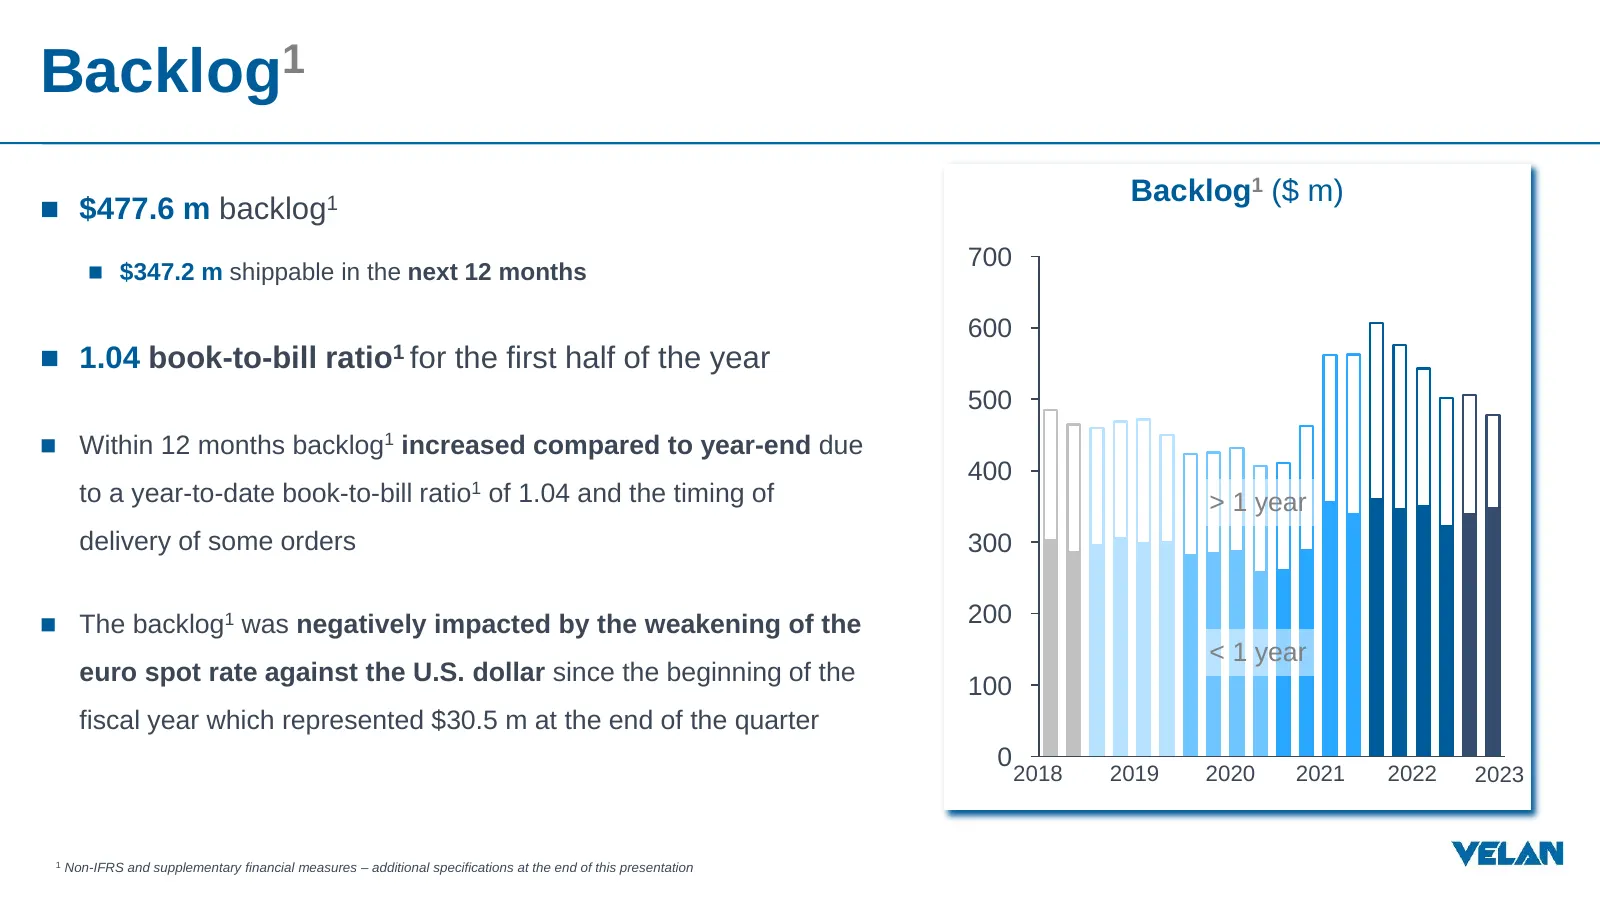
Backlog1 Backlog1 ($ m) $477.6 m backlog1 700 $347.2 m shippable in the next 12 months 600 1.04 book-to-bill ratio1 for the first half of the year 500 Within 12 months backlog1 increased compared to year-end due 400 to a year-to-date book-to-bill ratio1 of 1.04 and the timing of > 1 year del
Slide 8: Sales – Decrease in sales in the quarter primarily related to our Italian operations
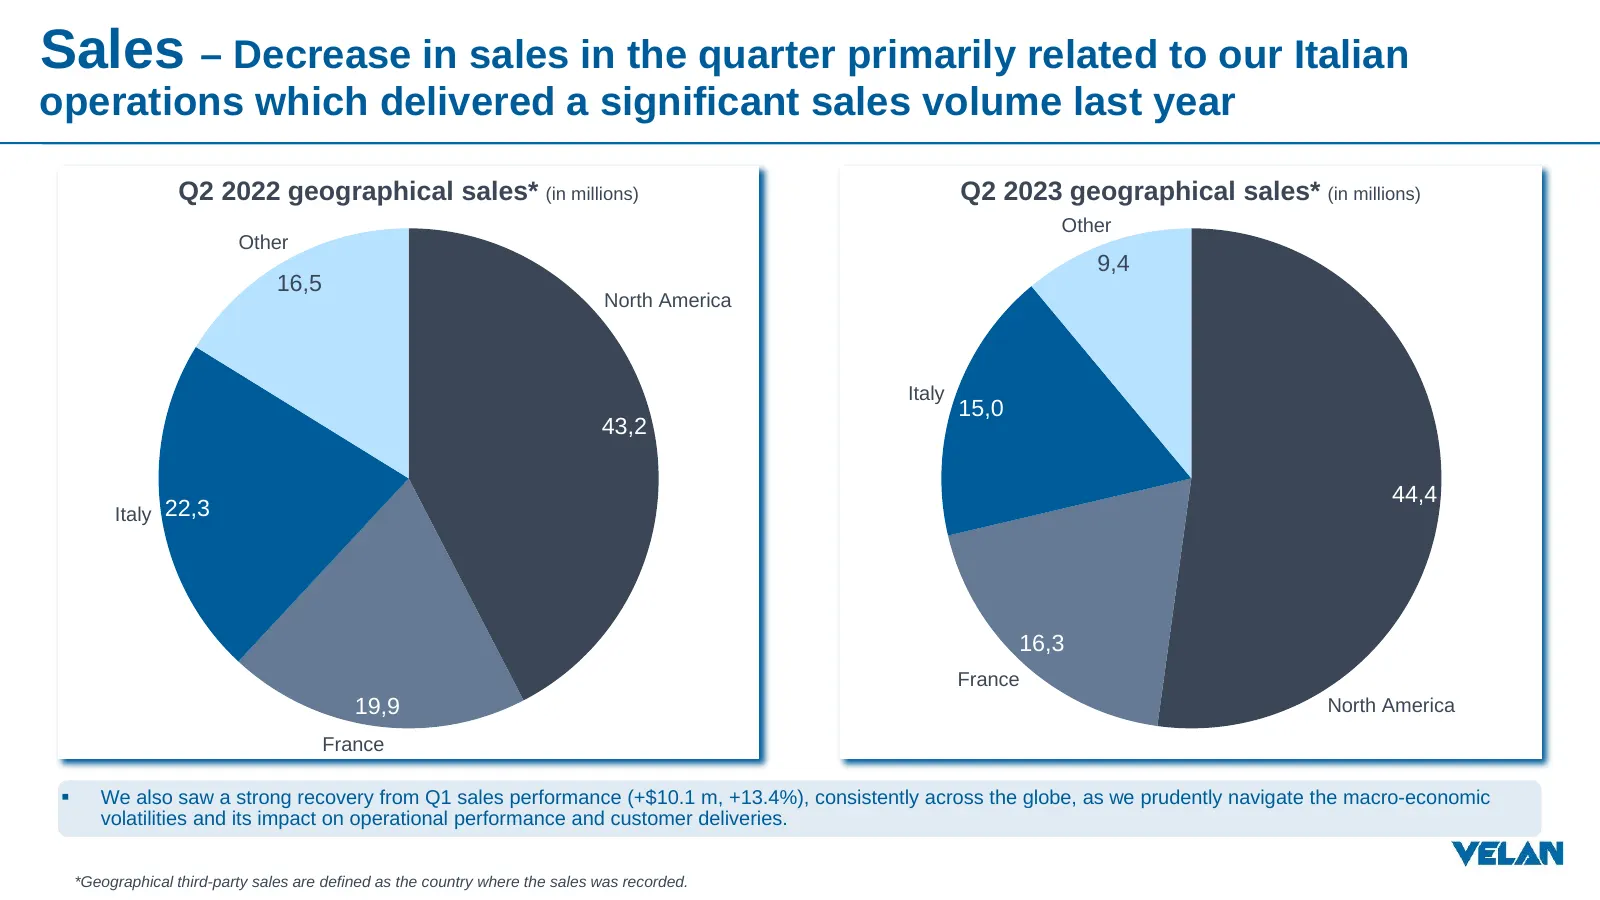
Sales – Decrease in sales in the quarter primarily related to our Italian operations which delivered a significant sales volume last year Q2 2022 geographical sales* (in millions) Q2 2023 geographical sales* (in millions) Other Other 9,4 16,5 North America Italy 15,0 43,2 44,4 Italy 22,3 16,3 France
Slide 9: EBITDA evolution
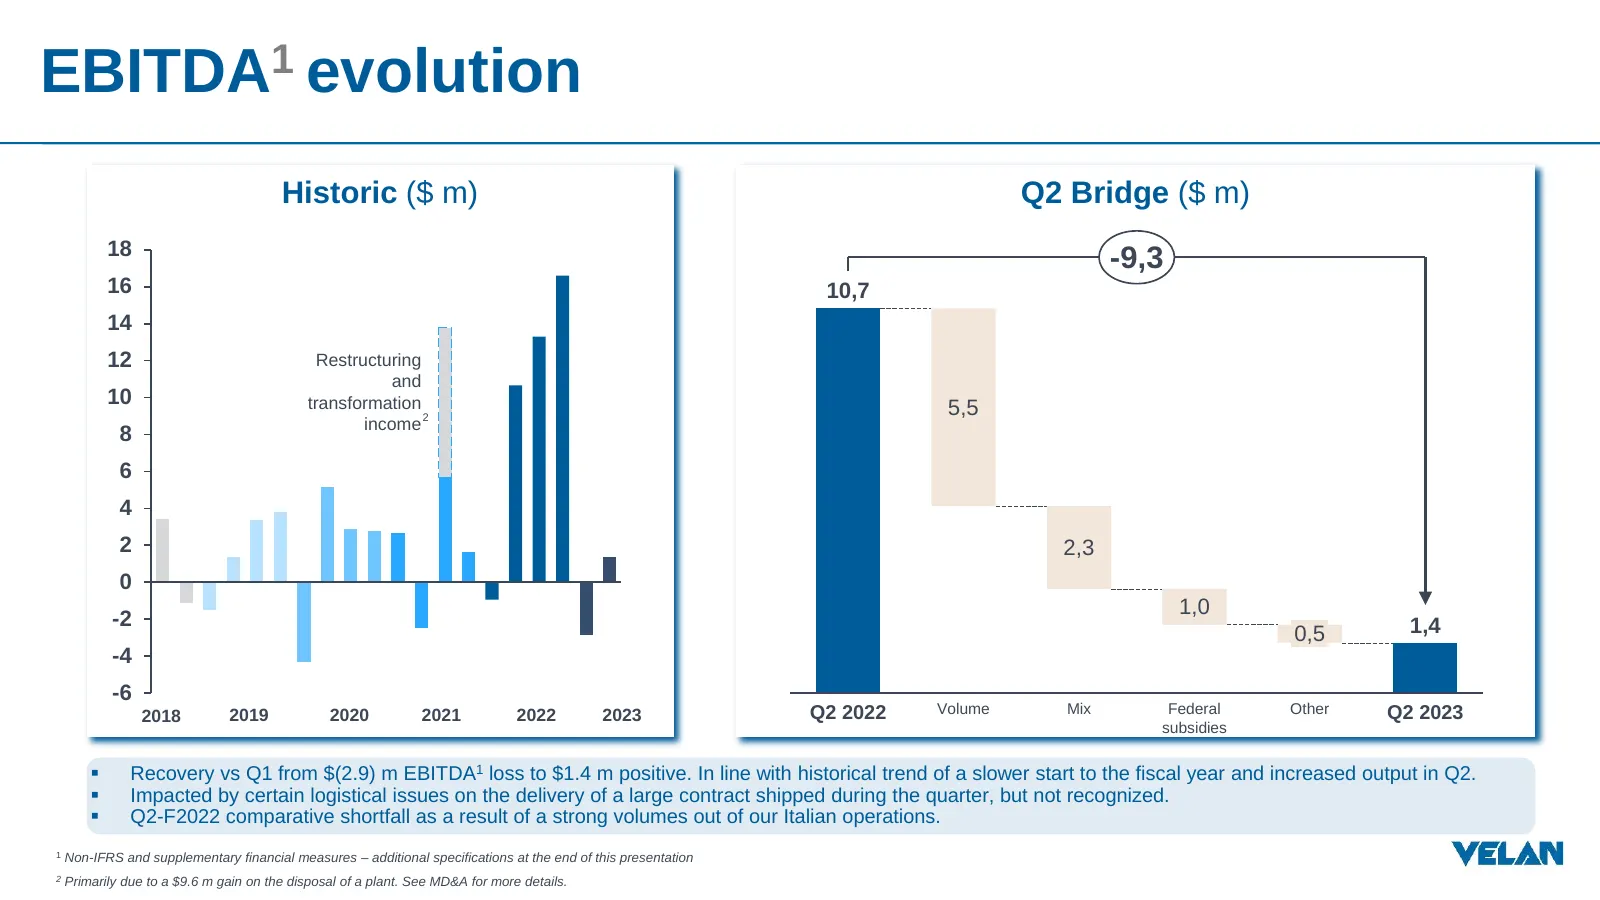
EBITDA1 evolution Historic ($ m) Q2 Bridge ($ m) 18 -9,3 16 10,7 14 12 Restructuring and 10 transformation 5,5 2 income 8 6 4 2 2,3 0 1,0 -2 1,4 0,5 -4 -6 2018 2019 2020 2021 2022 2023 Q2 2022 Volume Mix Federal Other Q2 2023 subsidies Recovery vs Q1 from $(2.9) m EBITDA1 loss to $1.4 m positive.
Slide 10: Net cash analysis
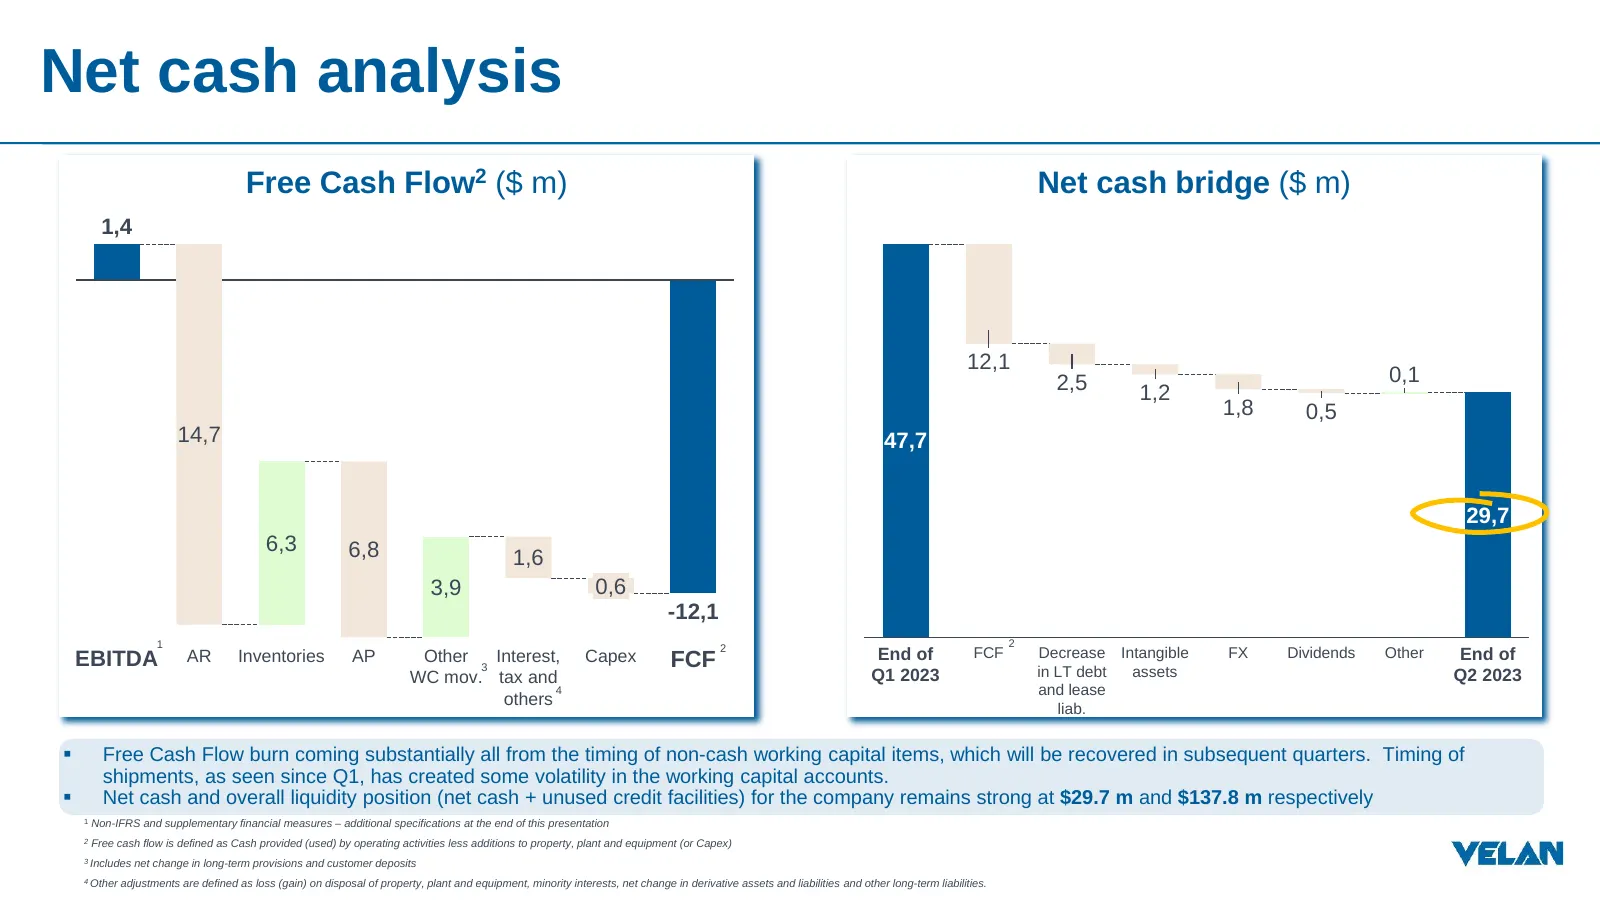
Net cash analysis Free Cash Flow2 ($ m) Net cash bridge ($ m) 1,4 12,1 2,5 0,1 1,2 1,8 0,5 14,7 47,7 29,7 6,3 6,8 1,6 3,9 0,6 -12,1 1 2 2 AR Inventories AP Other 3 Interest, Capex End of FCF Decrease Intangible FX Dividends Other End of EBITDA FCF in LT debt assets WC mov. tax and Q1 2023 Q2 2023 4
Slide 11: Closing Comments FY23 Q2
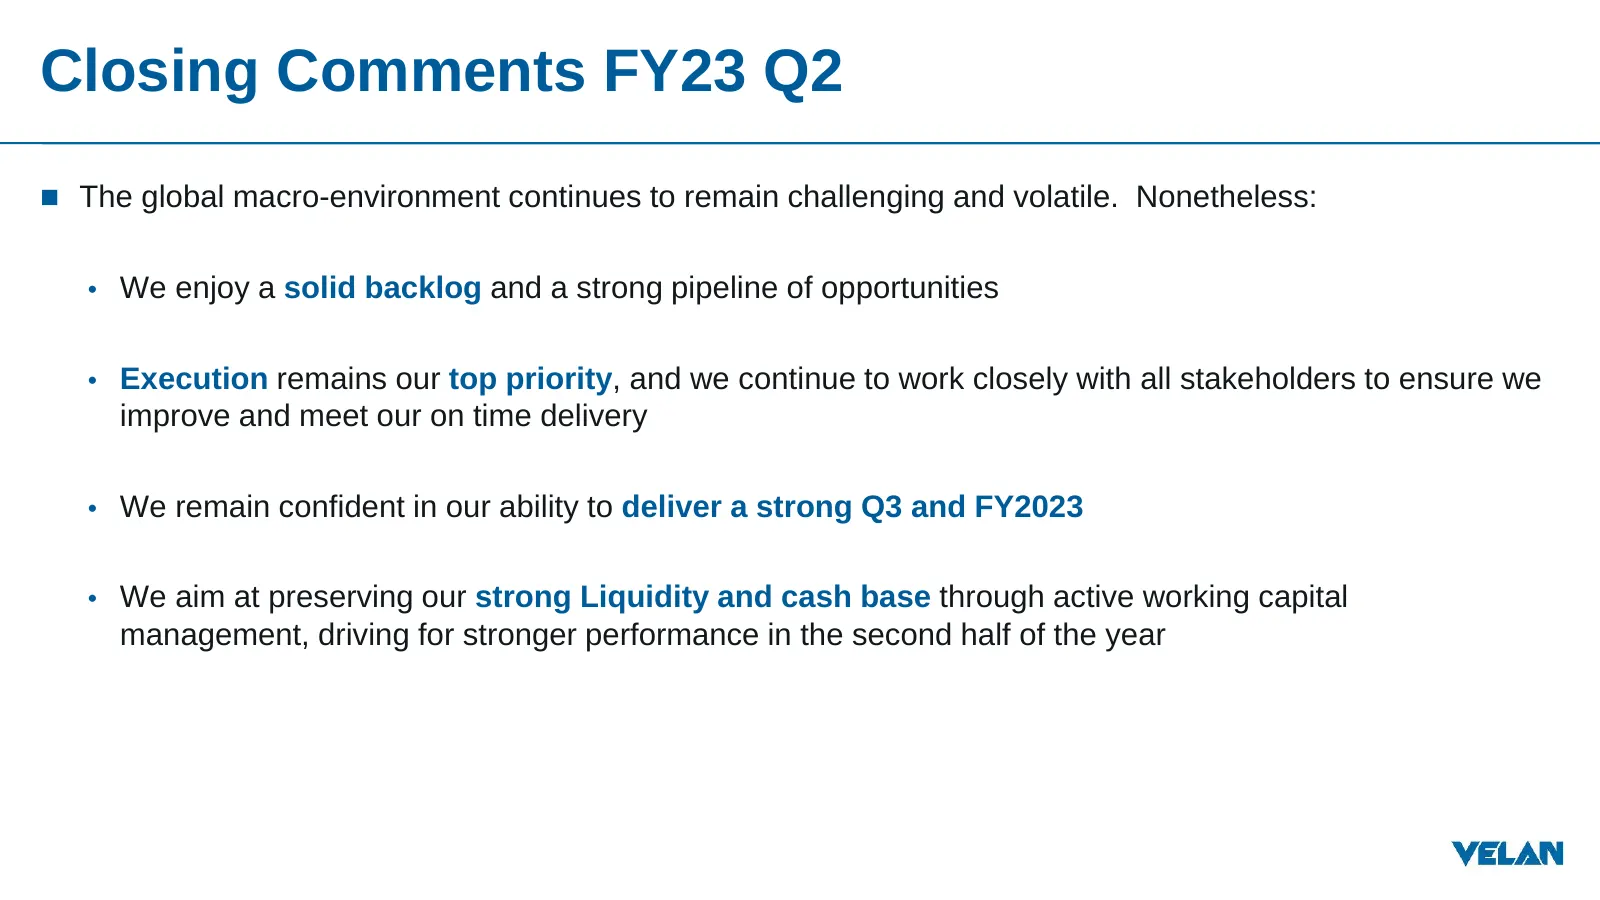
Closing Comments FY23 Q2 The global macro-environment continues to remain challenging and volatile. Nonetheless: • We enjoy a solid backlog and a strong pipeline of opportunities • Execution remains our top priority, and we continue to work closely with all stakeholders to ensure we improve and me
Slide 12: Presenters
Presenters Thank you for your attendance to our Q2 FY23 Financial Results Investor Call. We are happy to answer any questions. Bruno Carbonaro Rishi Sharma CEO and President Chief Financial Officer +1 438 817-7593 +1 438 817-4430 bruno.carbonaro@velan.com rishi.sharma@velan.com www.velan.com www.fac
Slide 13: Non-IFRS and Supplementary Financial Measures
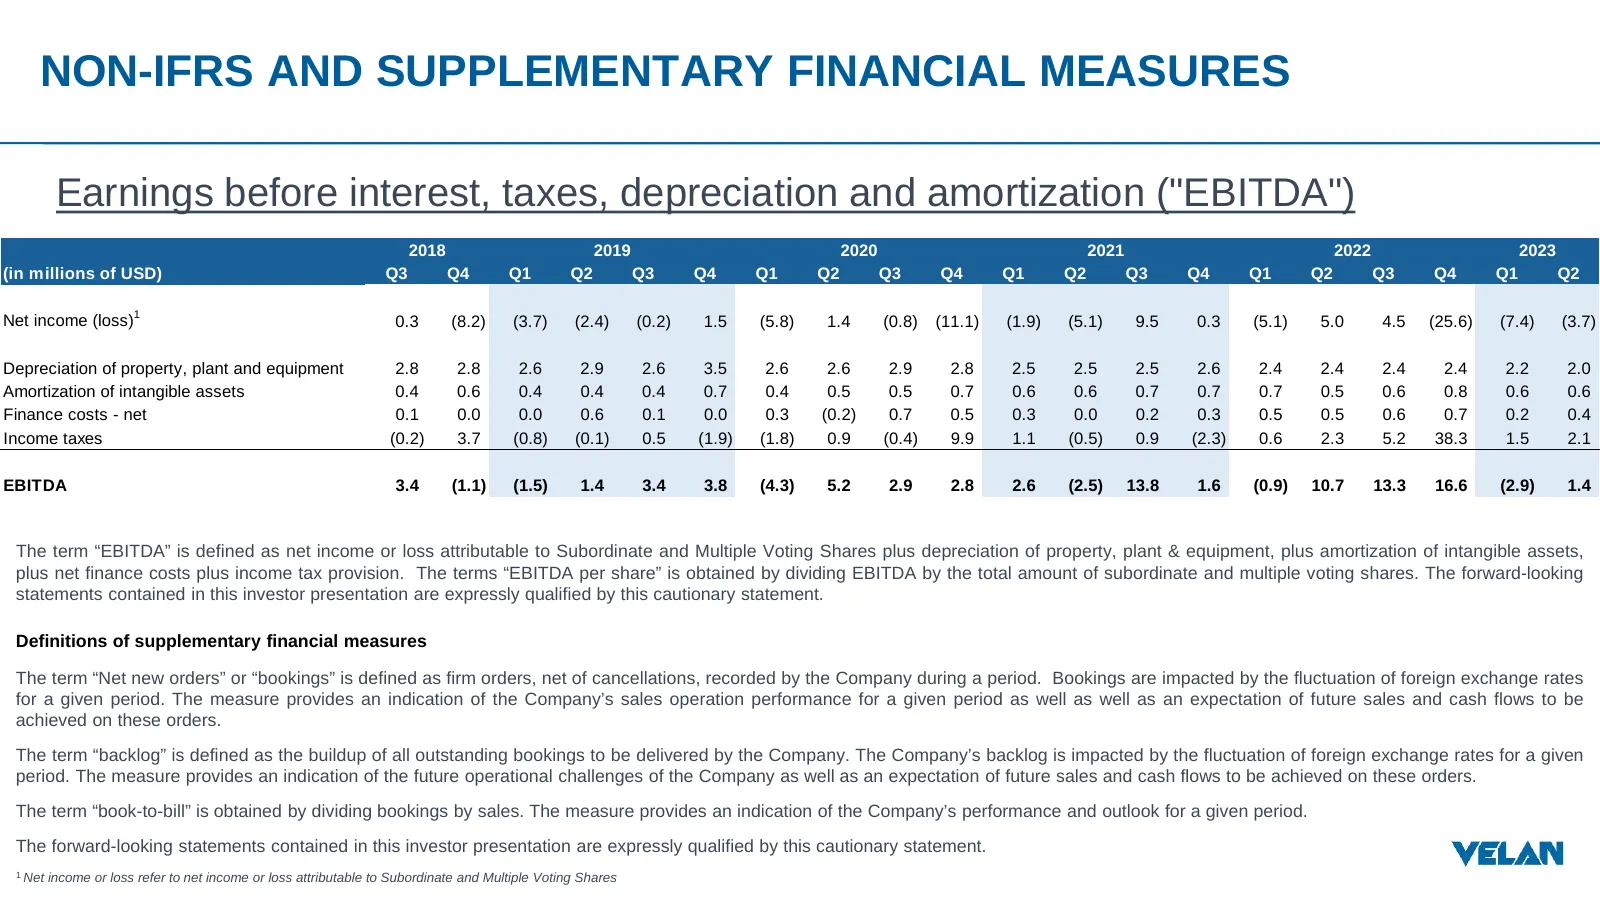
NON-IFRS AND SUPPLEMENTARY FINANCIAL MEASURES Earnings before interest, taxes, depreciation and amortization ("EBITDA") 2018 2019 2020 2021 2022 2023 (in millions of USD) Q3 Q4 Q1 Q2 Q3 Q4 Q1 Q2 Q3 Q4 Q1 Q2 Q3 Q4 Q1 Q2 Q3 Q4 Q1 Q2 Net income (loss)1 0.3 (8.2) (3.7) (2.4) (0.2) 1.5 (5.8) 1.4 (0.8) (1

Slide 14: Q2-F2023 Investor Presentation
Q2-F2023 Investor Presentation October 14th, 2022
Source: Internet Archive copy of velan.com
More decks from Velan Inc.
 Q2 FY2027 Earnings Presentation14 slides · Oct 8, 2026
 Q1 FY2027 Earnings Presentation17 slides · Jul 10, 2026
 Q1 2027 Earnings Presentation17 slides · Jul 10, 2026
 Q4 FY2026 Earnings Presentation17 slides · May 15, 2026
 Q3 FY2026 Earnings Presentation16 slides · Jan 15, 2026
 Q3 2026 Earnings Presentation16 slides · Jan 15, 2026