McBride plc · LSE:MCB
McBride — FY2007-08 Earnings Presentation
25 slides from McBride's earnings presentation, September 2008
Slide 1: McBride plc 2007-08 full year results presentation
McBride plc 2007-08 full year results presentation September 2008
Slide 2: Summary
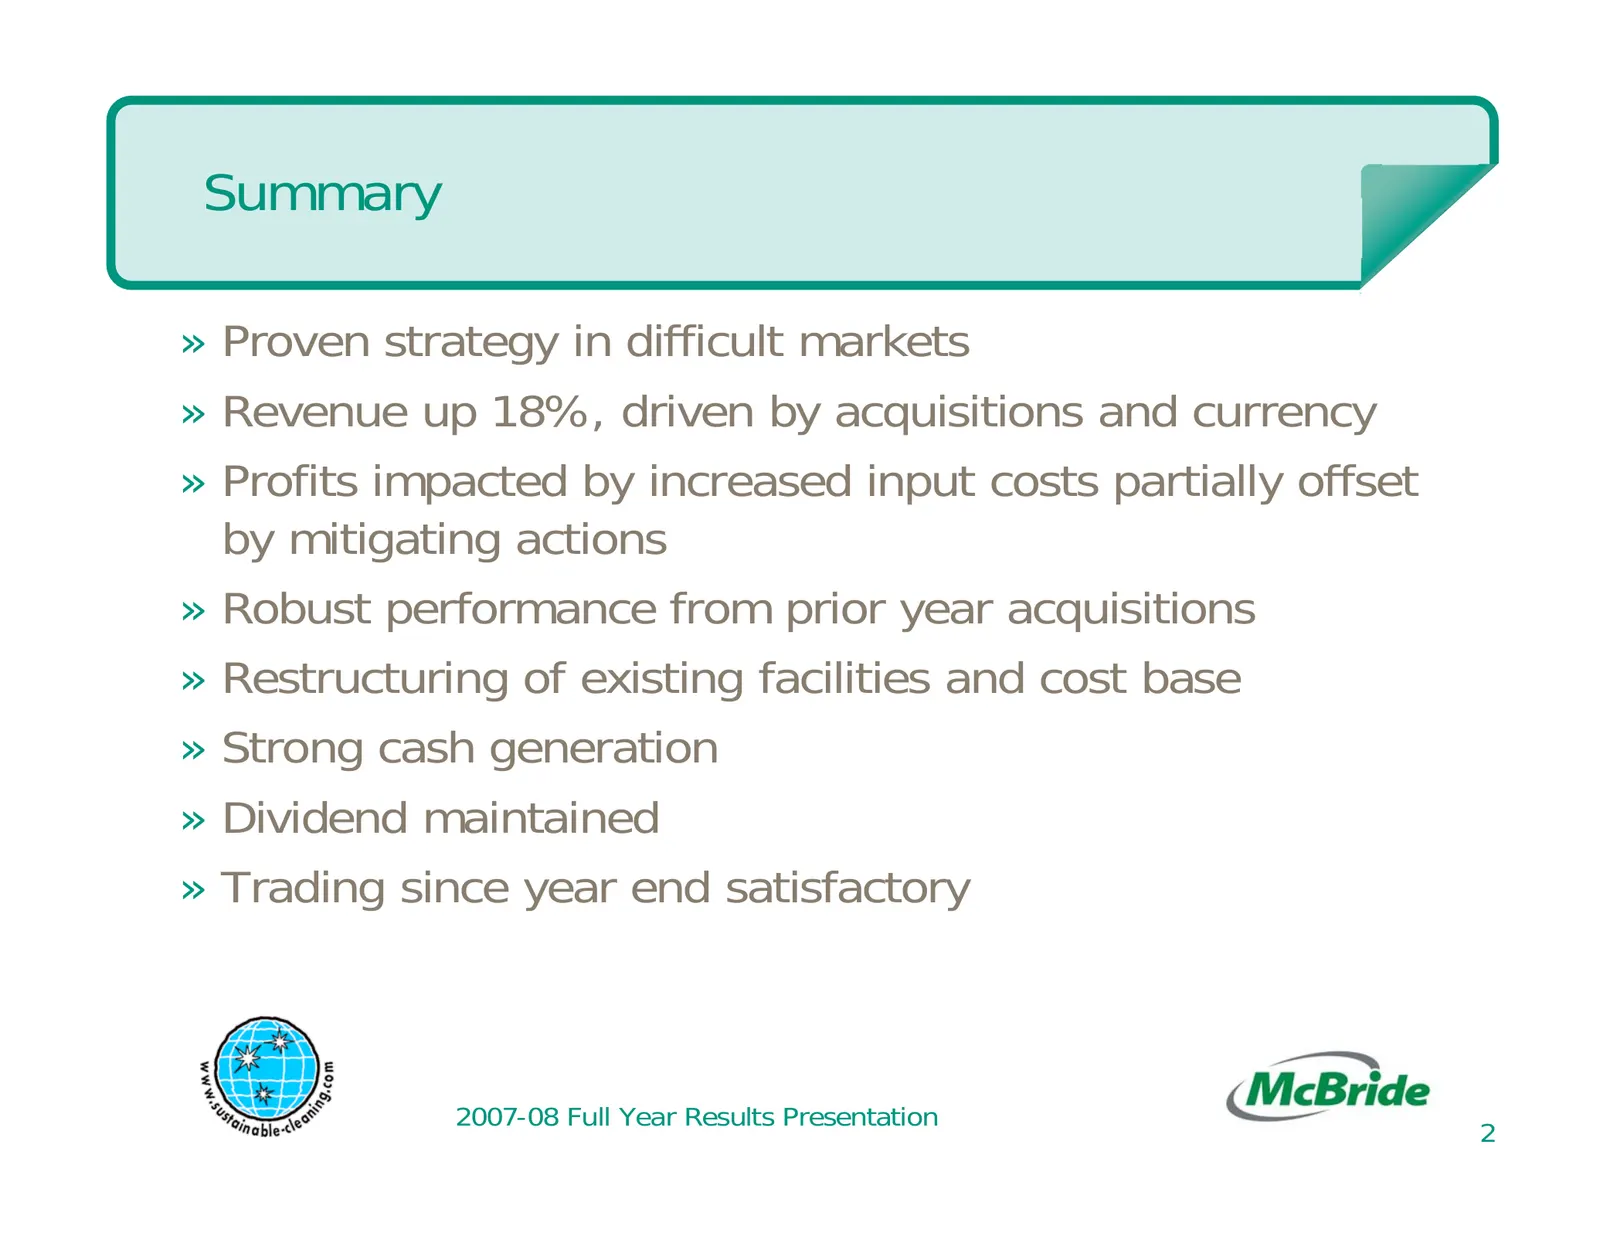
Summary » Proven strategy in difficult markets » Revenue up 18%, driven by acquisitions and currency » Profits impacted by increased input costs partially offset by mitigating actions » Robust performance from prior year acquisitions » Restructuring of existing facilities and cost base » Strong cash

Slide 3: Financial review
Financial review
Slide 4: Financial headlines
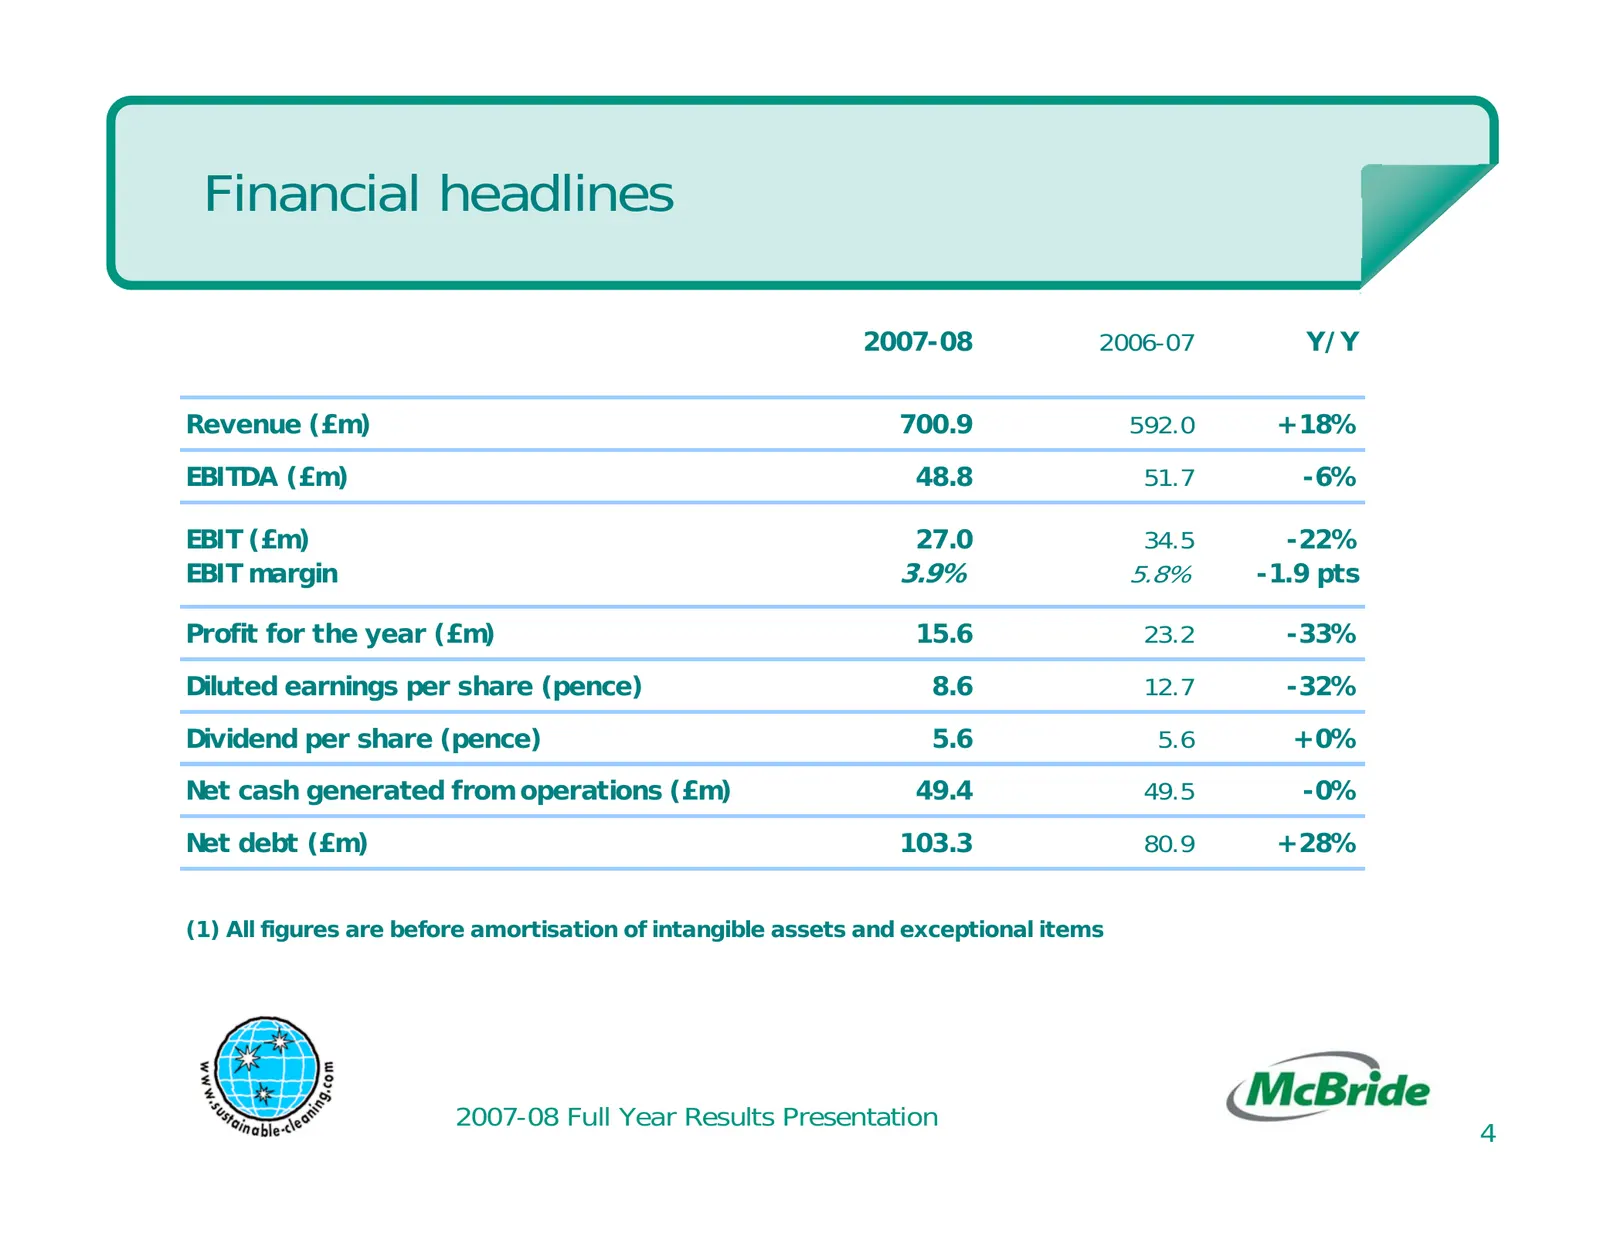
Financial headlines 2007-08 2006-07 Y/Y Revenue (£m) 700.9 592.0 +18% EBITDA (£m) 48.8 51.7 -6% EBIT (£m) 27.0 34.5 -22% EBIT margin 3.9% 5.8% -1.9 pts Profit for the year (£m) 15.6 23.2 -33% Diluted earnings per share (pence) 8.6 12.7 -32% Dividend per share (pence) 5.6 5.6 +0% Net cash generated f
Slide 5: Revenue bridge 2006-07 to 2007-08
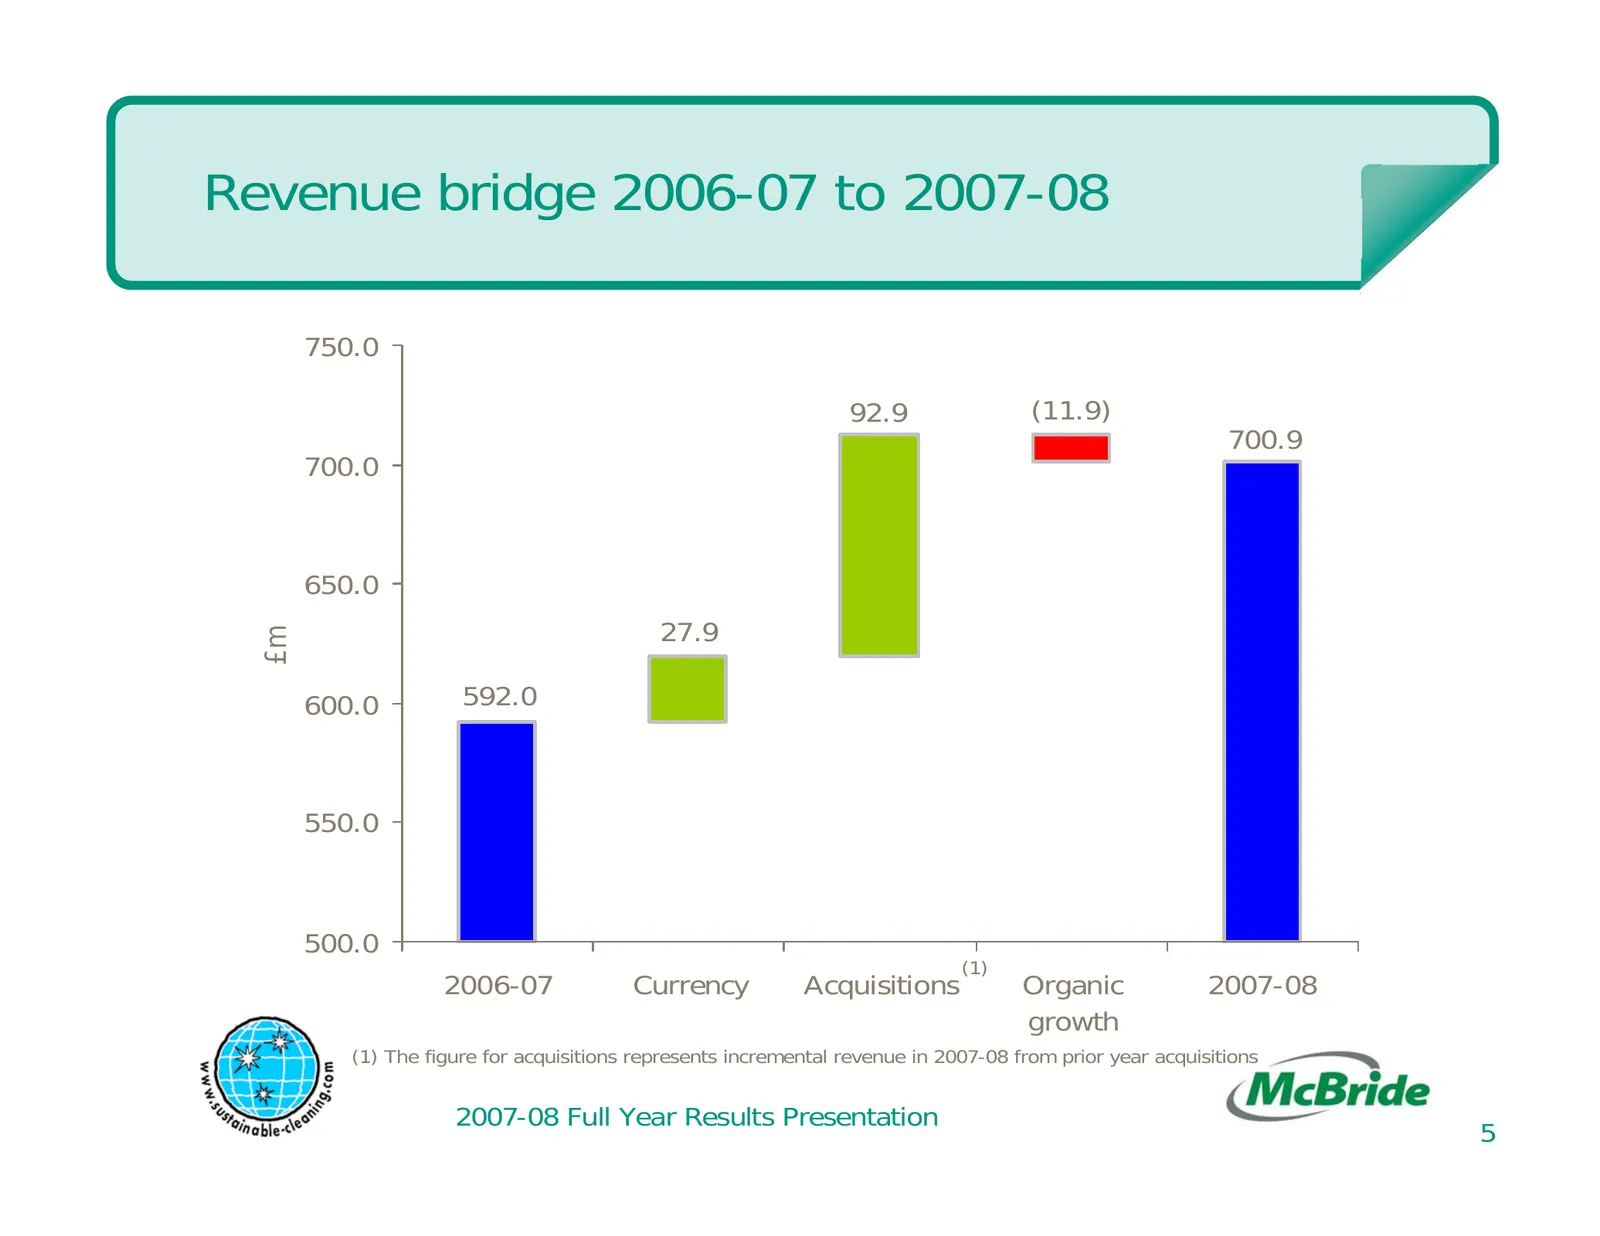
Revenue bridge 2006-07 to 2007-08 750.0 92.9 (11.9) 700.9 700.0 650.0 27.9 £m 600.0 592.0 550.0 500.0 (1) 2006-07 Currency Acquisitions Organic 2007-08 growth (1) The figure for acquisitions represents incremental revenue in 2007-08 from prior year acquisitions 2007-08 Full Year Results Presentation
Slide 6: Income statement
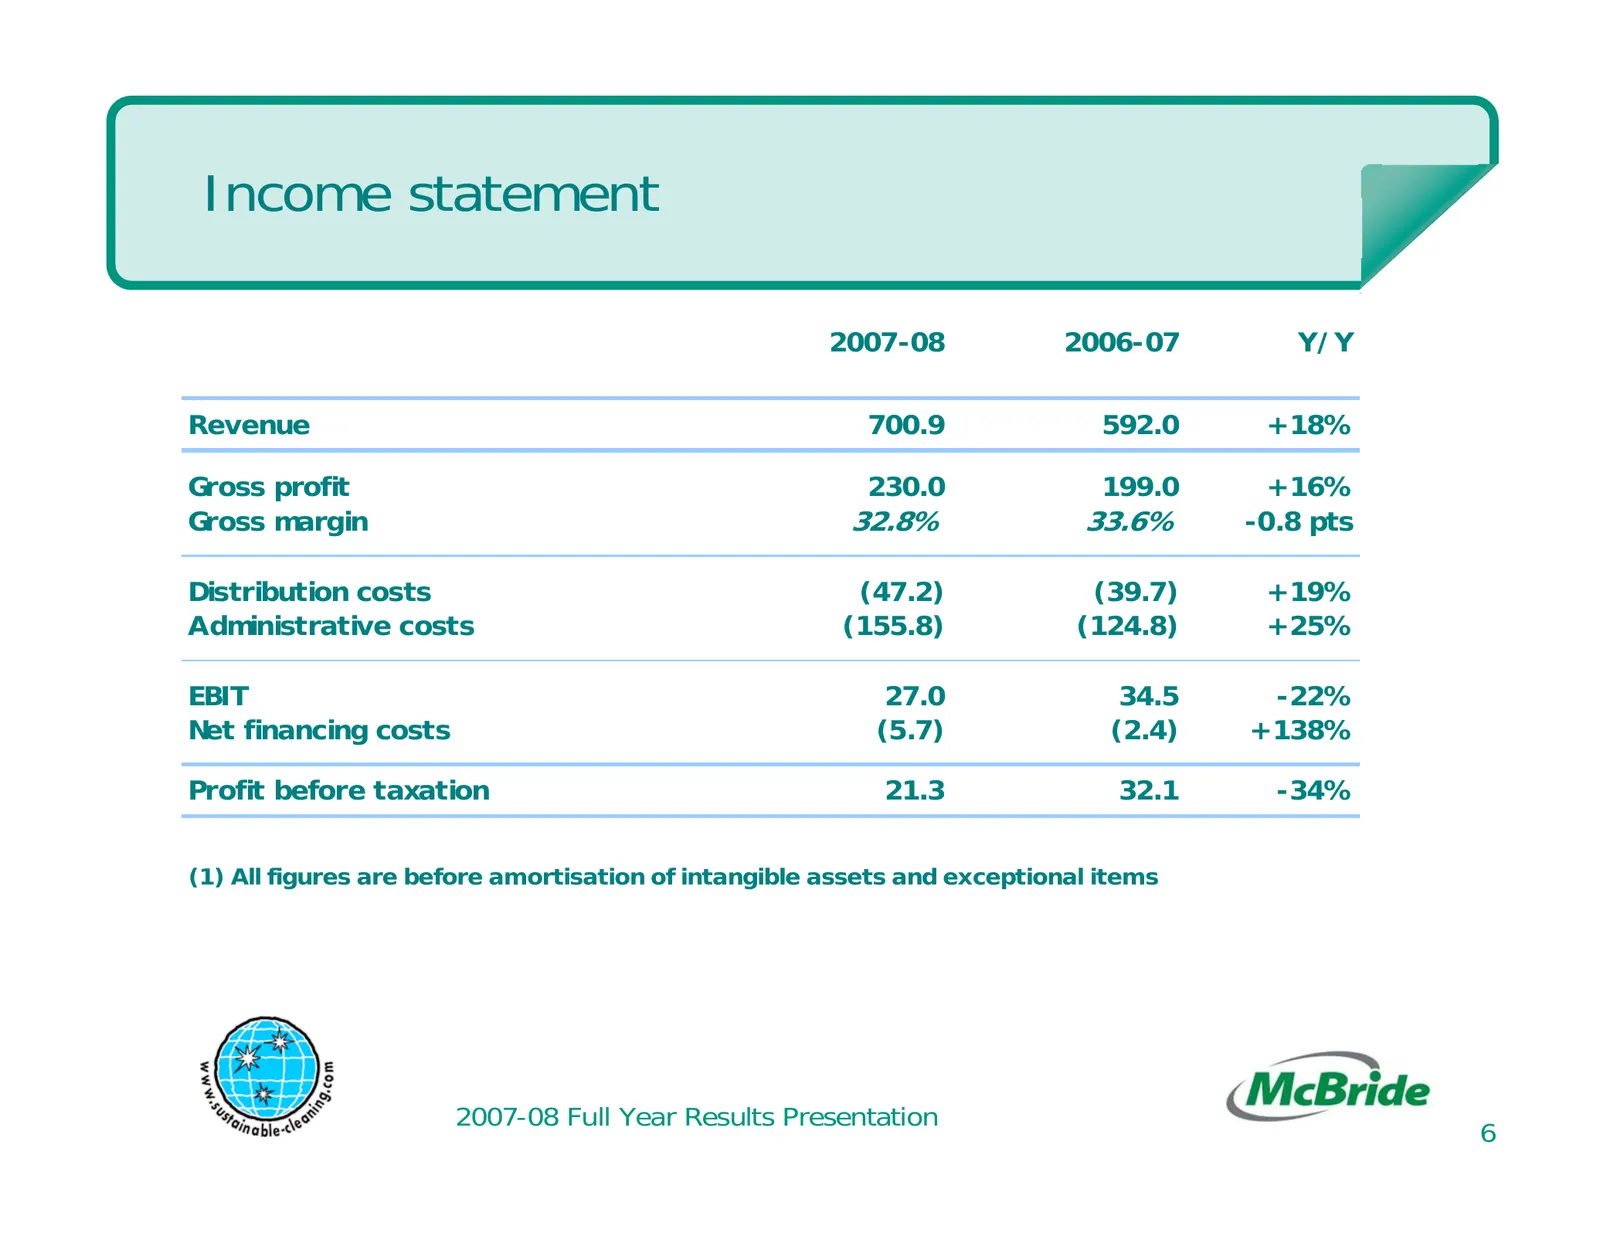
Income statement 2007-08 2006-07 Y/Y Revenue 700.9 592.0 +18% Gross profit 230.0 199.0 +16% Gross margin 32.8% 33.6% -0.8 pts Distribution costs (47.2) (39.7) +19% Administrative costs (155.8) (124.8) +25% EBIT 27.0 34.5 -22% Net financing costs (5.7) (2.4) +138% Profit before taxation 21.3 32.1 -34
Slide 7: Regional performance
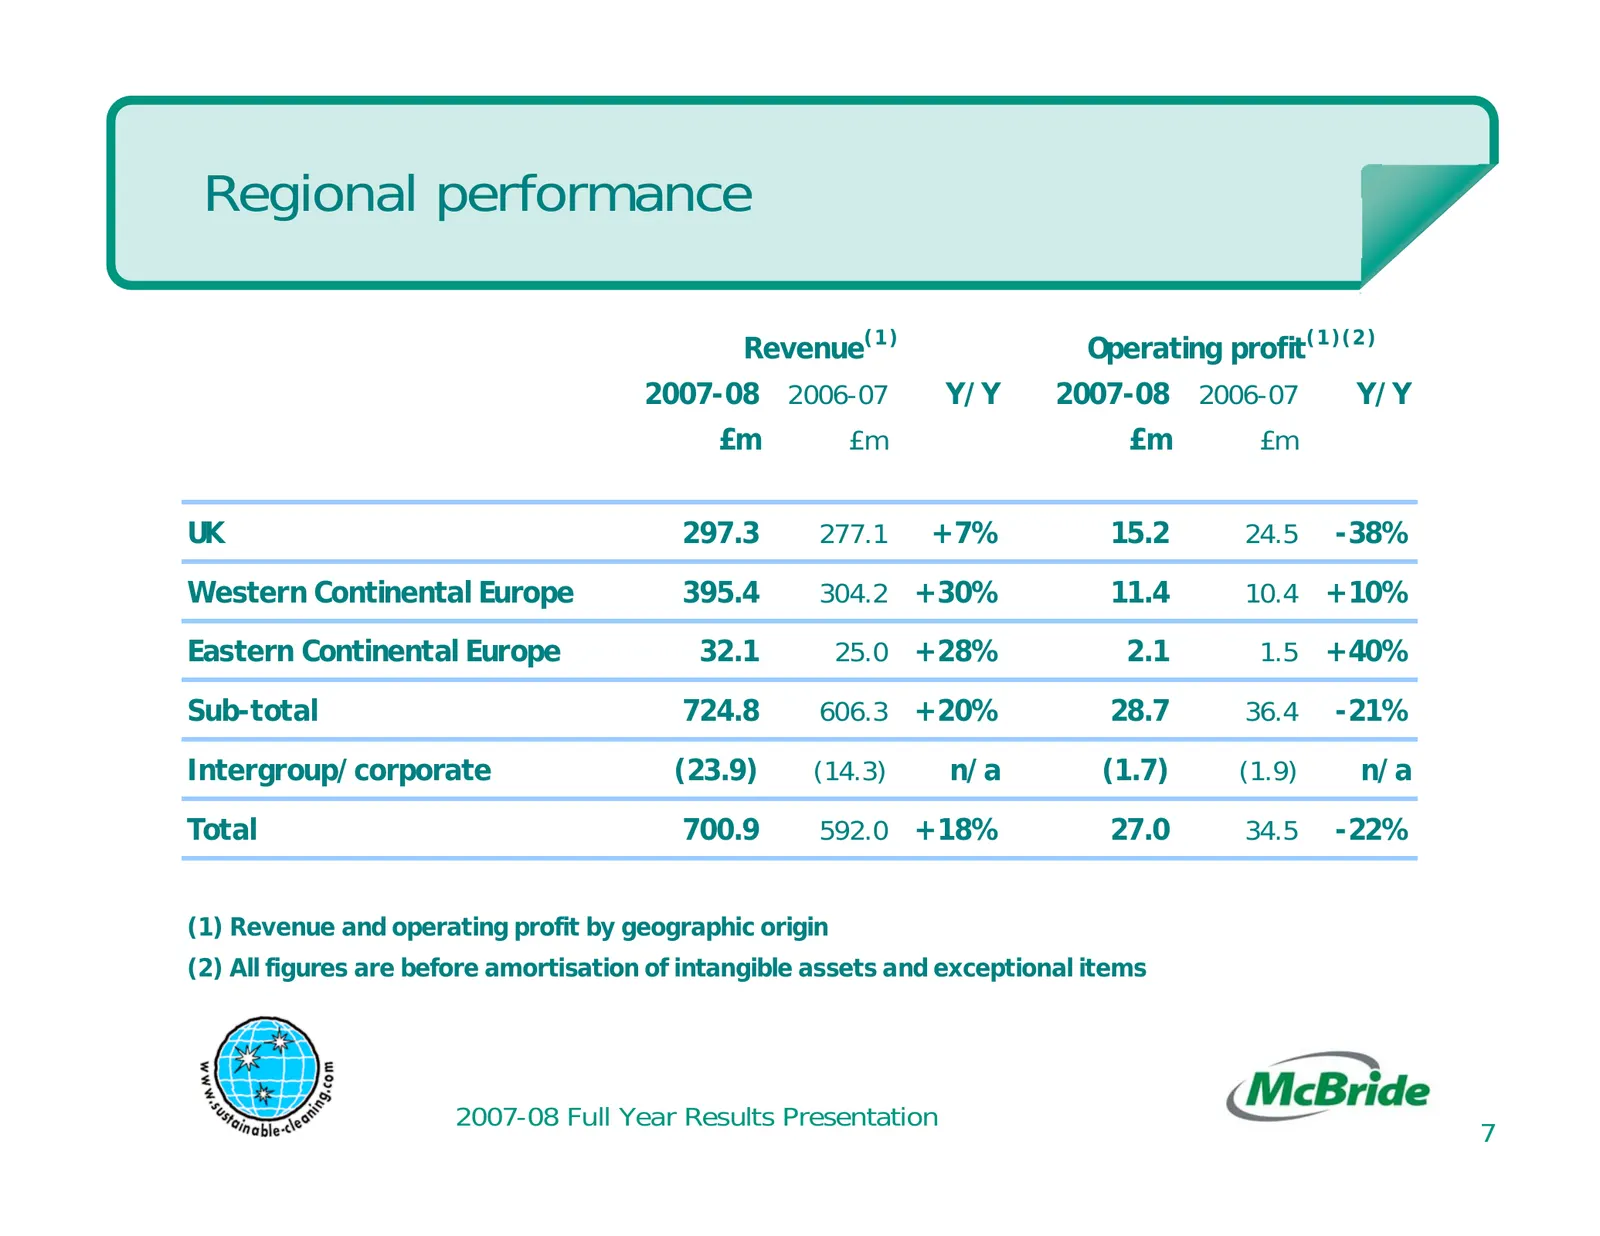
Regional performance Revenue(1 ) Operating profit (1 )(2 ) 2007-08 2006-07 Y/Y 2007-08 2006-07 Y/Y £m £m £m £m UK 297.3 277.1 +7% 15.2 24.5 -38% Western Continental Europe 395.4 304.2 +30% 11.4 10.4 +10% Eastern Continental Europe 32.1 25.0 +28% 2.1 1.5 +40% Sub-total 724.8 606.3 +20% 28.7 36.4 -21%
Slide 8: Movement in net debt - June 2007 to June 2008
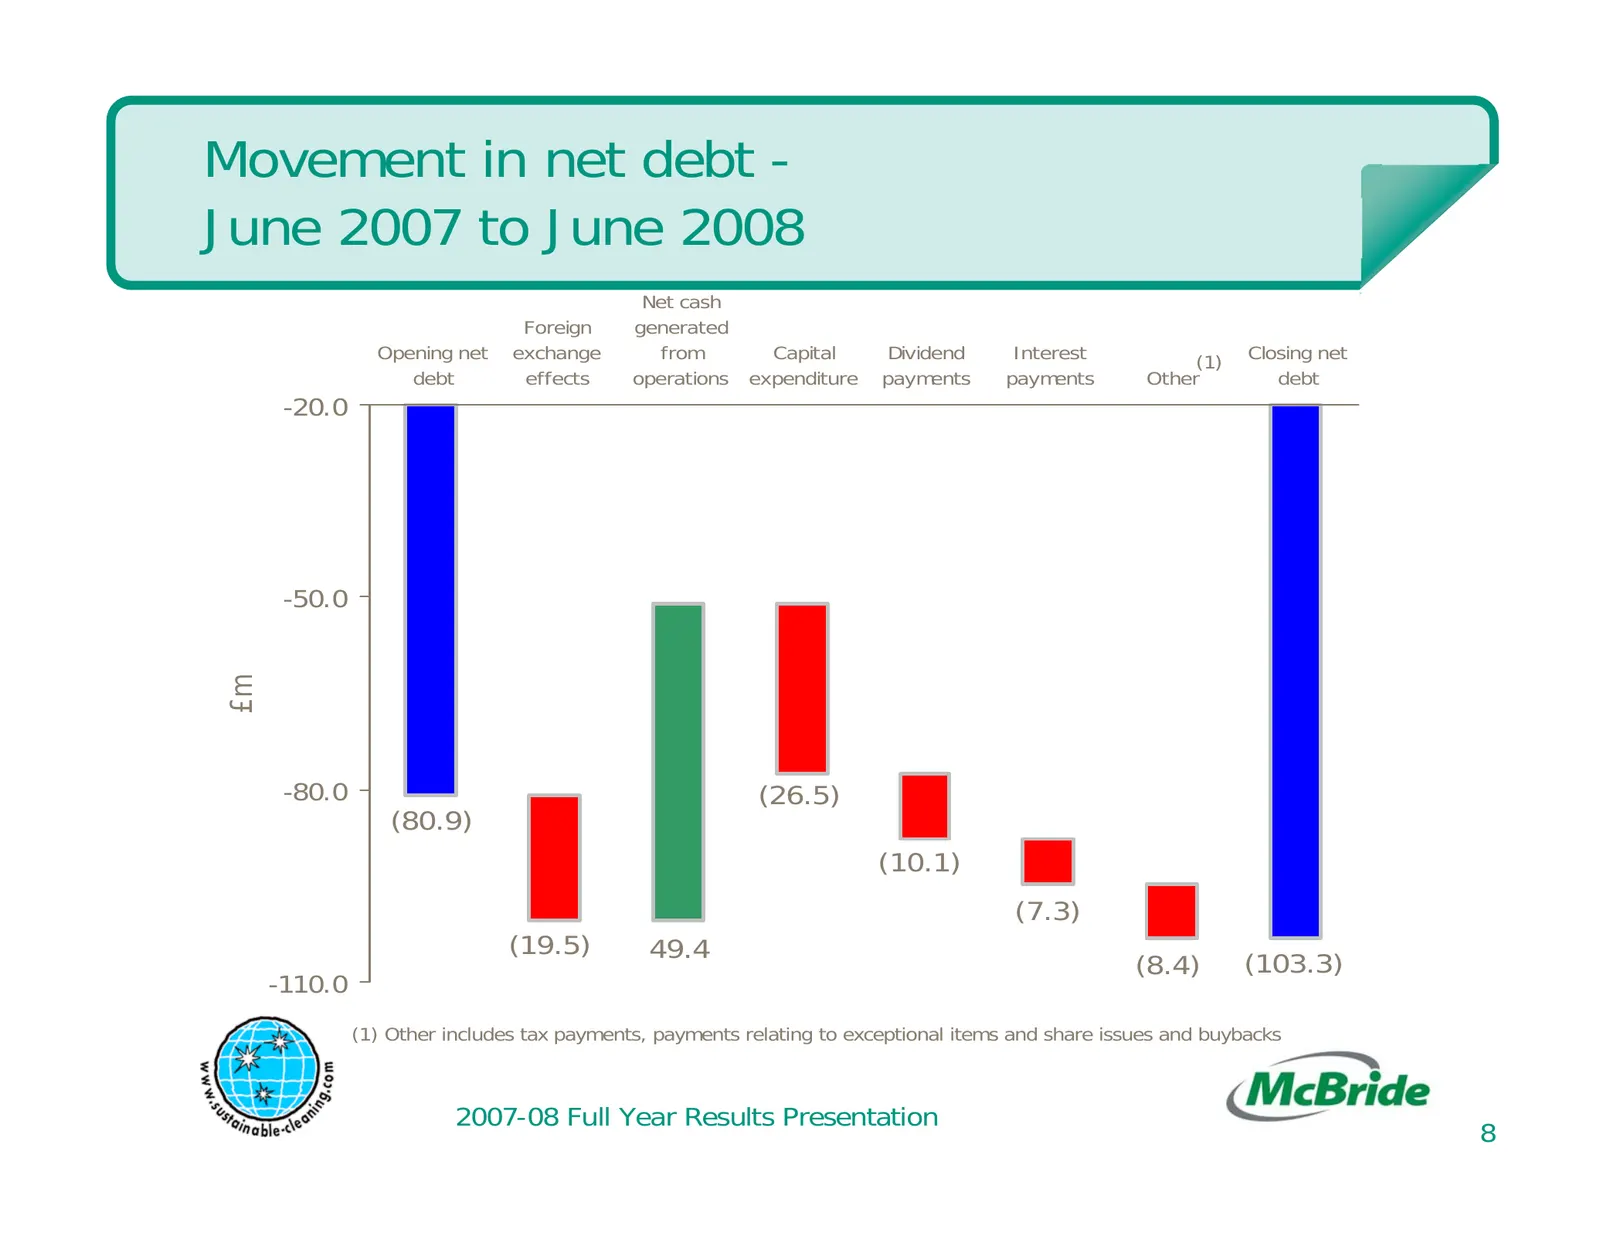
Movement in net debt - June 2007 to June 2008 Net cash Foreign generated Opening net exchange from Capital Dividend Interest (1) Closing net debt effects operations expenditure payments payments Other debt -20.0 -50.0 £m -80.0 (26.5) (80.9) (10.1) (7.3) (19.5) 49.4 (8.4) (103.3) -110.0 (1) Other inc

Slide 9: Business review
Business review
Slide 10: Agenda
Agenda » Strategy » Markets » Divisional performances » Cost environment » Current trading and outlook » Conclusion 2007-08 Full Year Results Presentation 10
Slide 11: Strategy
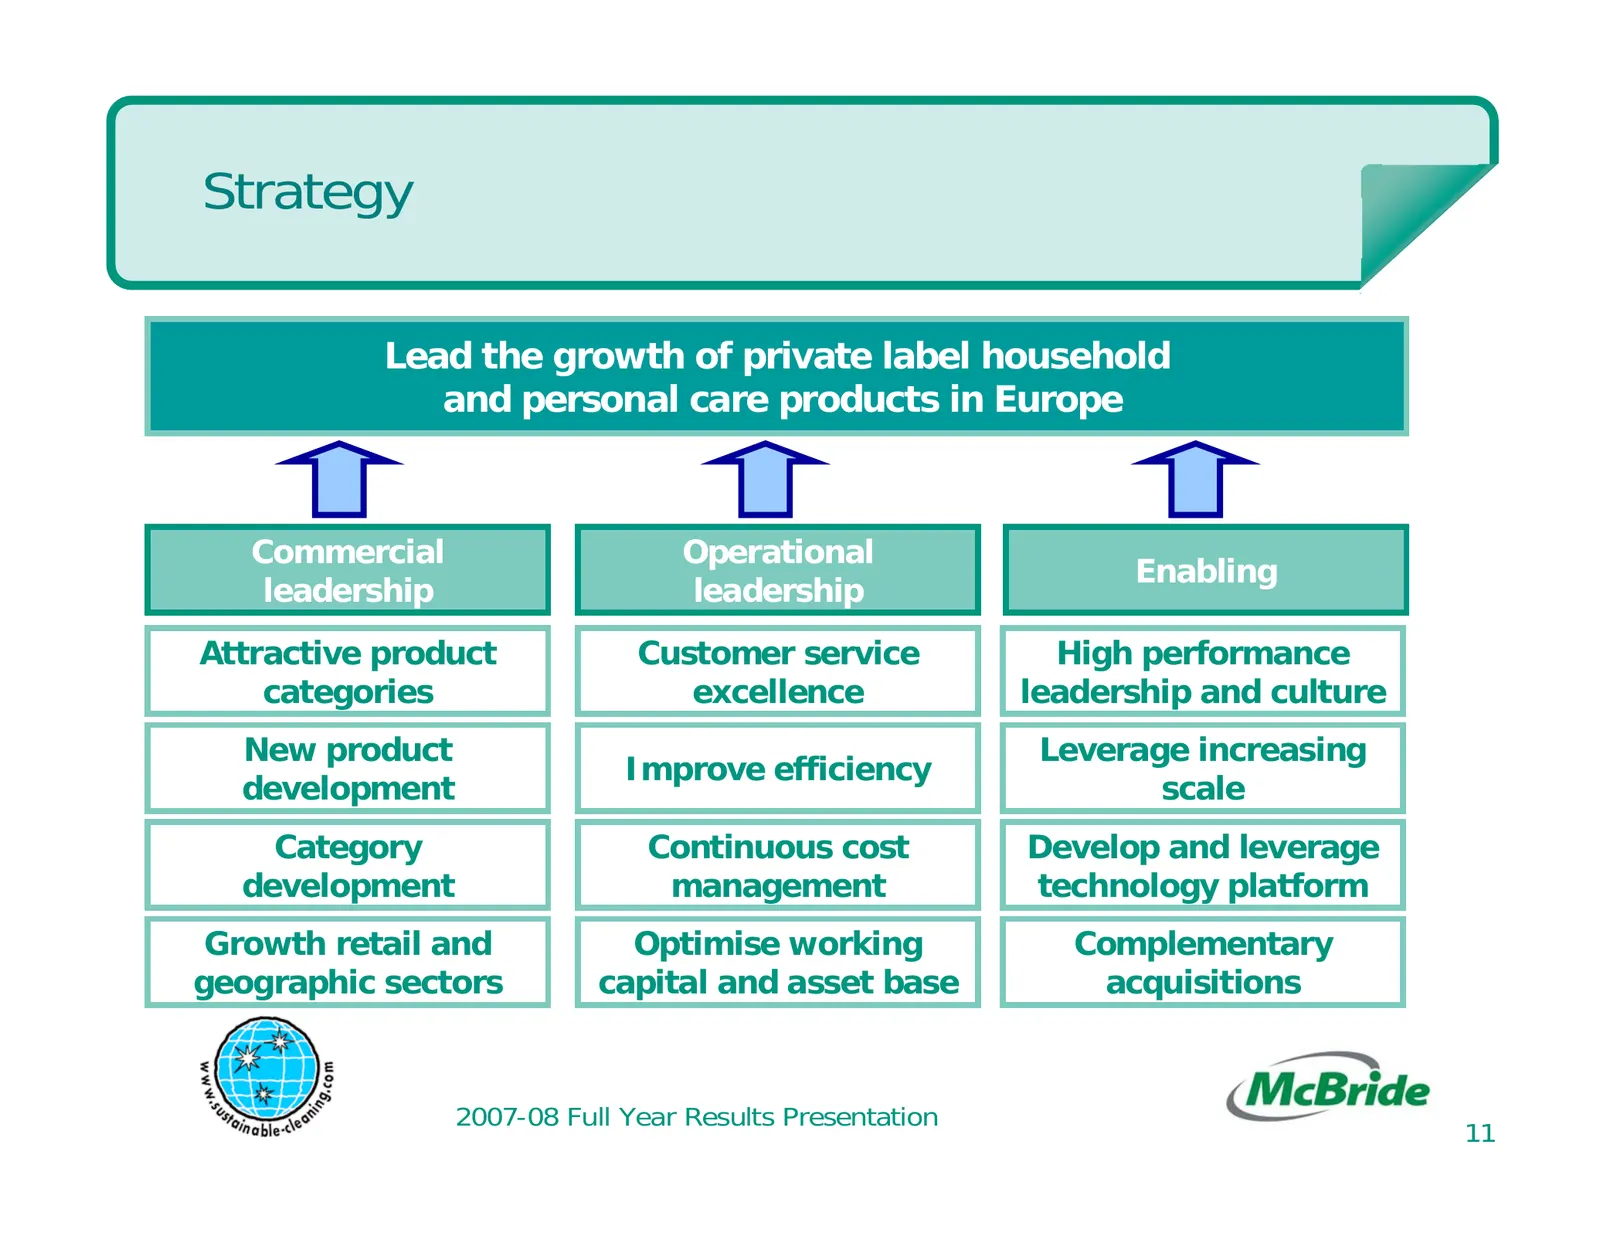
Strategy Lead the growth of private label household and personal care products in Europe Commercial Operational Enabling leadership leadership Attractive product Customer service High performance categories excellence leadership and culture New product Leverage increasing Improve efficiency developm
Slide 12: New product development
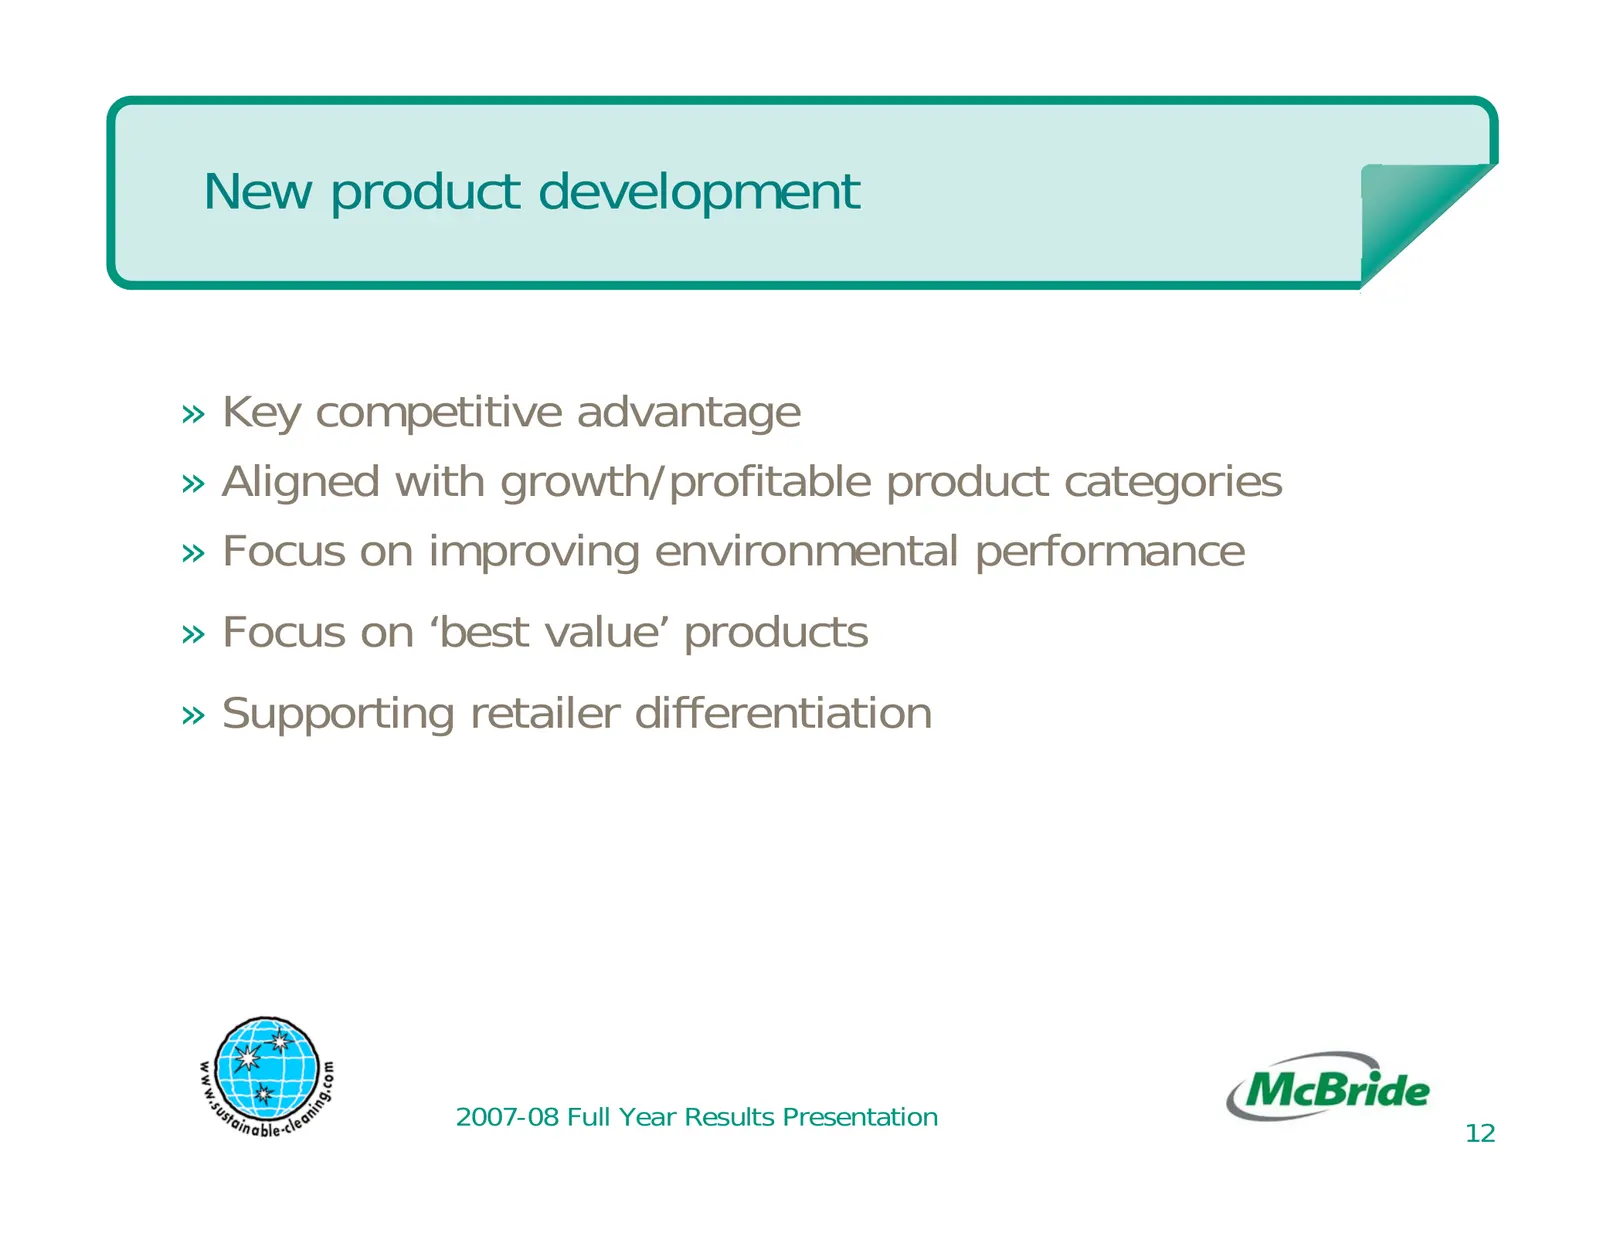
New product development » Key competitive advantage » Aligned with growth/profitable product categories » Focus on improving environmental performance » Focus on ‘best value’ products » Supporting retailer differentiation 2007-08 Full Year Results Presentation 12
Slide 13: European household and personal care markets
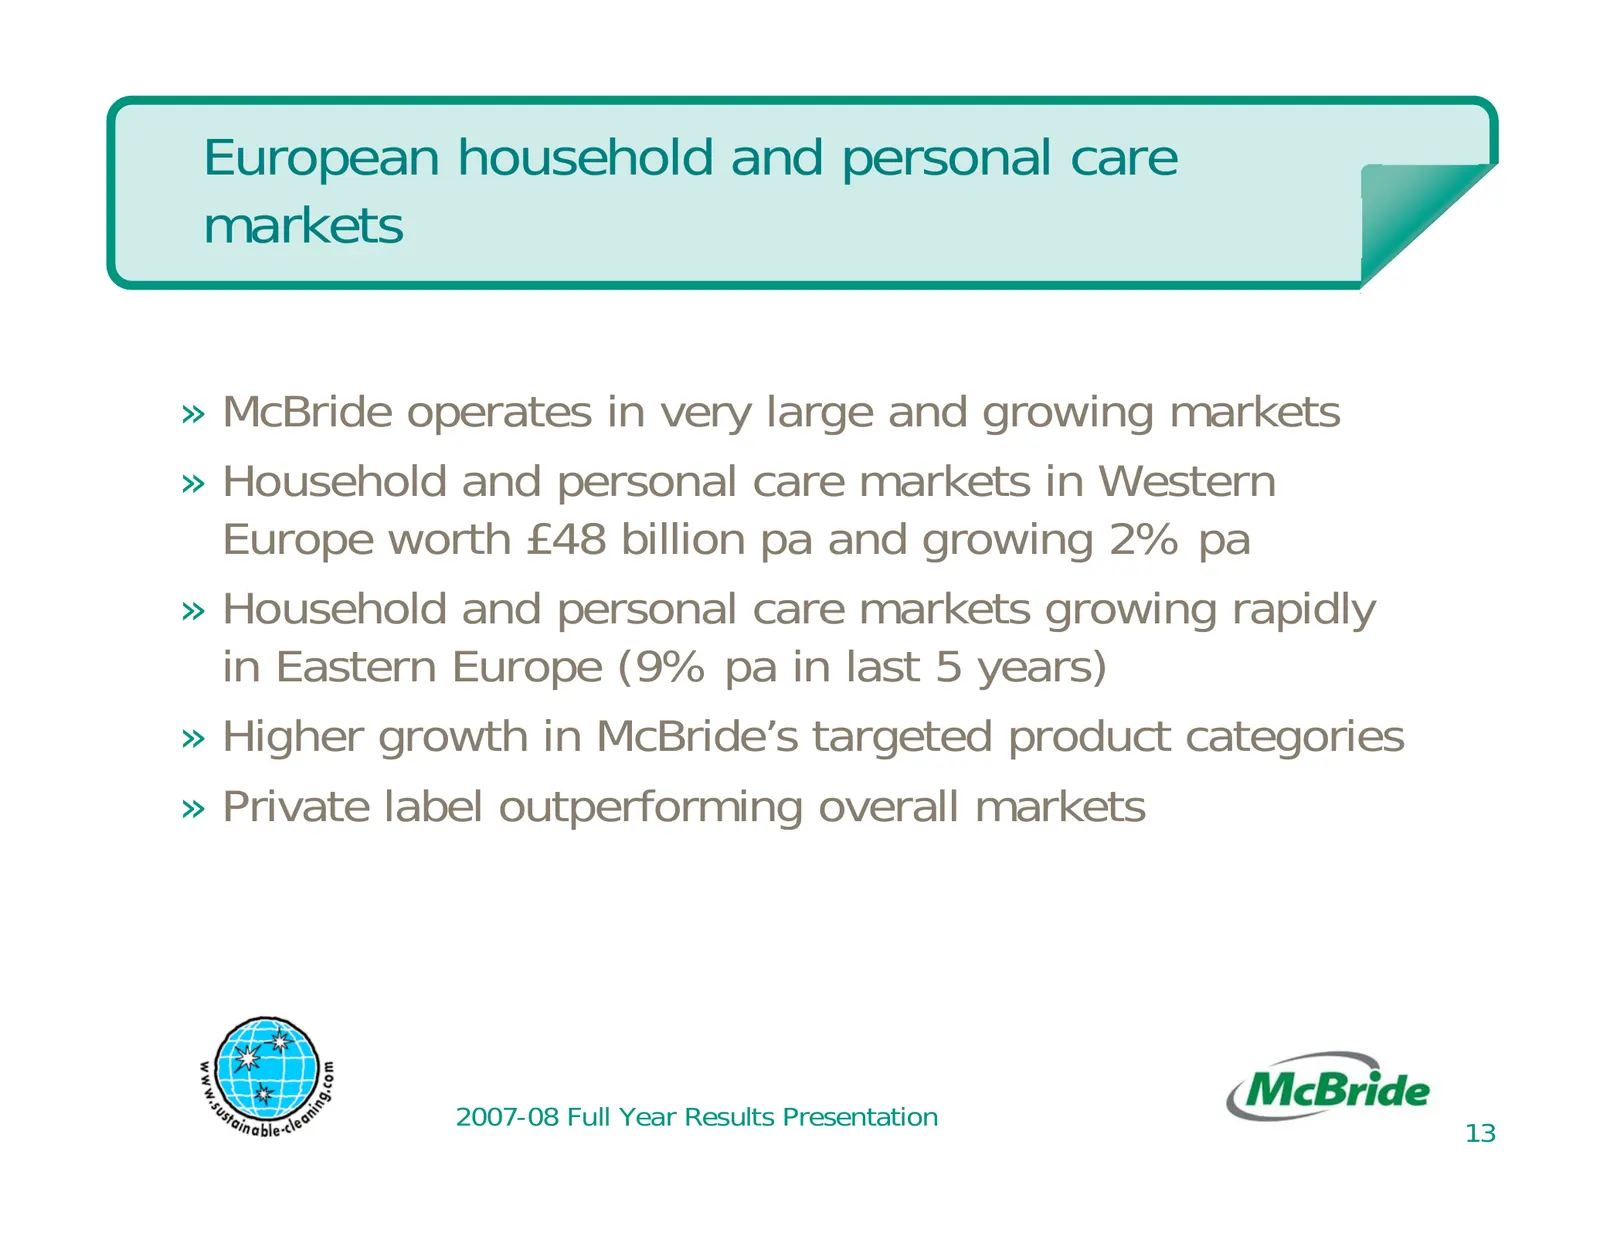
European household and personal care markets » McBride operates in very large and growing markets » Household and personal care markets in Western Europe worth £48 billion pa and growing 2% pa » Household and personal care markets growing rapidly in Eastern Europe (9% pa in last 5 years) » Higher gr
Slide 14: McBride's growth product categories - attractive growth potential
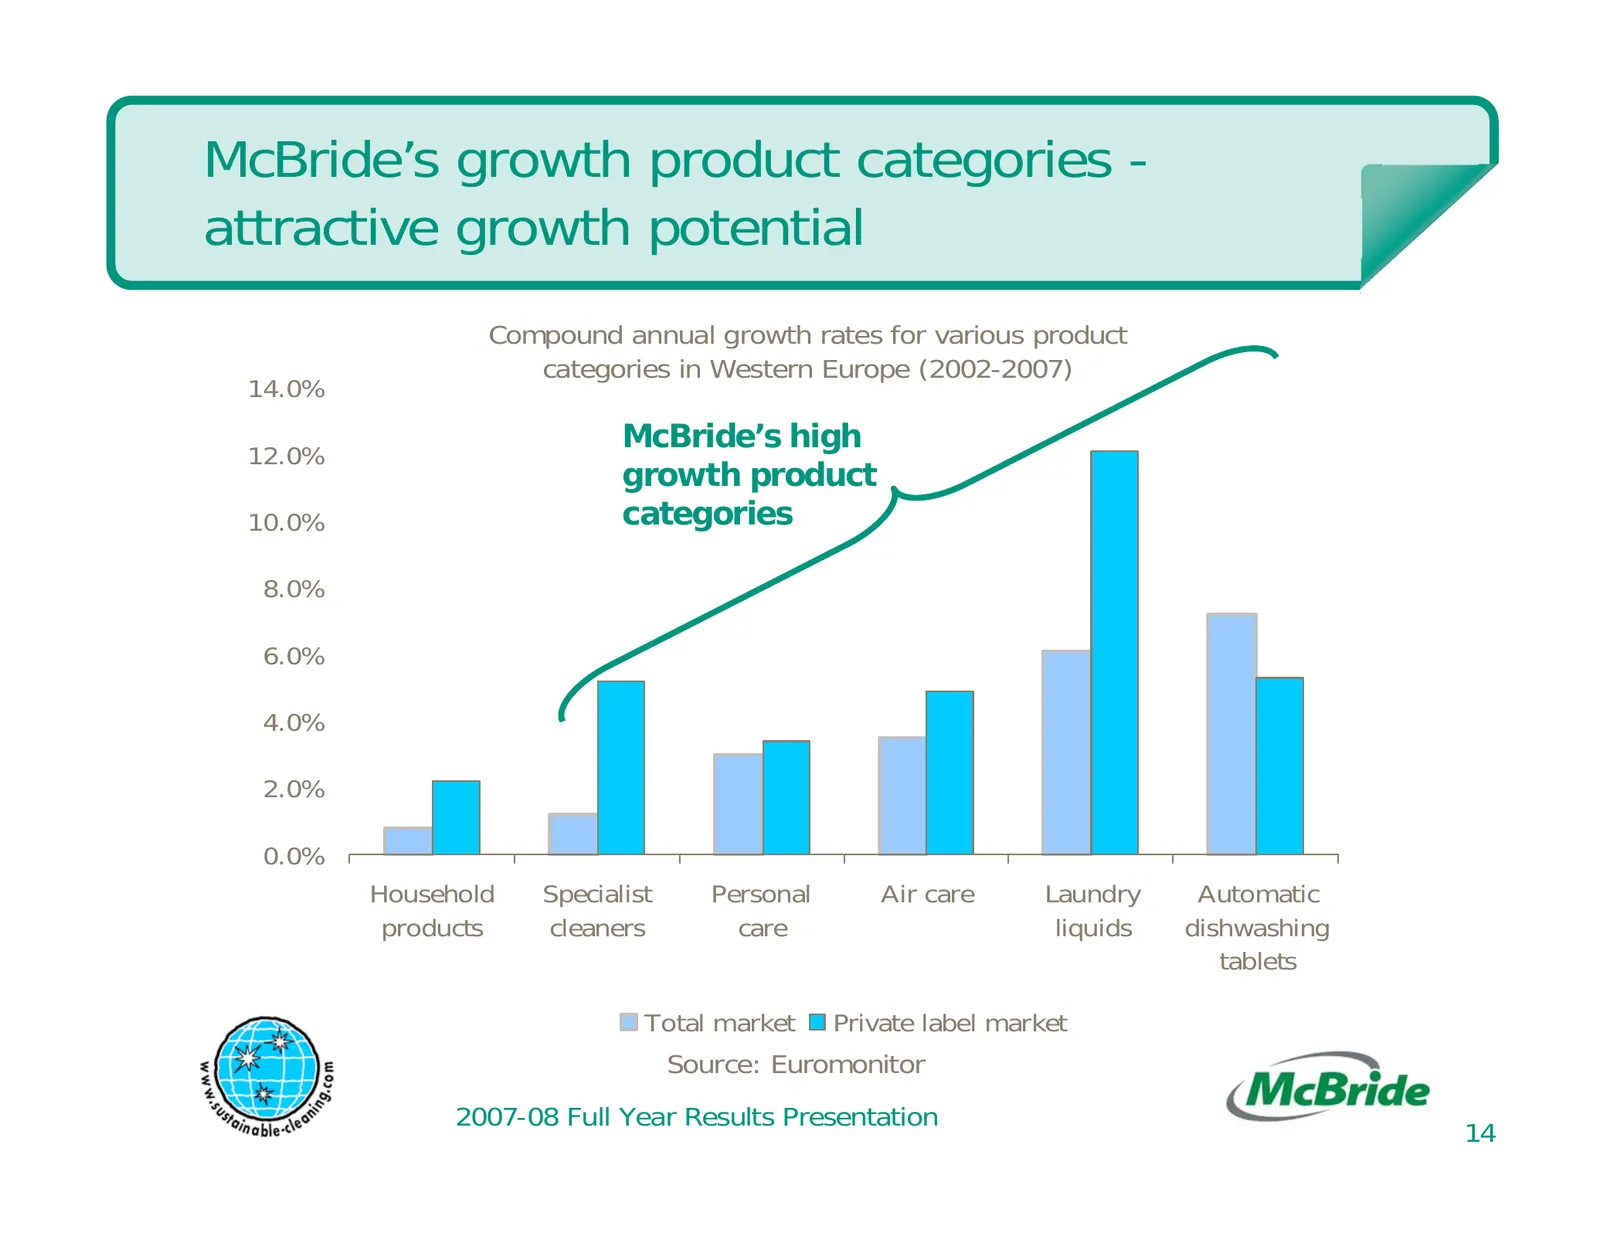
McBride’s growth product categories - attractive growth potential Compound annual growth rates for various product categories in Western Europe (2002-2007) 14.0% McBride’s high 12.0% growth product 10.0% categories 8.0% 6.0% 4.0% 2.0% 0.0% Household Specialist Personal Air care Laundry Automatic pro
Slide 15: Recent private label environment
Recent private label environment » Mixed private label performance in last year primarily reflecting the effects of negotiating price increases » UK was weak whilst France, Italy and Spain all saw private label market share gains » In the UK, private label share recovery since Q1 2008 » In Italy, pr
Slide 16: UK business review
UK business review » UK business had a very challenging year » Impacted by unprecedented input cost inflation » Mitigating actions undertaken » Reported revenue up 7% with 4% organic decline » 4% organic growth in personal care » Operating profit down 38% to £15.2m - time lag between cost increases
Slide 17: UK factory reconfiguration
UK factory reconfiguration » St Helens site purchased in April 2008 » Substantial new capacity and production environment for further growth in personal care » Enables consolidation of production from two recently acquired sites » One-off costs of approximately £2m relating mainly to redundancies an
Slide 18: Western Continental Europe business review
Western Continental Europe business review » Difficult trading conditions reflecting significant input cost inflation » Mitigating actions undertaken » Recent acquisitions integrated and performing well » Reported revenue up 30% due to acquisitions (22%) and currency (8%) with flat organic revenue »
Slide 19: Eastern Continental Europe business review
Eastern Continental Europe business review » Buoyant markets continue across the region » Reported revenue up 28% with 8% organic growth or 16% in core retail sales » Strong growth in both household and personal care » Significant growth in Czech Republic and Hungary » Operating profit up 40% 2007-0
Slide 20: Cost environment
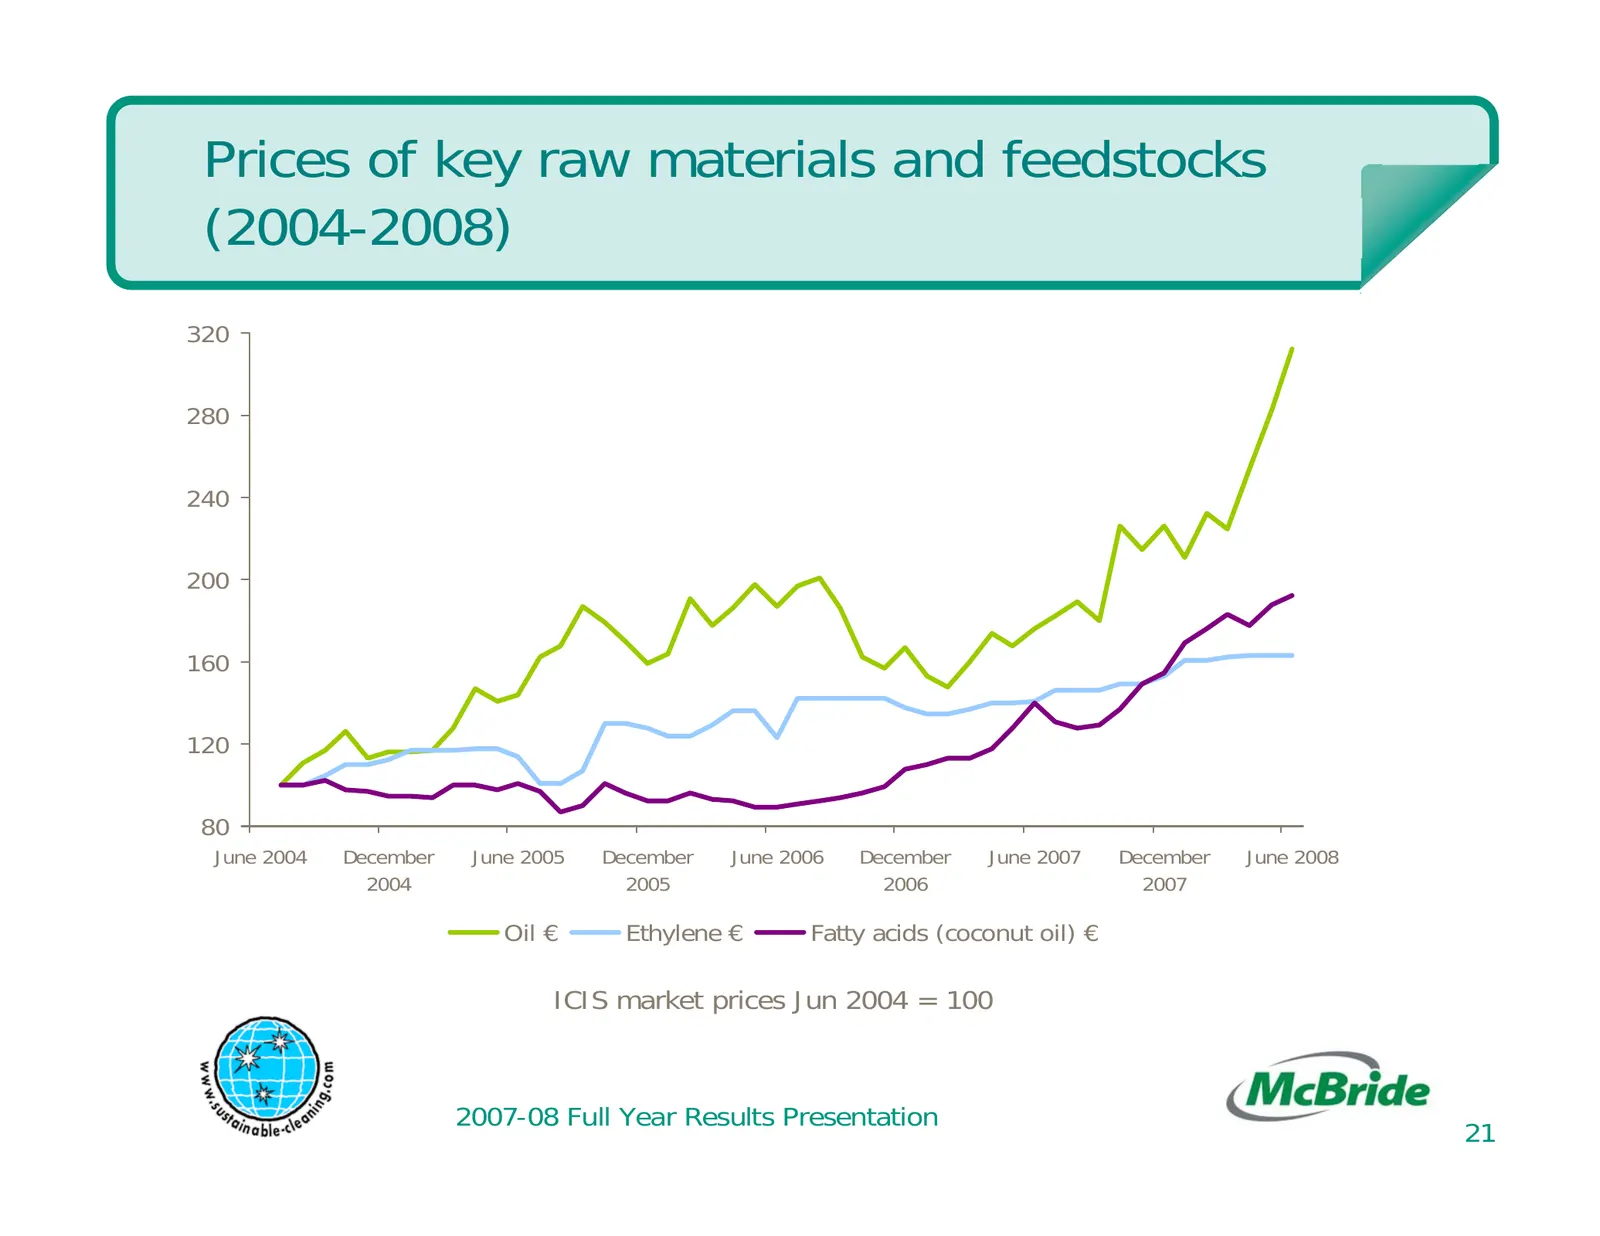
Cost environment » Managing input, energy and distribution costs is a core skill of the group » Significant and volatile increase in all these costs seen during year » Input cost impact across packaging, phosphates, fatty acids, polymers and surfactants » McBride annual spend - approximately £400m o
Slide 21: Prices of key raw materials and feedstocks
Prices of key raw materials and feedstocks (2004-2008) 320 280 240 200 160 120 80 June 2004 December June 2005 December June 2006 December June 2007 December June 2008 2004 2005 2006 2007 Oil € Ethylene € Fatty acids (coconut oil) € ICIS market prices Jun 2004 = 100 2007-08 Full Year Results Present
Slide 22: Raw material cost index (2006 - 2008)
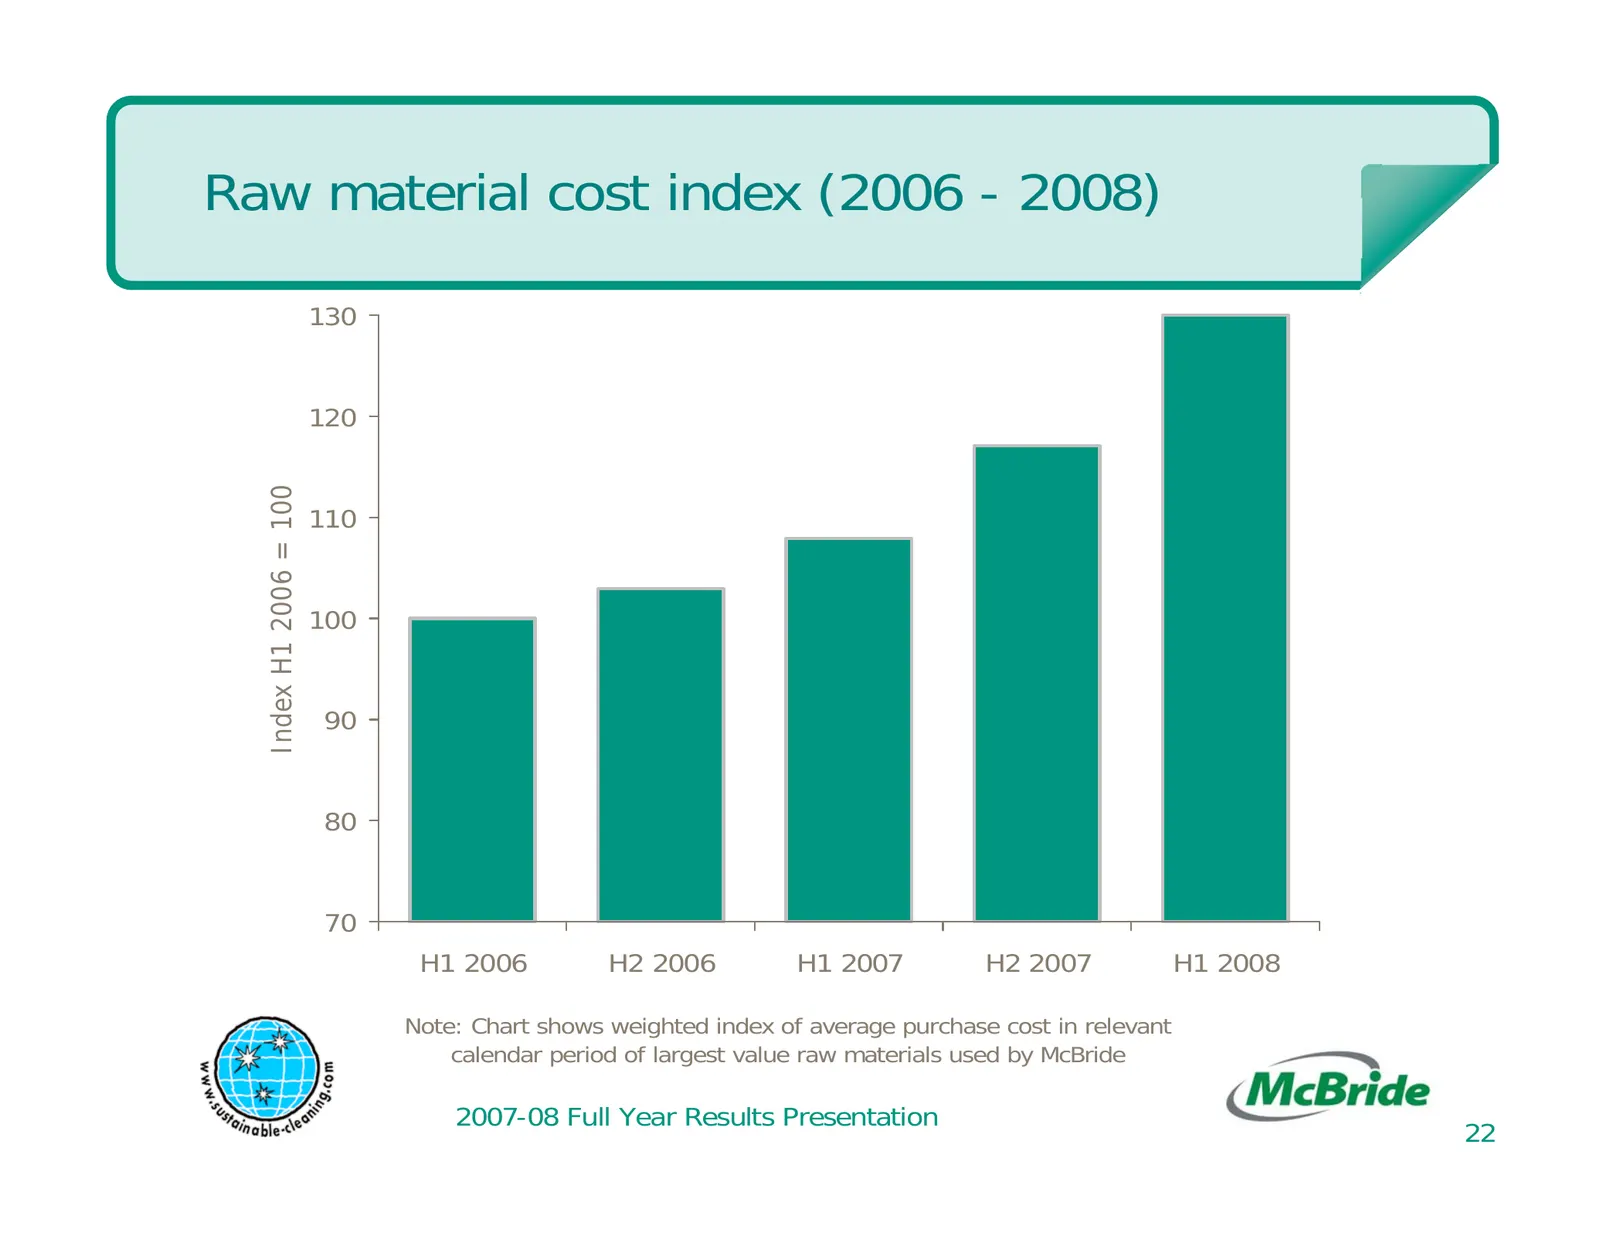
Raw material cost index (2006 - 2008) 130 120 Index H1 2006 = 100 110 100 90 80 70 H1 2006 H2 2006 H1 2007 H2 2007 H1 2008 Note: Chart shows weighted index of average purchase cost in relevant calendar period of largest value raw materials used by McBride 2007-08 Full Year Results Presentation 22
Slide 23: Actions to address input cost environment
Actions to address input cost environment » Product price increases » Purchasing strategies - buying long - deferring cost pressures » Significant value engineering - lightweighting packaging - alternative materials to petrochemicals » Continuing efficiency gains - production yields, overheads 2007-
Slide 24: Current trading and outlook
Current trading and outlook » Key objectives for current year - achieve further mitigation of raw material costs as required - step up group wide restructuring and efficiency initiatives - drive further growth in priority categories and geographies - continued focus on new product development » Trad
Slide 25: Conclusion
Conclusion » Managing impact of substantial input cost inflation » Strength of business model clearly demonstrated » Existing business strategy robust - attractive growth product categories - dynamic growth regions - category and new product development - continuous efficiency improvements - signifi
Source: Internet Archive copy of mcbride.co.uk
More decks from McBride plc
 FY2026 Earnings Presentation28 slides · Sep 15, 2026
 H1 FY26 Earnings Presentation22 slides · Feb 26, 2026
 FY2025 Earnings Presentation23 slides · Sep 18, 2025
 H1 FY2025 Earnings Presentation30 slides · Feb 25, 2025
 FY2024 Earnings Presentation30 slides · Sep 17, 2024
 Investor Day (March 2024)65 slides · Mar 13, 2024