Chittenden — Investor Presentation (October 2005)
38 slides from Chittenden's investor presentation, Oct 21, 2005

Slide 1: As of September 30, 2005
Exhibit 99.1 As of September 30, 2005
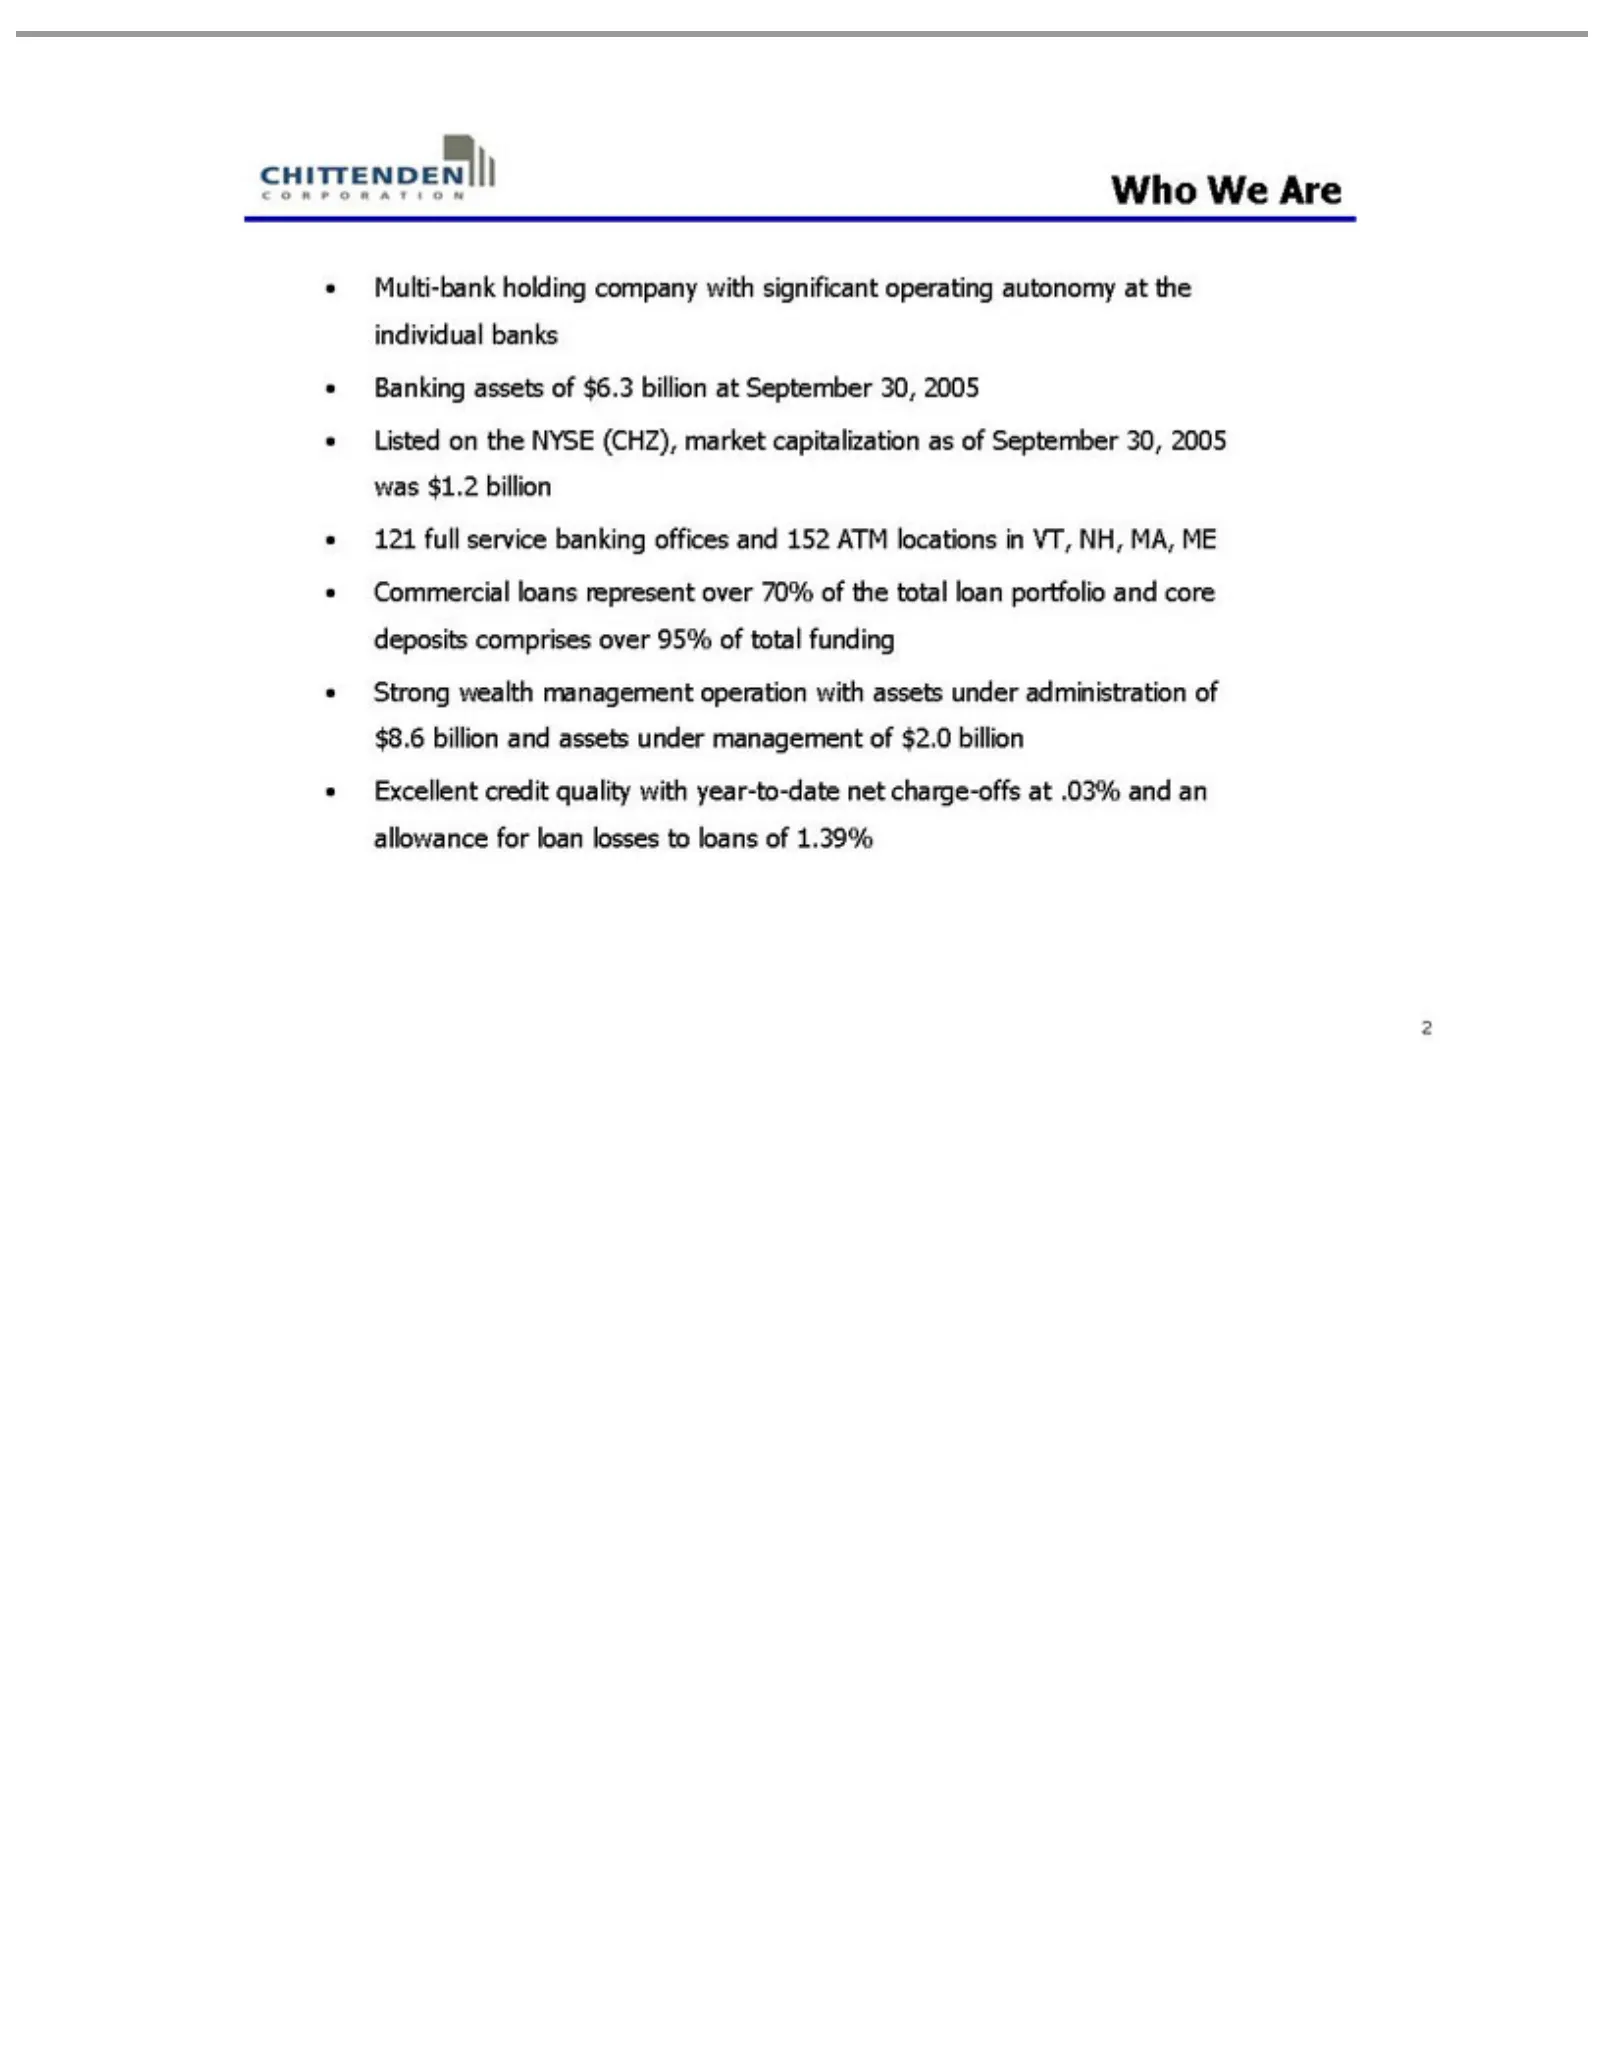
Slide 2: Who We Are
Who We Are Multi-bank September comprises year-to-date 2 over 30, holding net2005 95% charge-offs company was of total $1.2atfunding with billion .03%significant and Strong 121an full allowance wealth service operating management banking forautonomy loanoffices losses operation at the to andloans in
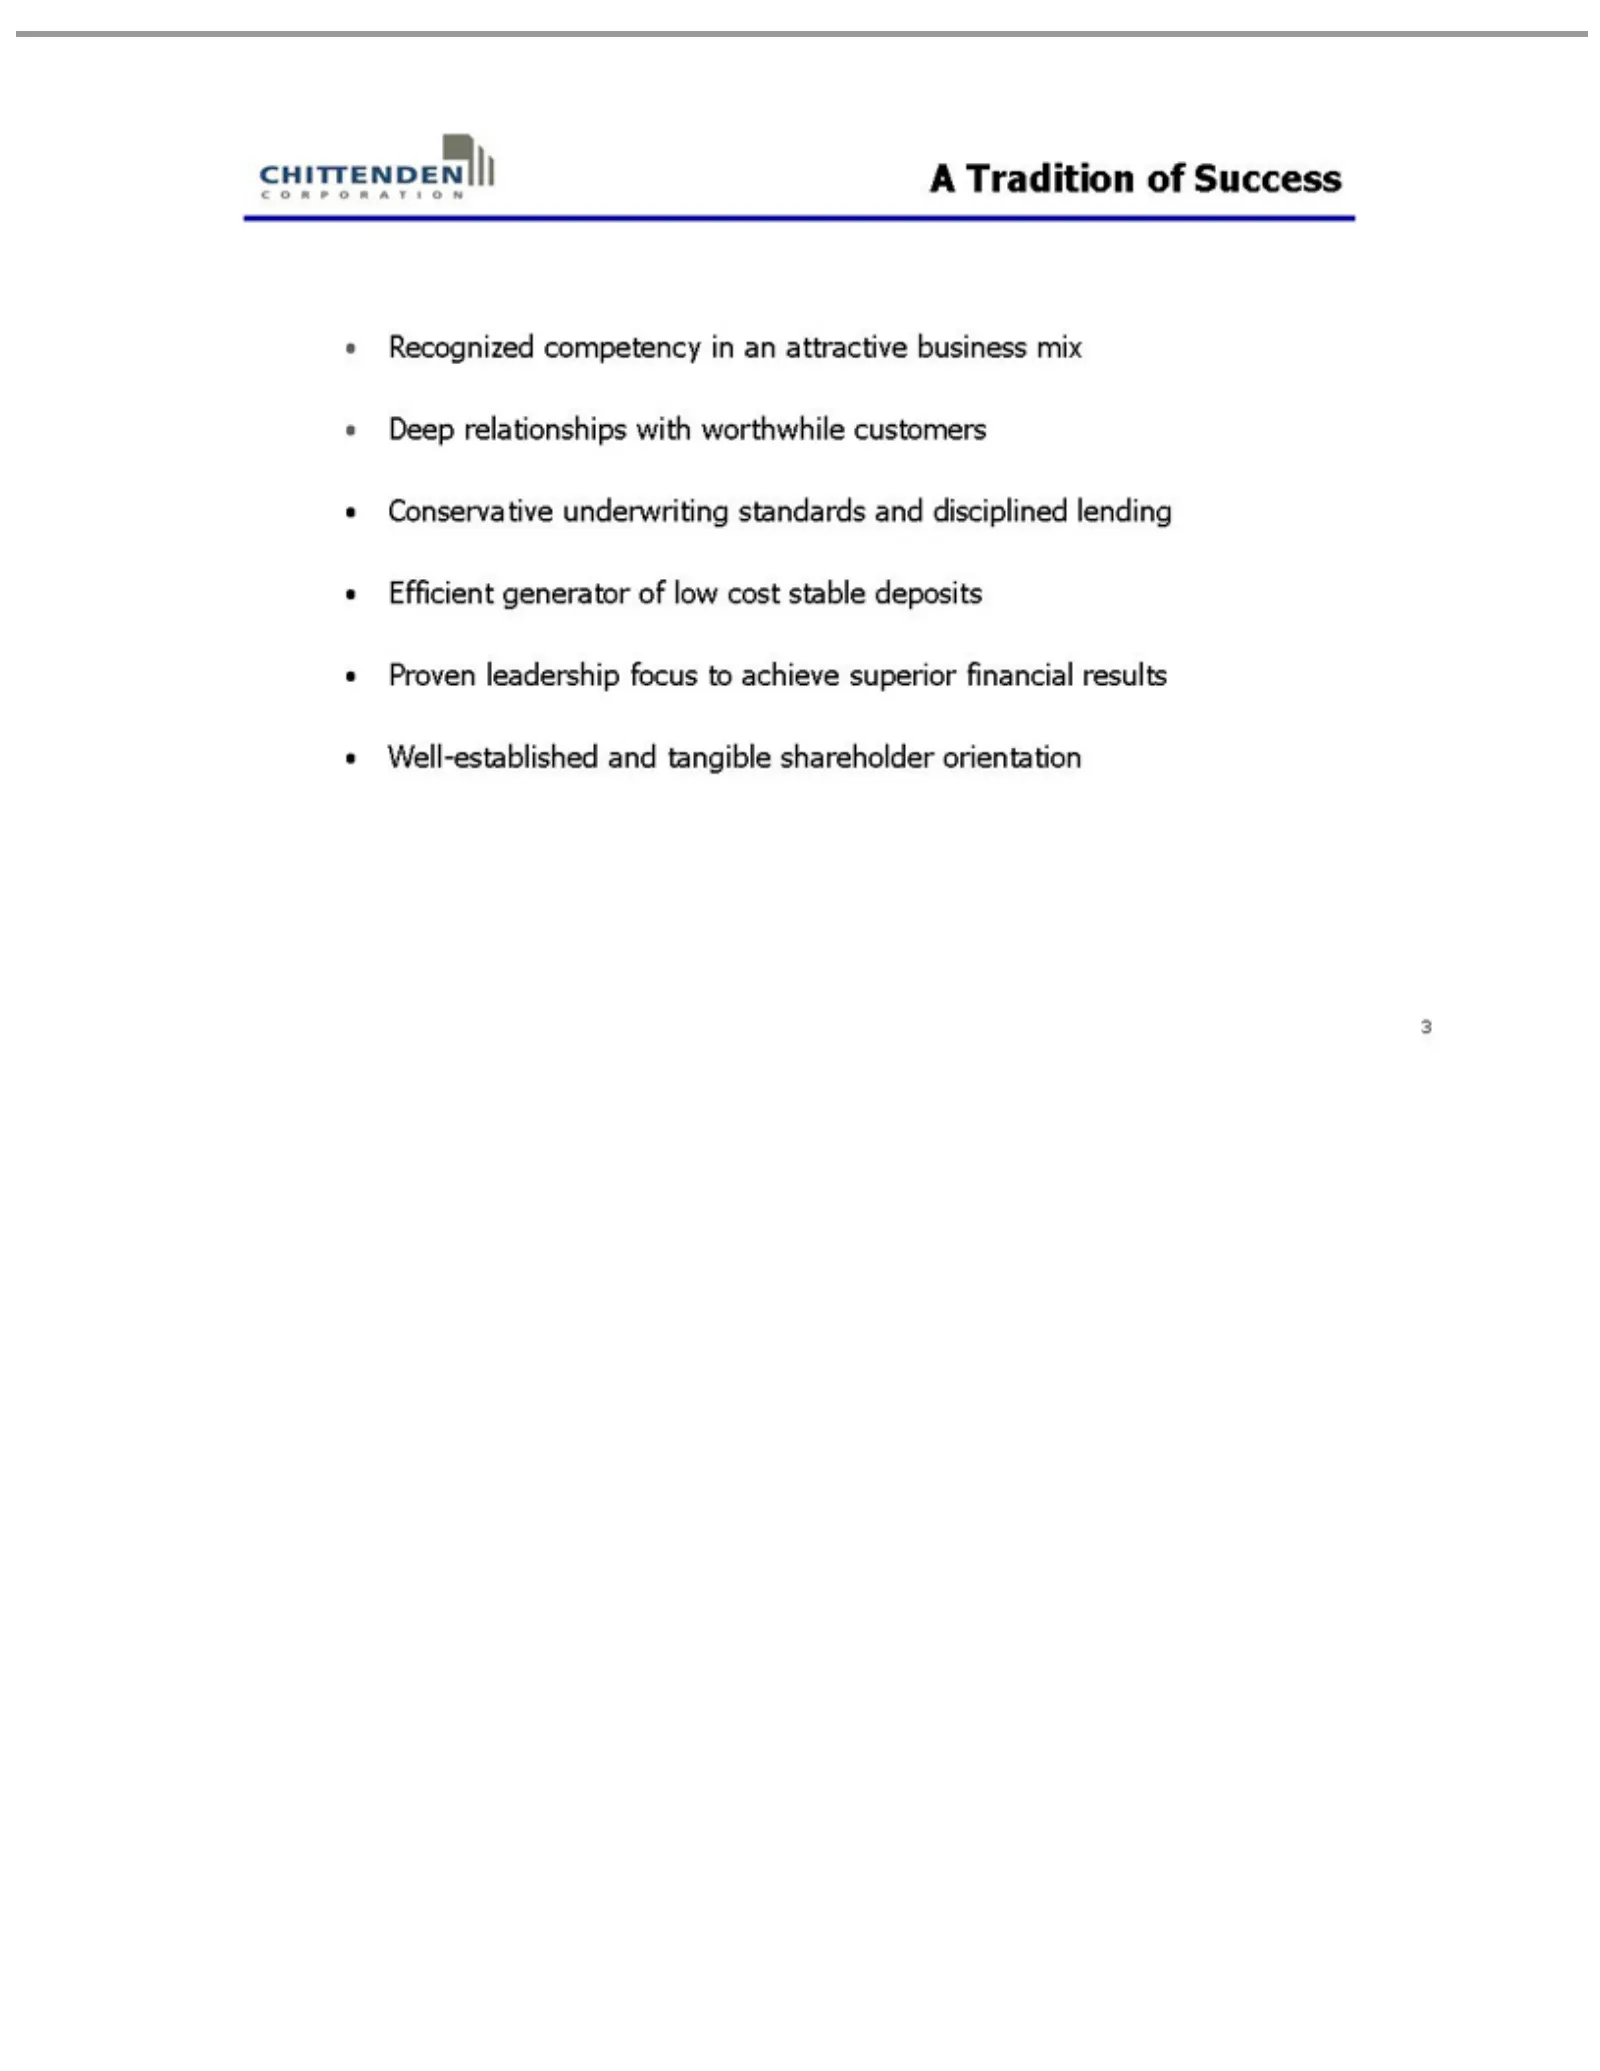
Slide 3: A Tradition of Success
A Tradition Recognized deposits 3 Proven of competency Success leadership in focus an attractive to achieve business superior mixfinancial Deep relationships results Well-established with worthwhile and customers tangible shareholder Conservative orientation underwriting standards and disciplined le
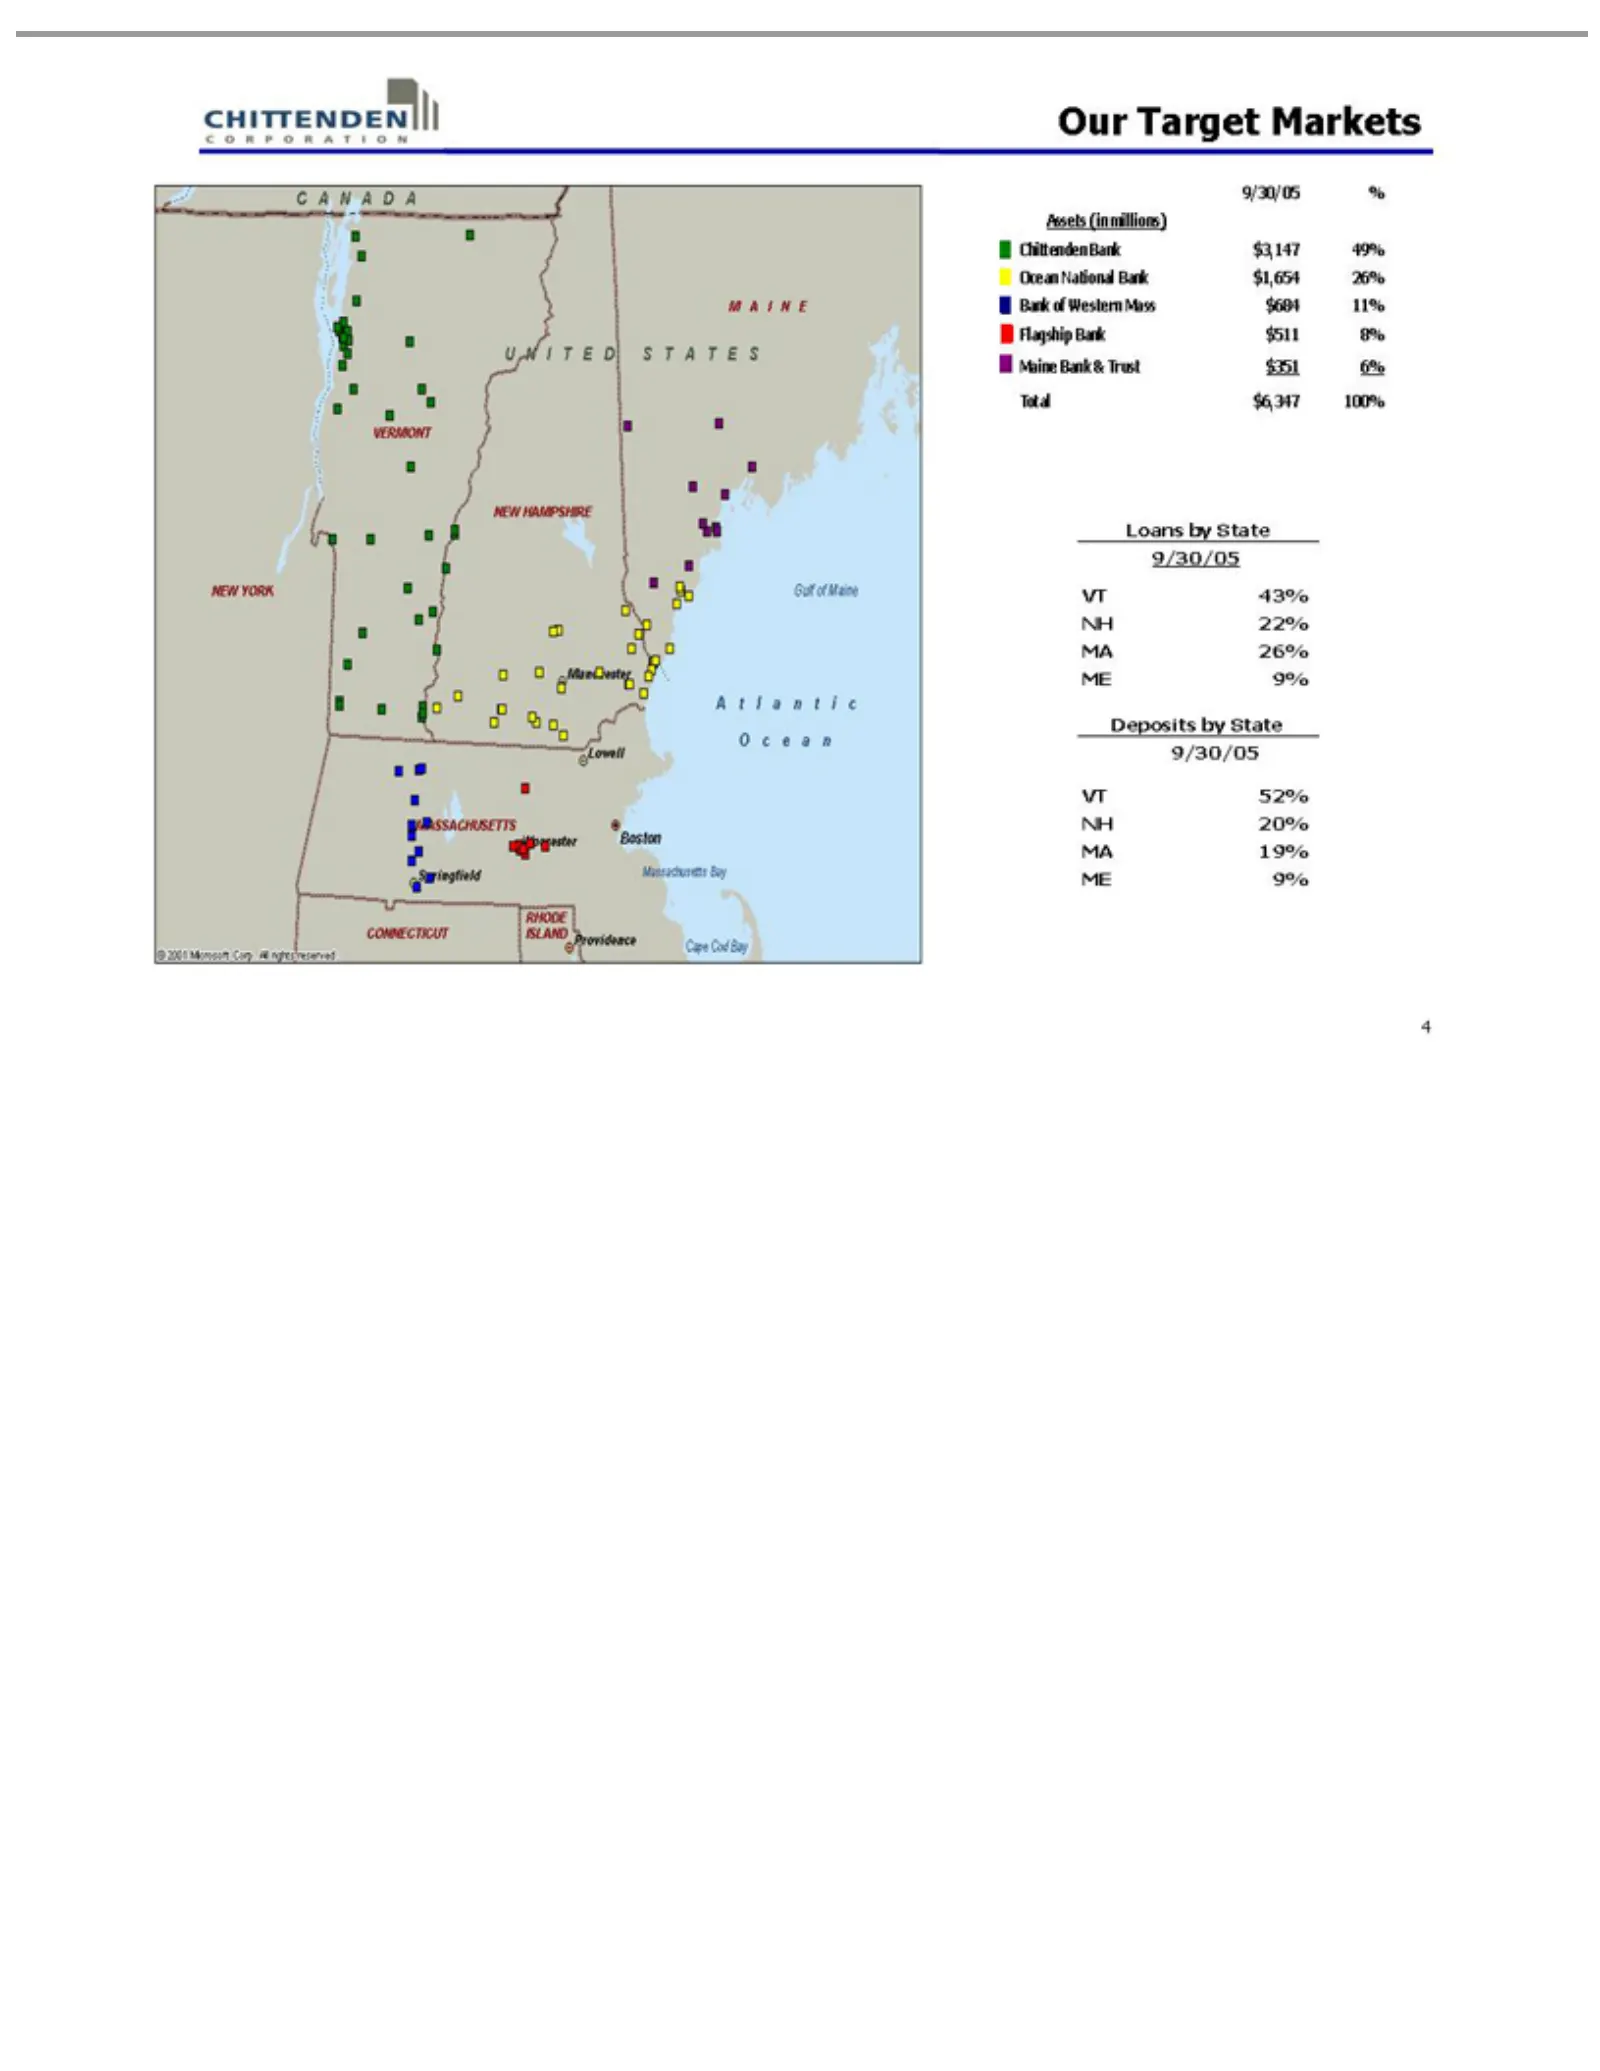
Slide 4: Our Target Markets
Our52% 9/30/05 Loans 100% Deposits VT CANADA 4 Target by%NH by State Assets MAINE Markets State 20% 9/30/05 (in 9/30/05 MA UNITED millions) 19% VT 43% ME STATES Chittenden 9% NH 22% VERMONT MA Bank26% $3,147 ME NEW 49% 9%YORK Ocean NEW National HAMPSHIRE Bank $1,654 CONNECTICUT 26% Bank of Western R
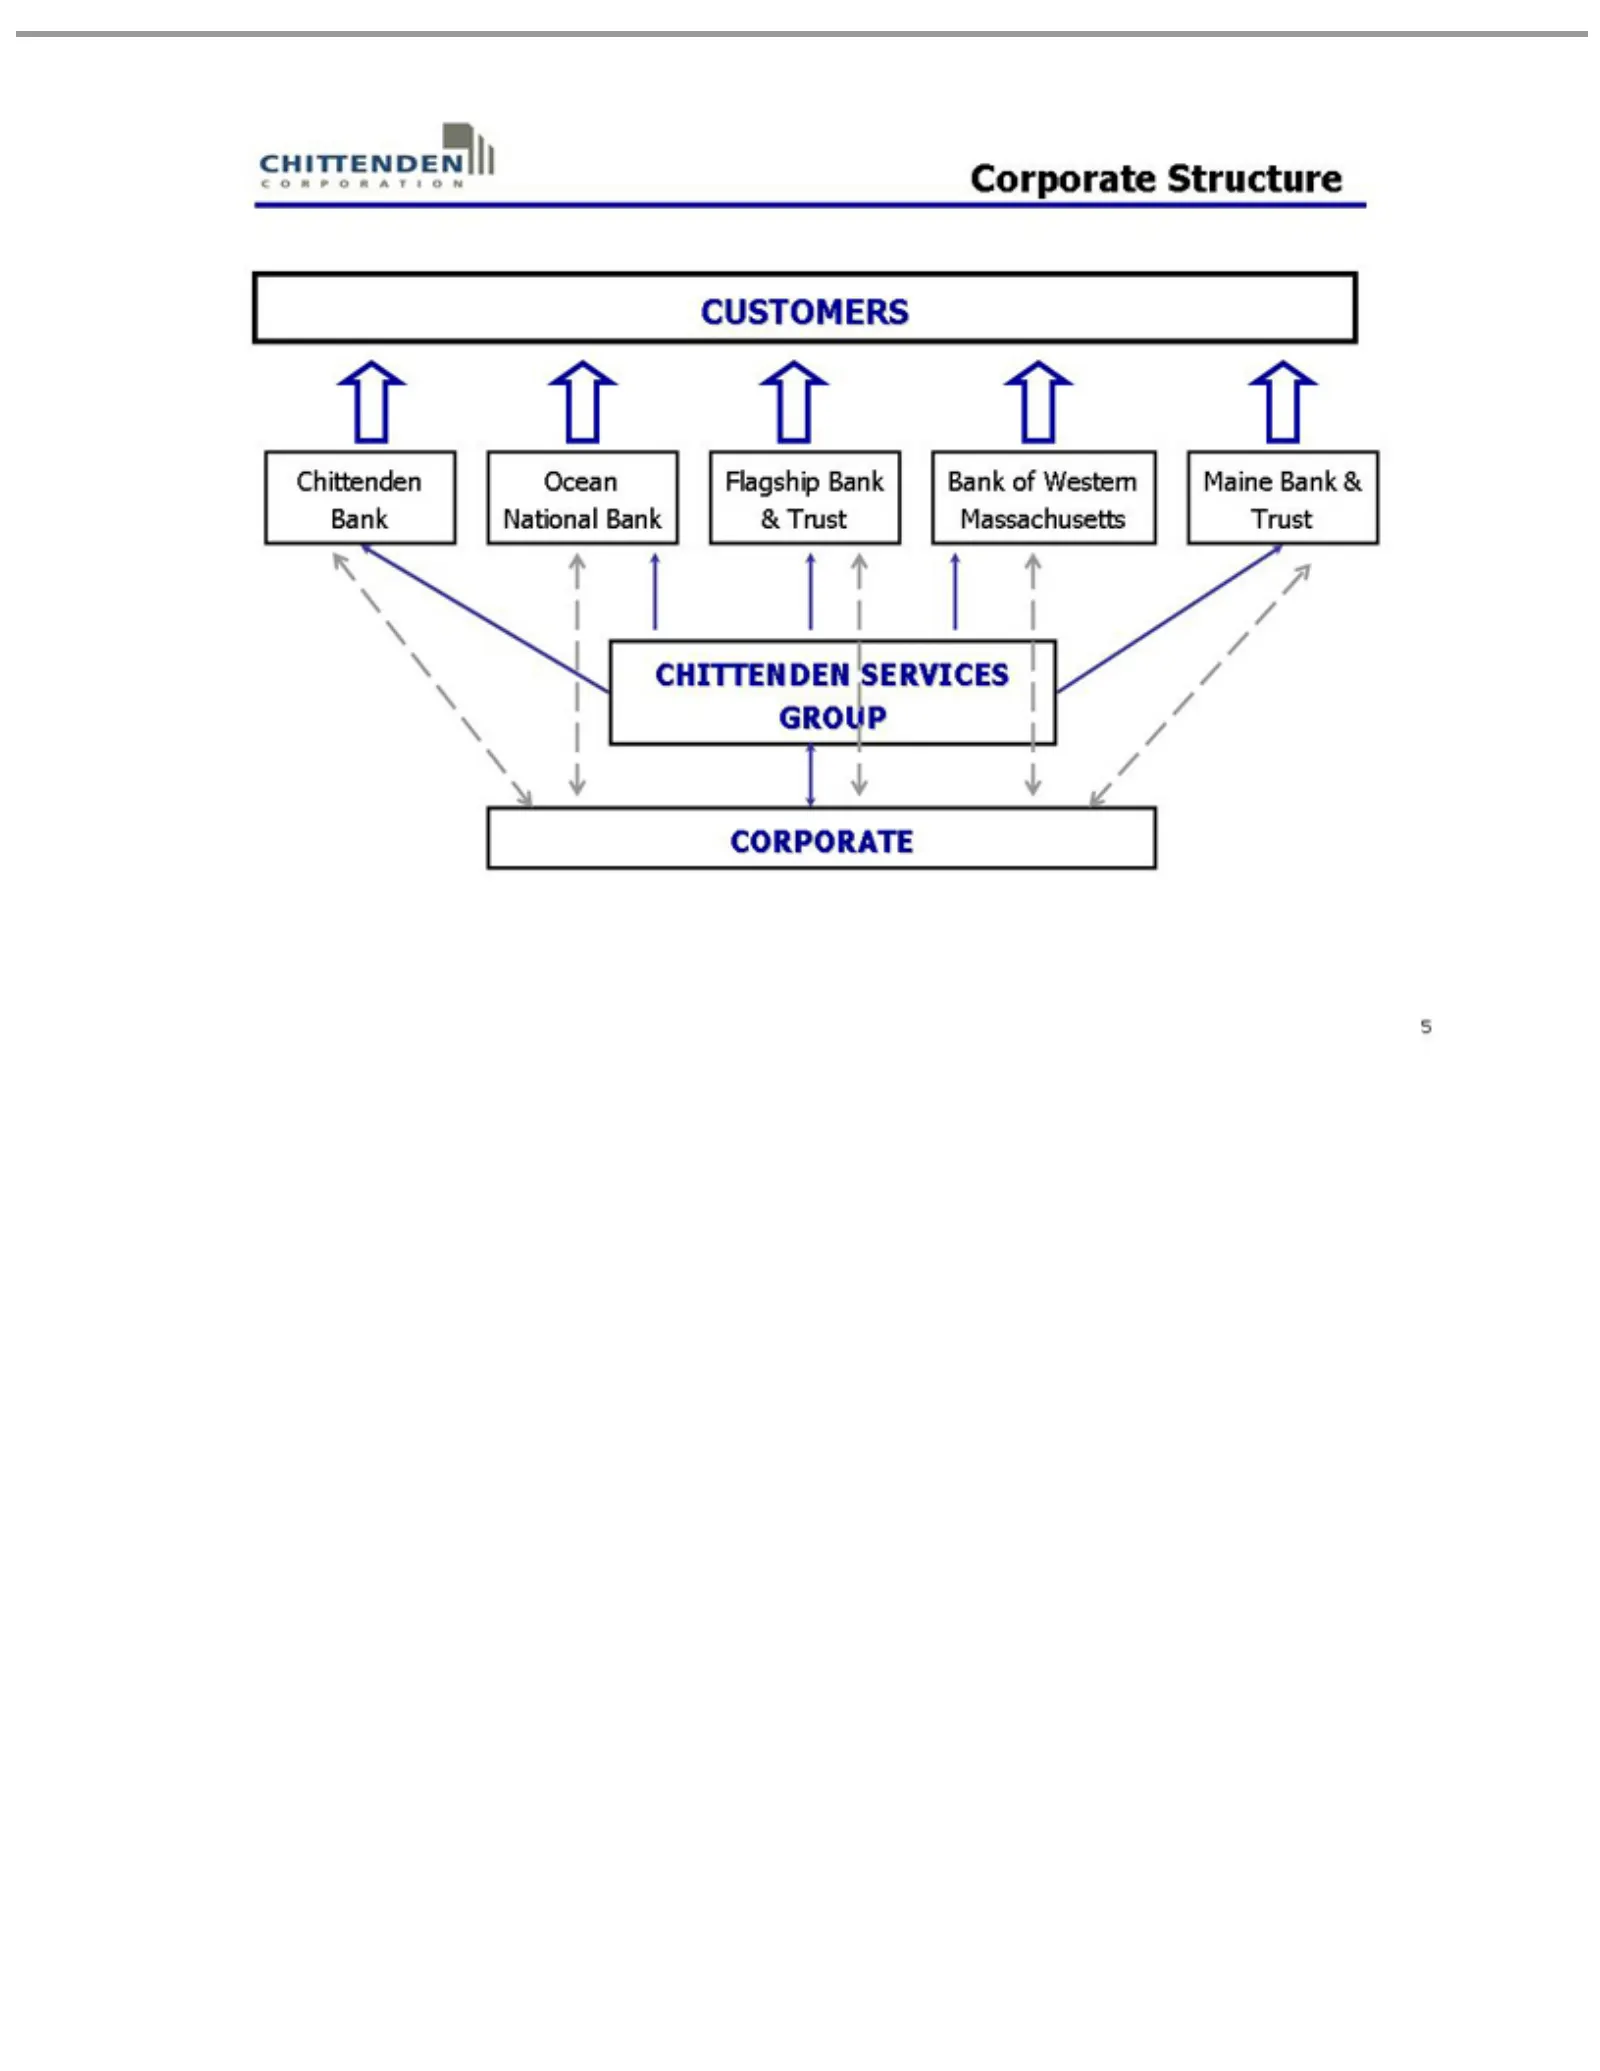
Slide 5: Corporate Structure
Corporate Chittenden CUSTOMERS Ocean Flagship Bank Maine CHITTENDEN 5 CORPORATE GROUP ofNational Bank Western Bank Structure Bank && Trust Bank SERVICES Massachusetts Trust
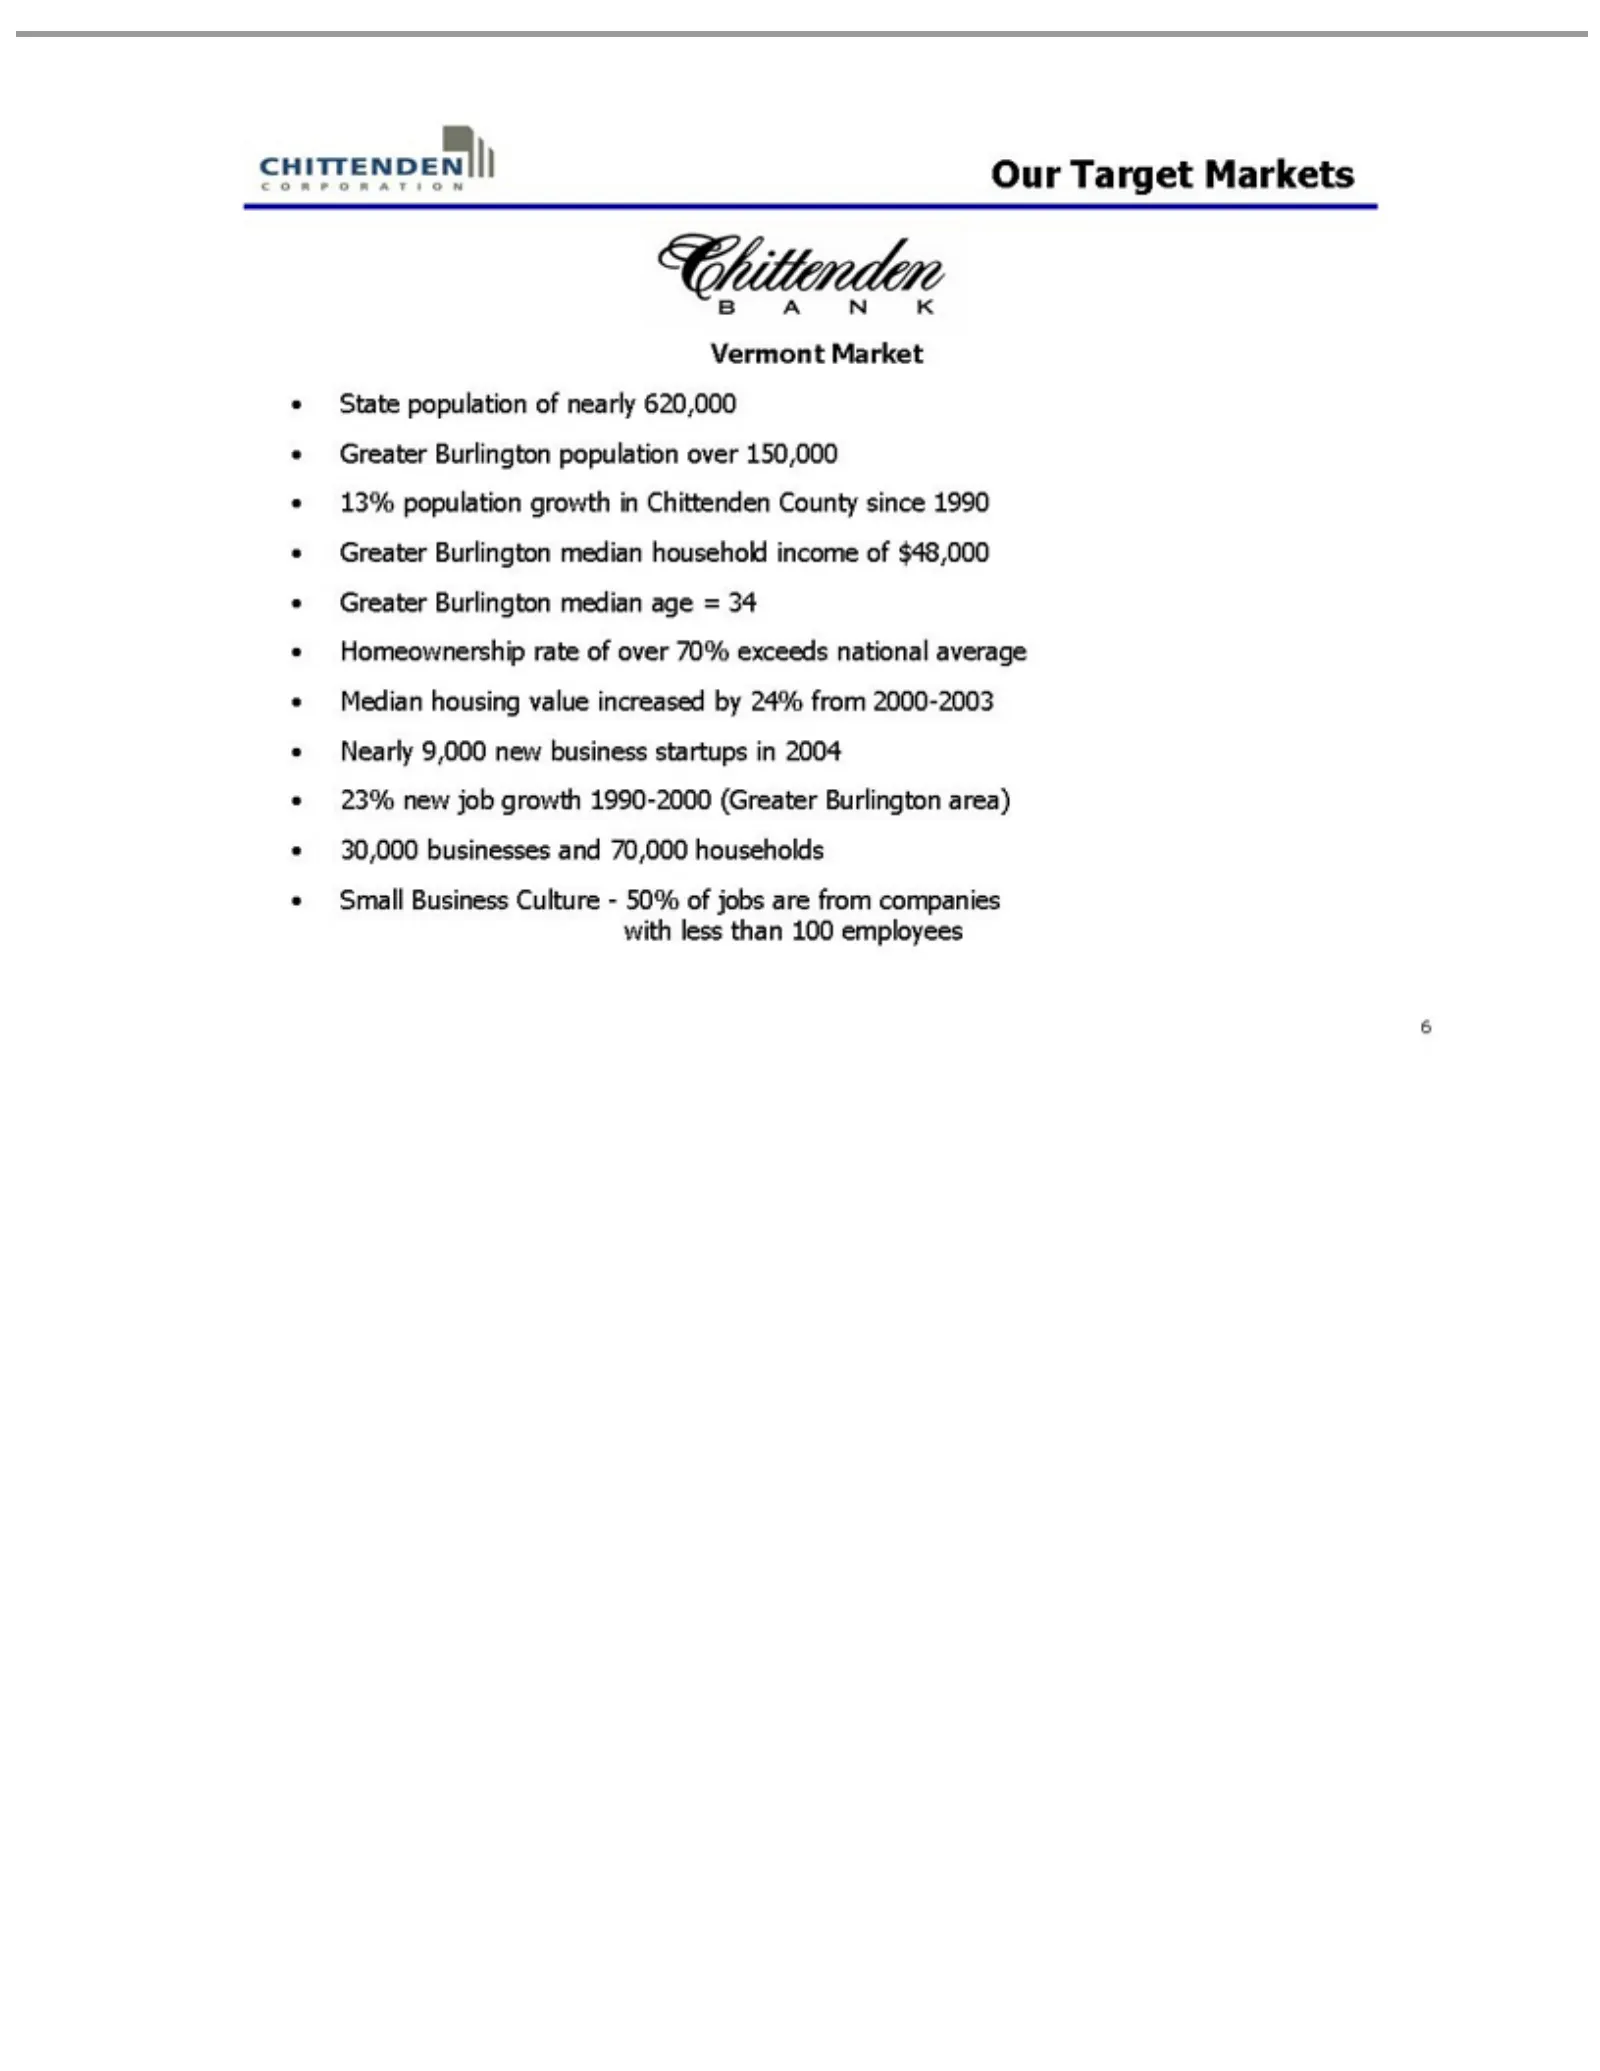
Slide 6: Our Target Markets: Vermont
Our 70,000 Vermont State Greater 13% national and 6 Target population population Burlington average Market Markets households growth of Median population nearly Small inhousing 620,000 Chittenden Business over value 150,000 County Culture—50% increased since by1990 24% of jobs Greater fromare 2000-2
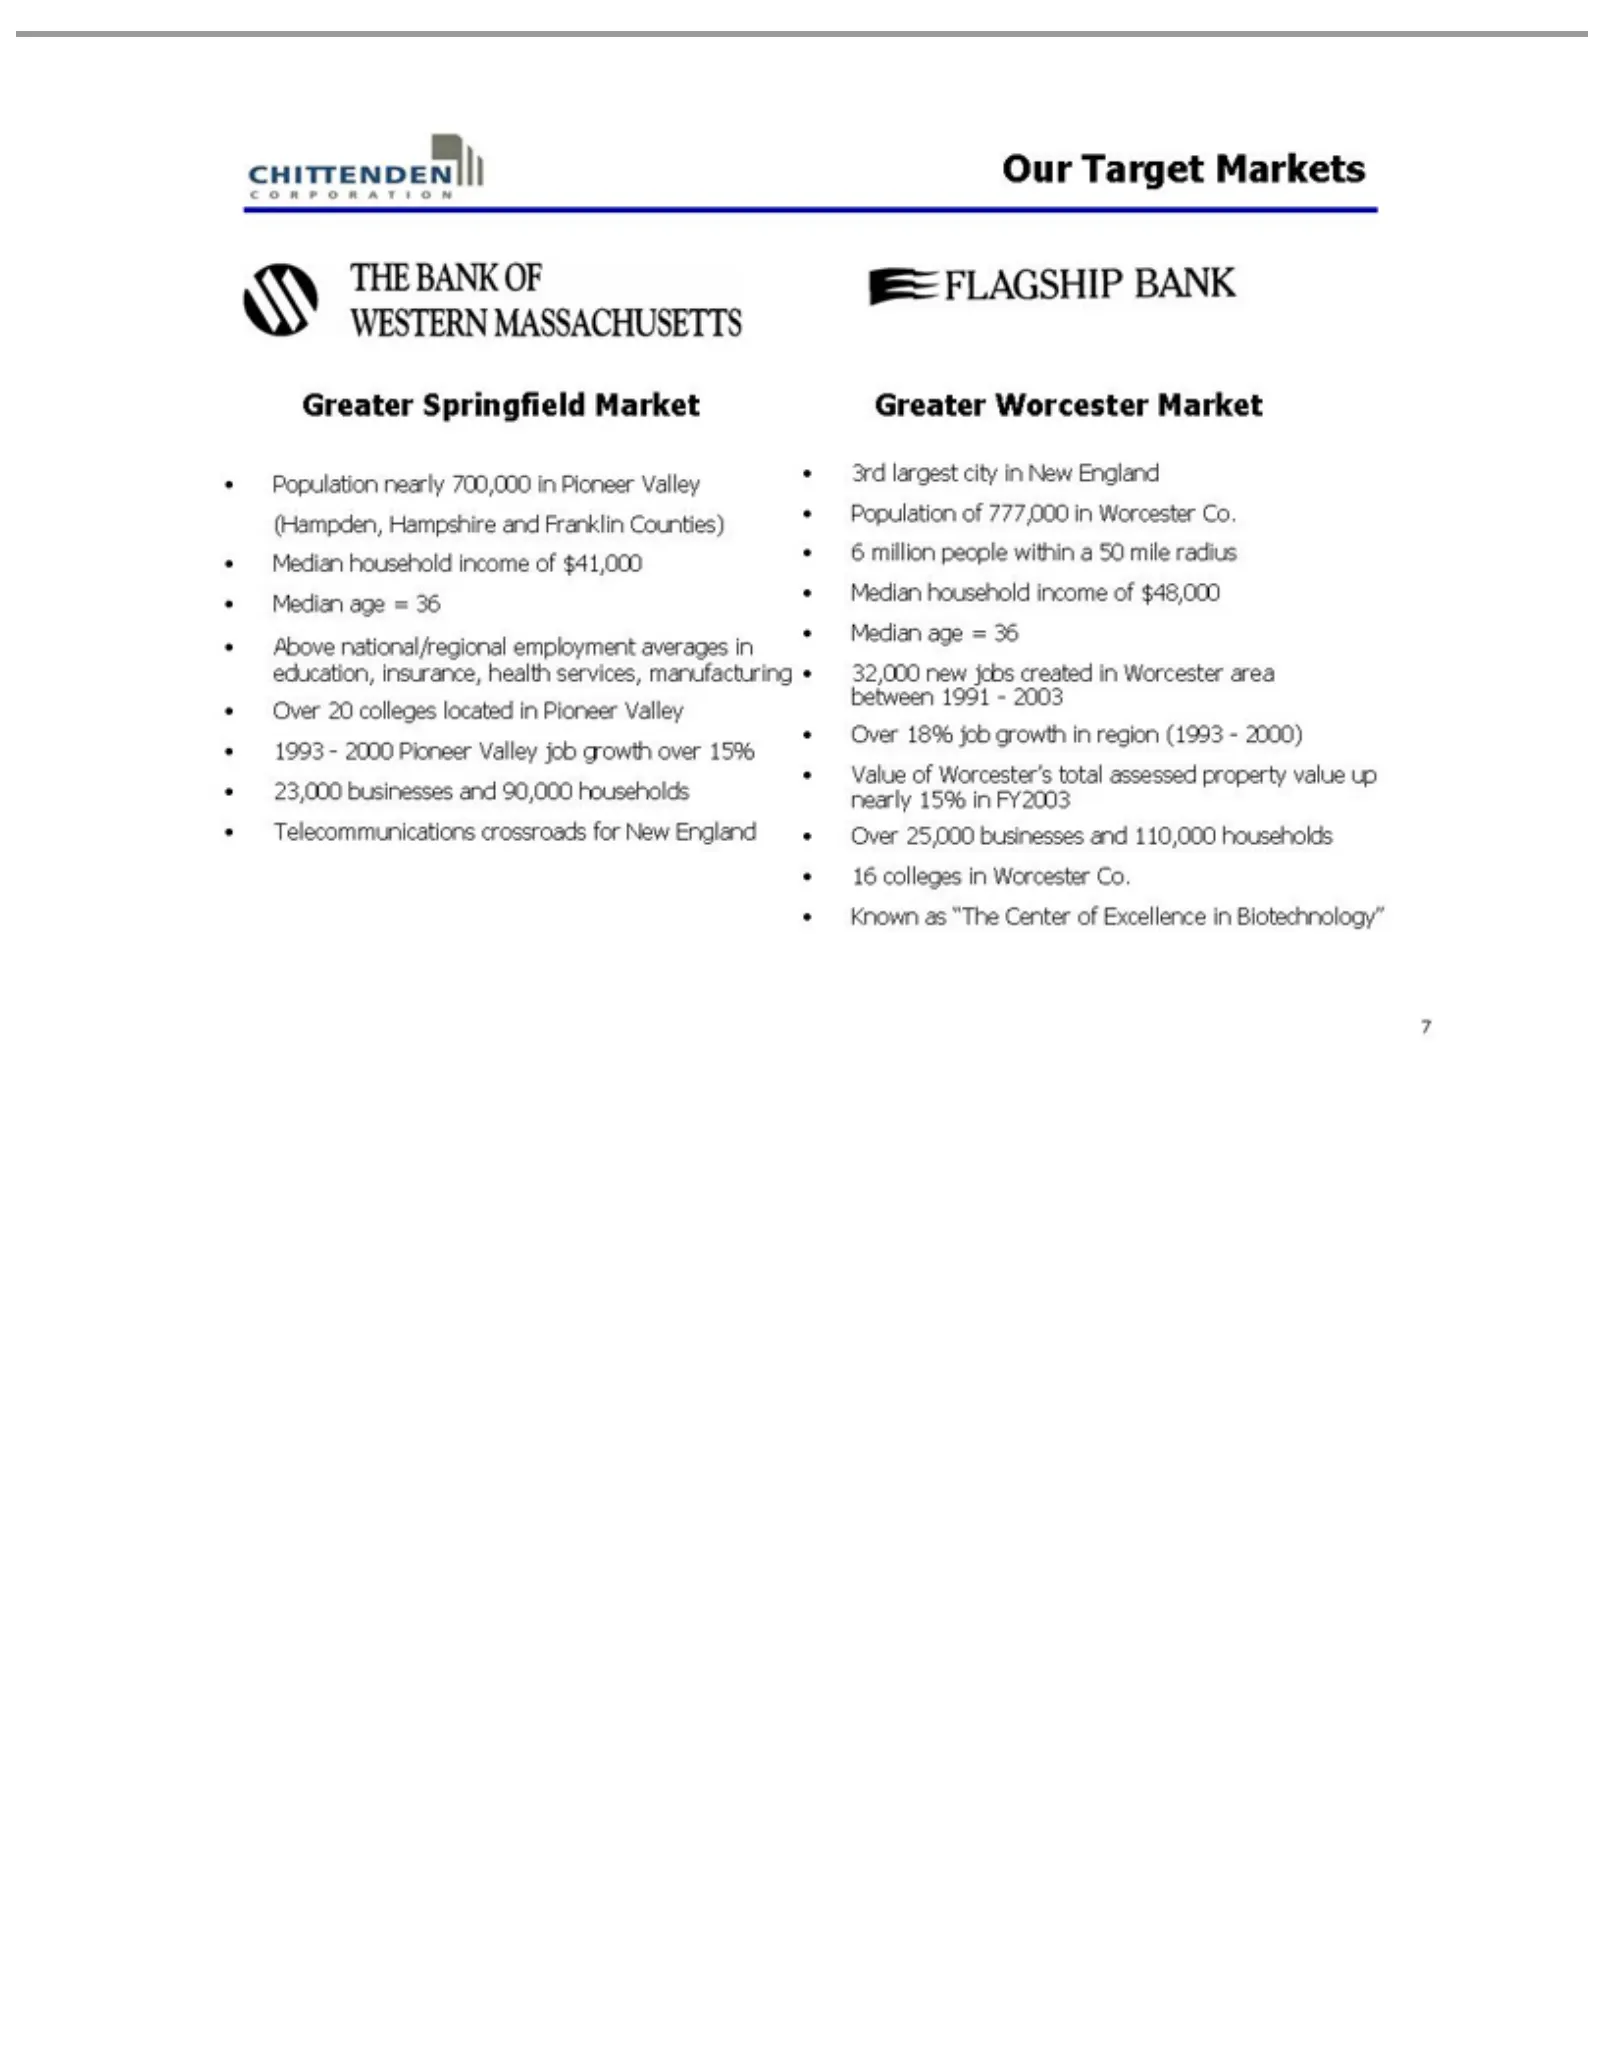
Slide 7: Our Target Markets: Massachusetts
Ourlargest Population education, Telecommunications Greater 3rd Worcester Value Known 7 Target ofas Worcester Springfield Worcester’s “The area insurance, city Markets nearly between inCenter New 700,000 Market Market crossroads total health England of1991—2003 Excellence assessed inservices, Pionee
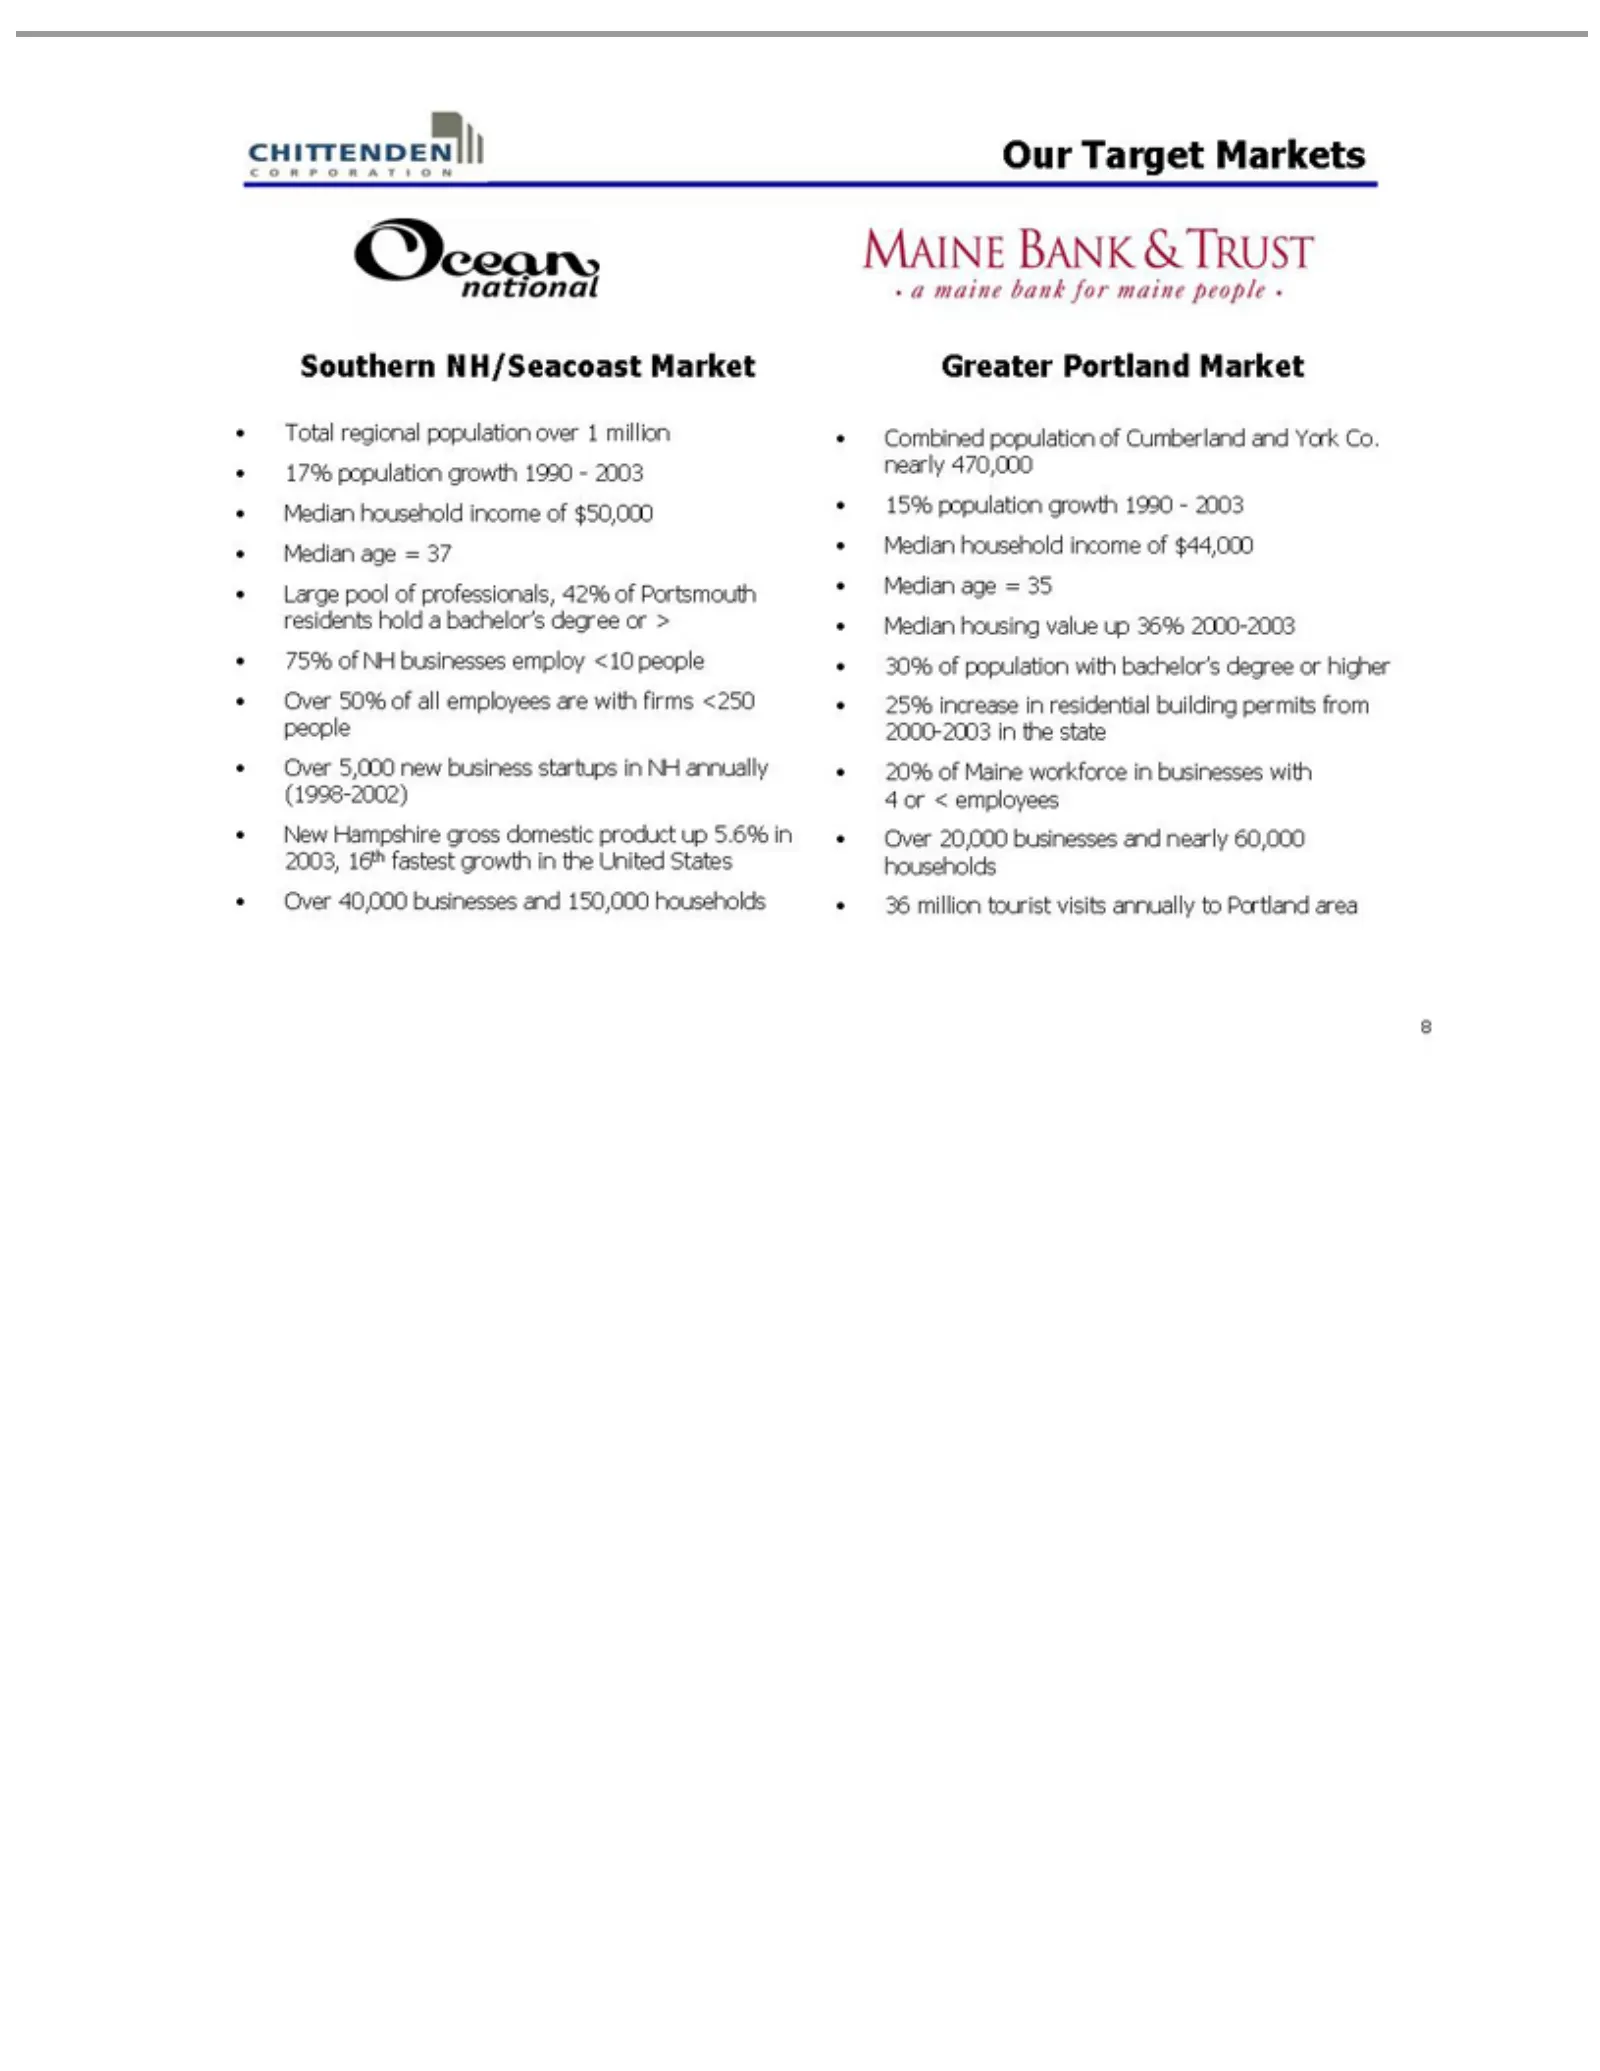
Slide 8: Our Target Markets: New Hampshire and Maine
Our Target Southern Total Large new Greater Combined 2003 20,000 8 business 30% regional pool businesses Portland NH/Seacoast of population Markets ofpopulation startups professionals, population Market andin of nearly Market with NH Cumberland over 42% annually 60,000 bachelor’s 1 million of Portsm
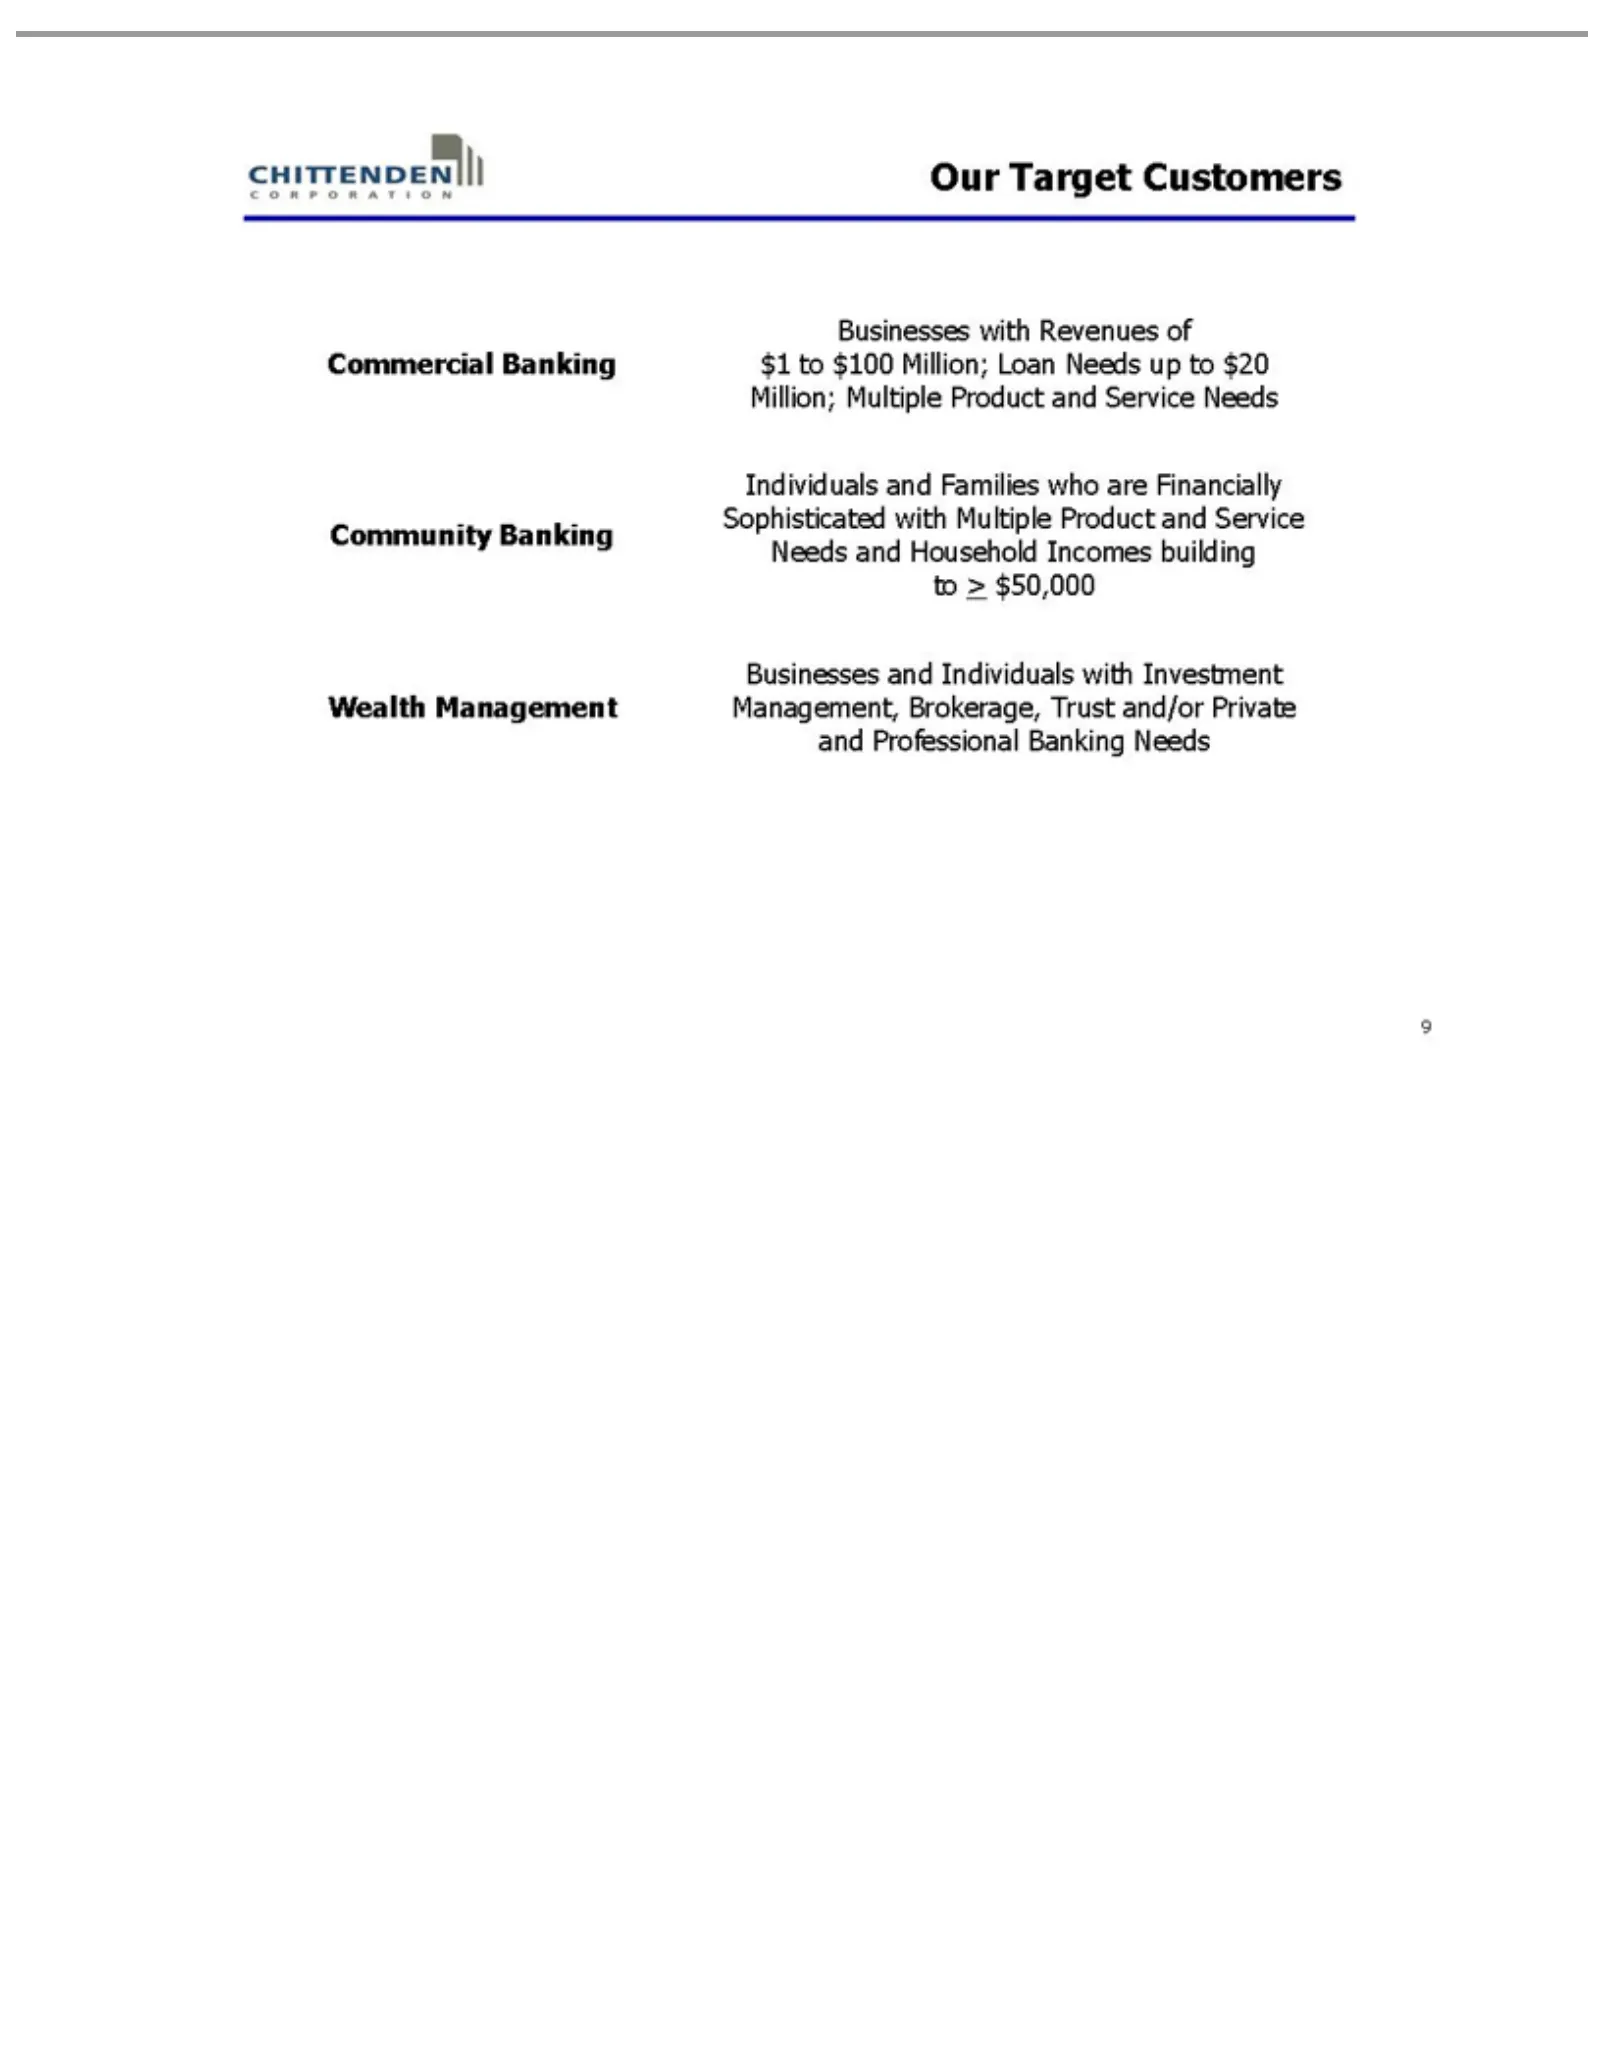
Slide 9: Our Target Customers
Our Target Commercial Community Individuals Wealth Businesses 9 Management Customers with and and Banking Banking Individuals Families Revenueswho of with $1 areInvestment toFinancially $100 Million; Management, Sophisticated Loan NeedsBrokerage, with upMultiple to $20 Trust Million; Product and/orM
Slide 10: Commercial & Community Banking
Commercial & Community Banking 10
Slide 11: A Diversified Loan Portfolio
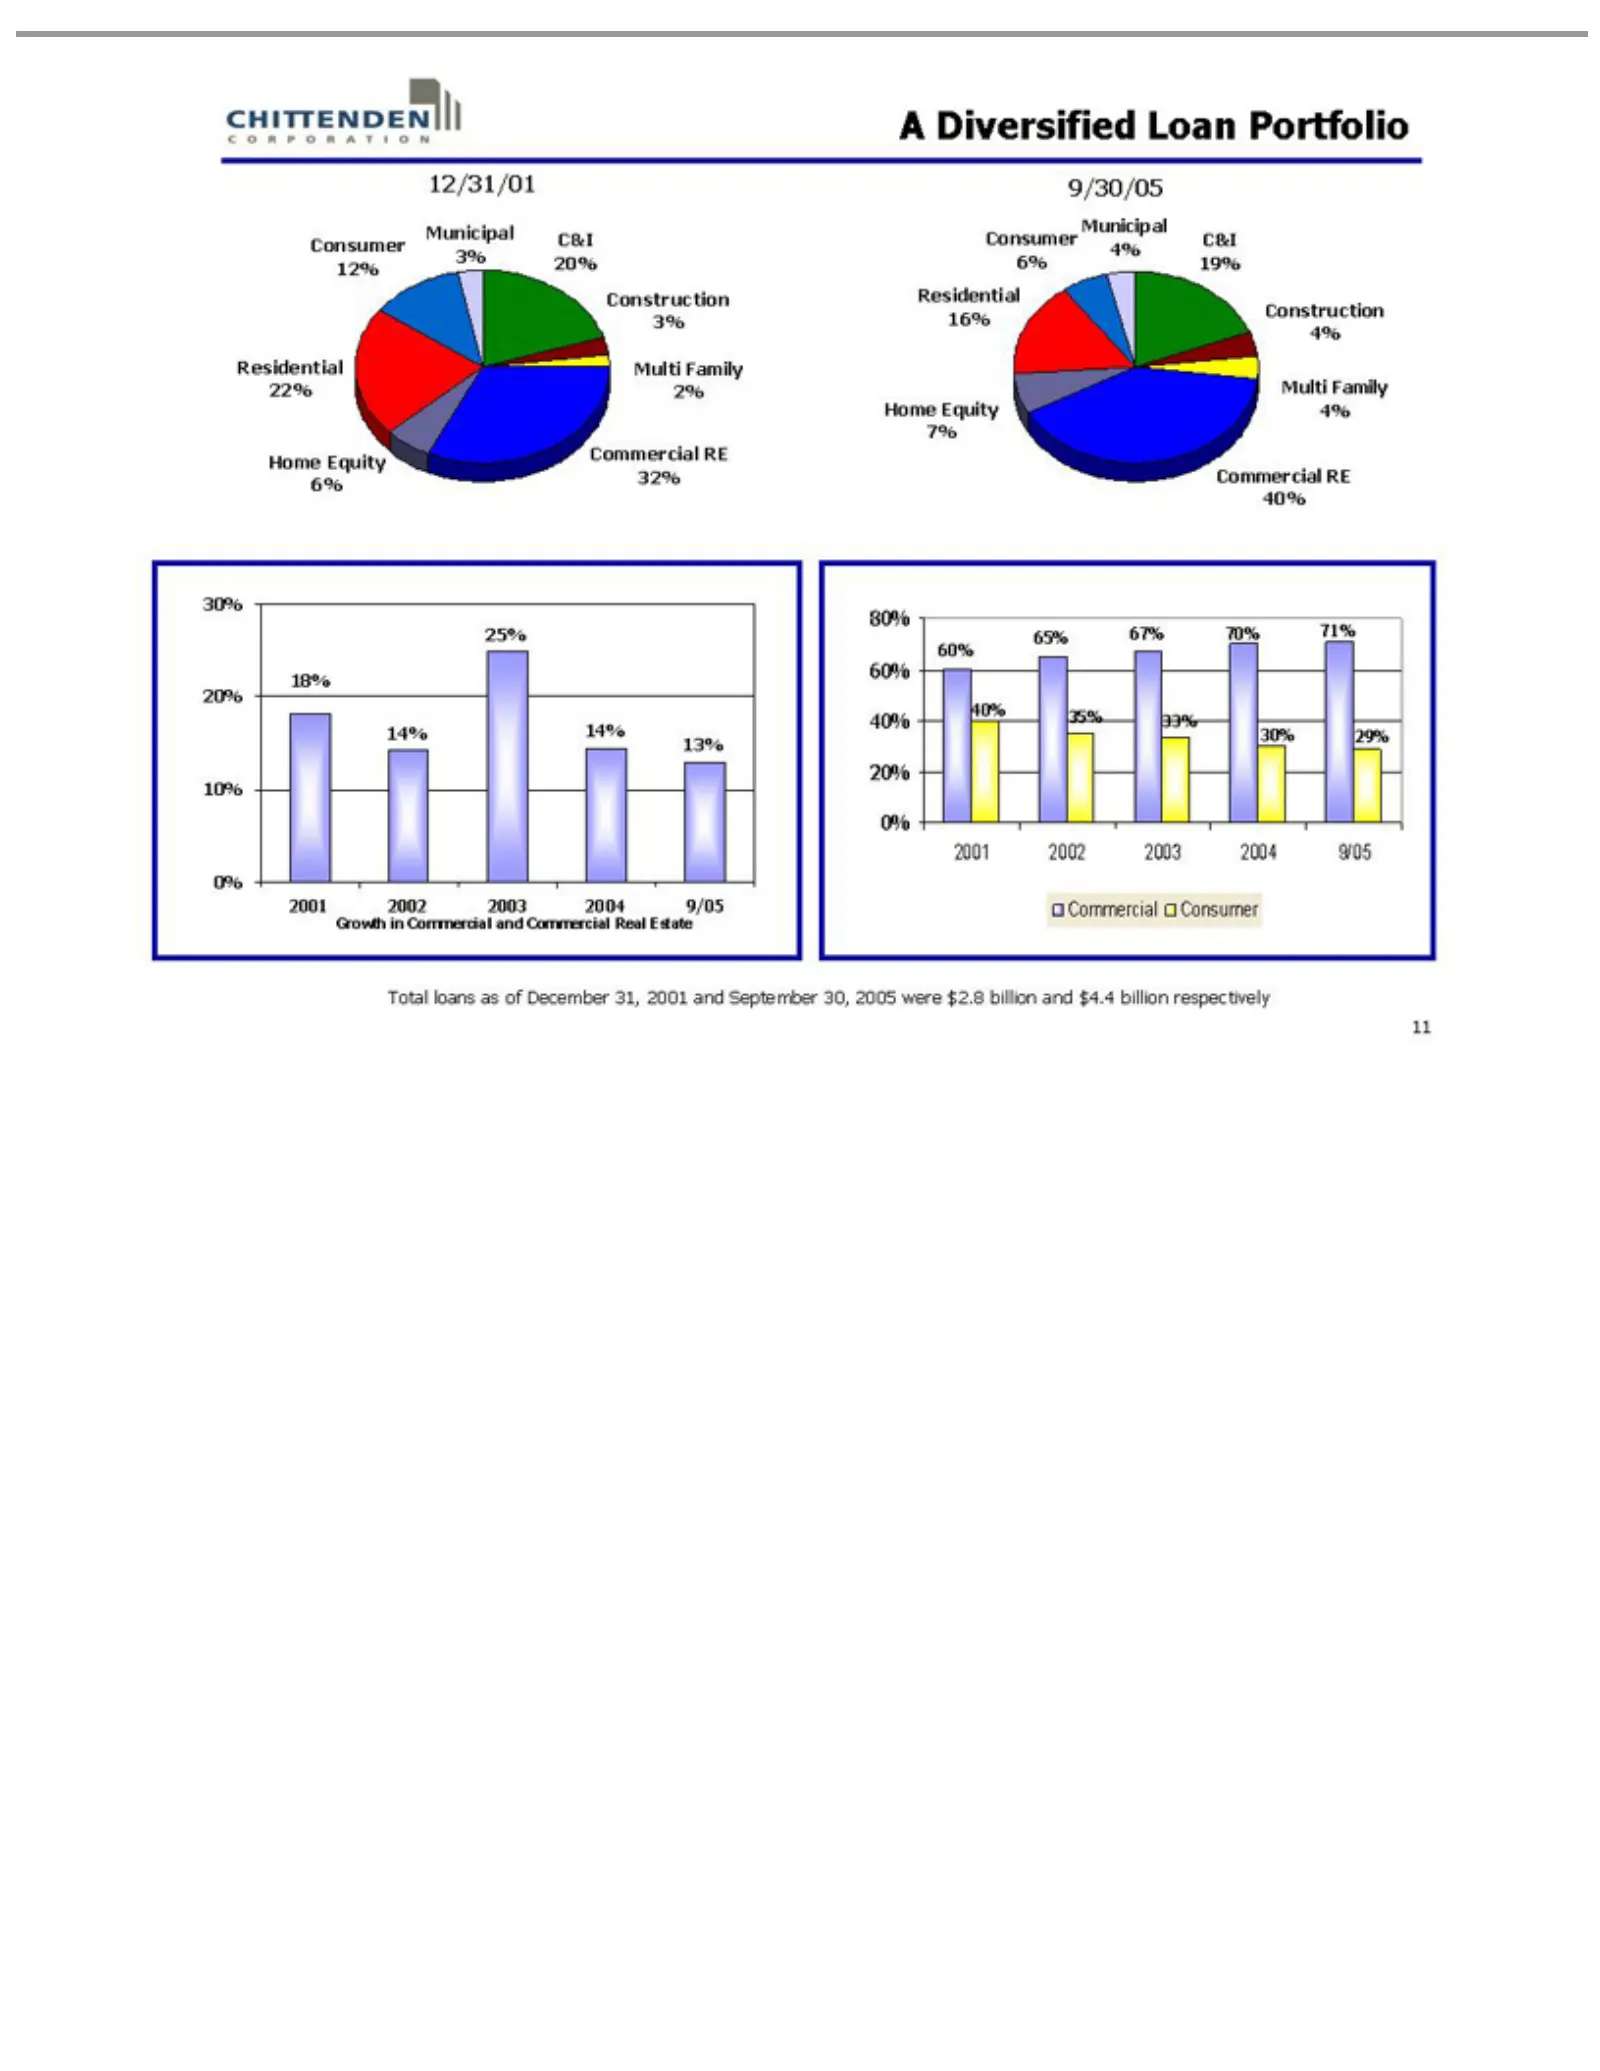
A Diversified 12/31/01 32% 14% 18% 25% 13% Growth C&I 9/30/05 Construction Multi Home Residential Municipal 80% 65% 40% 30% 33% 2001 Total Consumer Commercial 11 20% 19% 14% 60% 67% 35% 29% 2002 loans Family Equity in 70% 10% 40% Commercial 3% 4% 12% 6% 2003 as 22% 16% RE 3% 4% 2% 4% 6% 7% Loan of71
Slide 12: Commercial Loan Diversification by Industry
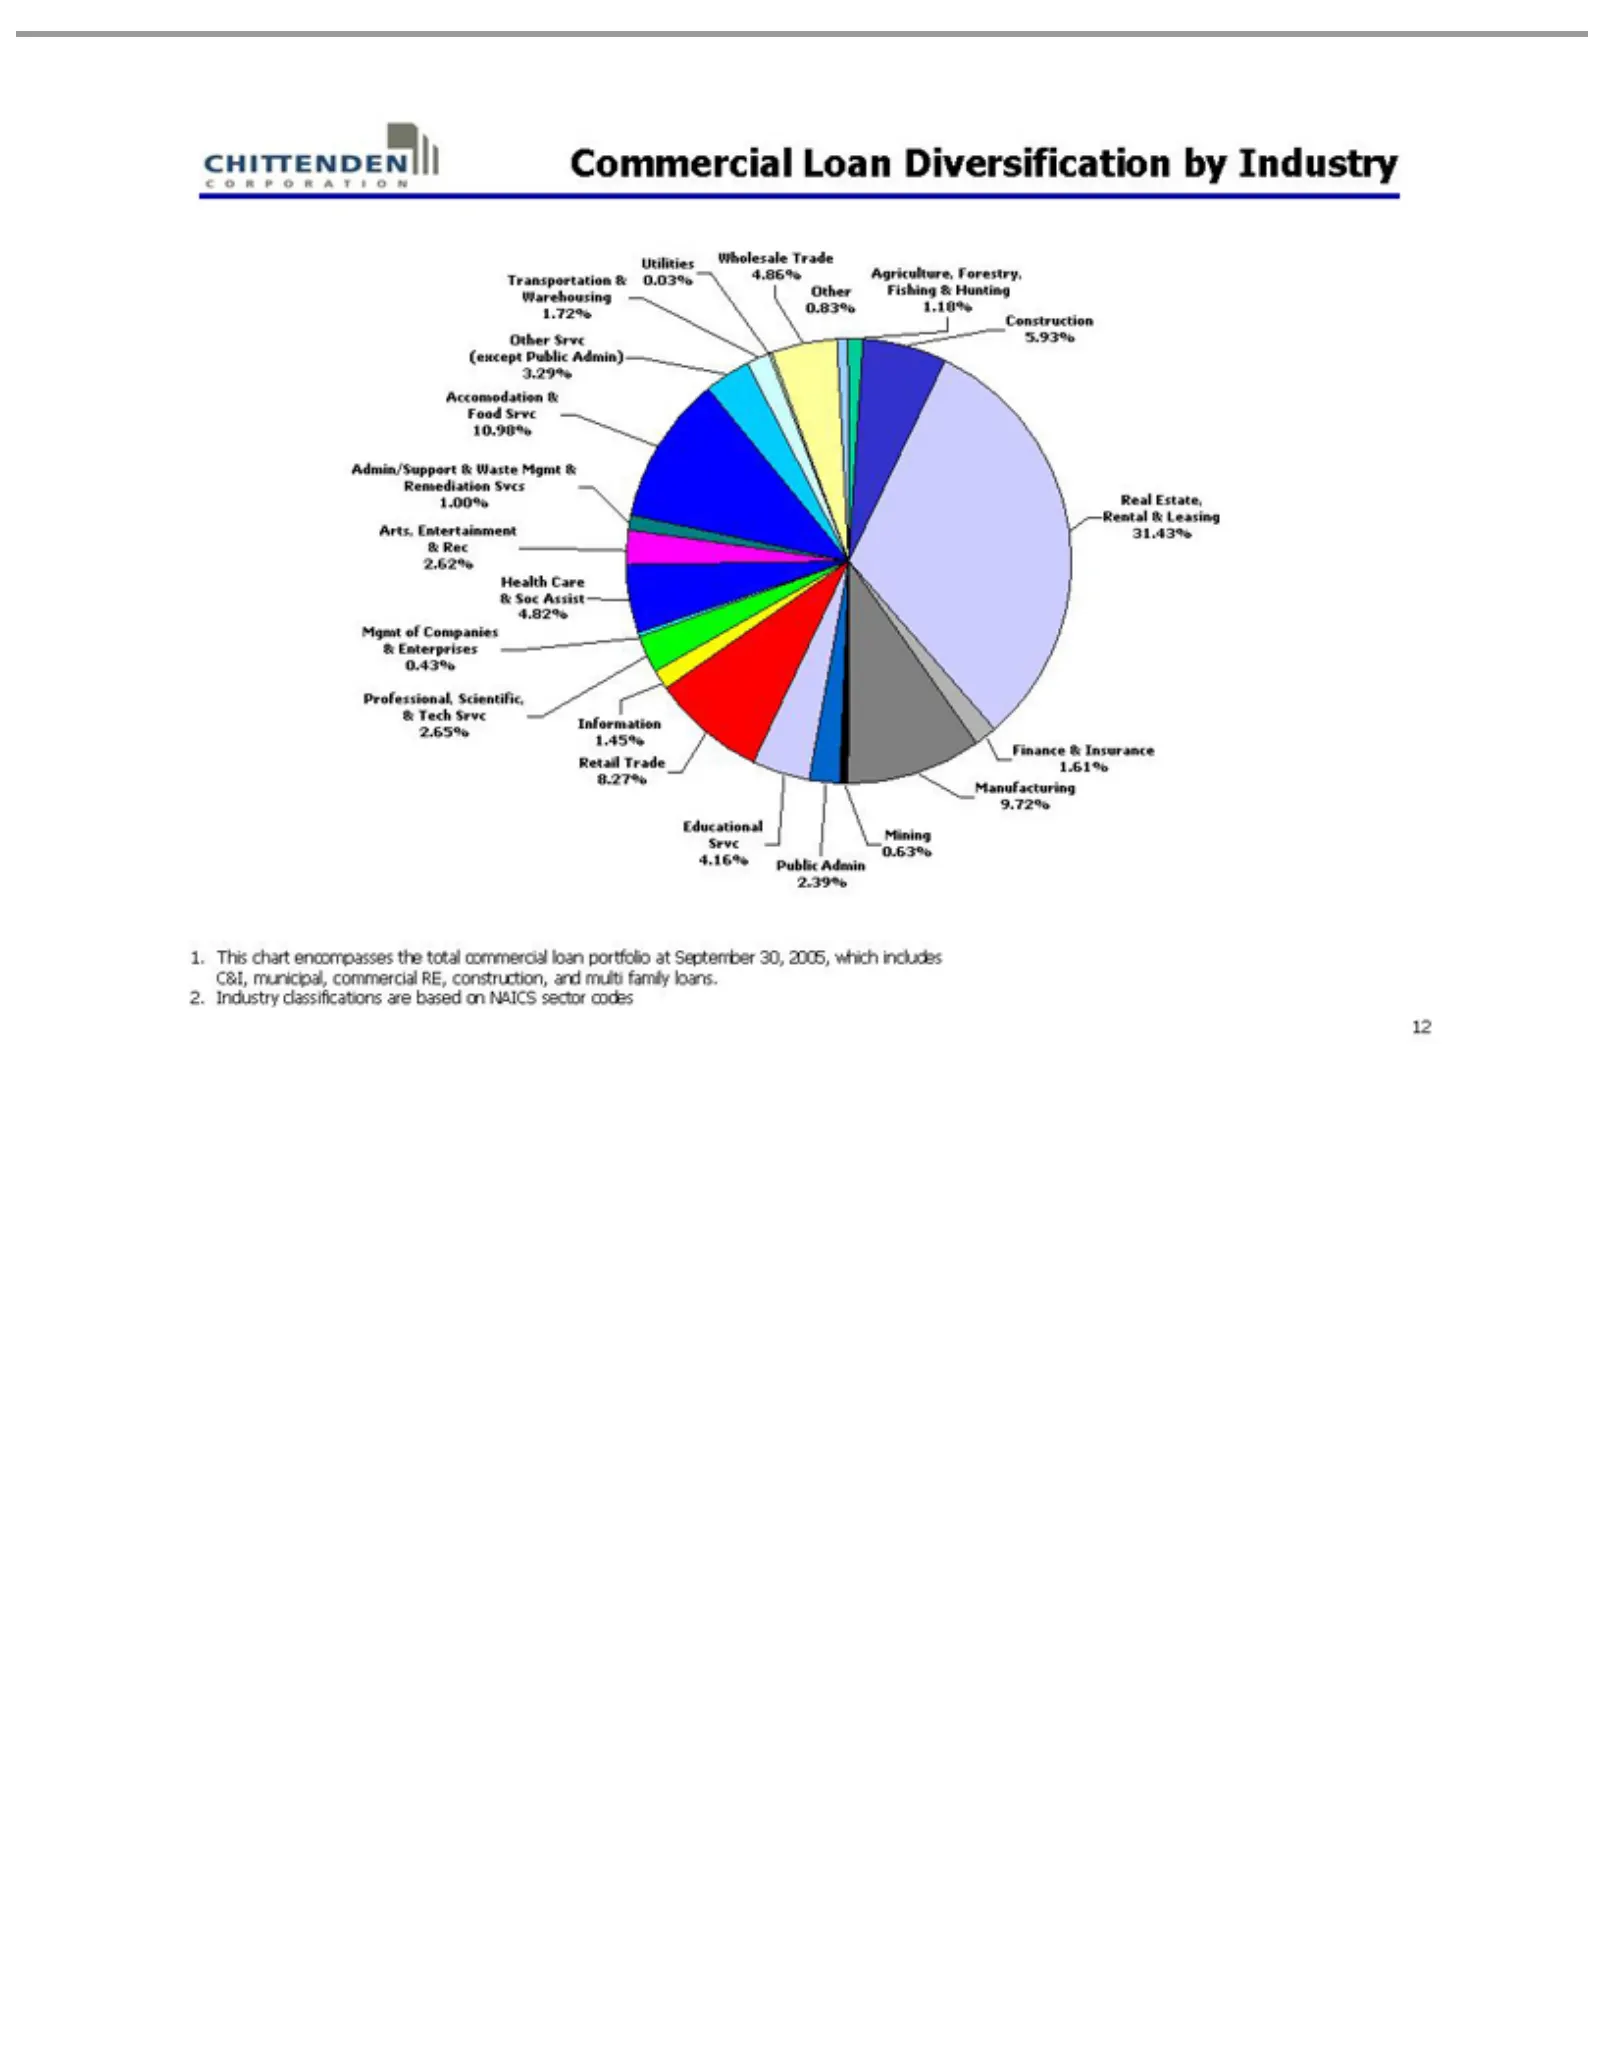
Commercial Agriculture, Construction Real Finance Manufacturing Mining Public Educational Information Retail Professional, Mgmt Health Arts, & Admin/Support Remediation Accomodation Food Transportation Warehousing Utilities Wholesale Other 1. 2. 12 This Industry Enterprises RecEstate, Entertainment
Slide 13: Commercial Real Estate Diversification
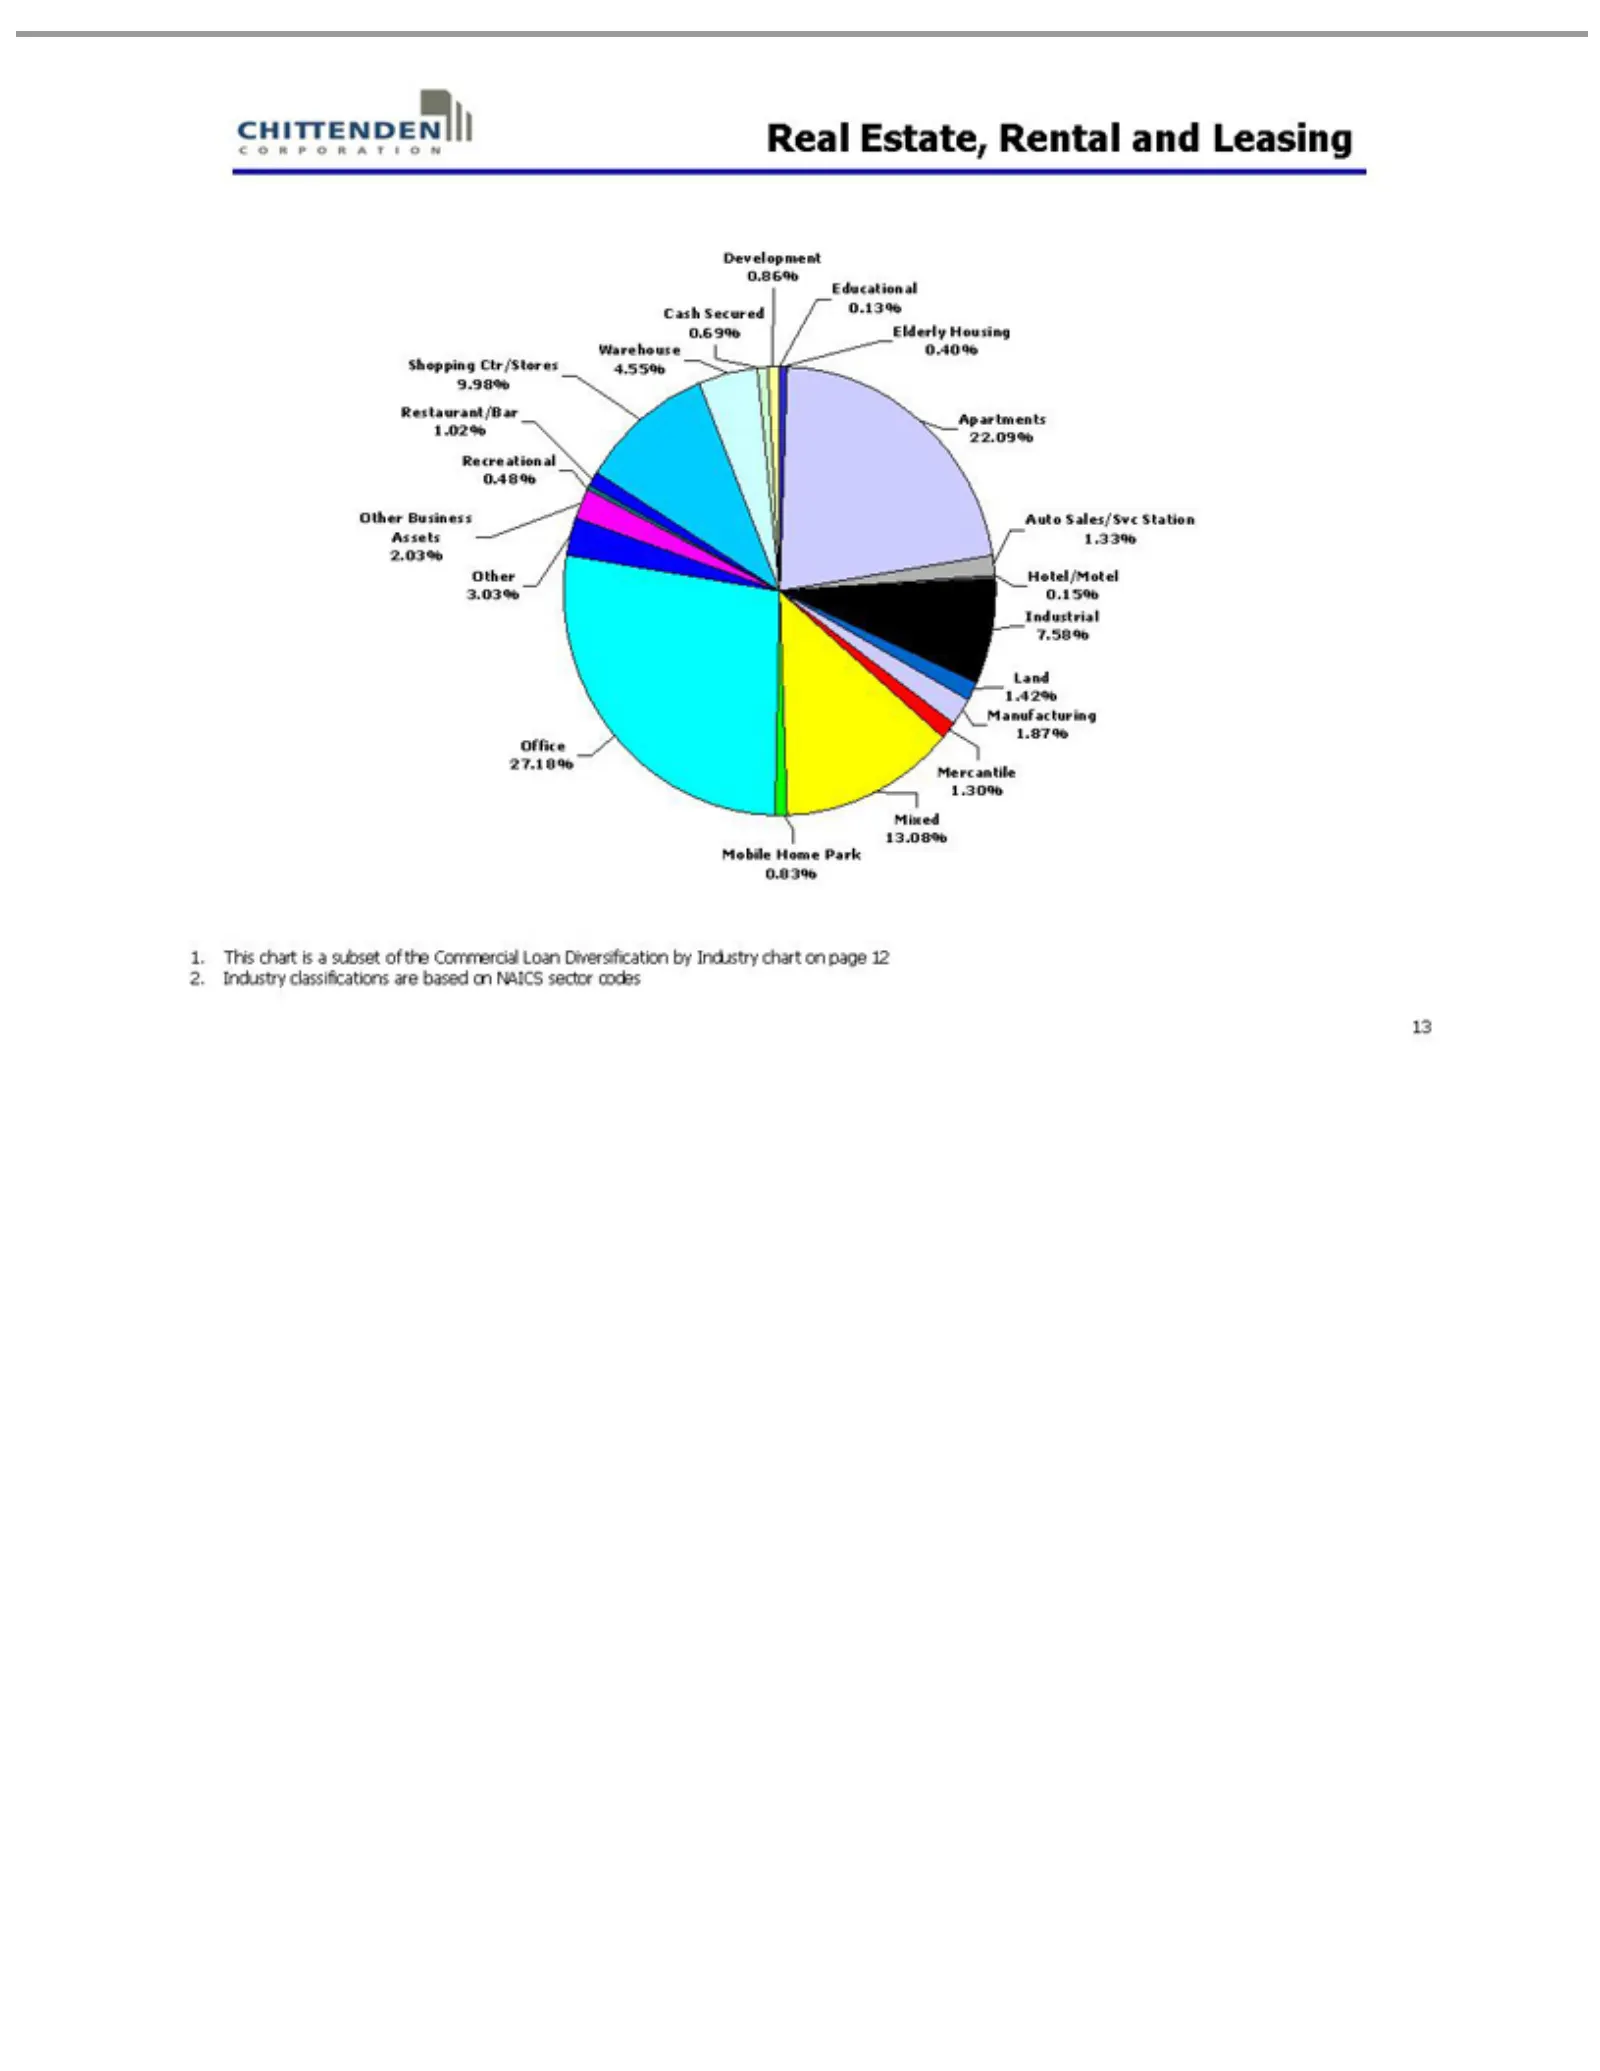
Real Development Educational Elderly A Auto Hotel/Motel Industrial Land Mercantile Mixed Mobile Office Other Recreational Restaurant/Bar Shopping Warehouse Cash 1. 2. 13 partments This Industry Estate, Sales/Svc Secured 1.42% 3.03% Business 27.18% 13.08% chart Home Housing 7.58% Ctr/Stores 1.30% cla
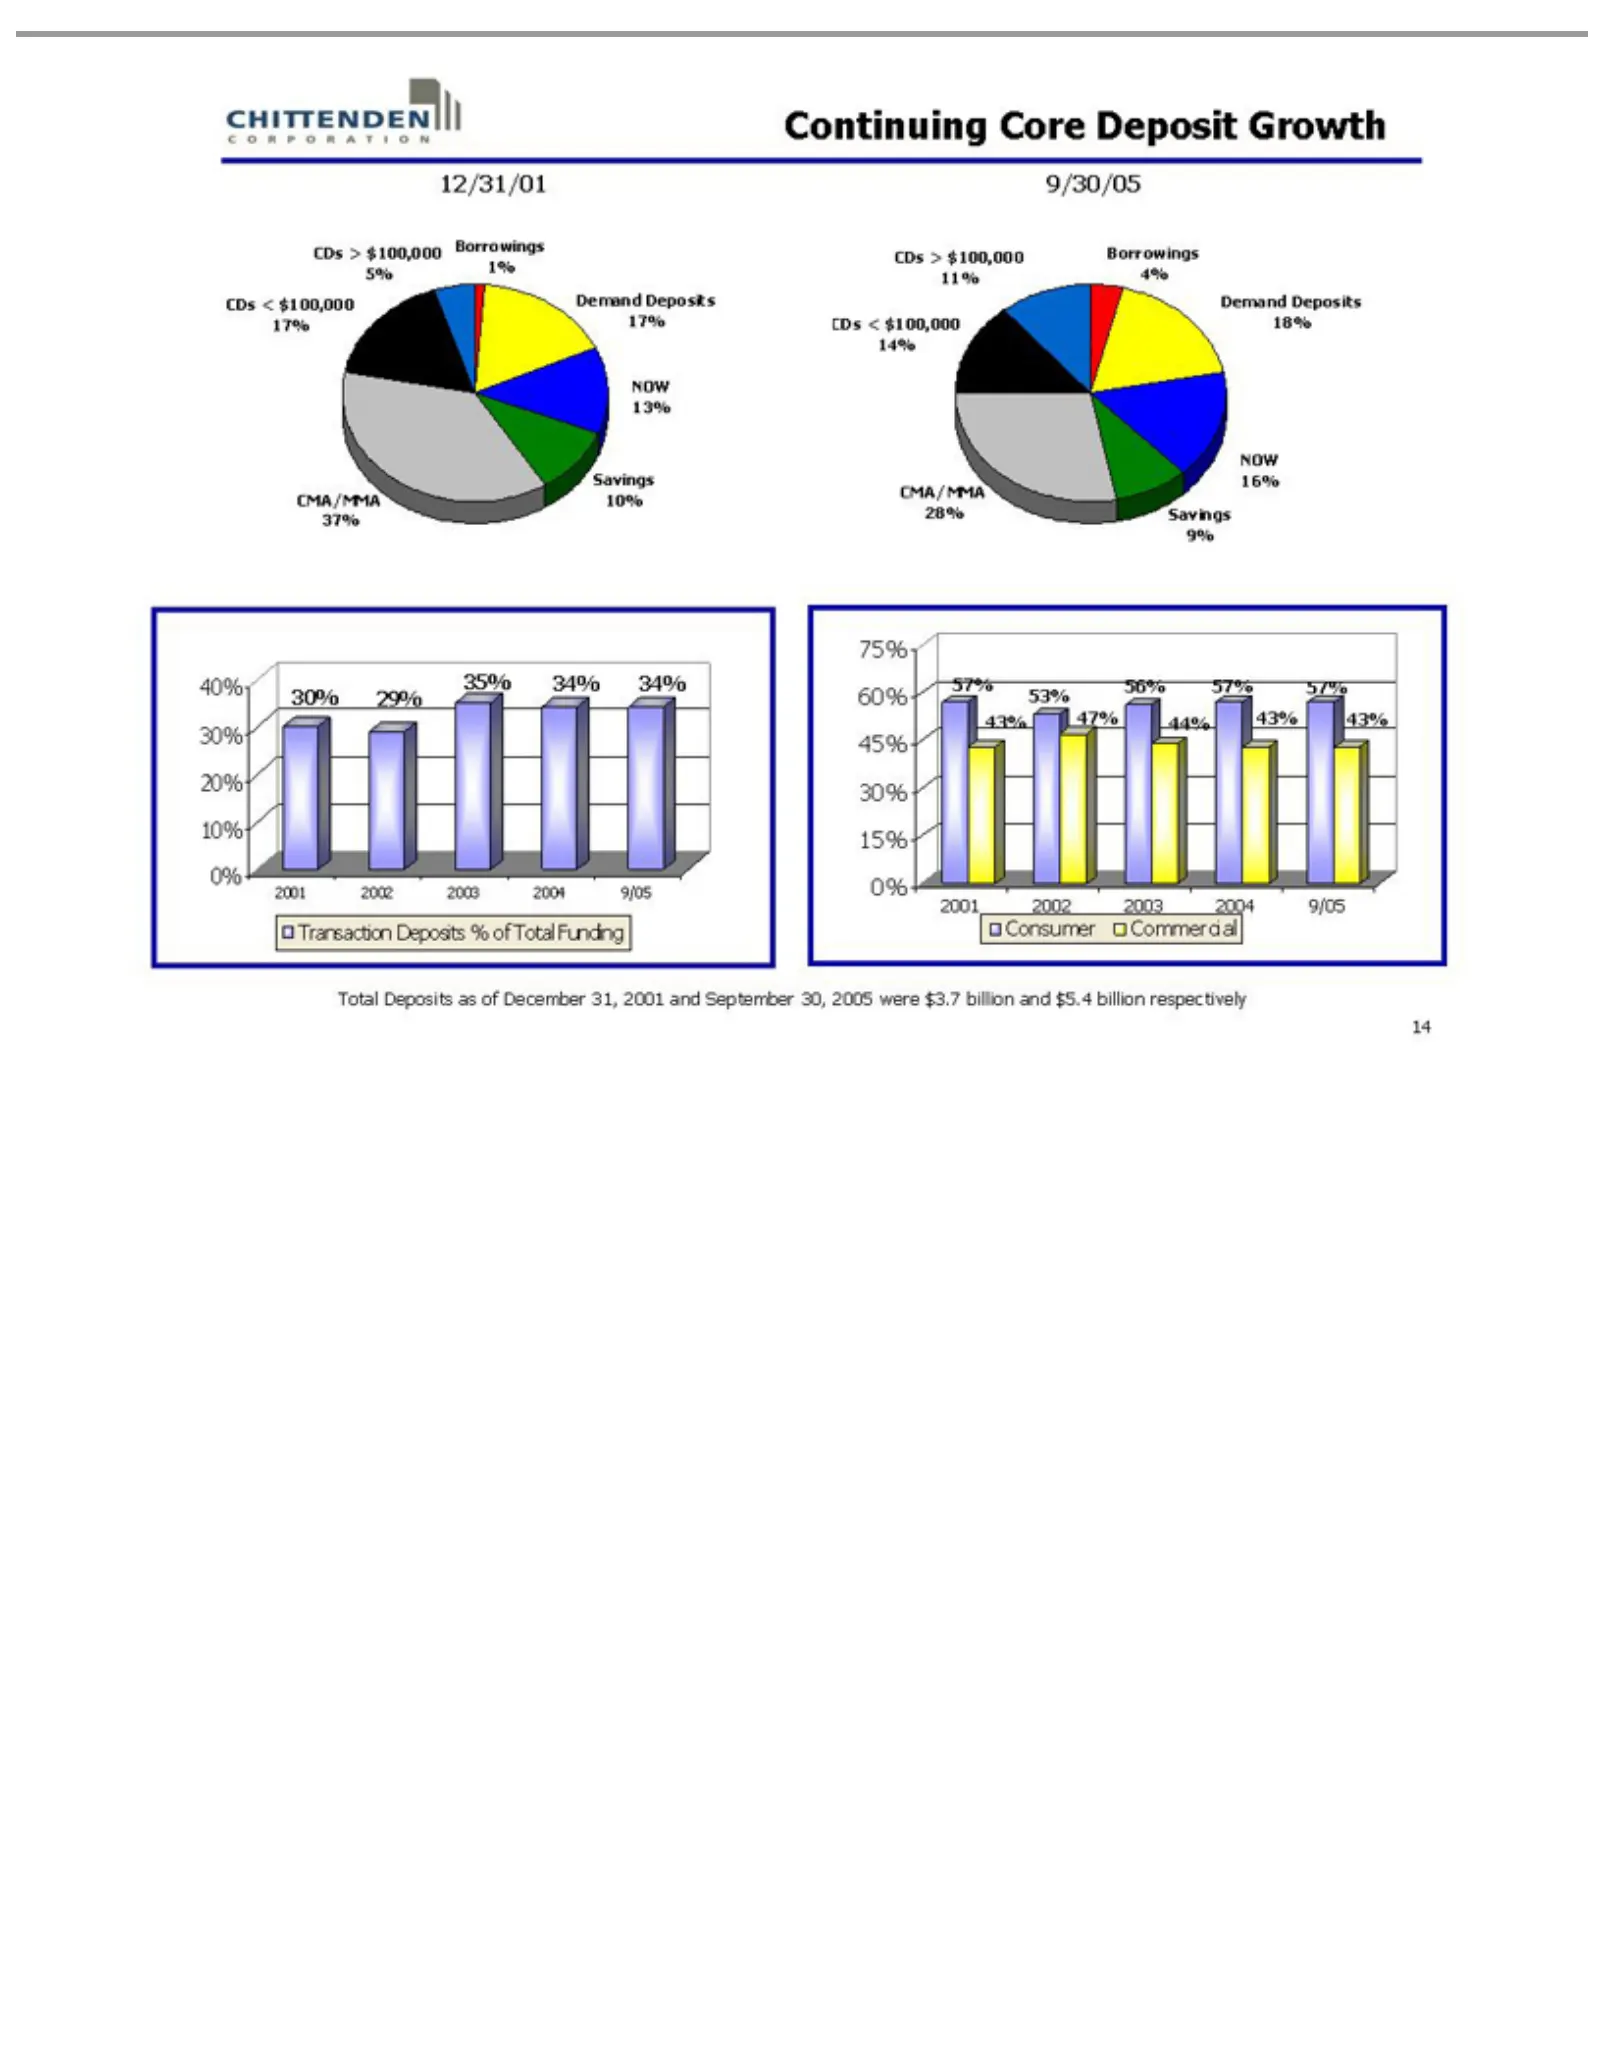
Slide 14: Continuing Deposit Growth
Continuing 12/31/01 37% Borrowings 9/30/05 Demand NOW Savings 28% CMA/MMA CDs 40% 35% Transaction 75% 57% 2001 Total Commercial Consumer 14 < >30% 34% 60% 56% 2002 Deposits 13% 16% $100,000 10% 9% Deposits 20% 34% 45% 57% 2003 Core Deposits 1%as 4% 10% 30% 57% 2004 17% 5% 14% 11% Deposit of 17% 18%
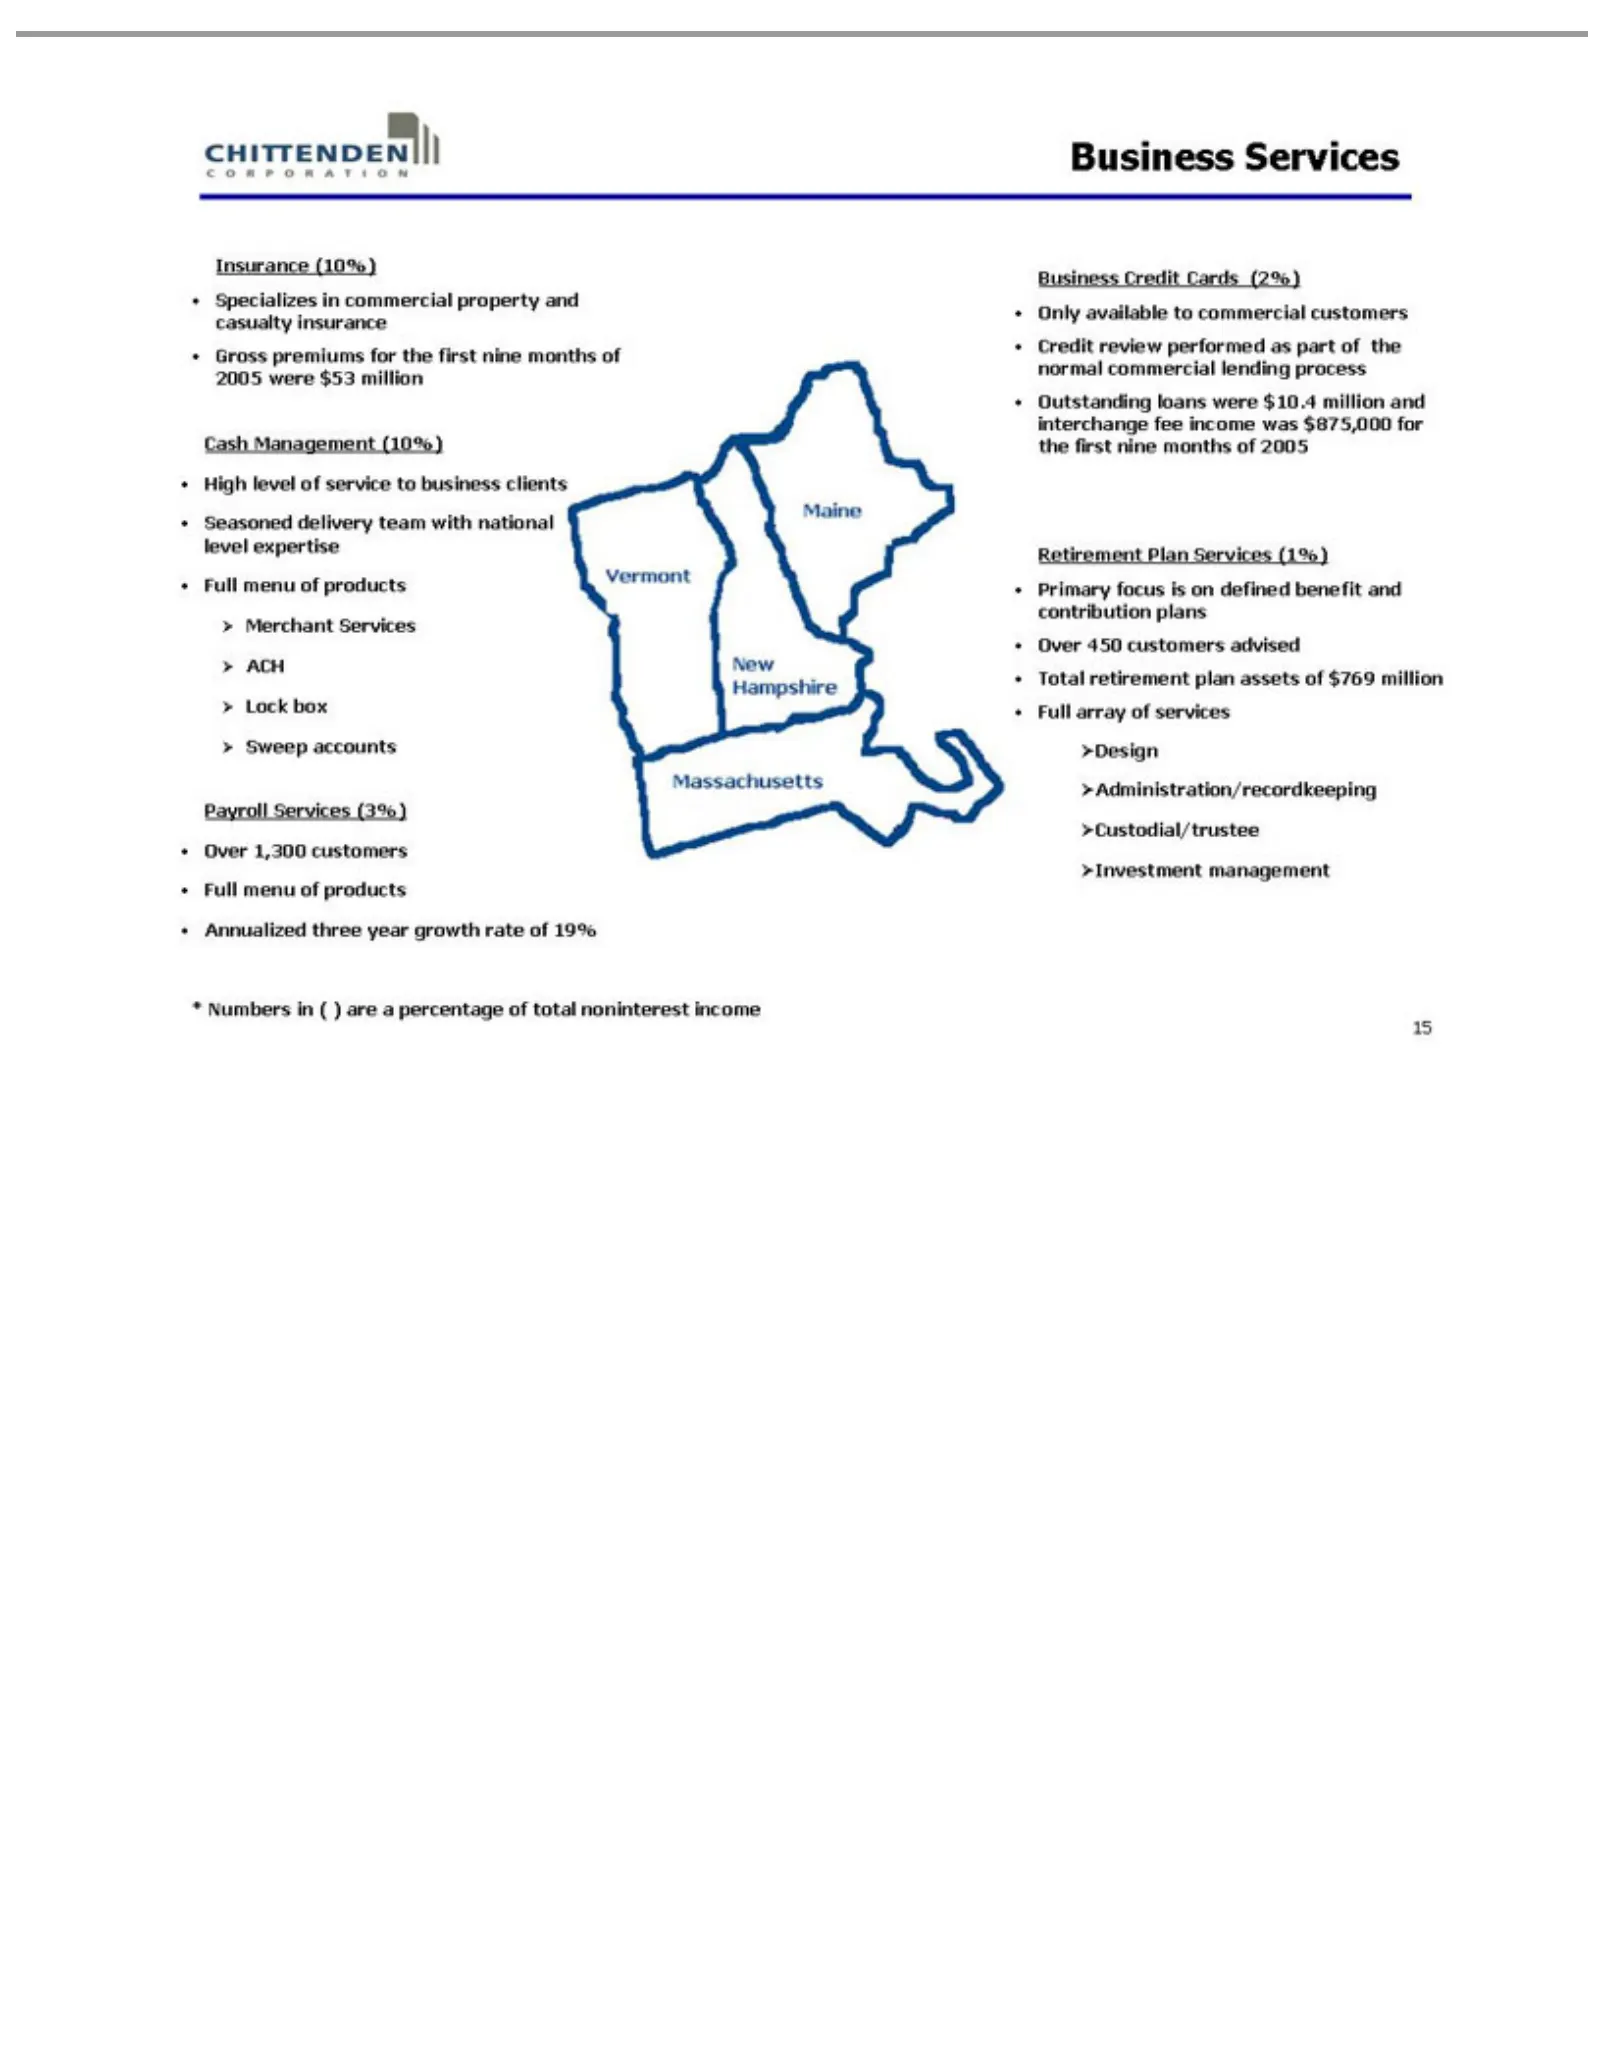
Slide 15: Commercial Banking Services
Insurance Specializes Cash High Merchant Lock Payroll Annualized Business Only for Retirement Administration/recordkeeping Design * 15 theavailable level Management box first Services Numbers Services Credit Sweep Services (10%) of Plan in nine three service commercial toCards months Services (3%) a
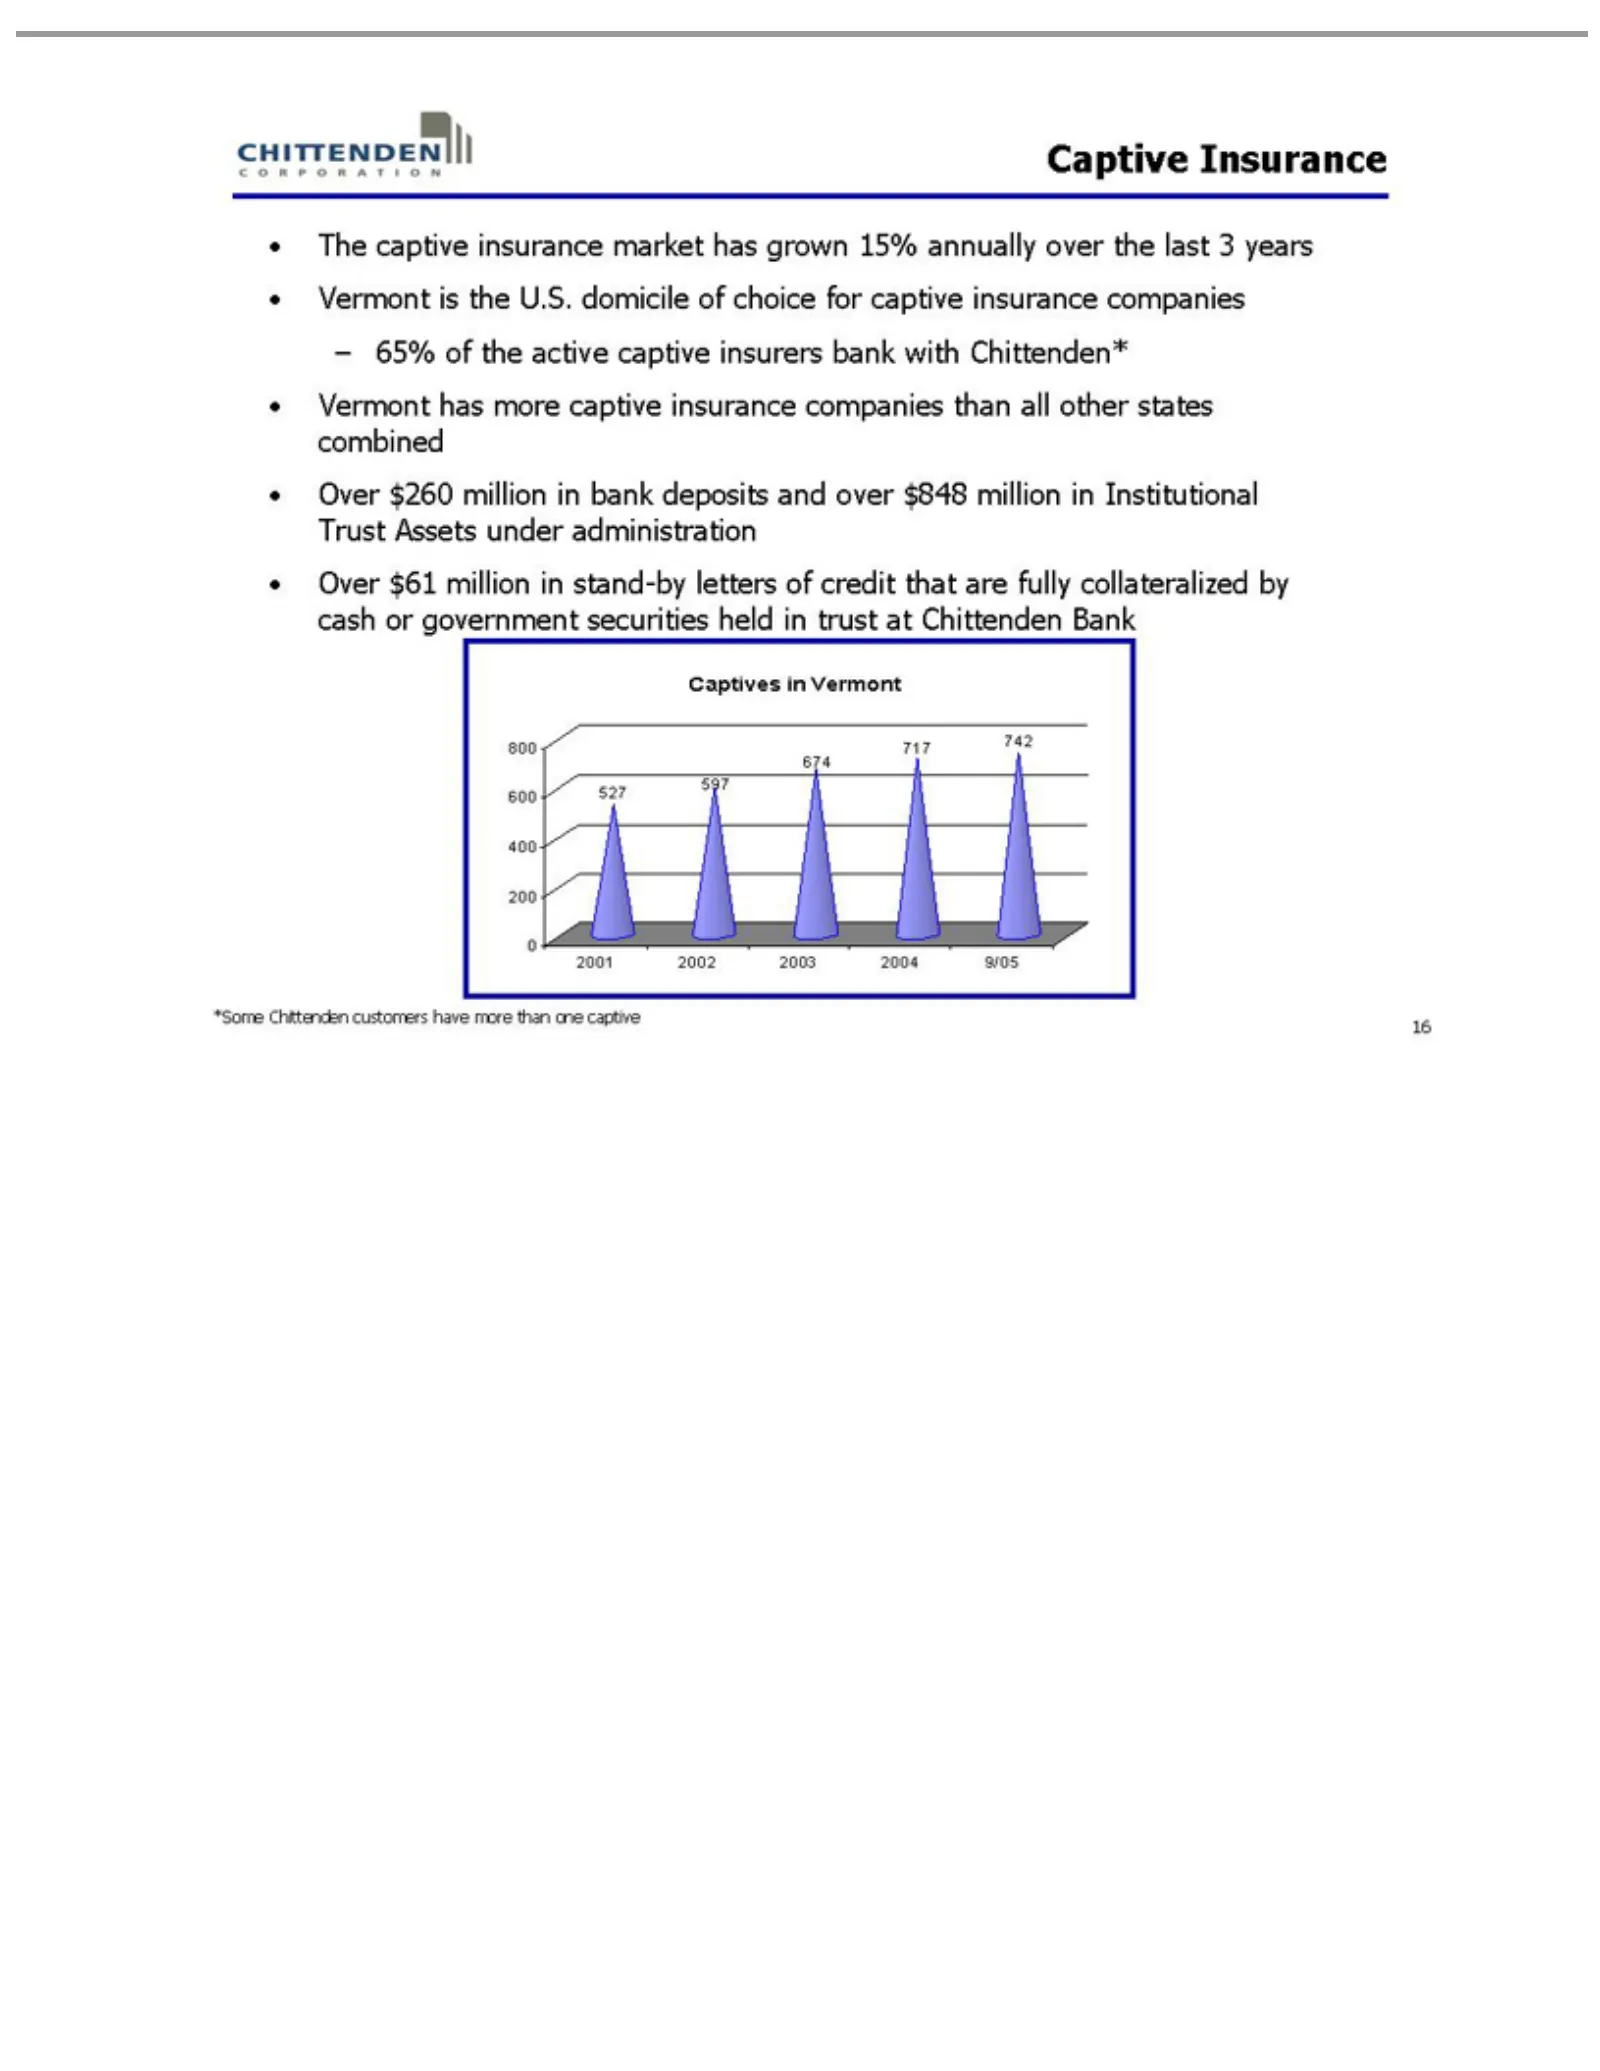
Slide 16: Captive Insurance - The Vermont Advantage
Captive -The Vermont million Captives 800 742 2001 * 1665% Some 600 717 captive 2002 ofin Chittenden Insurance 400 674 has the instand-by 2003 Vermont insurance active 200 597 more2004 0 captive 527captive letters customers 9/05 market of insurance insurers credit has havegrown that more bank compan
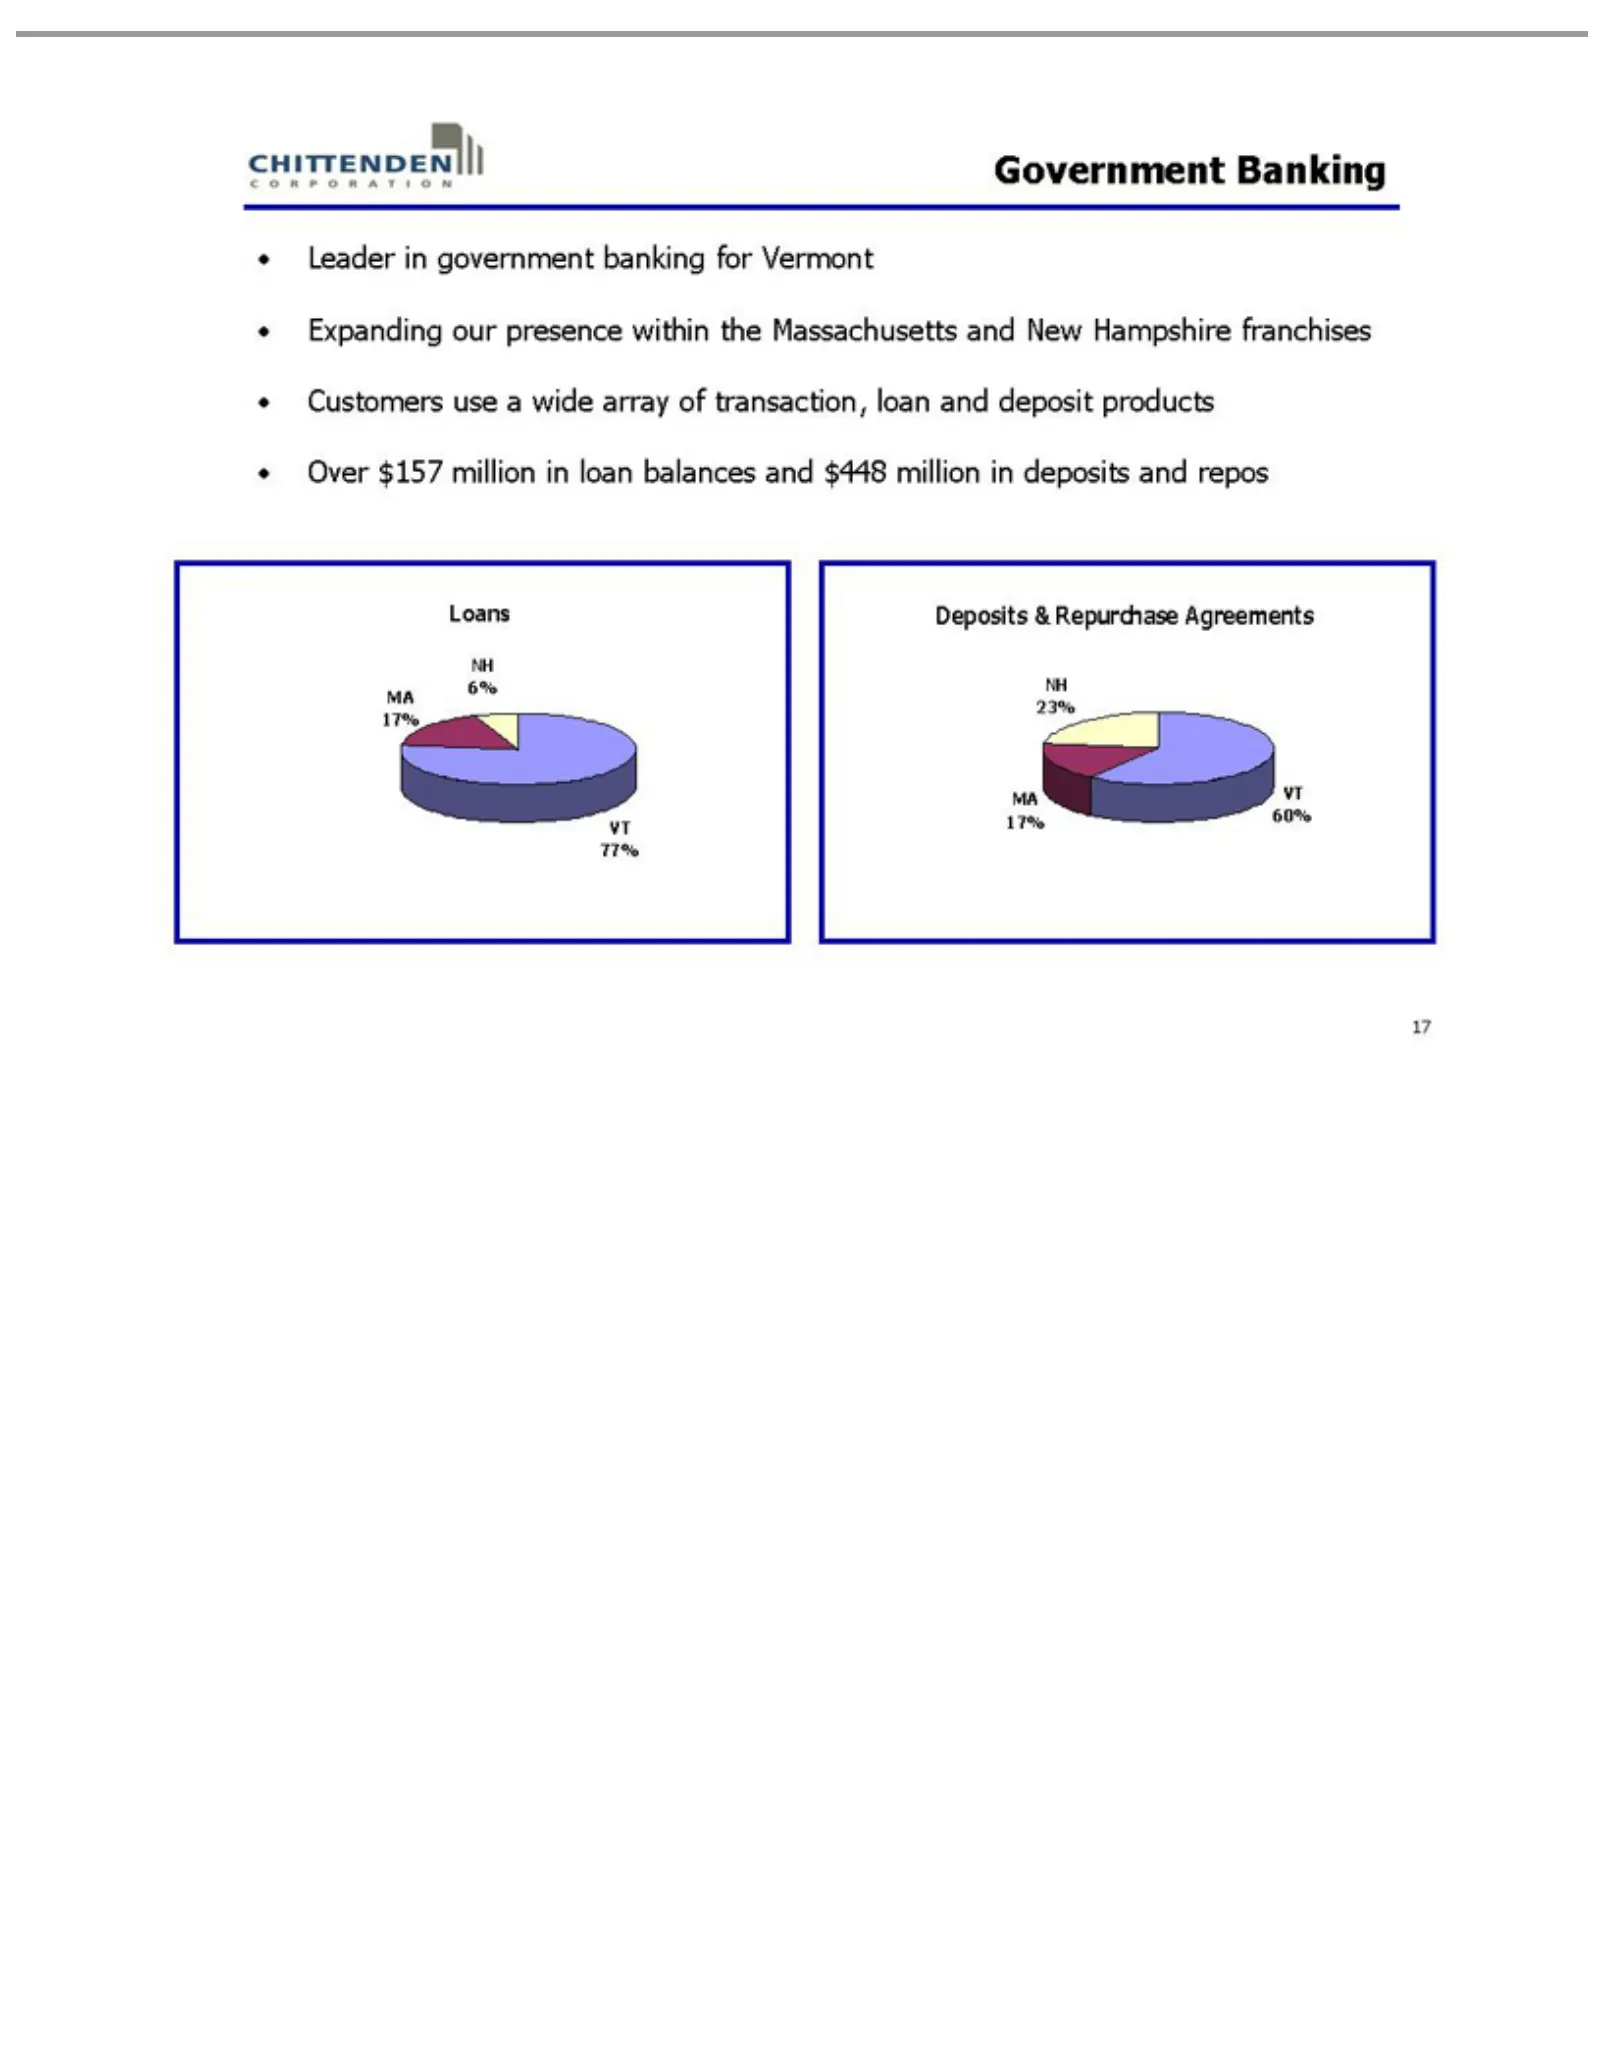
Slide 17: Government Banking Leader
Government Leader Expanding million Loans Deposits NH MA VT 17 77% 60% 6% 23% 17%in in&government deposits our Repurchase Banking presence andbanking repos Agreements within for theVermont Massachusetts and New Hampshire franchises Customers use a wide array of transaction, loan and deposit products
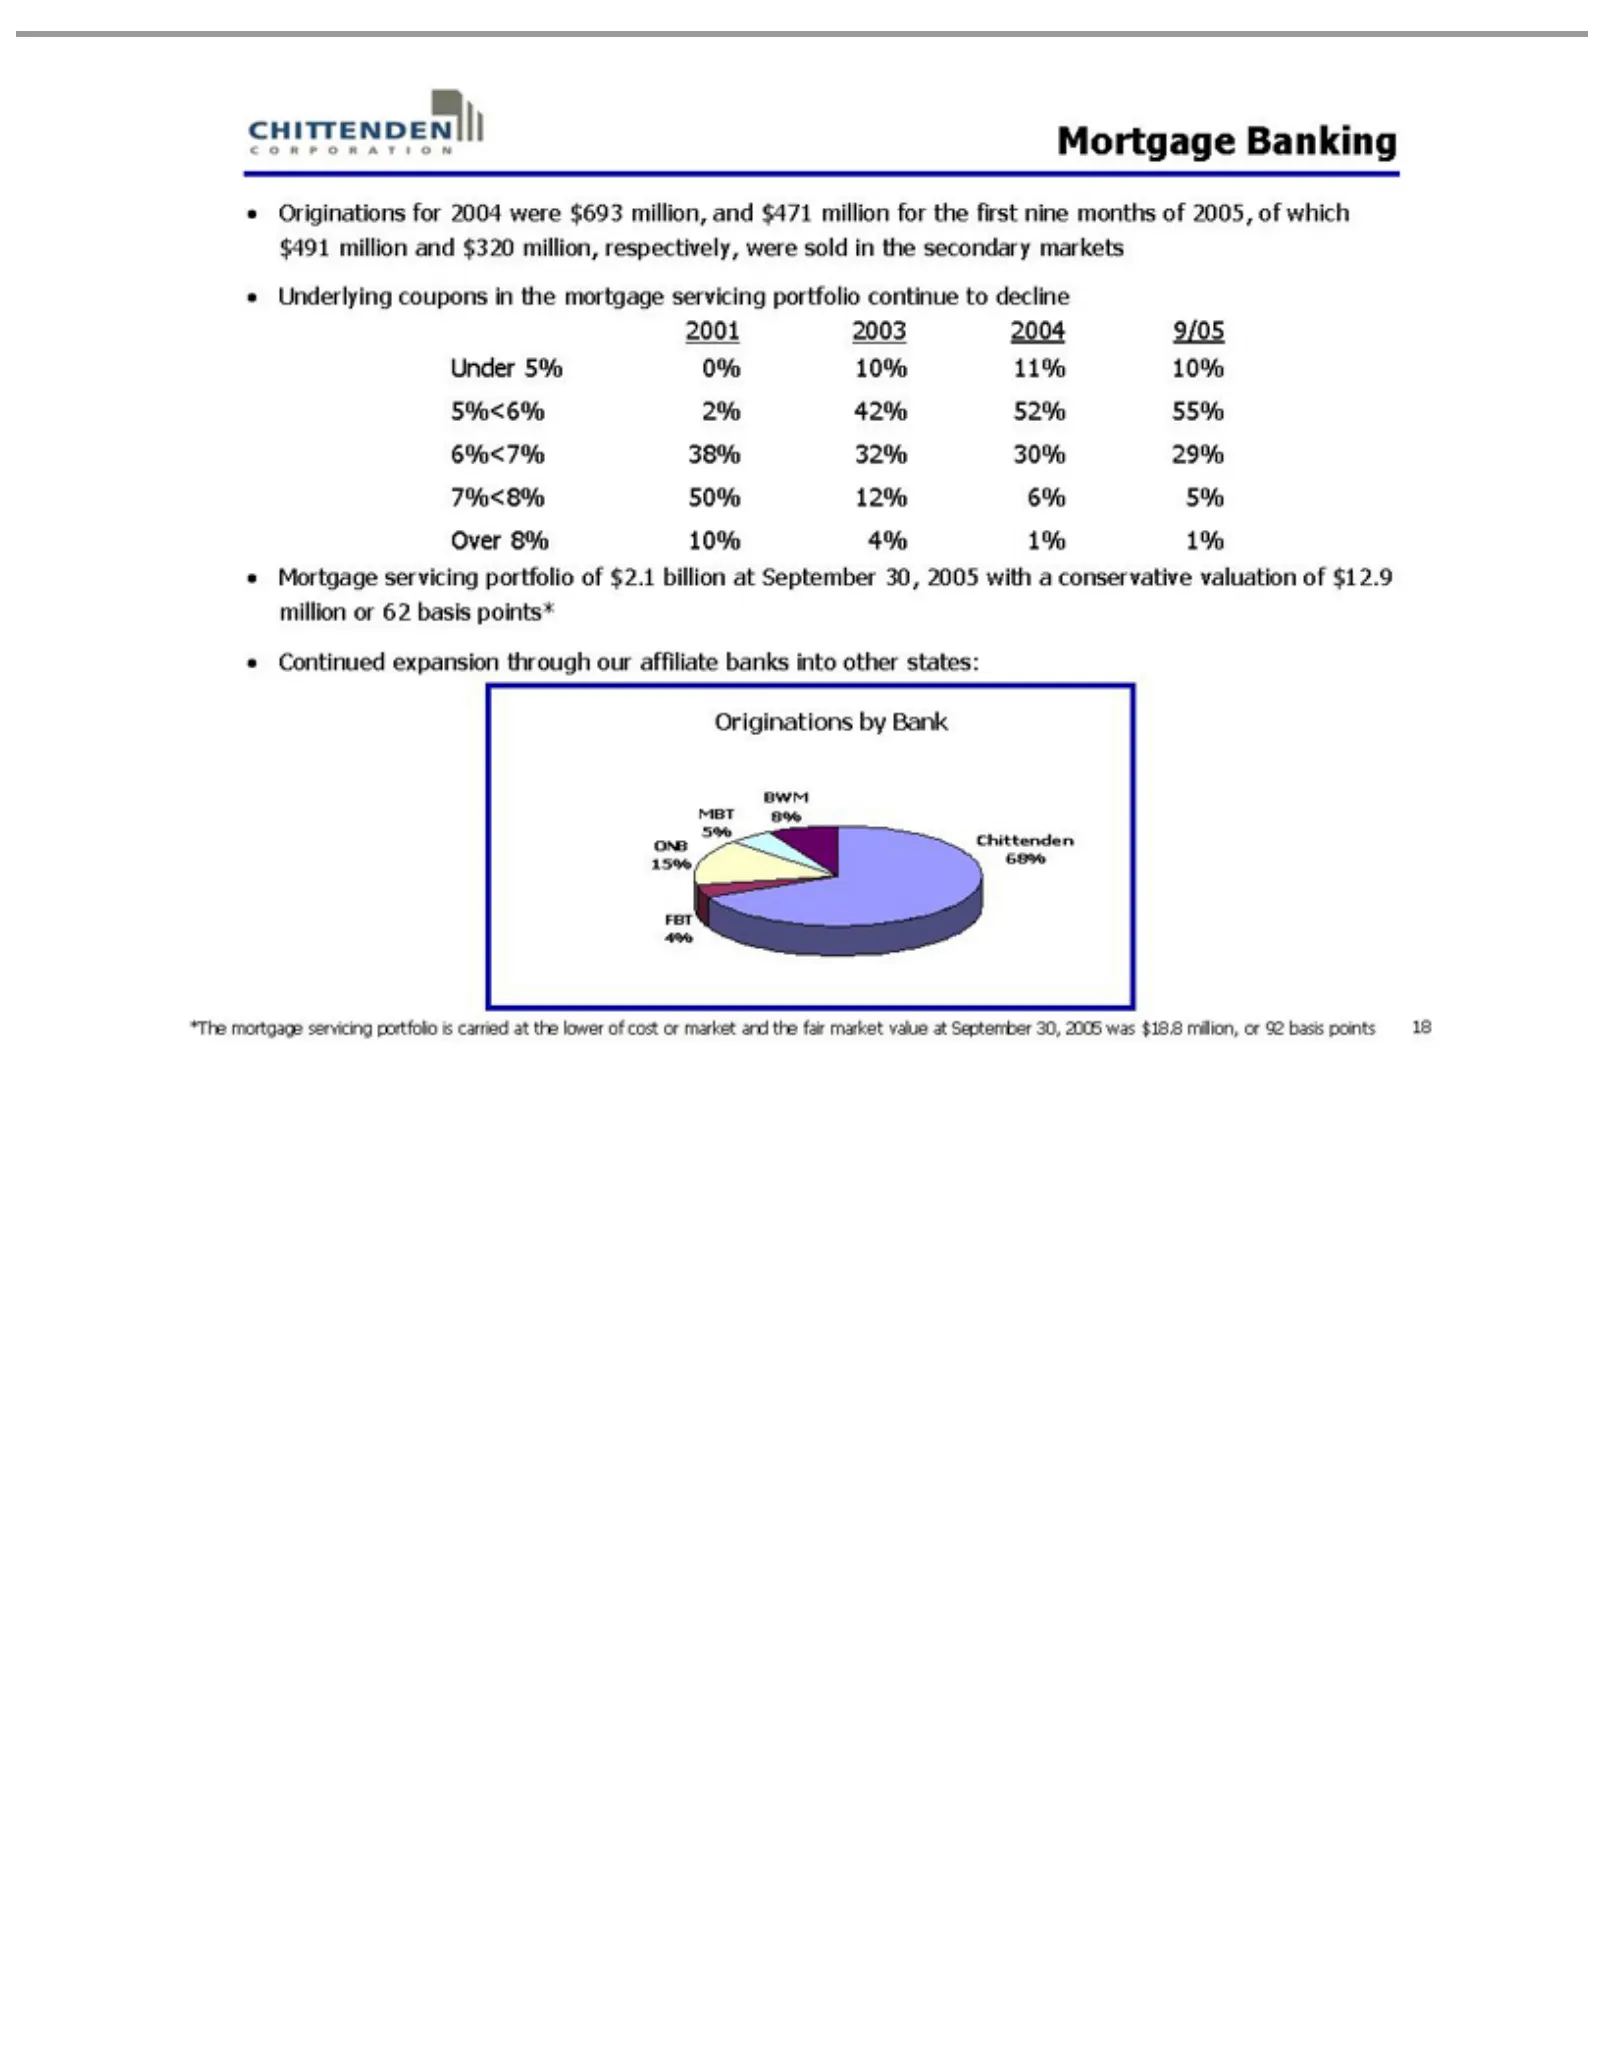
Slide 18: Mortgage Originations
coupons 2001 Mortgage Originations Chittenden BWM MBT ONB FBT *The 4% 2003 mortgage 15% 5% 8%inservicing Banking 2004 the 68% formortgage by servicing Bank 2004 9/05portfolio Under were servicing portfolio $693 5% of $2.1 0% million, is portfolio 10% billion carried and 11% at continue at$471 Septem

Slide 19: Wealth Management
Wealth Management 19
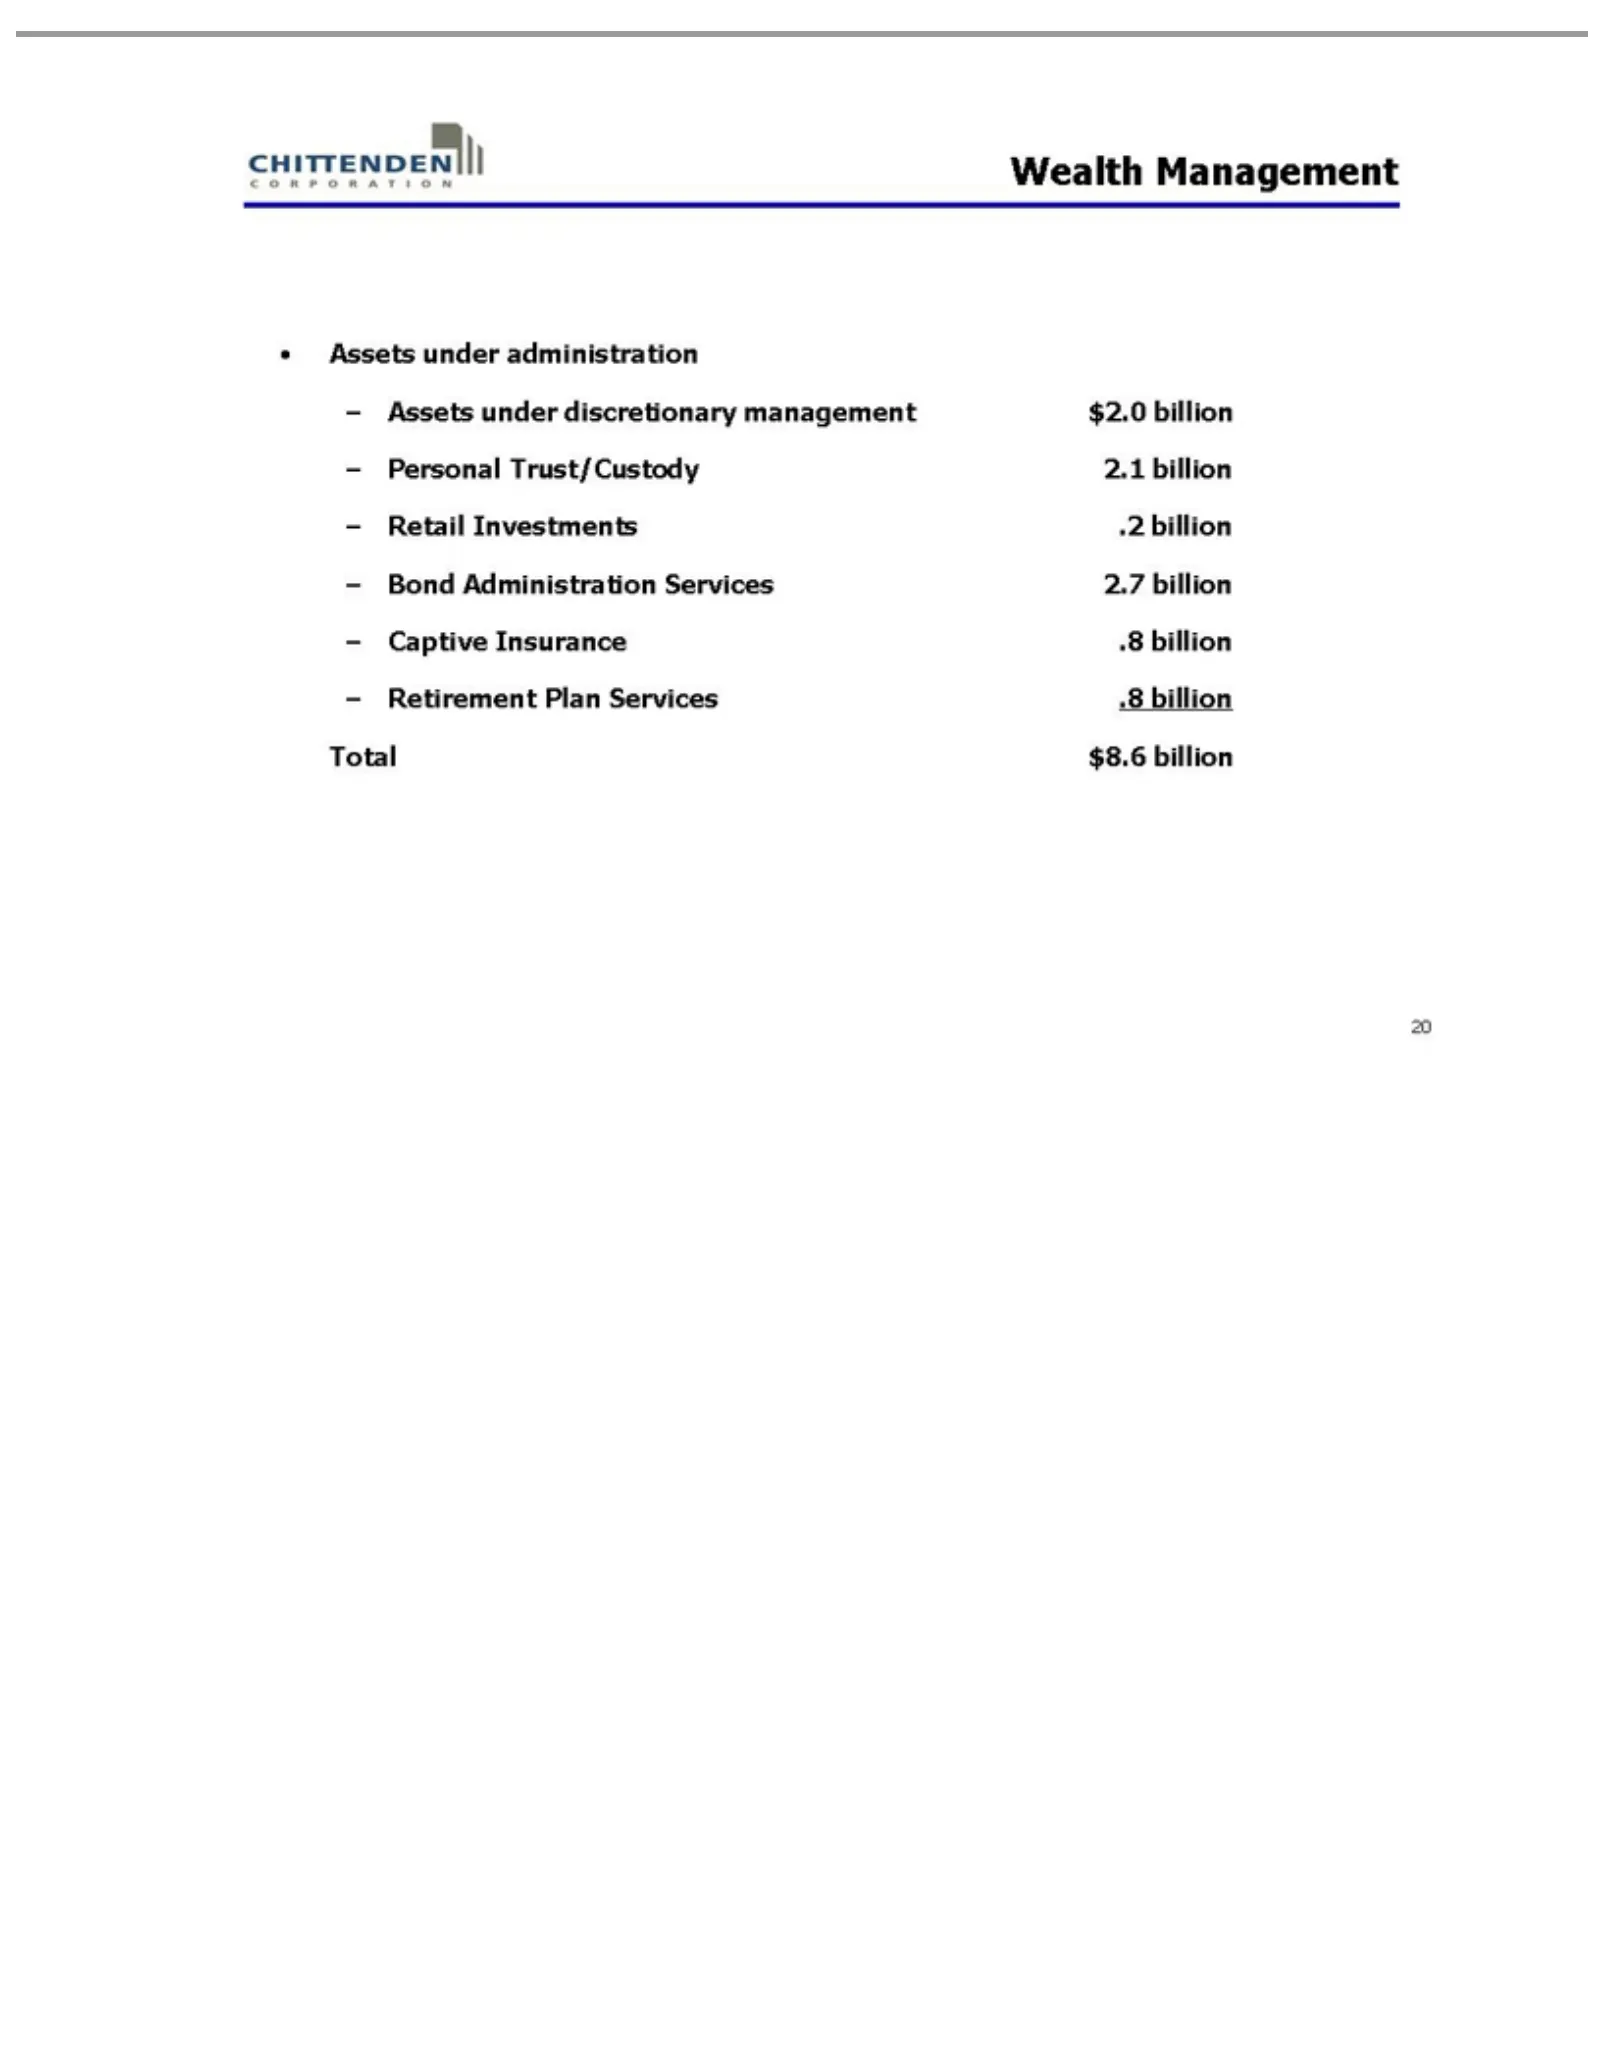
Slide 20: Wealth Management Assets
Wealth Assets Plan Total 20 Services $8.6 under Management billion administration discretionary .8 billion management $2.0 billion Personal Trust/Custody 2.1 billion Retail Investments .2 billion Bond Administration Services 2.7 billion Captive Insurance .8 billion Retirement
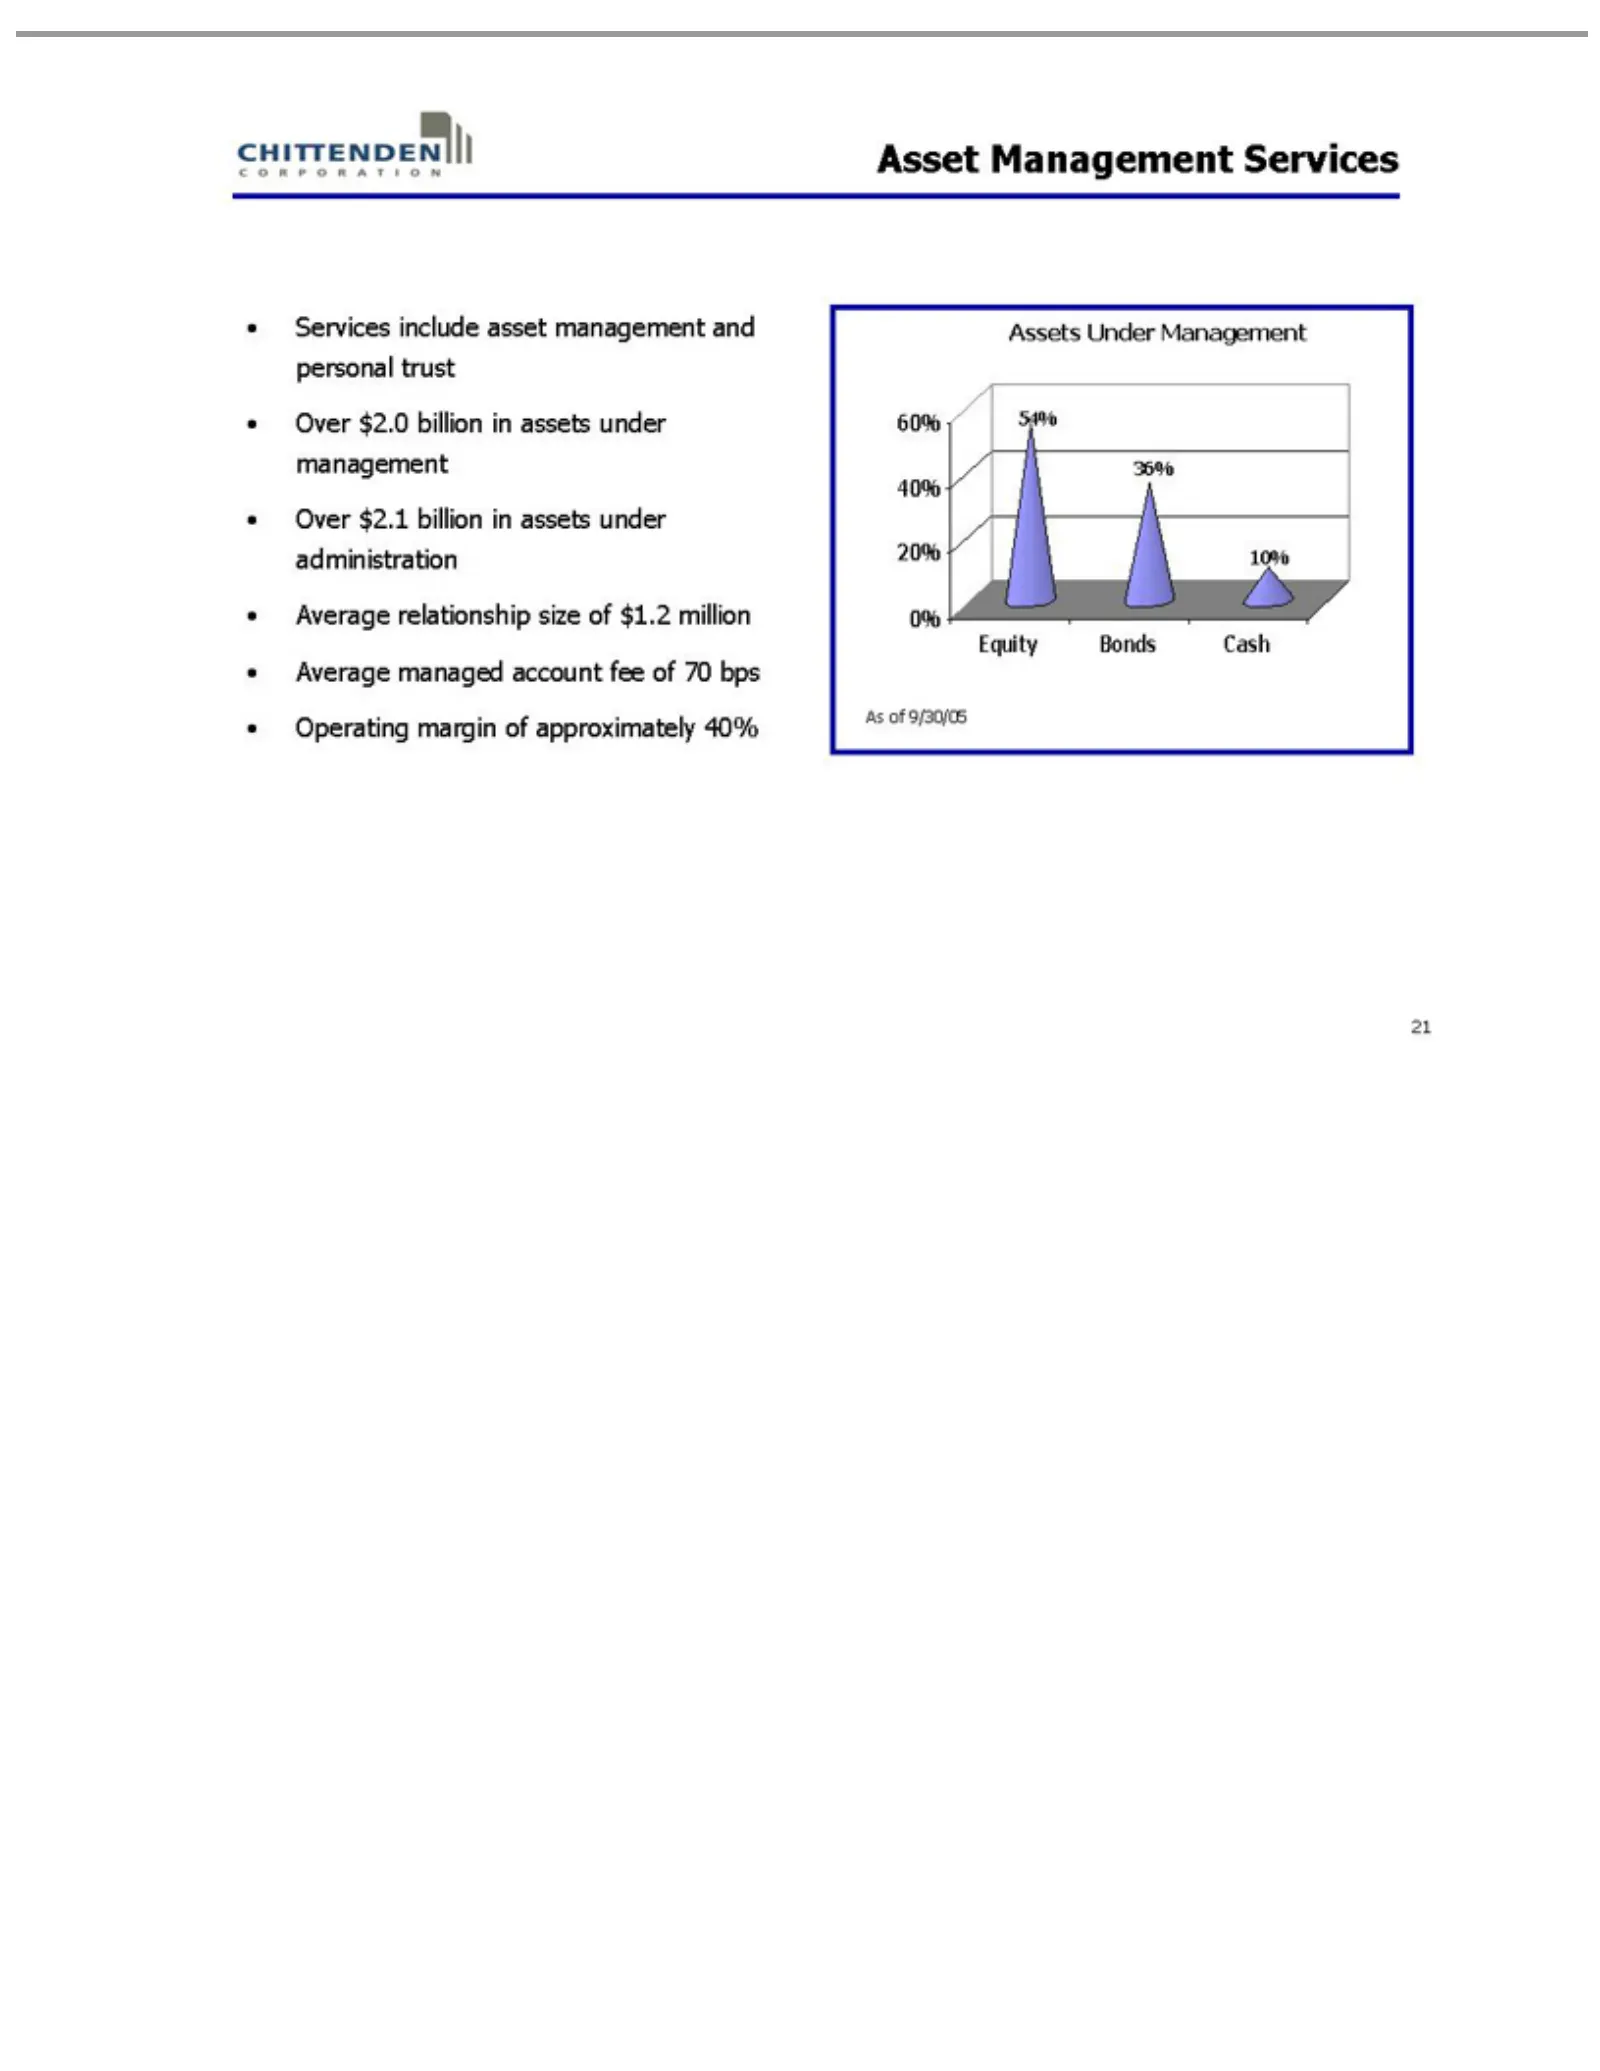
Slide 21: Asset Management Services
Asset Services managed Assets 60% Equity 10% 36% 54% As 21 of40% 9/30/05 Management Under Bonds include account 20%Management Cash 0%asset feeServices ofmanagement 70 bps Operating and personal margintrust of approximately Over $2.0 billion 40%in assets under management Over $2.1 billion in assets u
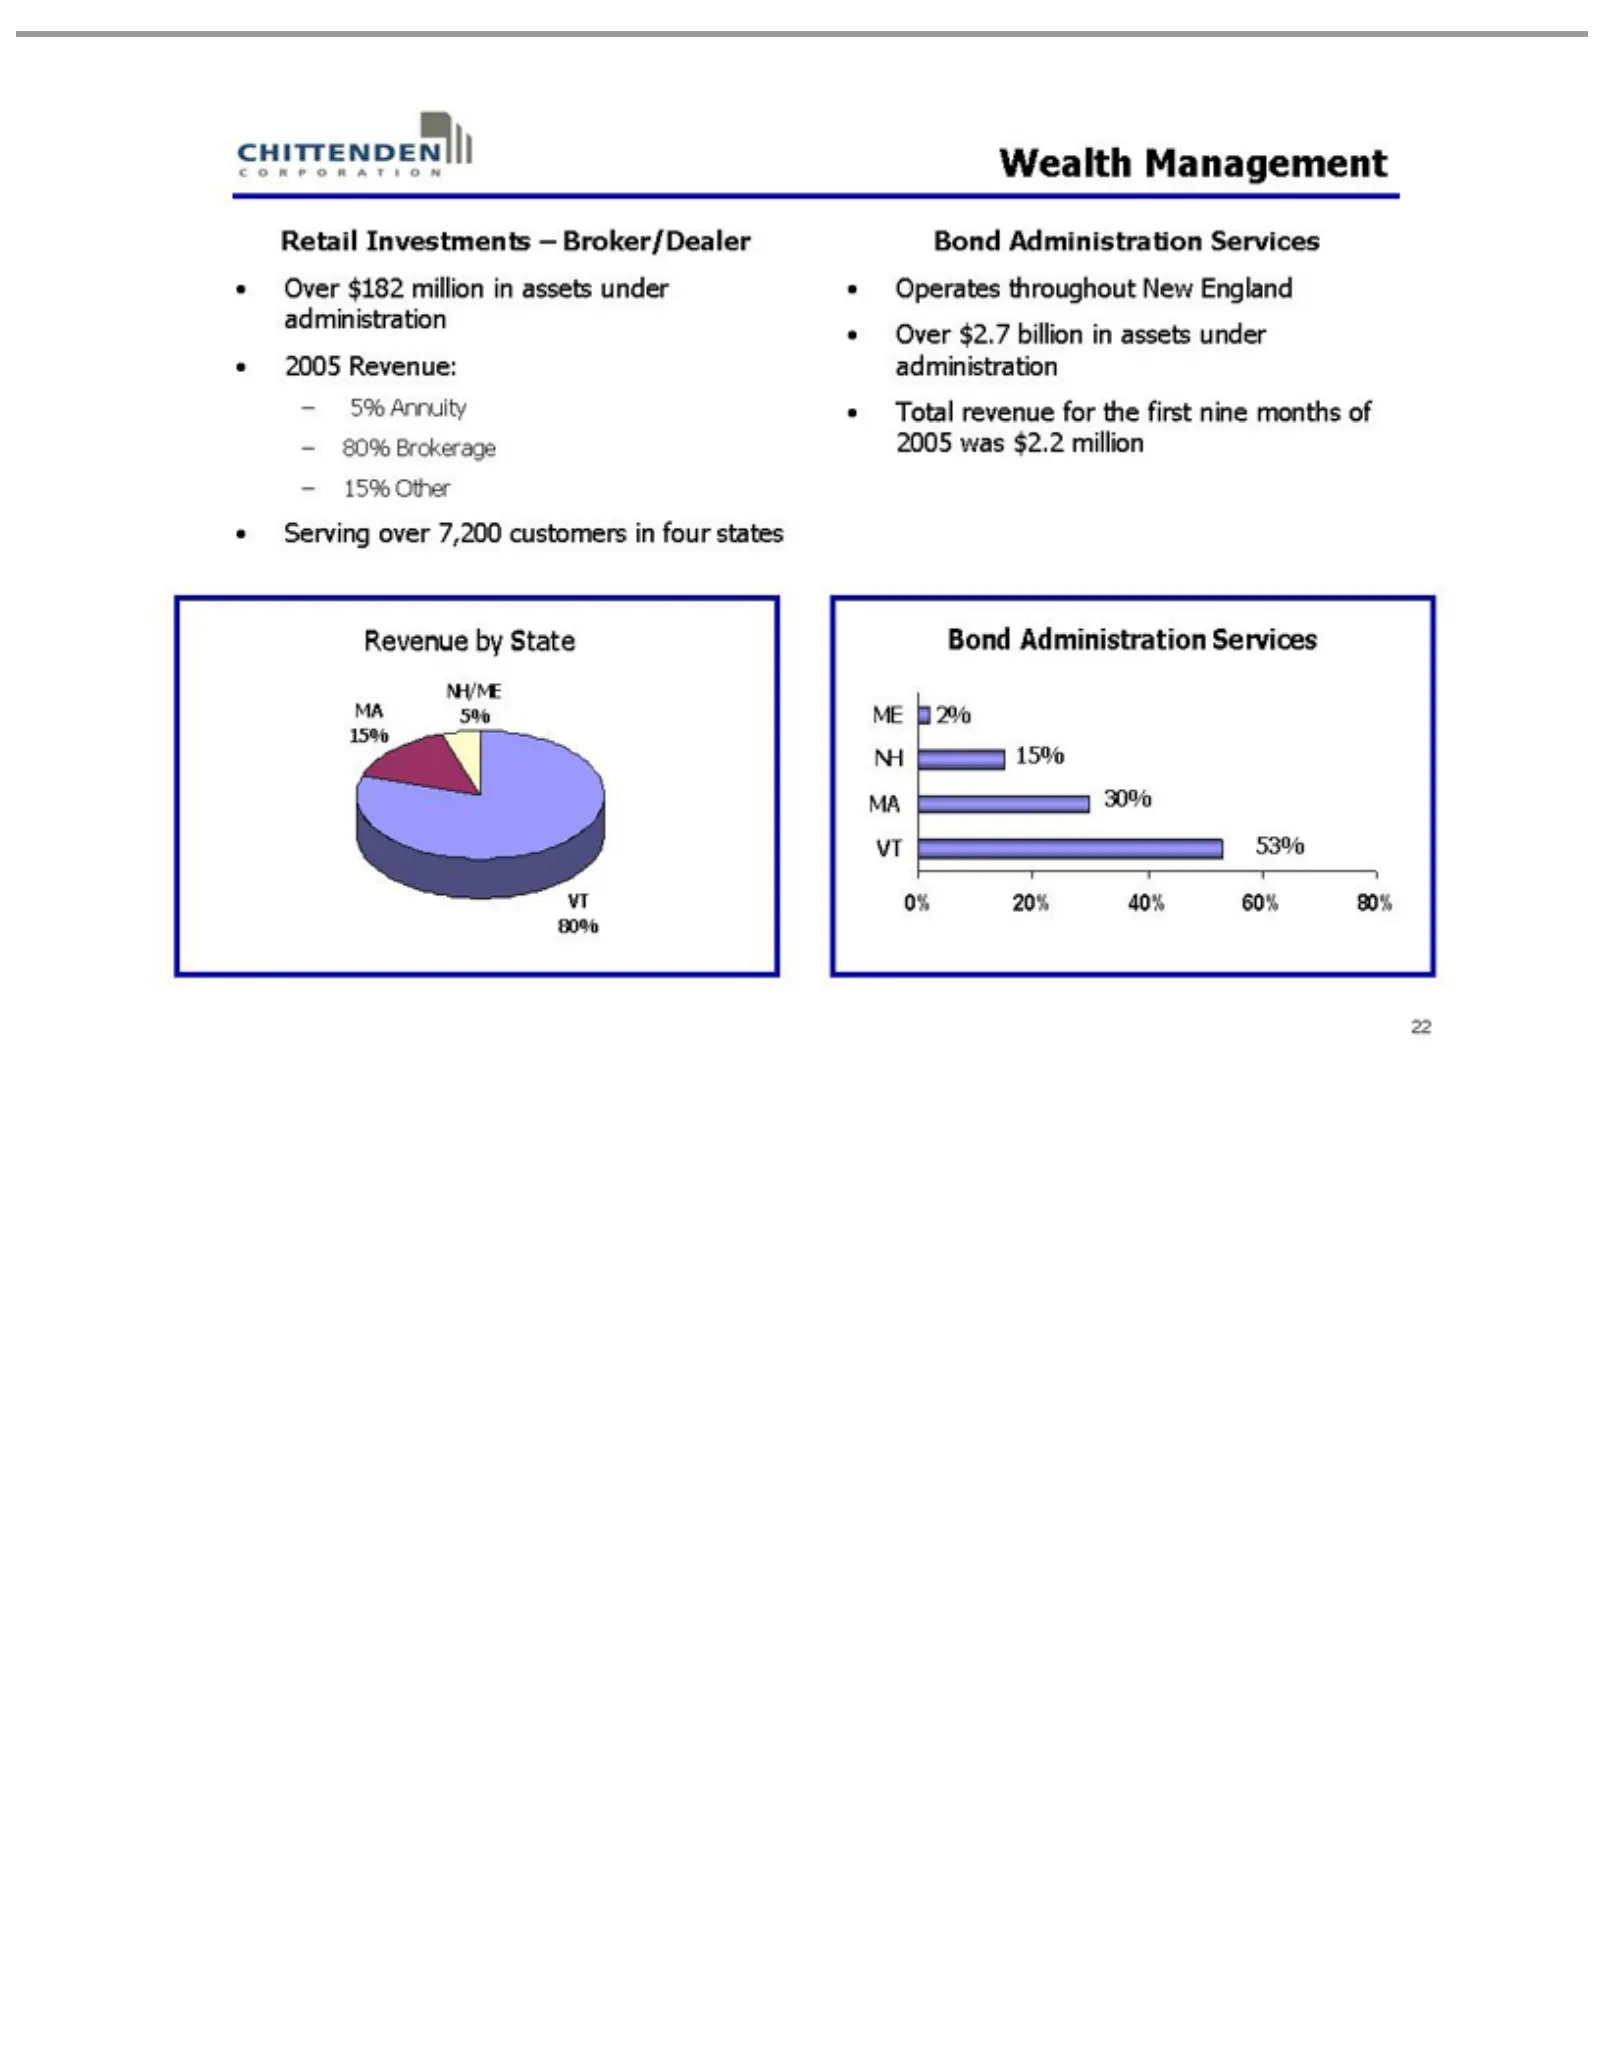
Slide 22: Retail Investments
Wealth Retail Over Serving Revenue VT 5% NH/ME MA Operates Bond ME 15% 2% 0% 53% 22 Annuity 80% 20% NH 15% 30% $182 Administration Investments Management over MA 40% by throughout million State 80% VT 7,200 60%Brokerage in –80% customers New Broker/Dealer assets Services England under 15% in four Ot
Slide 23: Financial Performance
Financial 59178 23 008Performance
Slide 24: Consistent Financial Performance: Net Interest Margin
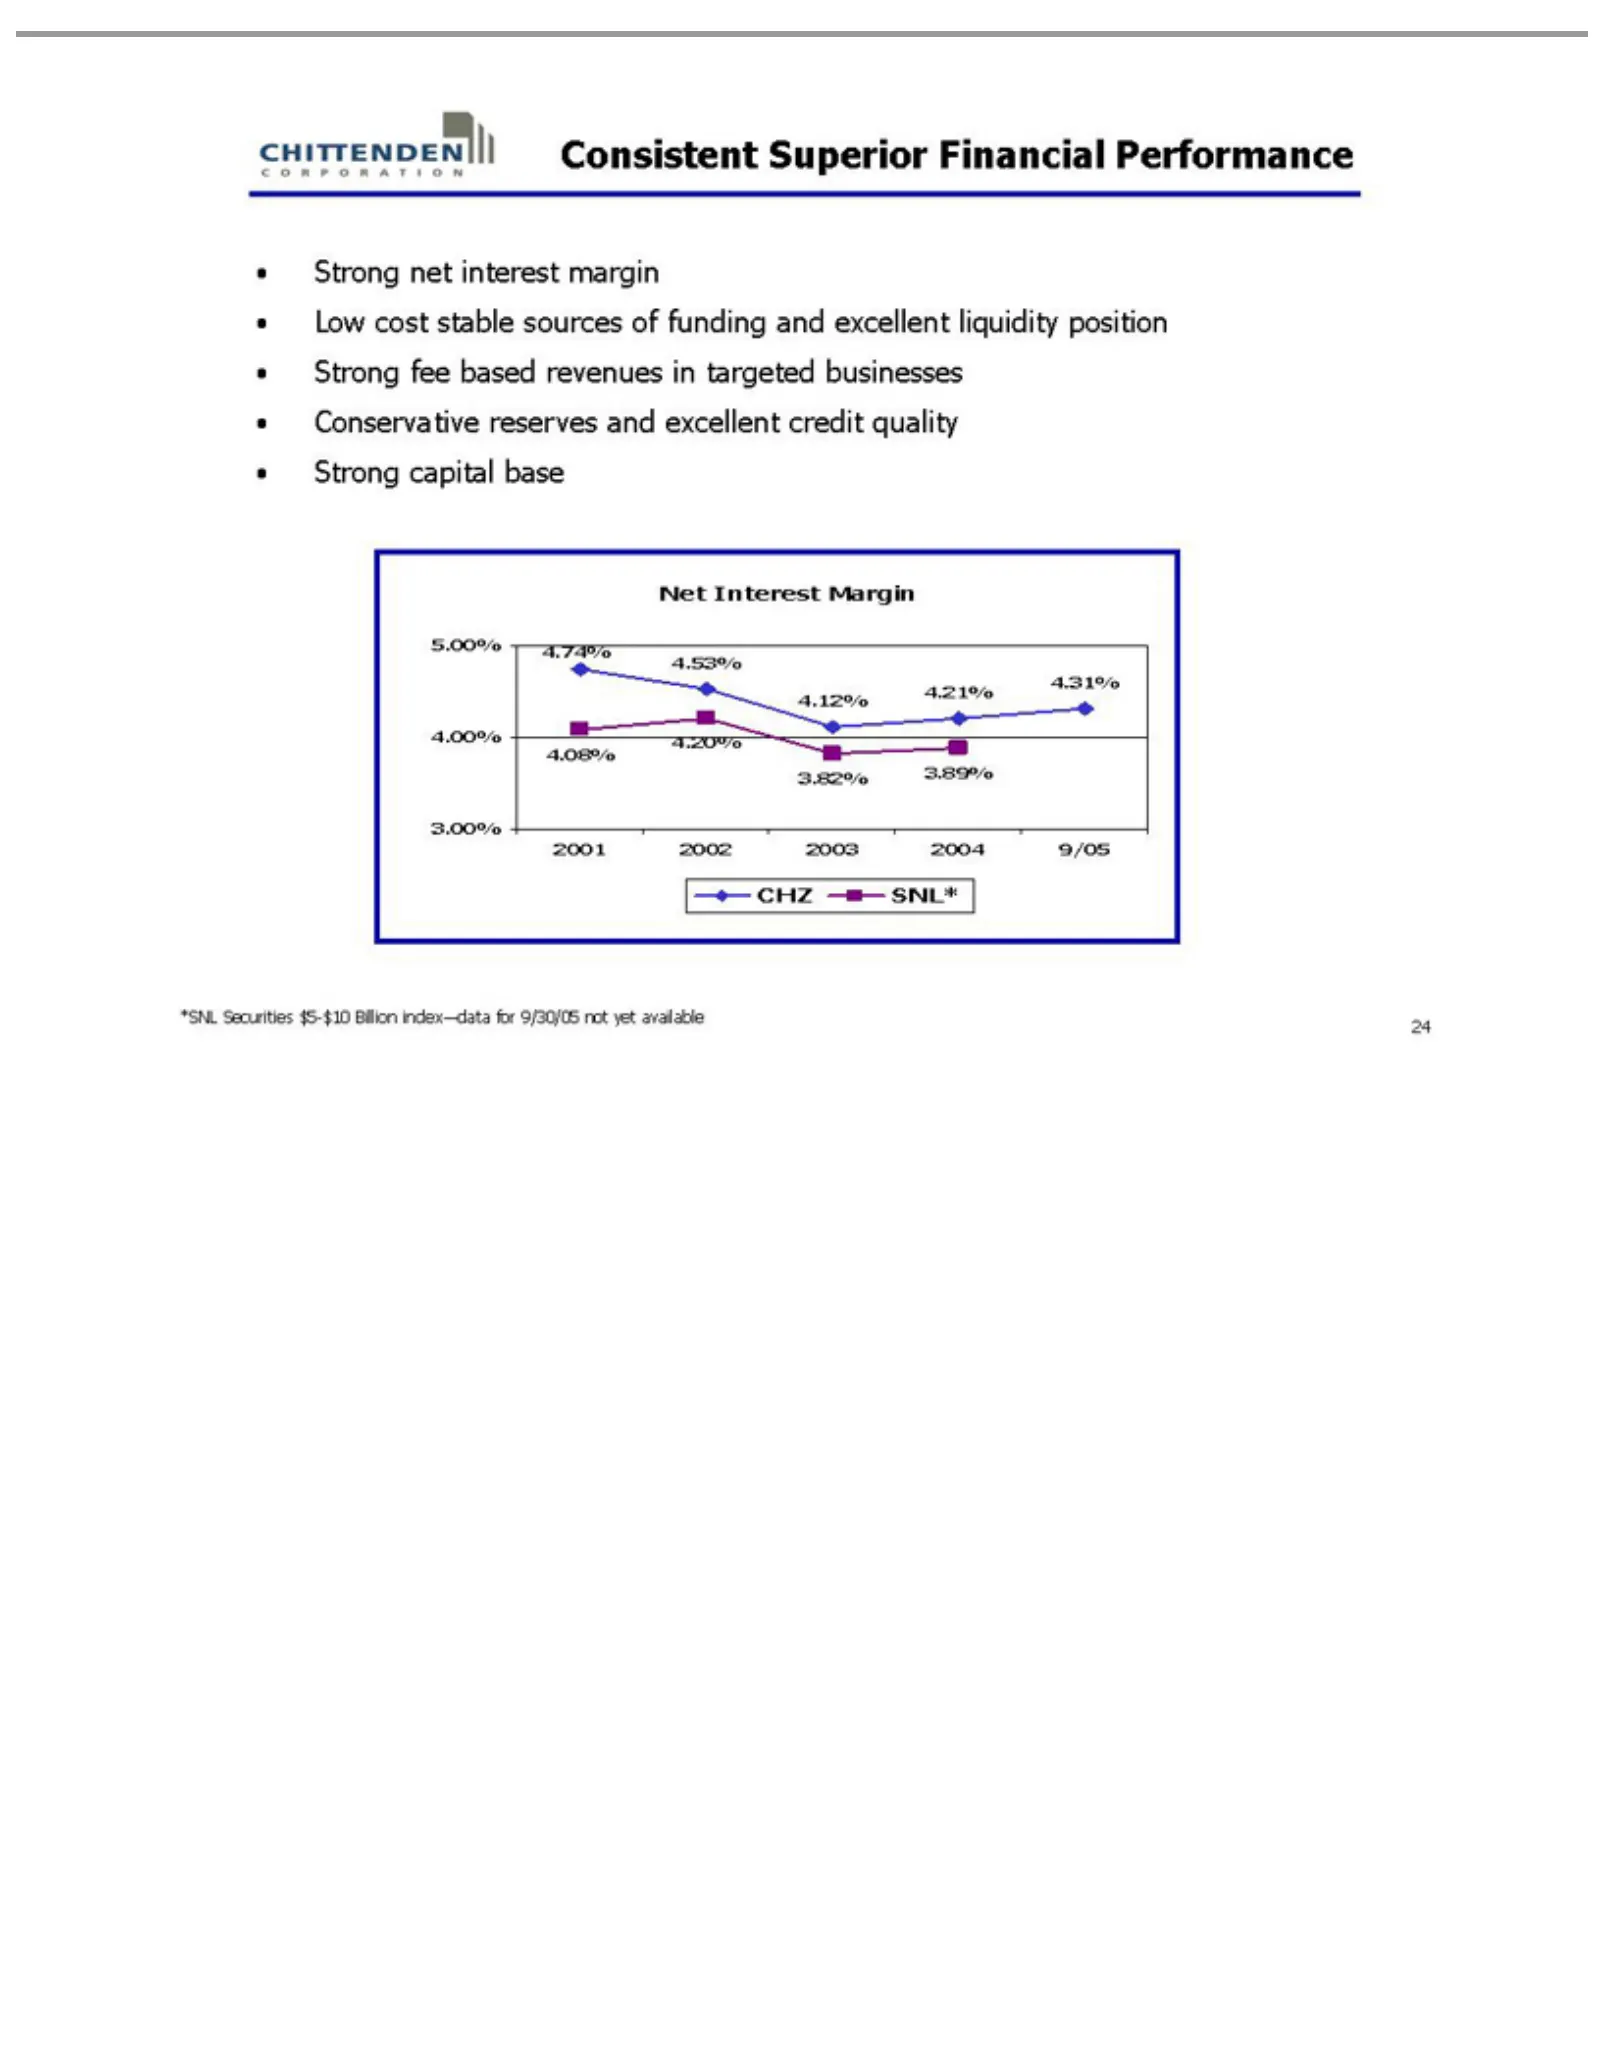
Consistent Strong Low Net 5.00% 4.31% 4.53% 4.74% 4.20% 3.82% 2001 * SNL* CHZ SNL Interest cost 2002 4.00% 4.21% 4.08% 3.89% Securities netstable interest Superior 2003 Margin 3.00% 4.12% sources 2004 $5-$10 margin Financial 9/05 ofBillion funding Performance index—data and excellent for 9/30/05 liq
Slide 25: Yield on Loans, Securities and Cost of Funds
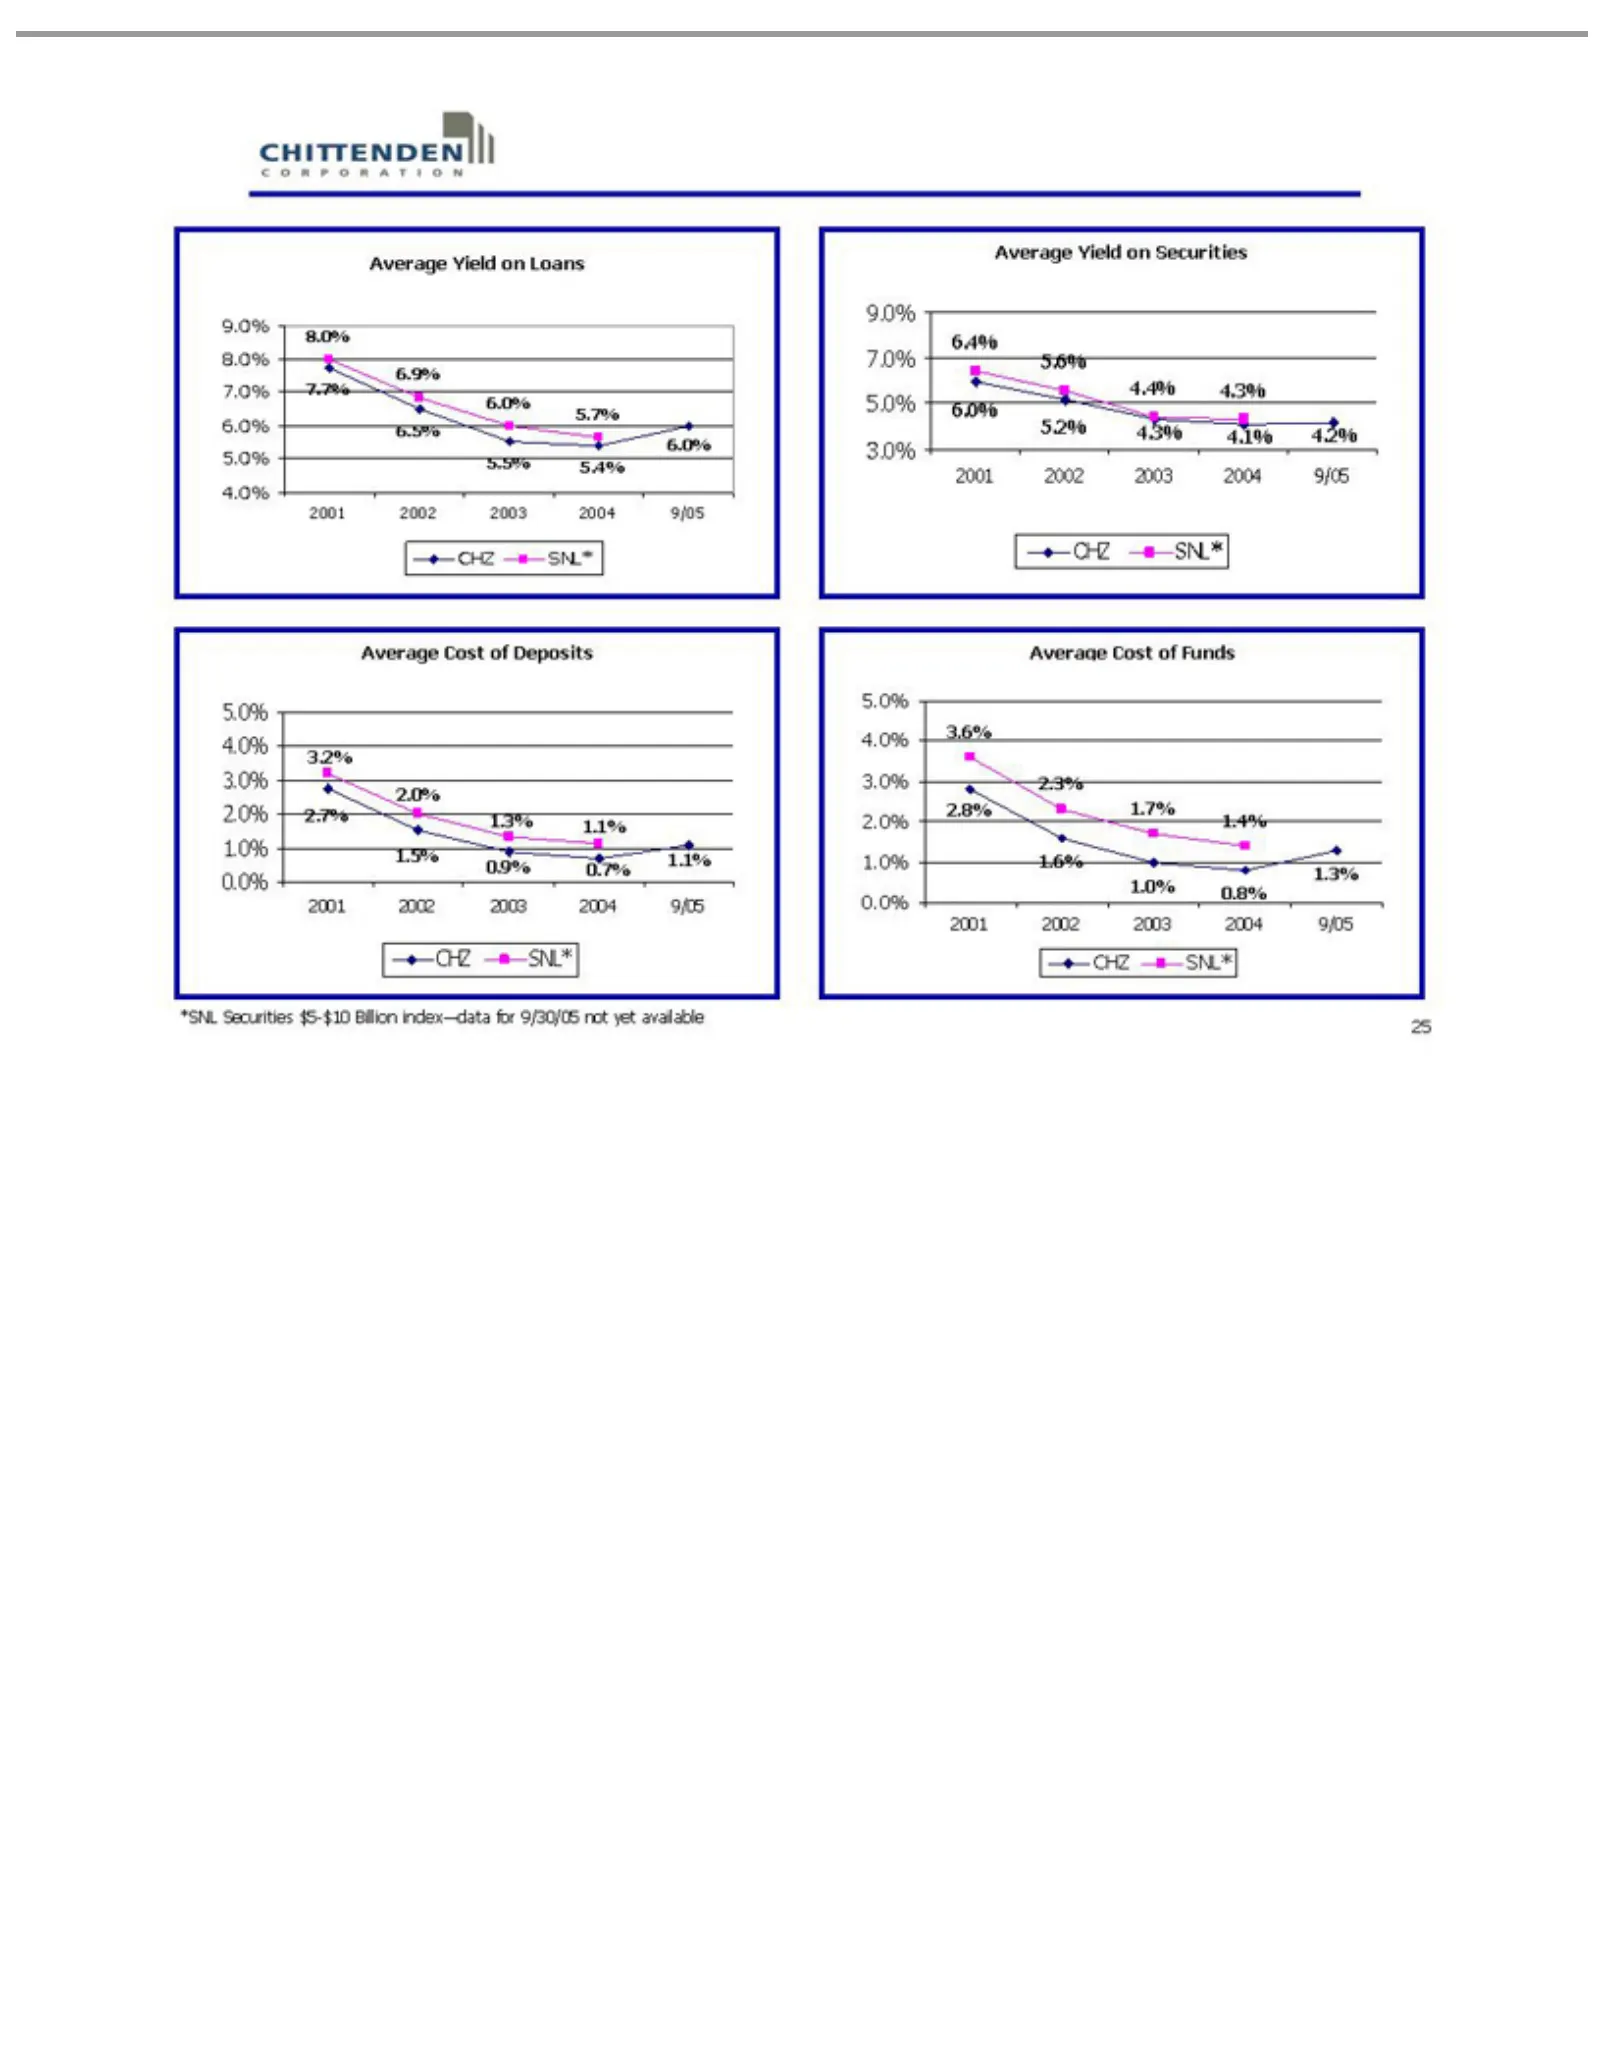
6.9% SNL* 8.0% 5.7% 6.0% 2.7% 2.0% 3.2% 1.5% 1.1% 9.0% 4.4% 5.6% 6.4% 5.2% Average 5.0% 2.8% 2.3% 3.6% 1.3% 1.6% 1.4% 2001 CHZ *SNL 25 2002 8.0% 7.7% 6.5% 5.5% 1.3% 1.1% 7.0% 4.3% 4.0% 1.7% 1.0% Securities Yield Cost 2003 7.0% 5.4% 0.9% 5.0% 6.0% 4.1% 3.0% 0.8%of onFunds Deposits 2004 $5-$10 6.0% 0.
Slide 26: Noninterest Income
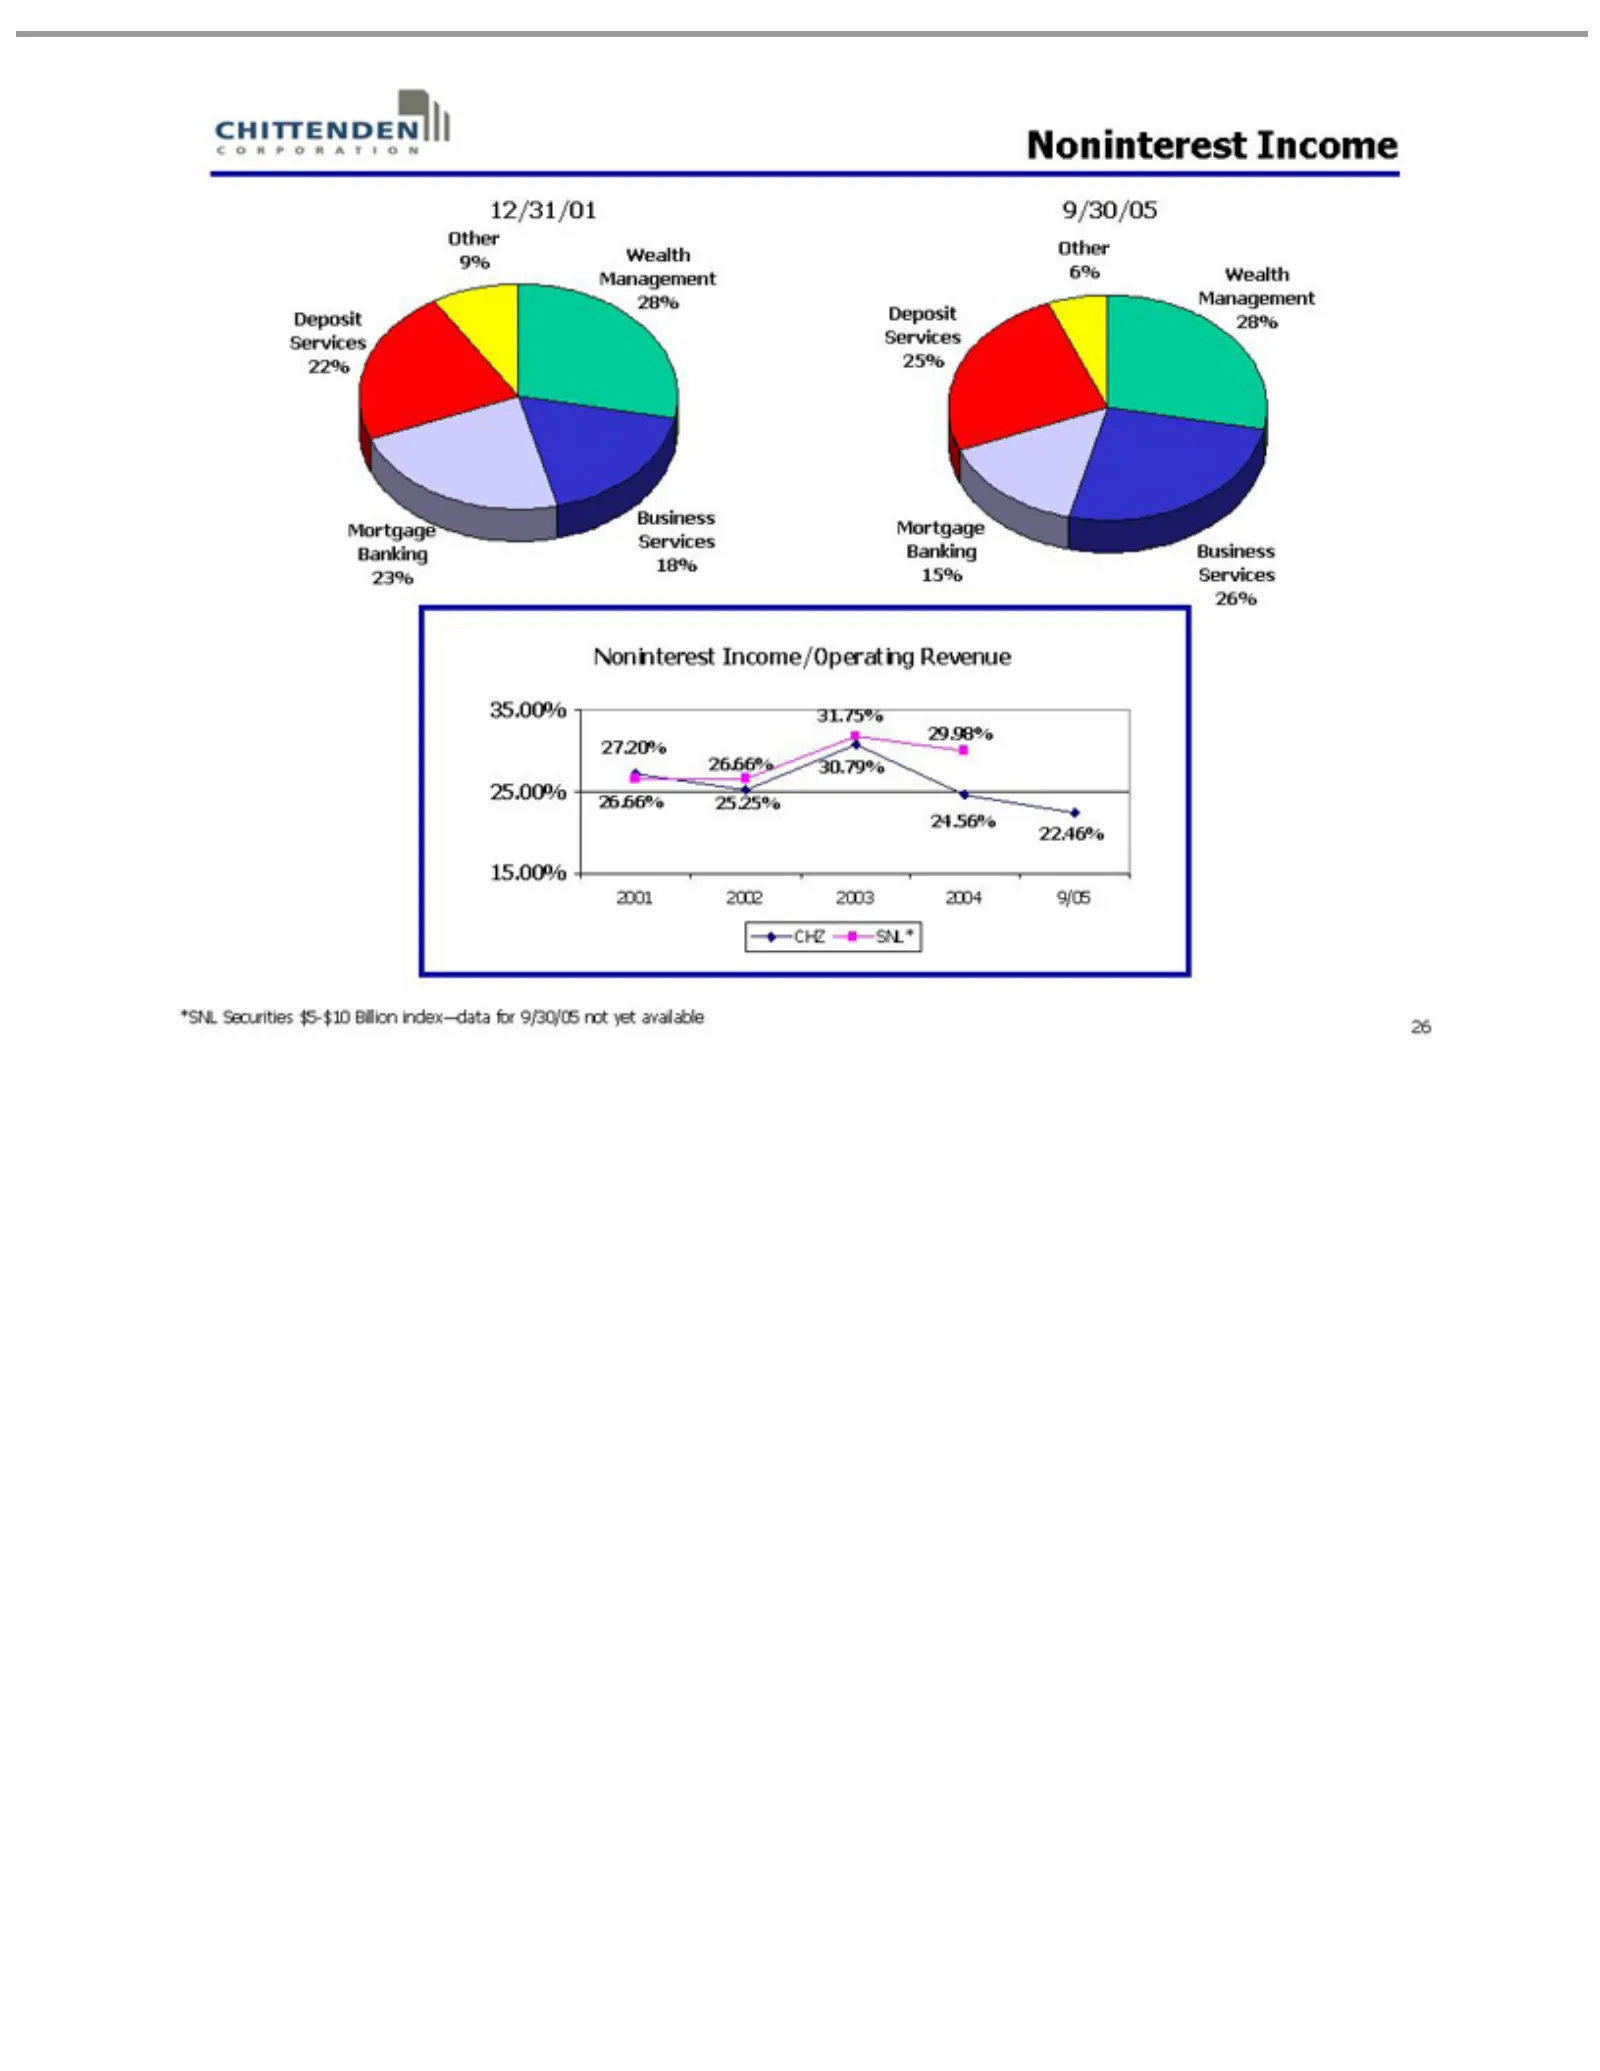
12/31/01 Other 9/30/05 Wealth Business Mortgage Deposit Noninterest 35.00% 29.98% 31.75% 2001 22.46% *SNL 2002 9% 6% Securities Management 25.00% 27.20% Services Services Banking 2003 Income Income/Operating 15.00% 26.66% 2004 $5-$10 22% 25% 18% 26% 23% 15% 28% 9/05 Billion 30.79% CHZ Revenue index—
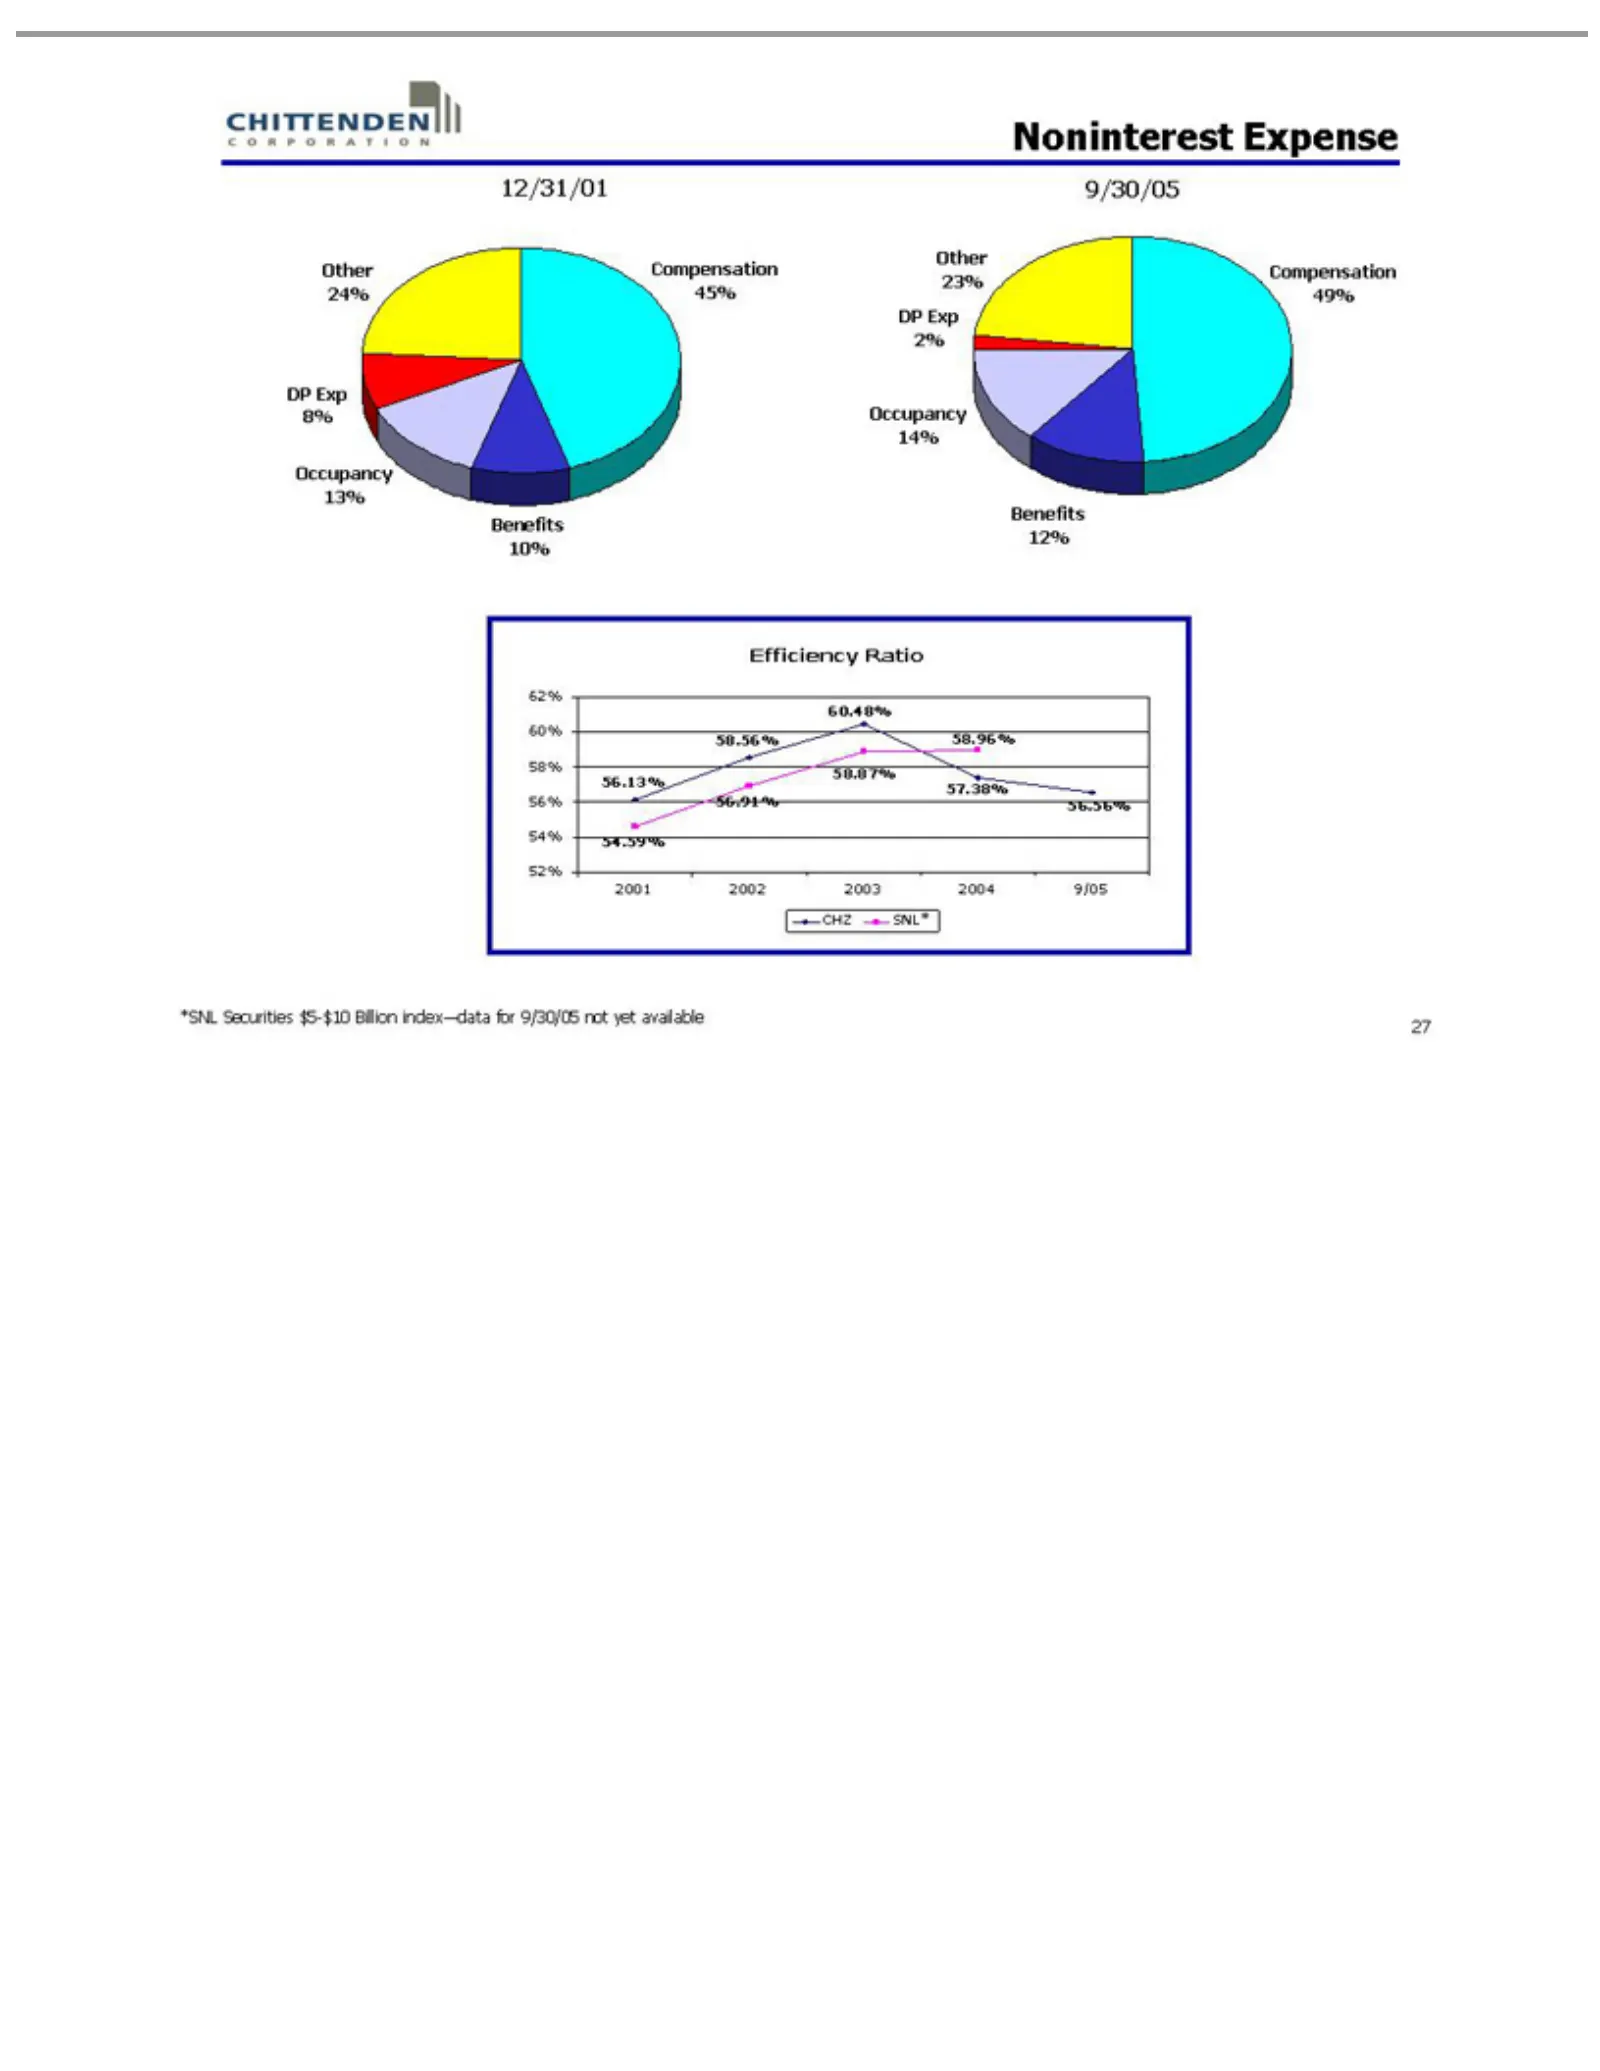
Slide 27: Noninterest Expense and Efficiency Ratio
Noninterest 12/31/01 Compensation 9/30/05 Benefits Occupancy DP Other Efficiency 62% 58.56% 60.48% 58.87% 56.91% 57.38% 2001 54.59% CHZ *SNLExp 60% 2002 SNL* 24% 23% Securities 58.96% 56.13% 56.56% 8% 2% 10% 12% 58% Ratio 2003 13% 14% Expense 45% 49% 56% 2004 $5-$10 54% 9/05 Billion 52% index—data f
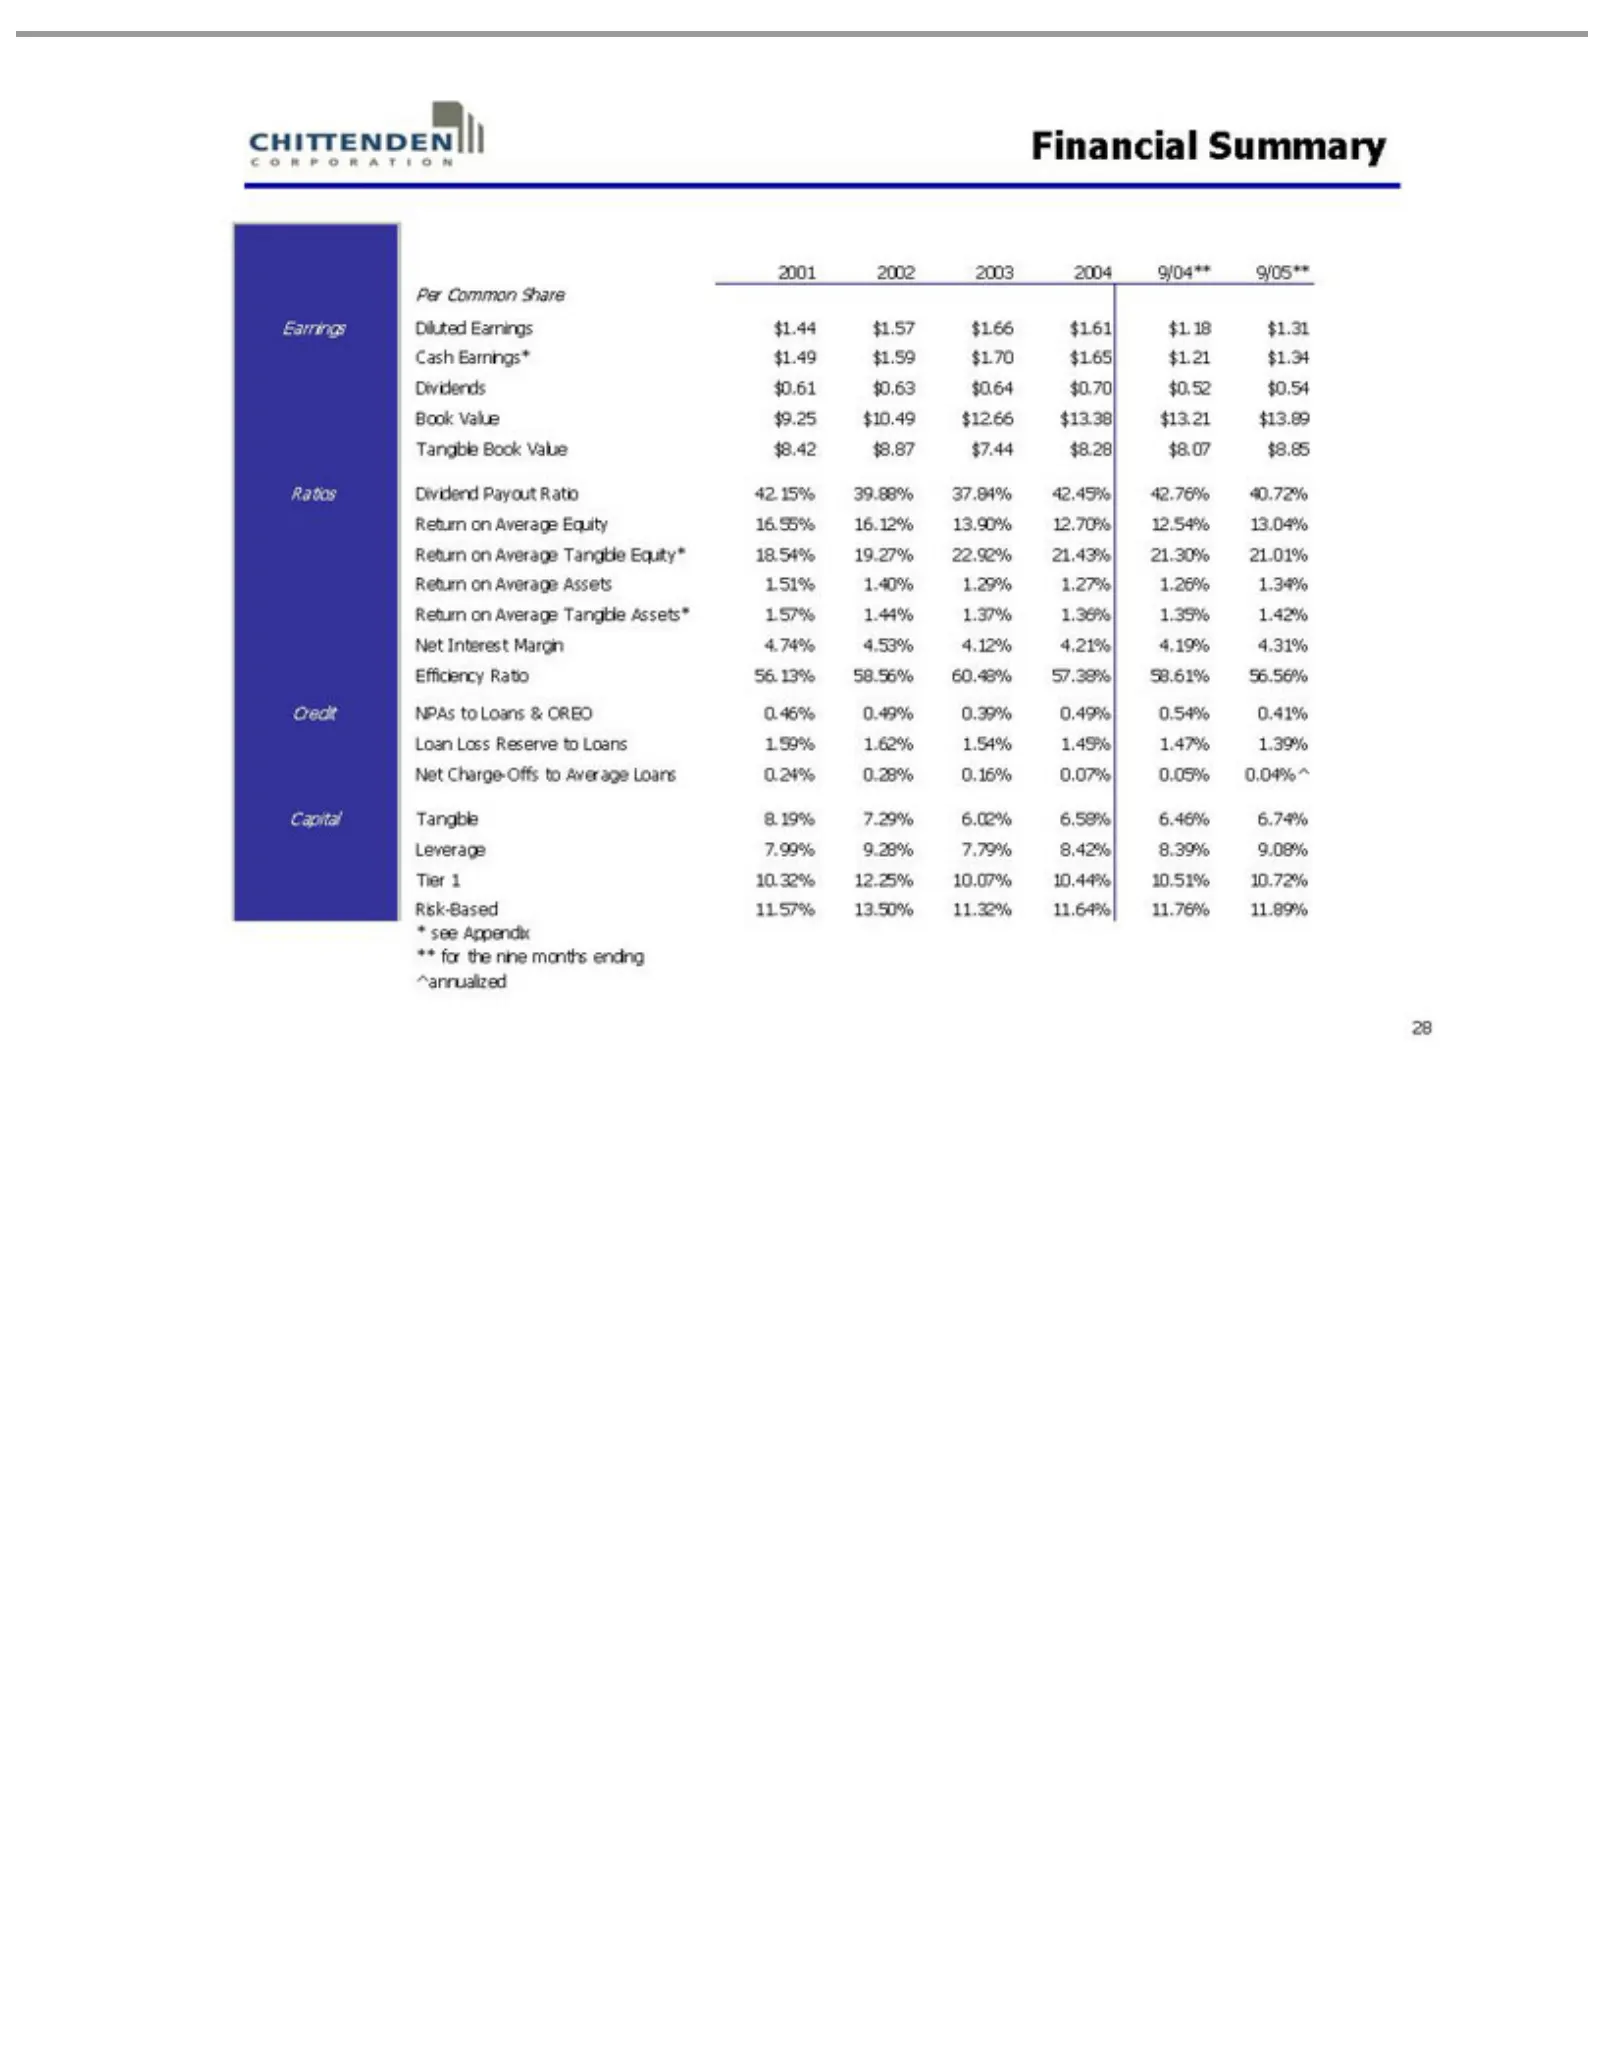
Slide 28: Financial Summary
Financial 2001 Per Earnings $13.38 Ratios 18.54% Net Credit 0.16% Capital 11.32% 28 Common Interest 2002 NPAs Dividend 0.07% $13.21 Tangible 11.64% 19.27% Diluted Summary 2003 Margin to Share 0.05% $13.89 Loans 11.76% 22.92% 2004 Payout 8.19% Earnings 4.74% 0.04%^ Tangible 9/04** &7.29% Ratio 11.89%
Slide 29: Risk Management
Risk Management 29
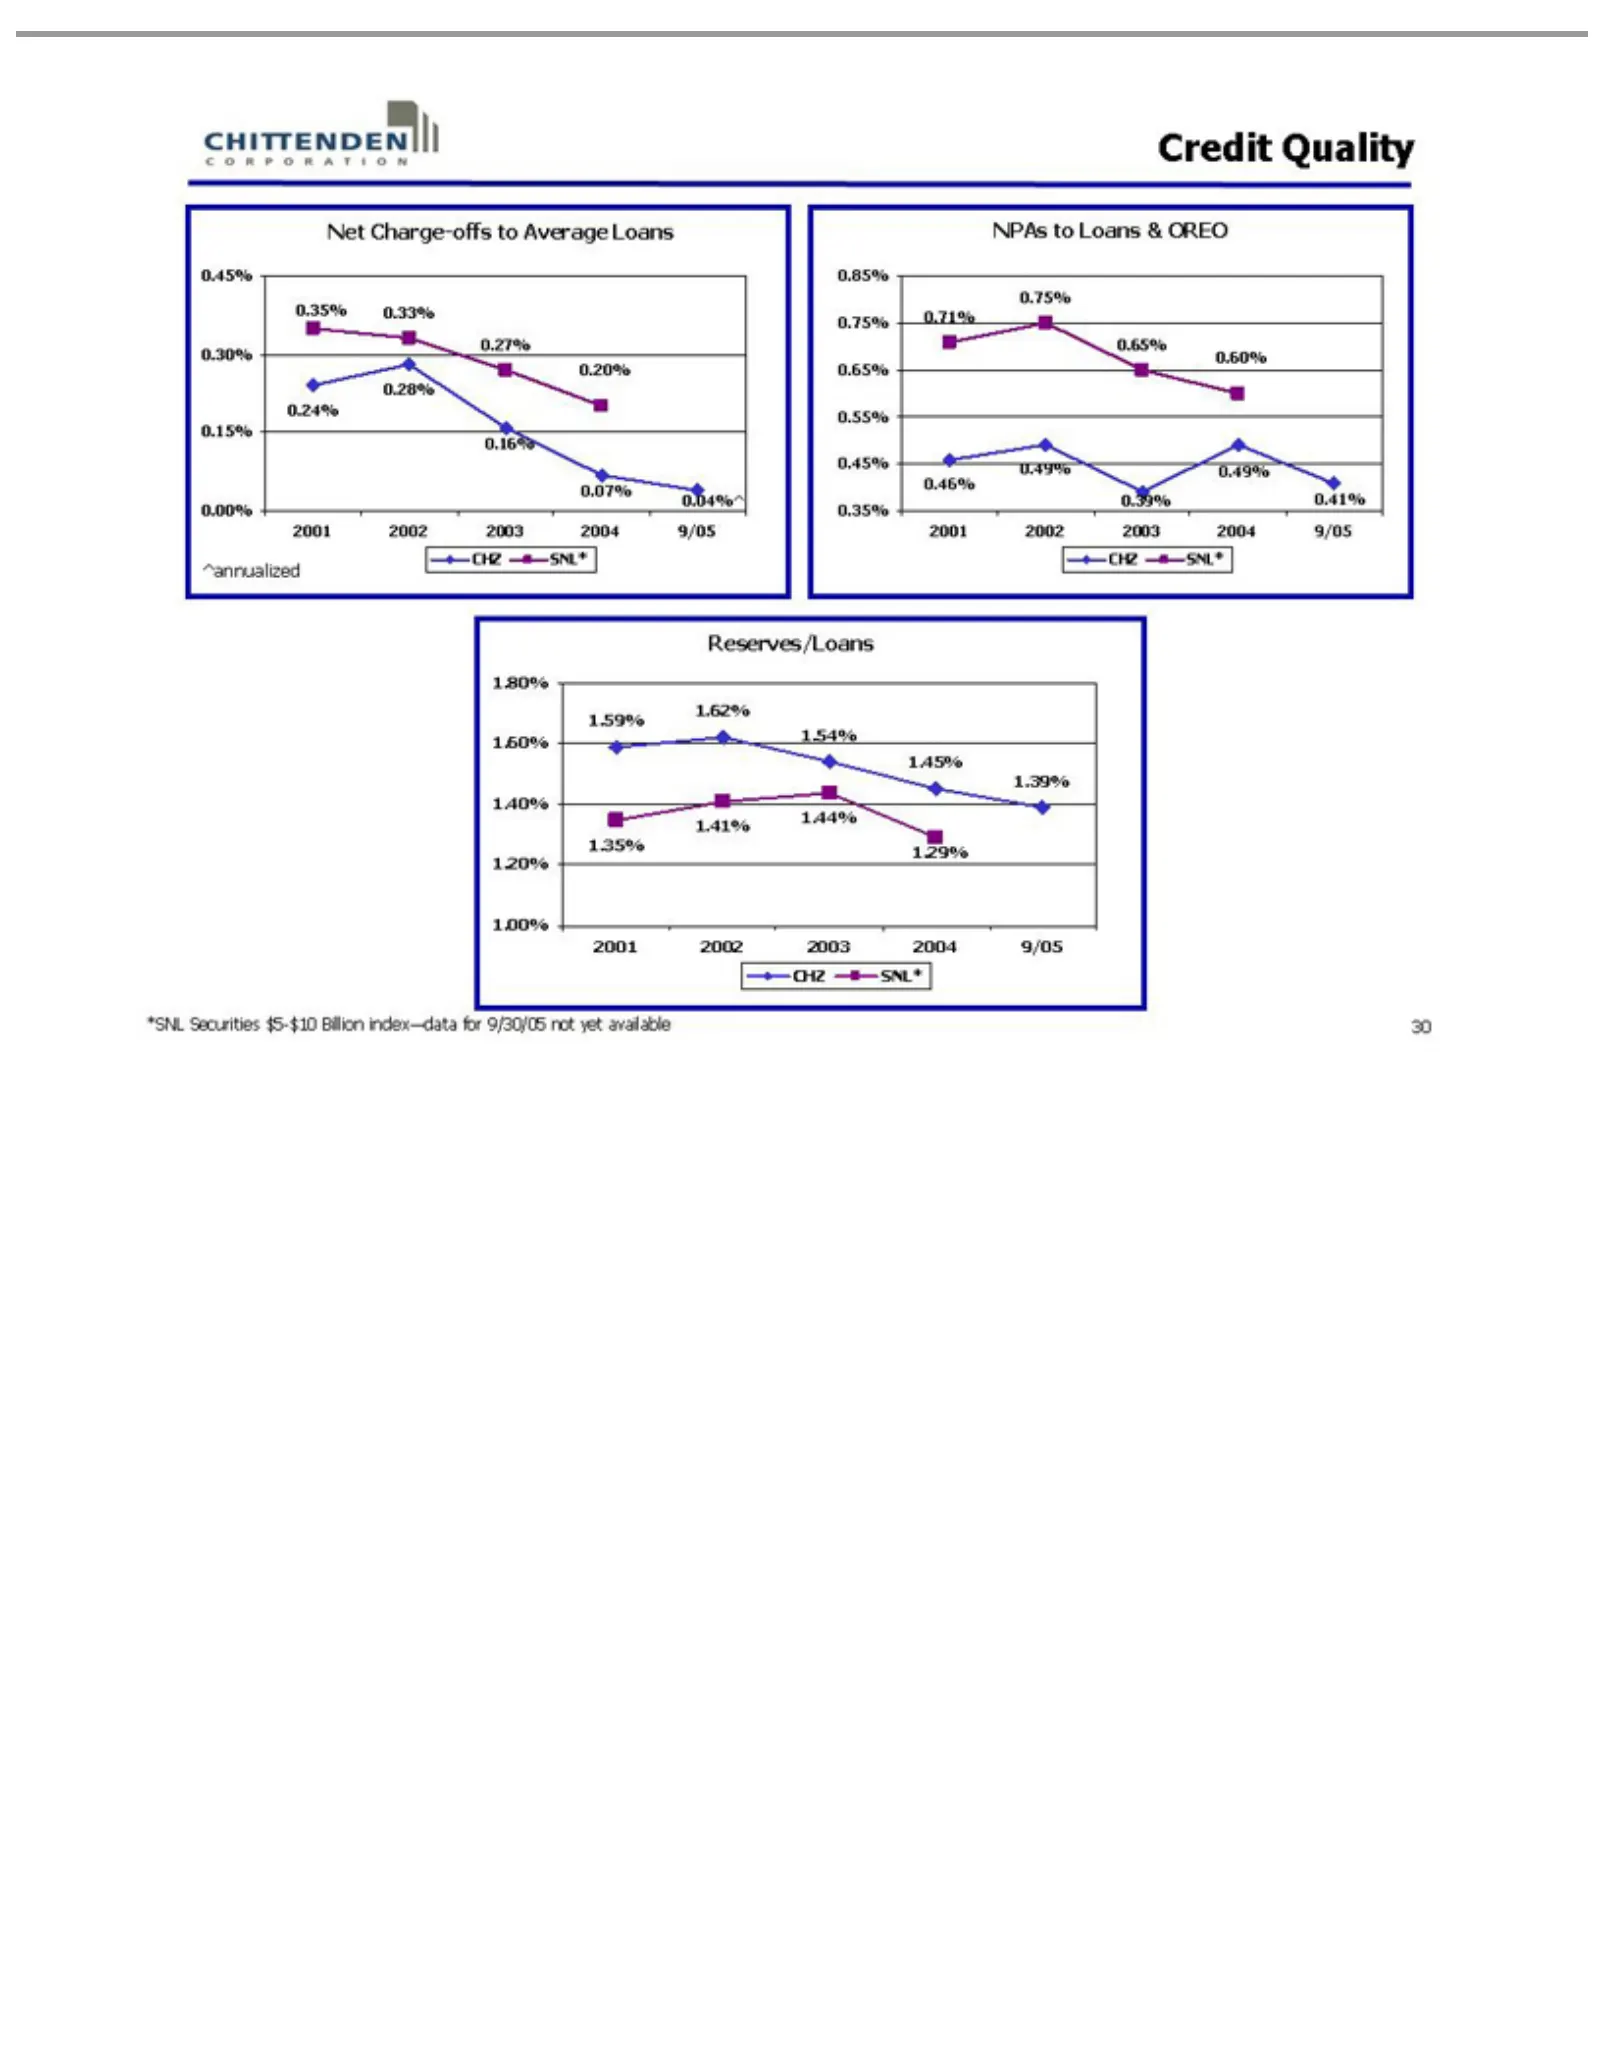
Slide 30: Credit Quality
Credit Net 0.45% 0.35% 0.20% 0.27% 0.04%^ 0.07% 0.16% NPAs ^annualized 0.85% 0.75% 0.49% 0.60% 0.65% 0.39% CHZ 1.80% Reserves/Loans 1.62% 1.44% 1.39% 1.45% 1.54% 1.35% 2001 *SNL 30 Charge-offs SNL* 2002 to Securities Quality 0.30% 0.33% 0.28% 0.75% 0.71% 0.49% 0.41% 1.60% 1.59% 1.41% 1.29% 2001 Loan
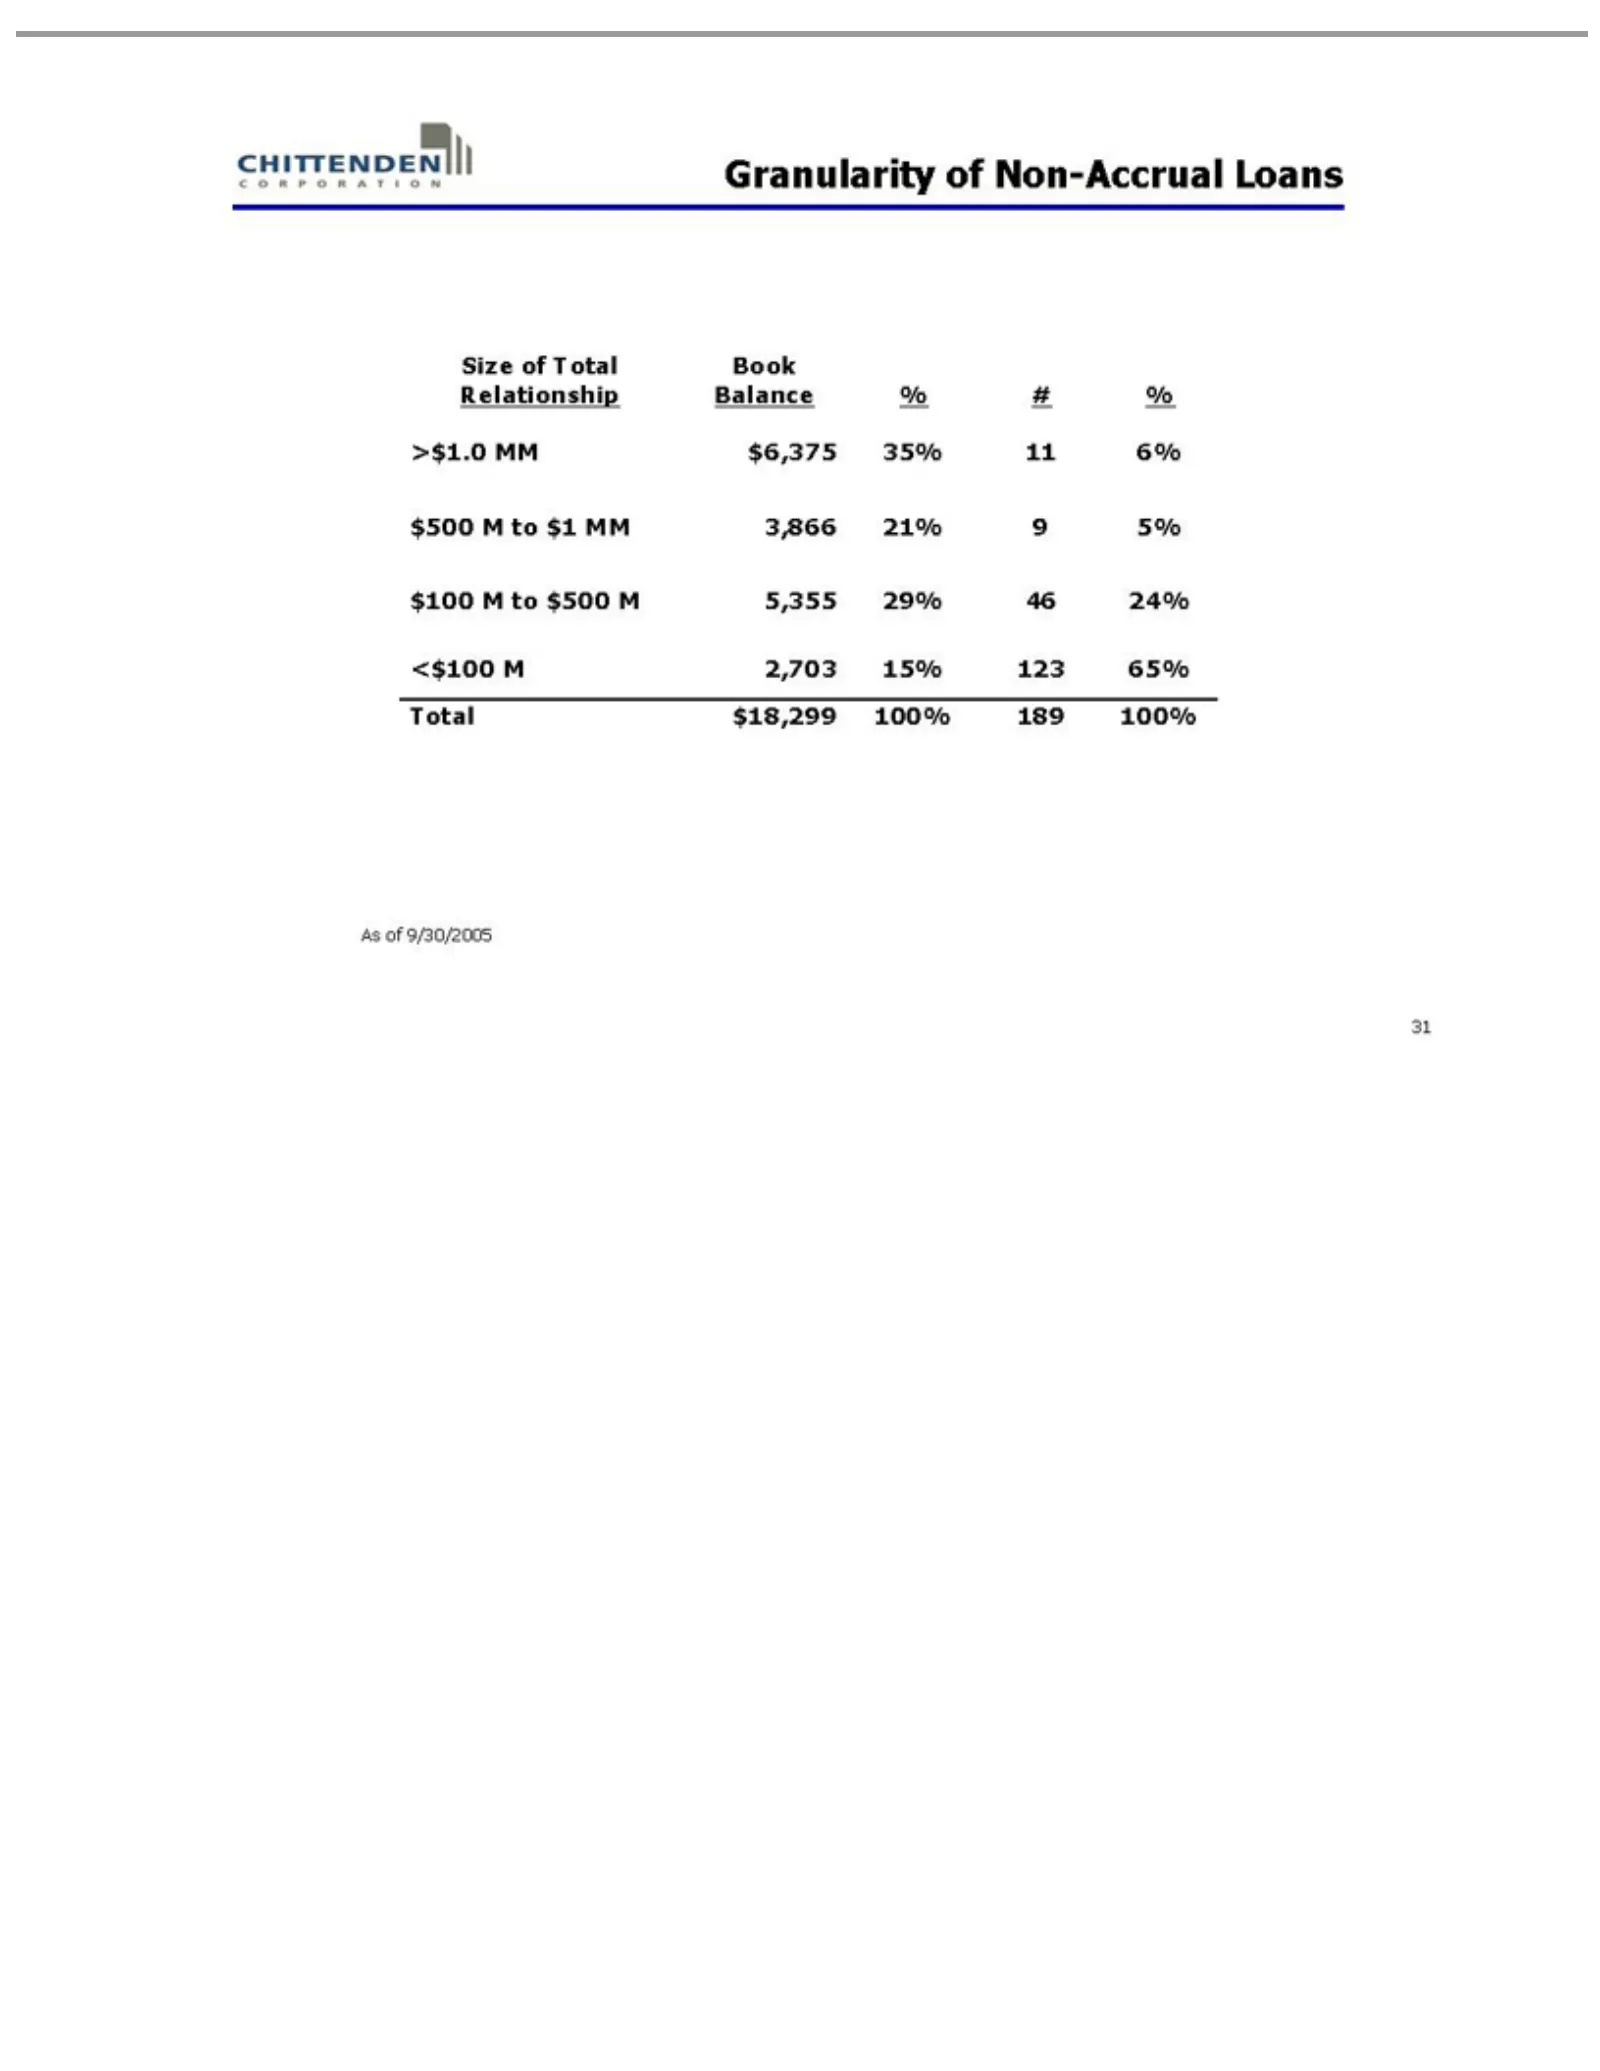
Slide 31: Granularity of Loan Relationships
Granularity Size Relationship >$1.0 $100 <$100 As 31 ofof M 9/30/2005 MMM Total to2,703 $500 $6,375 ofBalance Book Non-Accrual 15% M 35% 5,355 123 % 11 #65% 29% % 6% Loans Total 46 $500 24%$18,299 M to $1 MM 100%3,866 189 100% 21% 9 5%
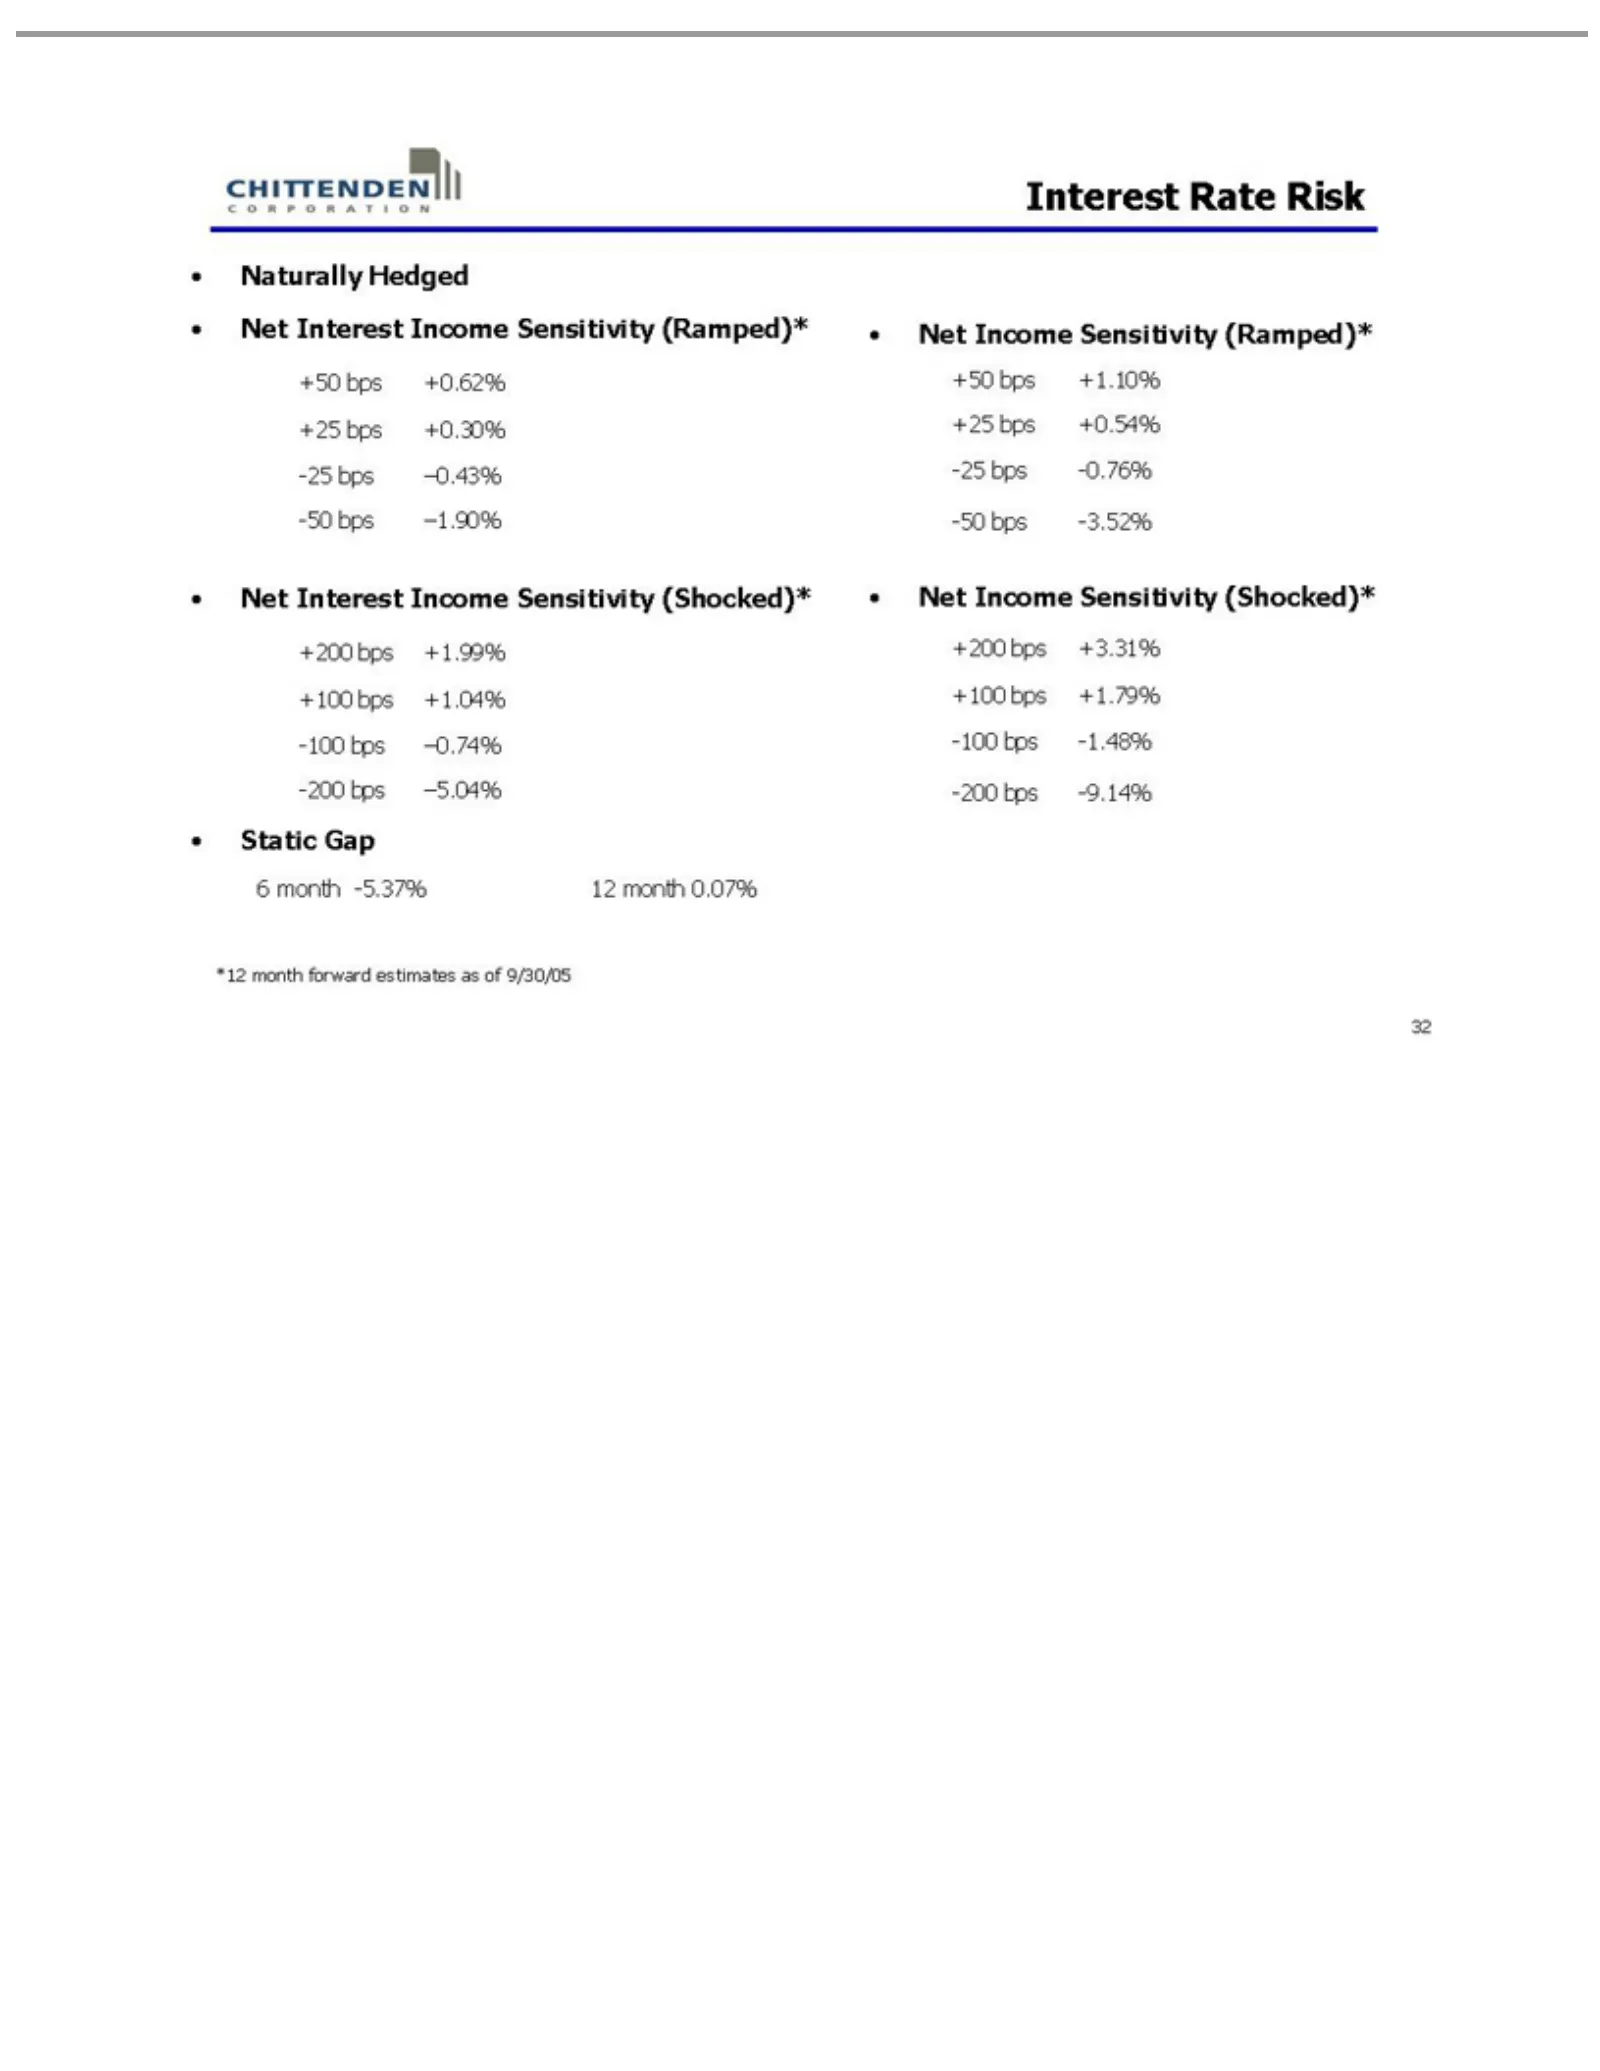
Slide 32: Interest Rate Risk Sensitivity
Interest Naturally Static 6 32 +50 -50 Net +200 -200 *12 Interest bpsGap month Rate Income month bps bps bps+0.62% +1.99% Hedged Income -3.52%Risk +1.10% -9.14%-5.37% +3.31% forward Sensitivity Sensitivity +25 +10012 +0.30% month estimates bps +1.04% as(Shocked)* (Ramped)*(Ramped)* (Shocked)* bps +0
Slide 33: In Summary
In Summary 33
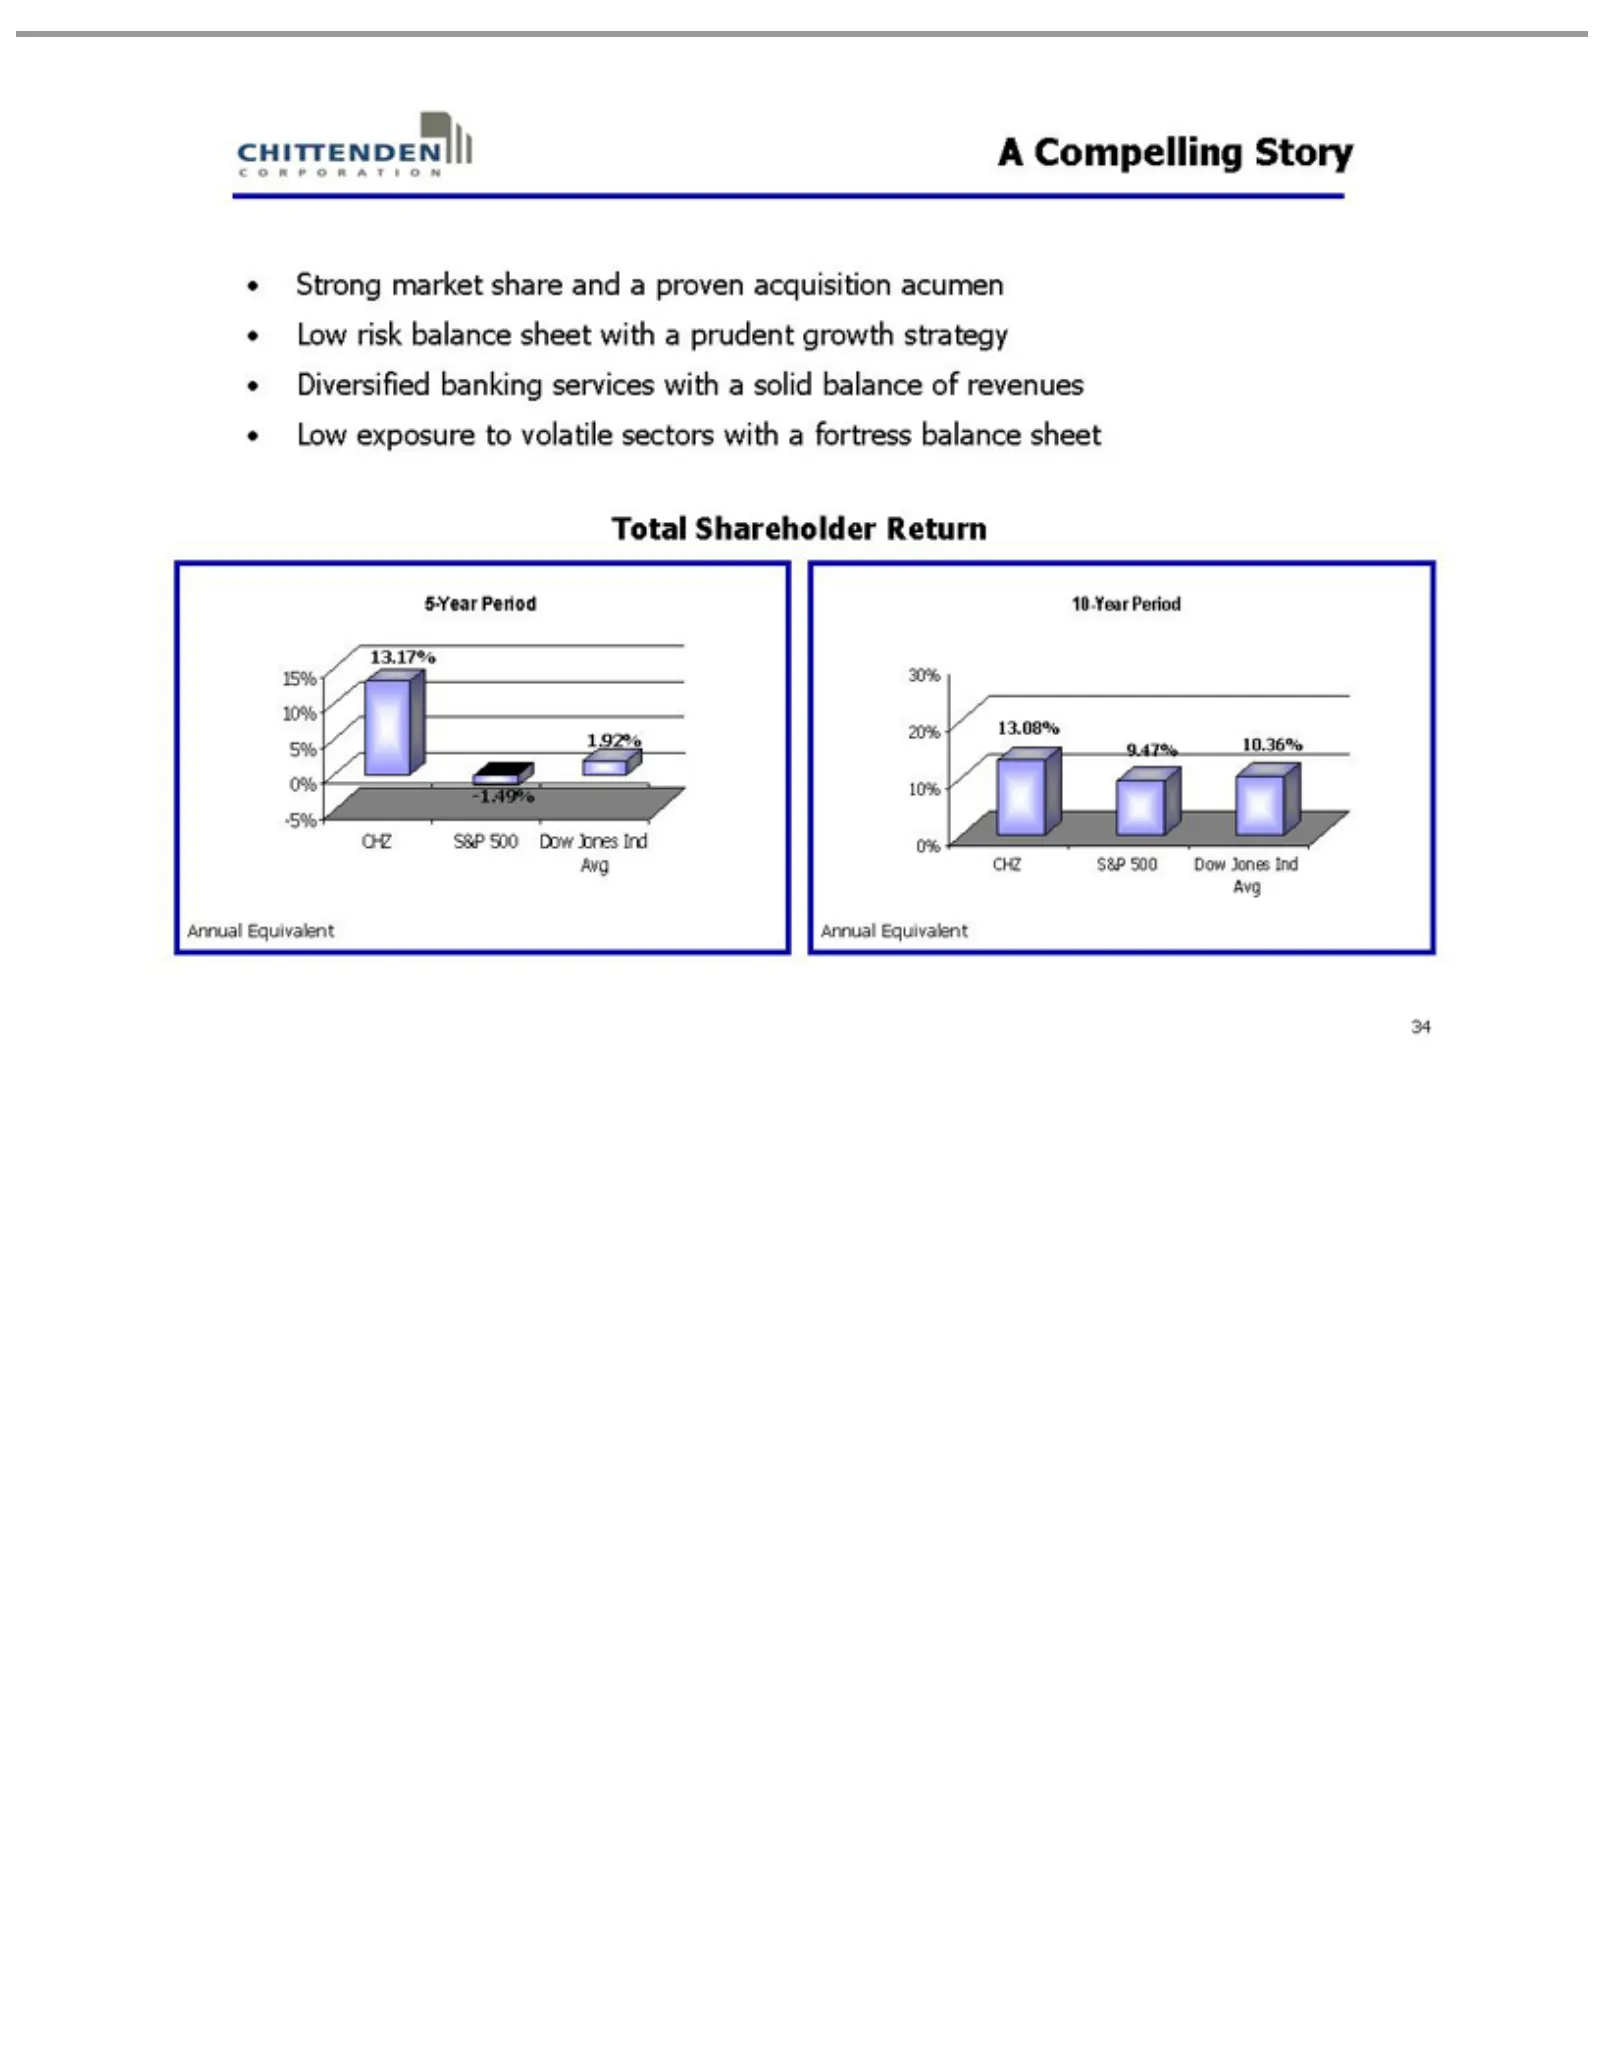
Slide 34: A Compelling Shareholder Story
A Compelling Strong sectors Total 5-Year 15% -1.49% 1.92% 13.17% 10-Year 30% 9.47% 13.08% CHZ Annual 34 10% 20% S&P Shareholder 10.36% market Period with Equivalent Period 5% 10% 500 a fortress 0% Story share Dow 0%-5% Return Jones and balance a proven Ind Avg sheet acquisition acumen Low risk balan
Slide 35: Visit our website; forward-looking statements
Visit presentation interactive This which 35 our arewebsite subject services: for contains to www.chittendencorp.com aa number wide“forward-looking range of factors of products, and statements” uncertainties latest financial which that reports could may describe cause and many future future other re
Slide 36: Appendix
36 Appendix
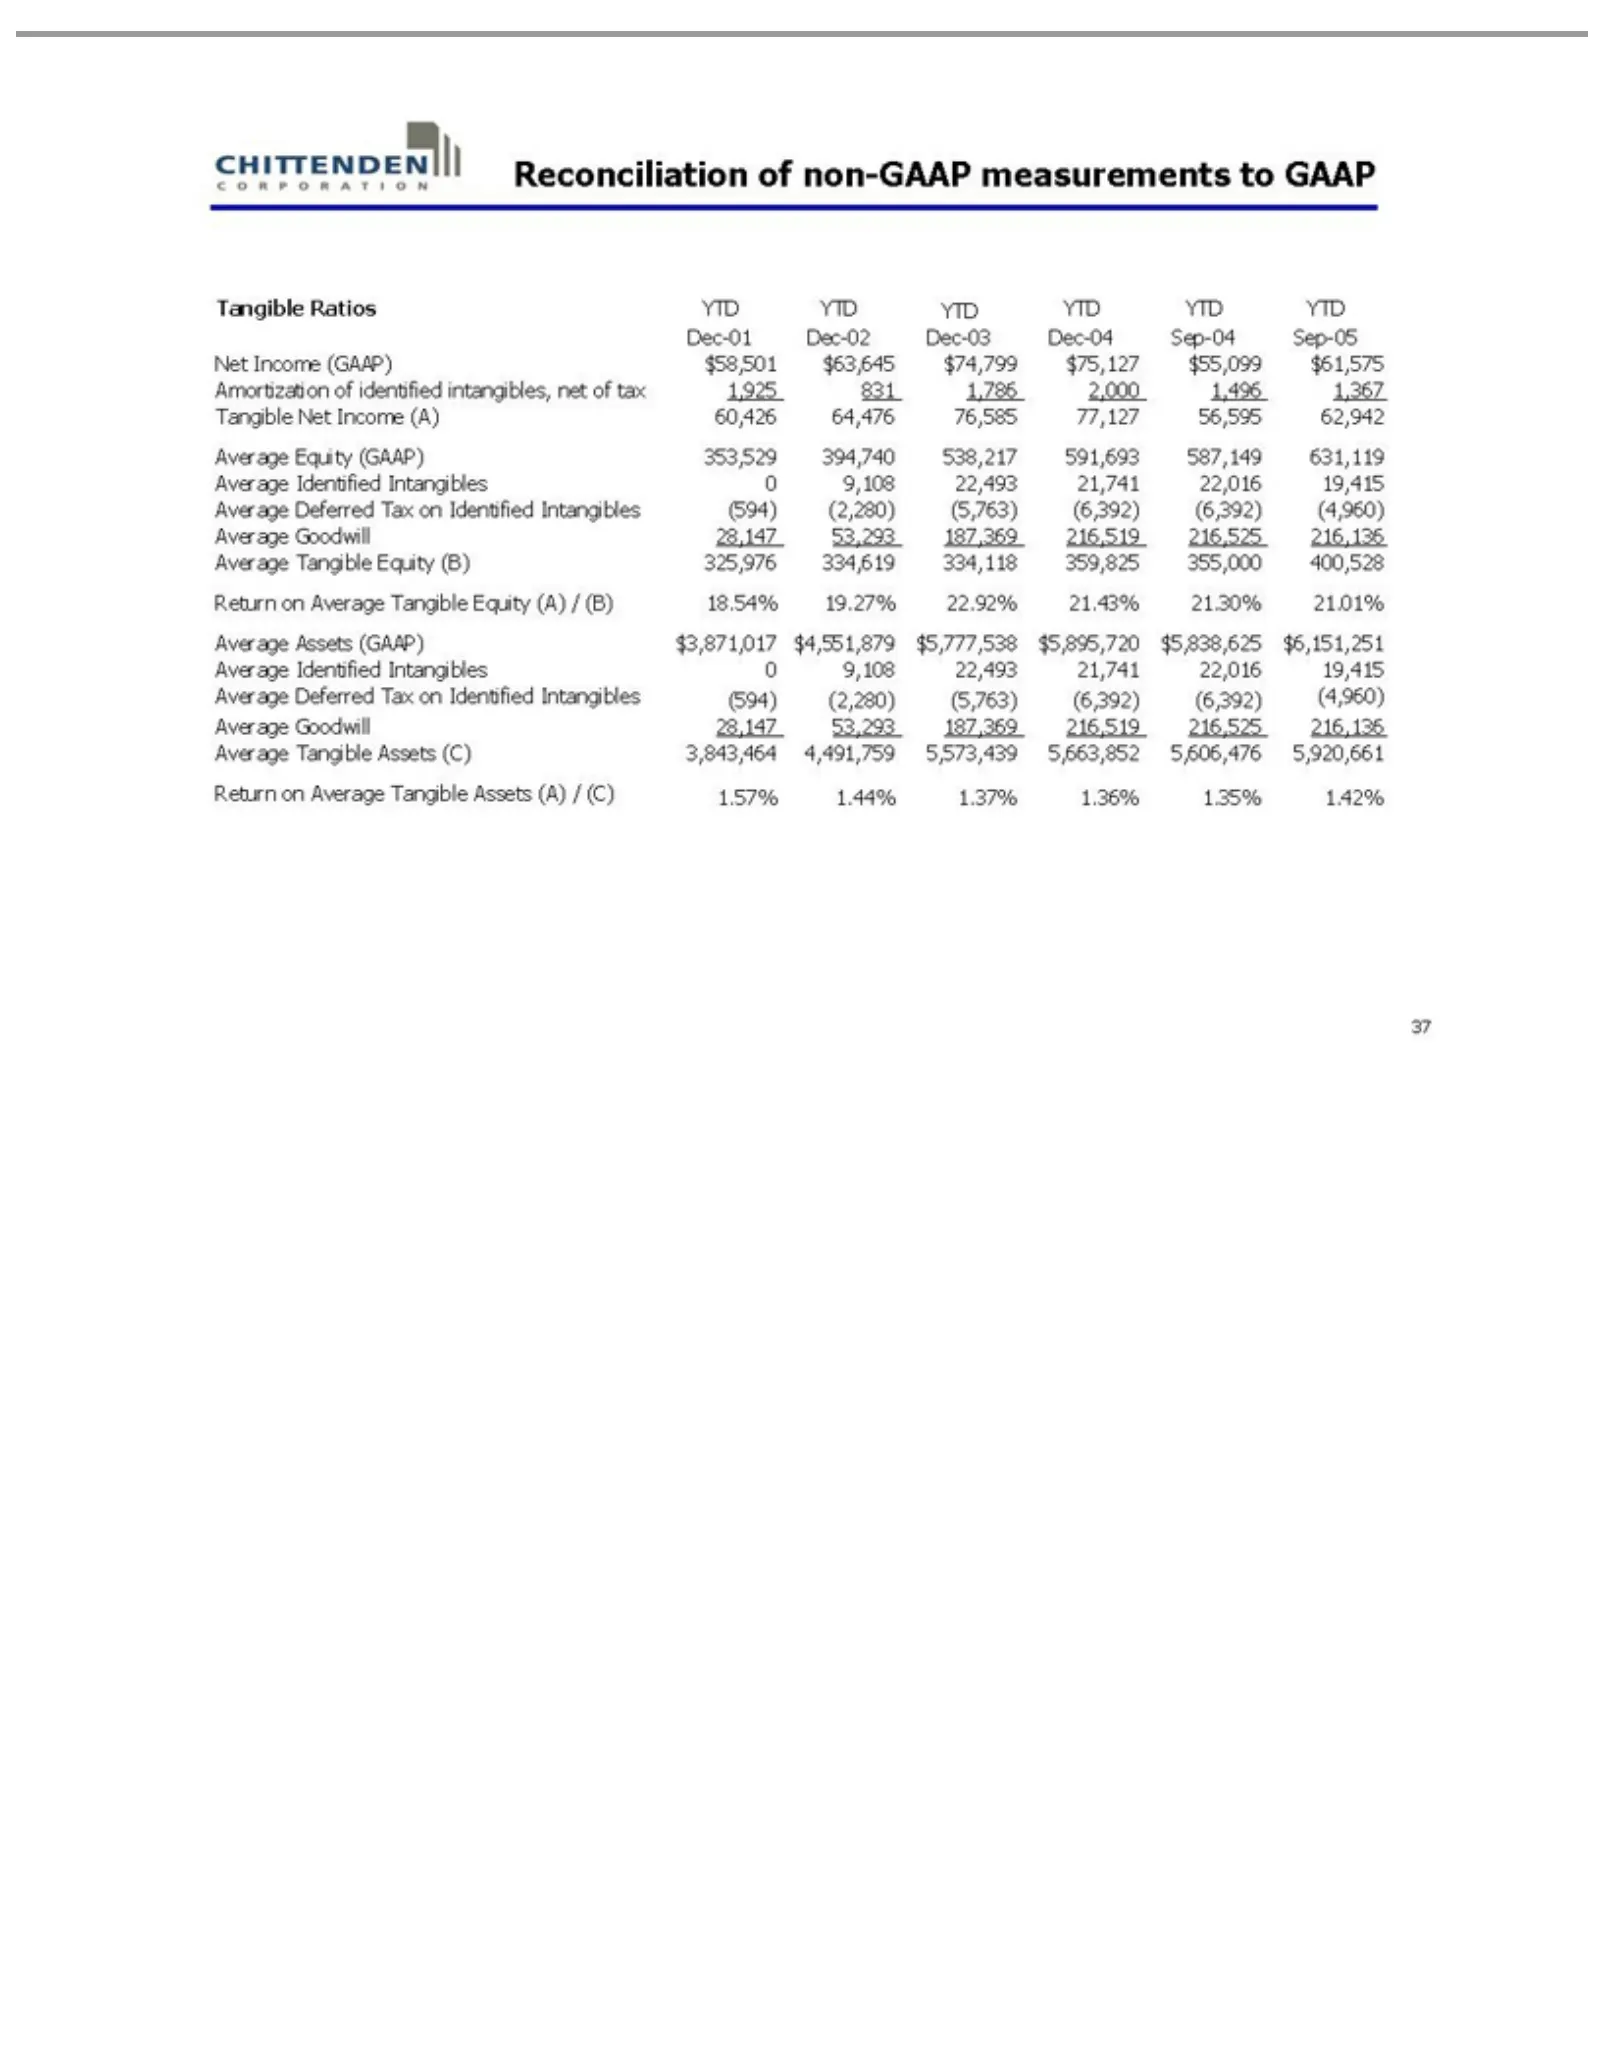
Slide 37: Reconciliation of Tangible Ratios
Reconciliation Tangible Dec-01 1,367 22,493 Average (GAAP) (594) 5,920,661 37 (2,280) Tangible 21,741 Dec-02 Tangible $3,871,017 Ratios Return (5,763) 22,016 of Net Dec-03 YTD non-GAAP on Equity Income $4,551,879 Average (6,392) YTD 19,415 Dec-04 (B)YTD (A) 325,976 (6,392) measurements Average Tangi
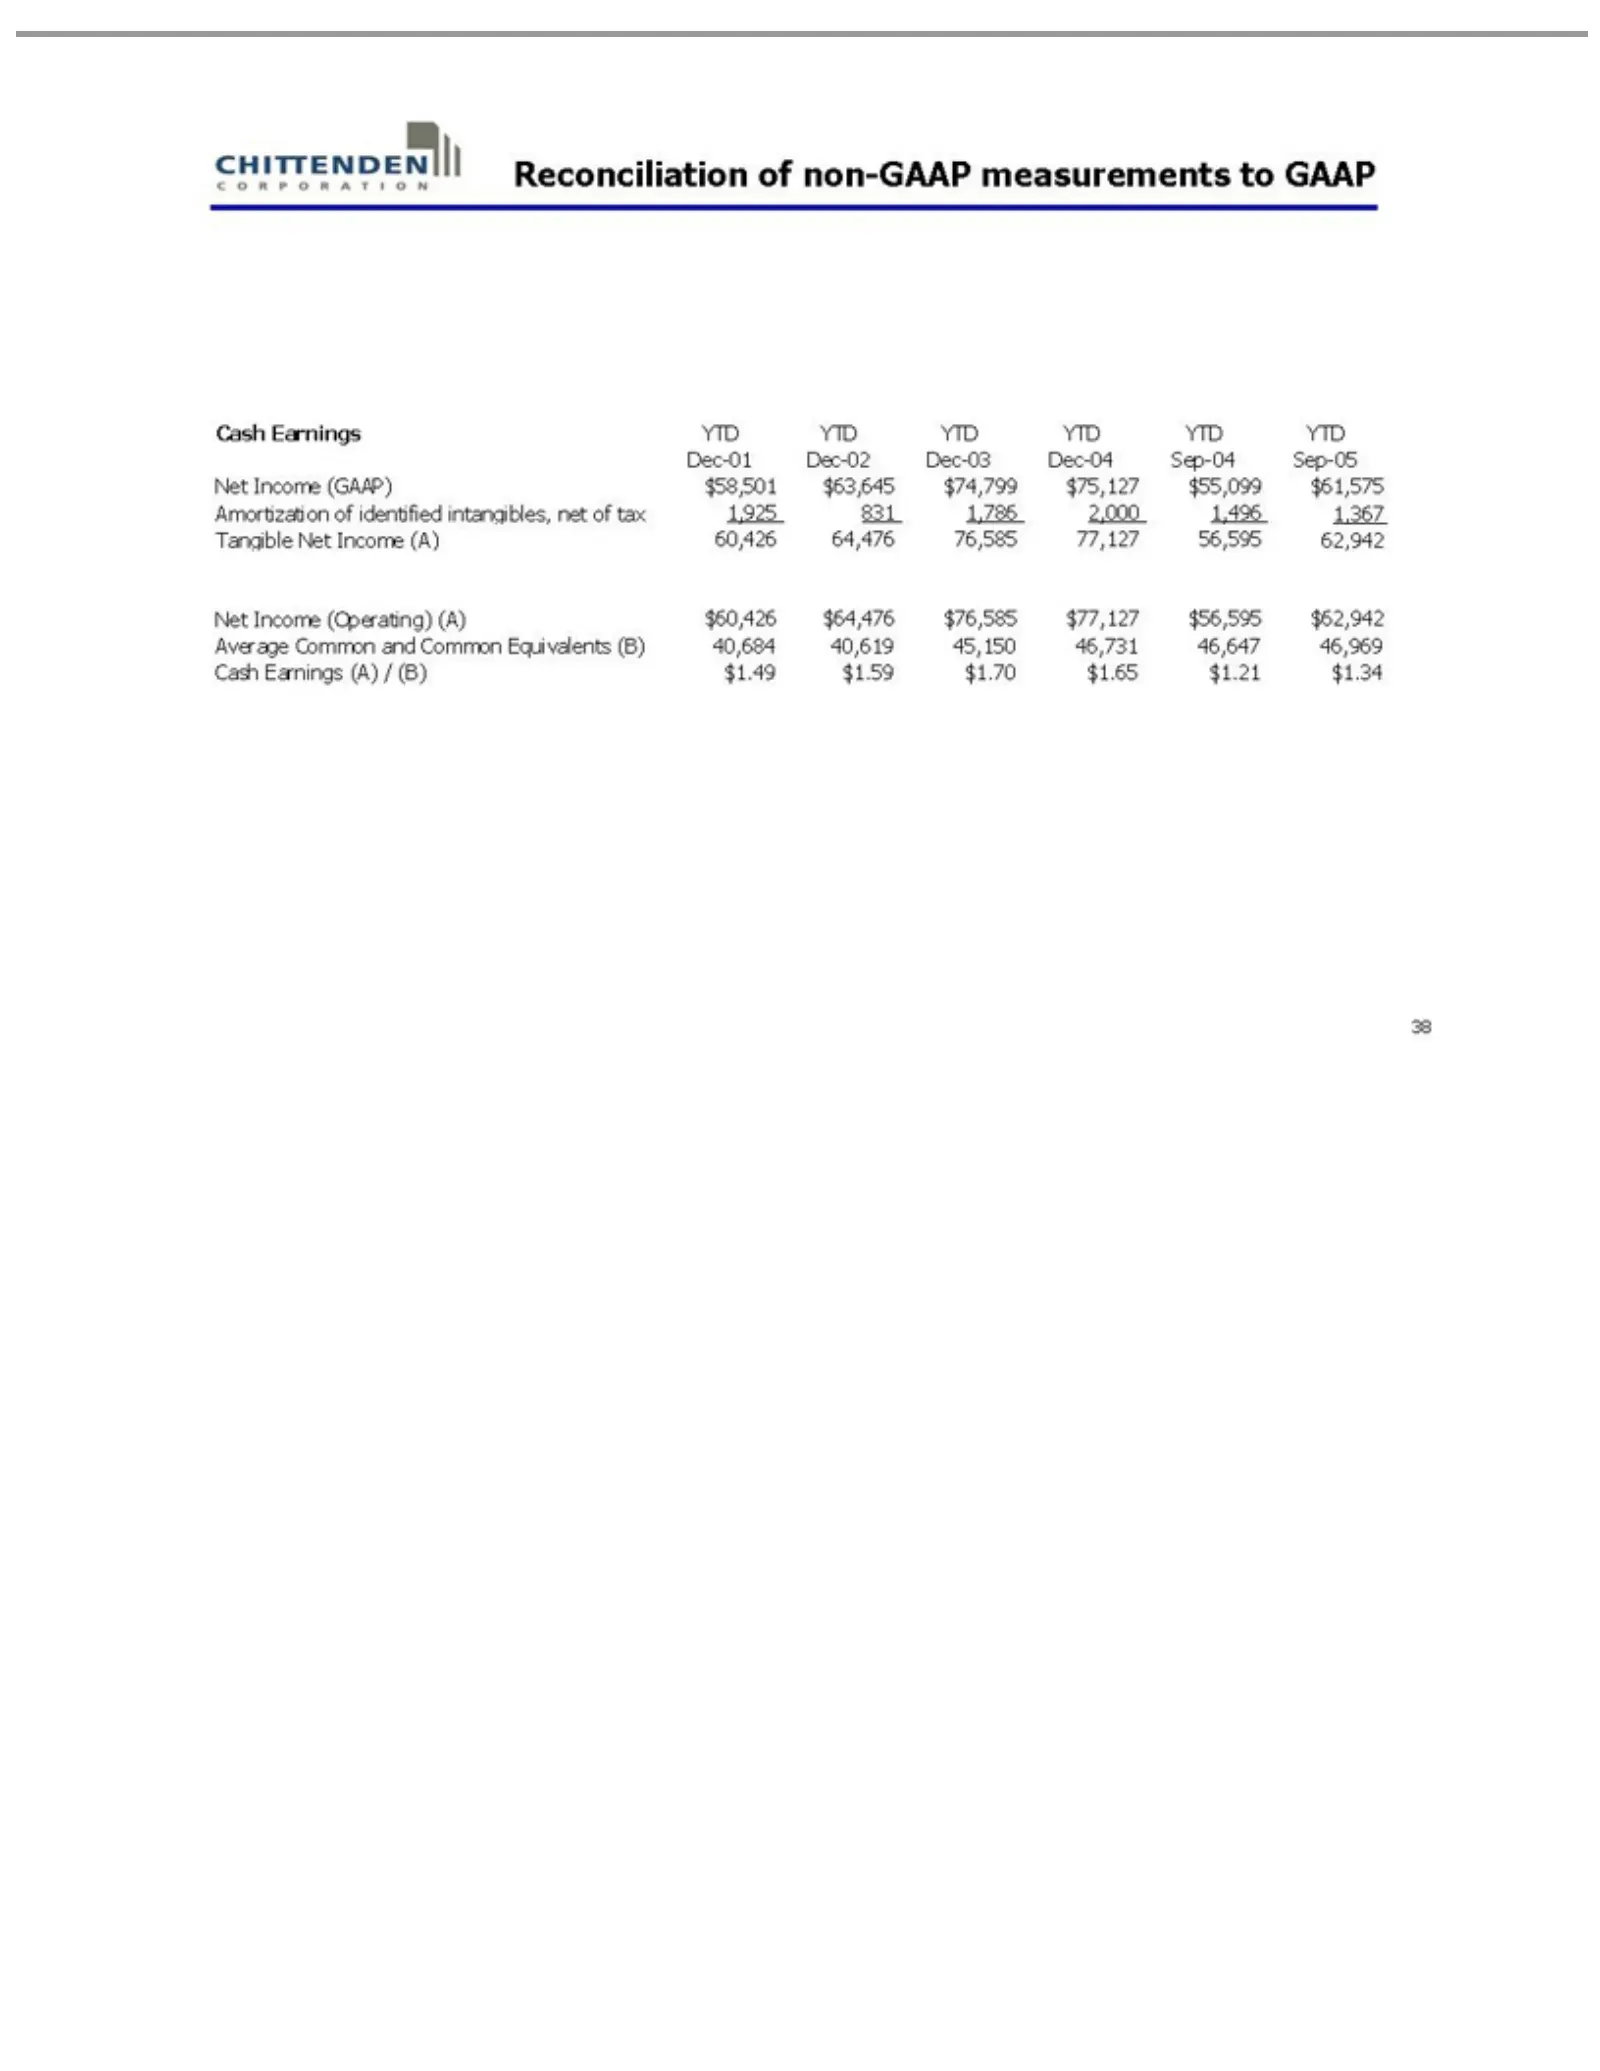
Slide 38: Reconciliation of Cash Earnings
Reconciliation Cash Dec-01 1,367 Net (B) 38 $1.49 Income Earnings Tangible Dec-02 $1.59 (Operating) YTD of Net Dec-03 $1.70 non-GAAP Income YTD $1.65 Dec-04 (A) YTD (A) $60,426 $1.21 measurements Sep-04 60,426 YTD$1.34 $64,476 YTD 64,476 Sep-05 YTD to$76,585 76,585 GAAP Net Income 77,127 $77,127 (GA
Source: SEC EDGAR · 8-K filed Oct 21, 2005
More decks from Chittenden Corp
 Investor Presentation (September 2007)38 slides · Sep 7, 2007
 Merger or Acquisition (June 2007)27 slides · Jun 27, 2007
 Chittenden — Merger or Acquisition (June 2007)25 slides · Jun 27, 2007
 Merger or Acquisition (June 2007)9 slides · Jun 5, 2007
 Investor Presentation (May 2007)36 slides · May 14, 2007
 Investor Presentation (February 2007)37 slides · Feb 16, 2007