CenterState Bank — CenterState Banks — KBW 2013 Community Bank Conference
45 slides from CenterState Bank's conference presentation, Jul 30, 2013

Slide 1: KBW 2013 Community Bank Conference
KBW 2013 Community Bank Conference July 30, 2013 Exhibit 99.2
Slide 2: Forward Looking Statement
2 This presentation contains forward-looking statements, as defined by Federal Securities Laws, relating to present or future trends or factors affecting the operations, markets and products of CenterState Banks, Inc. (CSFL). These statements are provided to assist in the understanding of future fin

Slide 3: Company Overview
Company Overview
Slide 4: Corporate Overview
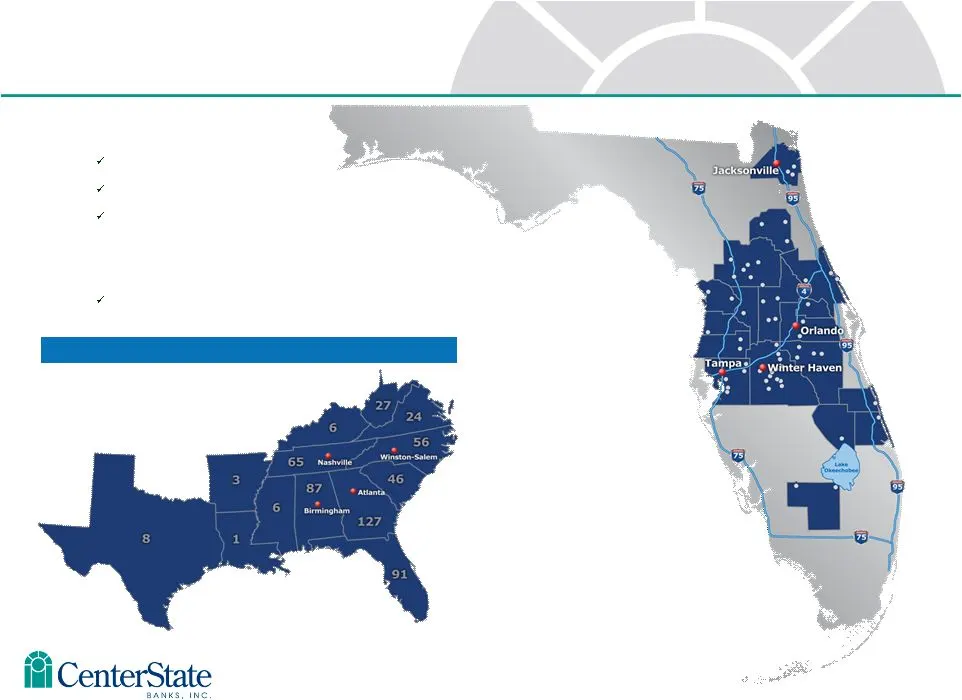
Correspondent Banking Market Data as of 6/30/13 • Headquartered in Davenport, FL $2.4 billion in assets $1.4 billion in loans $2.0 billion in deposits • Company formed: June 2000 1 Subsidiary Bank Corporate Overview
Slide 5: Acquisitions and New Fee-Based Business Lines
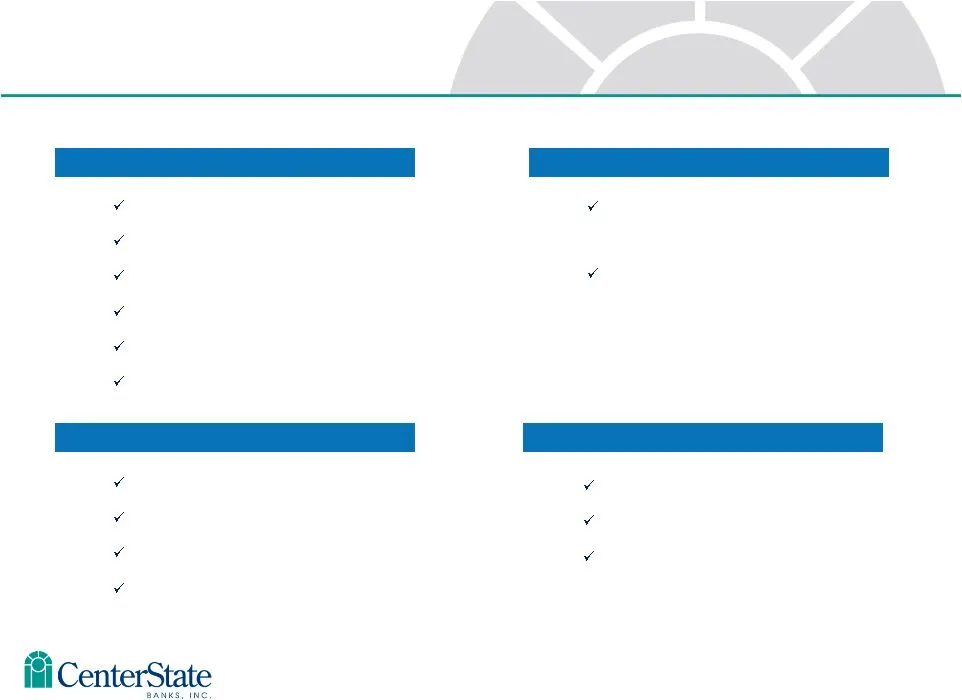
Non – FDIC Acquisitions FDIC Acquisitions New Fee-Based Business Lines Strategic Expansion & Management Lift-Outs Ocala National Bank Olde Cypress Community Bank Independent National Bank of Ocala Community National Bank of Bartow Central Florida State Bank First Guaranty Bank & Trust Co. Federal Tr
Slide 6: CSFL Advantages: Best Positioned Florida Consolidator
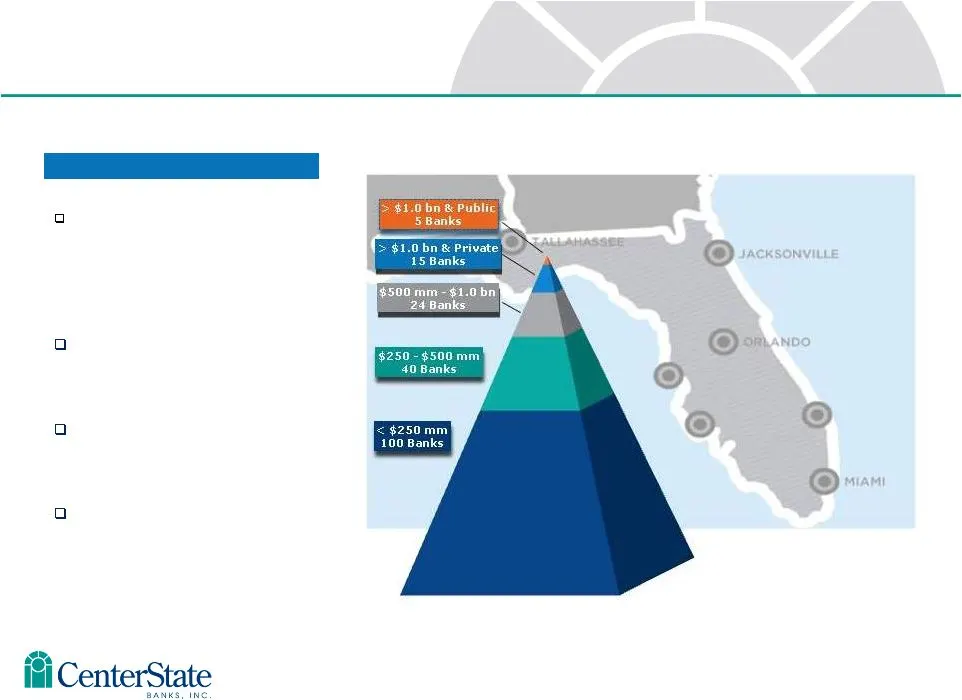
18 CSFL Advantages CSFL is one of only five major exchange traded banks headquartered in FL with assets between $1 billion and $10 billion Proven experience through 8 successful acquisitions in the past 3 years Disproportionate number of sellers versus very few buyers The number of small, distressed

Slide 7: Second Quarter Financial Summary
Quarter Financial Summary nd
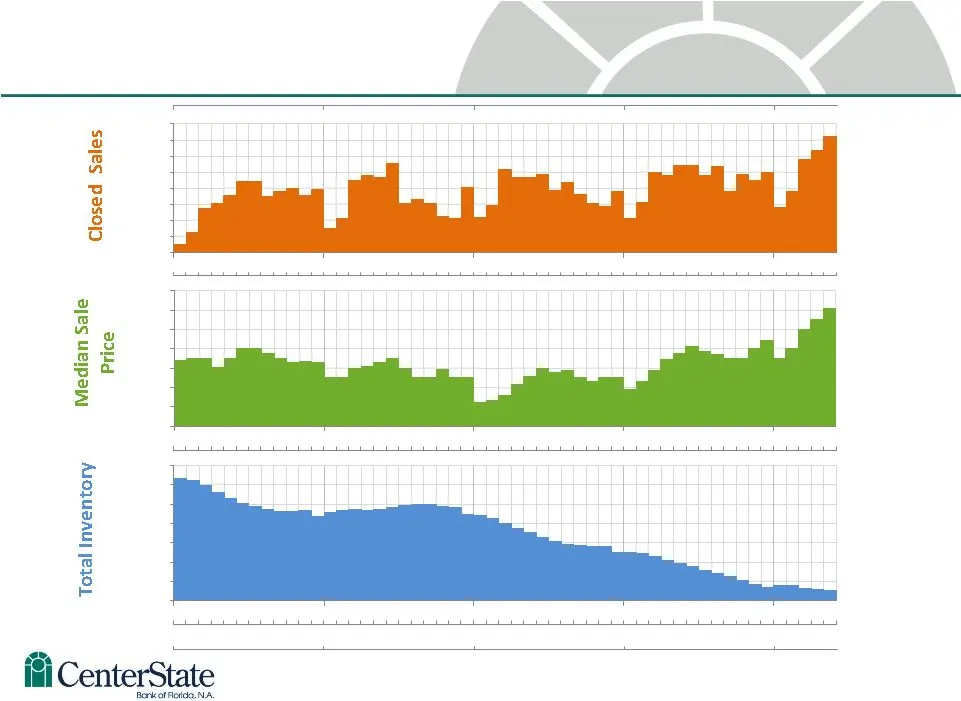
Slide 8: Florida Real Estate – Single Family Homes
Source: Florida Realtors Monthly Market Detail (May 31, 2013) – Single Family Homes J F M A M J J A S O N D J F M A M J J A S O N D J F M A M J J A S O N D J F M A M J J A S O N D J F M A M J F M A M J J A S O N D J F M A M J J A S O N D J F M A M J J A S O N D J F M A M J J A S O N D J F M A M J F
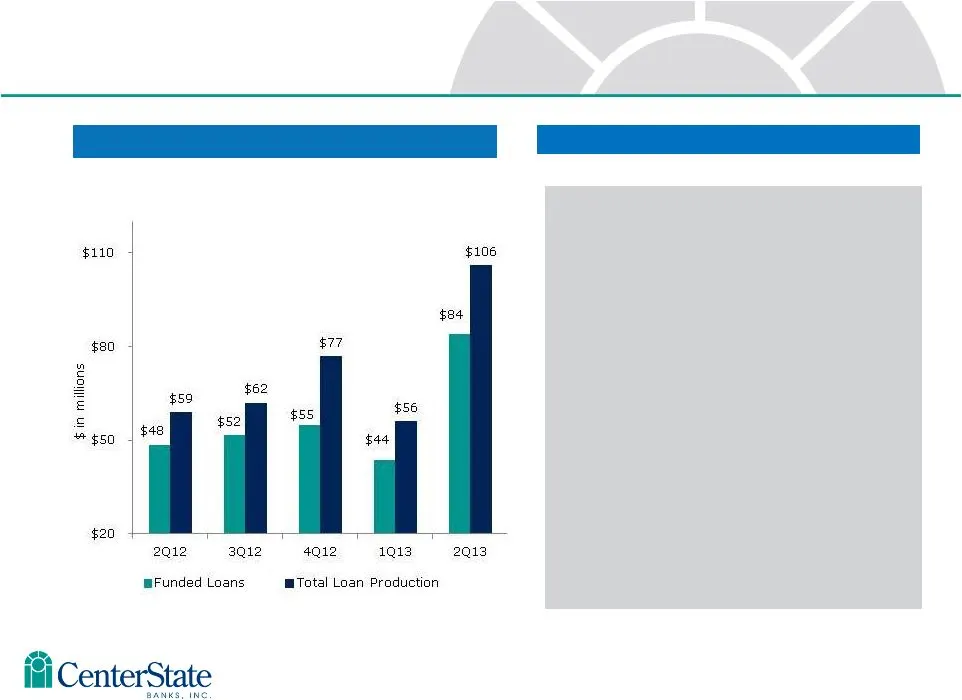
Slide 9: Loan Production by Quarter
Loan Production by Quarter Current Quarter Production Statistics Non-Covered Loan Growth • Current Qtr annualized 14.7% • YTD annualized 6.9% • Avg yld funded loans 4.13% • 41% CRE • 31% Resi • 10% C&I • 18% all other • Loan pipeline: Current: $150M End of 1Q13: $175M End of 4Q12: $110M
Slide 10: Quarter Summary of Financial Results
2Q 2013 1Q 2013 Current Qtr take-aways 2 Quarter Summary of Financial Results EPS $0.09 $0.15 • Higher loan loss provision $1,374 vs. ($360) • Higher IA amortization • Lower bond sales • Loan growth • Resilient NIM • 4.59% vs. 4.64% (4.38%) vs. (4.27%) • Covered loan performance • Potential future A

Slide 11: Acquisition of Gulfstream Bancshares, Inc.
Acquisition of Gulfstream Bancshares, Inc. July 30, 2013
Slide 12: oO Ge OF a
oO Ge OF a

Slide 13

Slide 14

Slide 15

Slide 16
Slide 17
Slide 18: Transaction Rationale
Strategic Rationale Attractive Financial Returns Low Risk Profile • Strong double-digit % EPS accretion • Accelerates profitability metrics • Earn back of TBV dilution within 3.5 to 4 years • >20% IRR • CSFL is an experienced Florida acquirer – 9th deal since • Thorough due diligence (80% of the loa
Slide 19: Transaction Terms
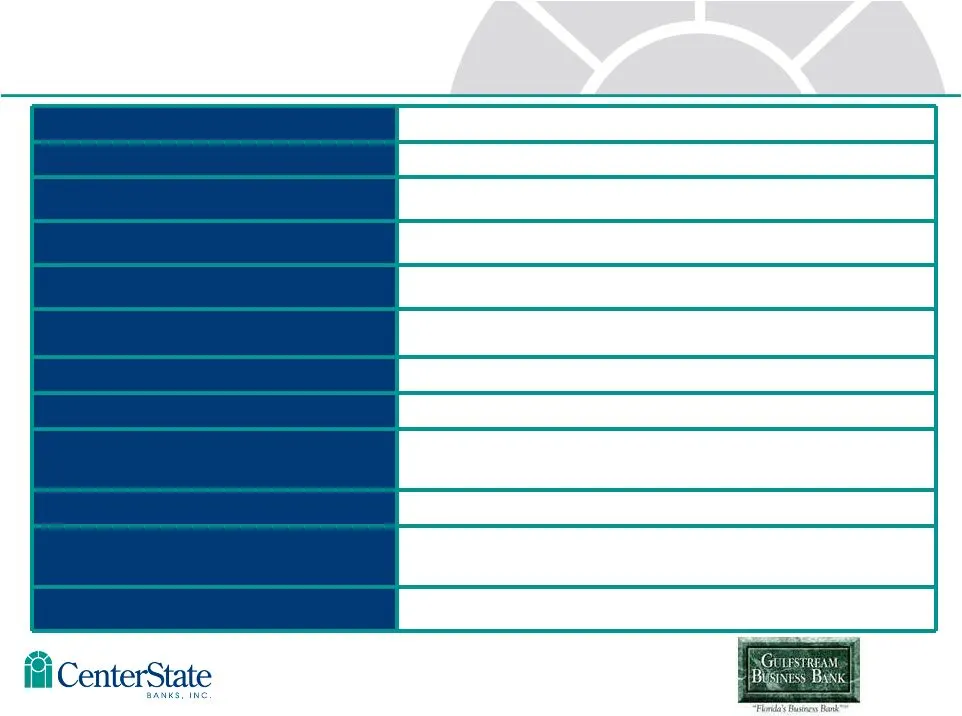
Transaction: Consideration Mix: Consideration Per Share: Implied Deal Value Per Share (1) : Aggregate Deal Value (1)(2)(3) : Gulfstream Pro Forma Ownership (1) : Preferred Equity: Capital Raise: Board Seats: Management Required Approvals: Expected closing: (1) Based on CSFL 20 day closing VWAP of $9
Slide 20: Logical Extension of Existing Treasure Coast Presence
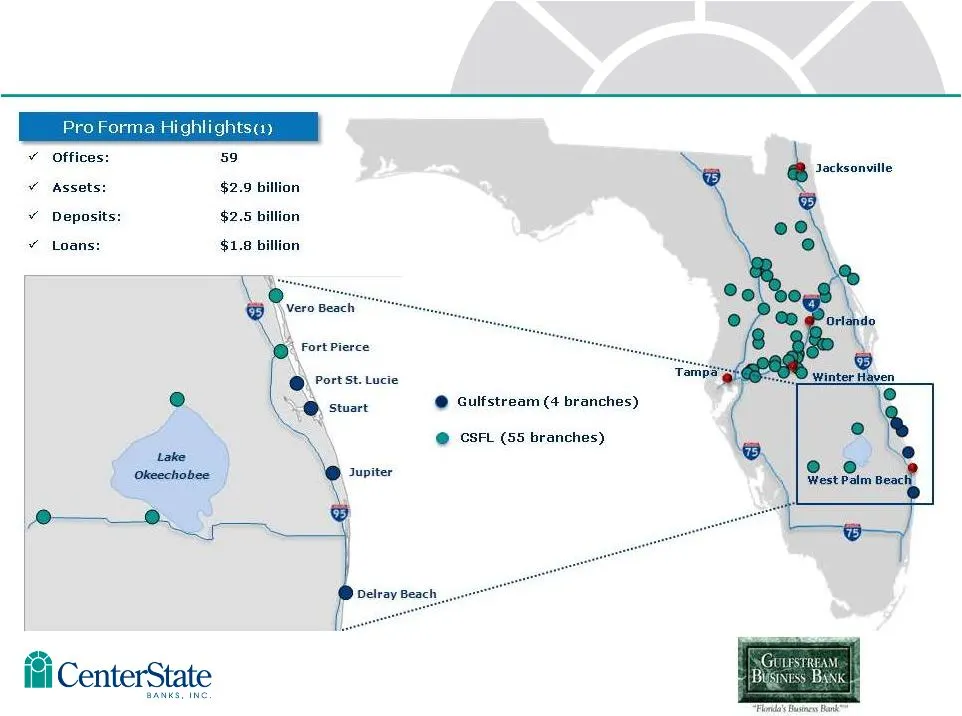
Logical Extension of Existing Treasure Coast Presence (1) Financial data as of 6-30-13
Slide 21: Gulfstream Bank Highlights
Gulfstream Bank Highlights Founded – Total Assets – $572 million Gross Loans – $368 million Total Deposits – $486 million Earnings Predictable core earnings 12 year average efficiency ratio of 52% ROAA of 0.73% in 2012 Branches – Headquarters in Stuart, FL Branches in Port St. Lucie, Jupiter & Delra
Slide 22: Pro Forma Loan Composition
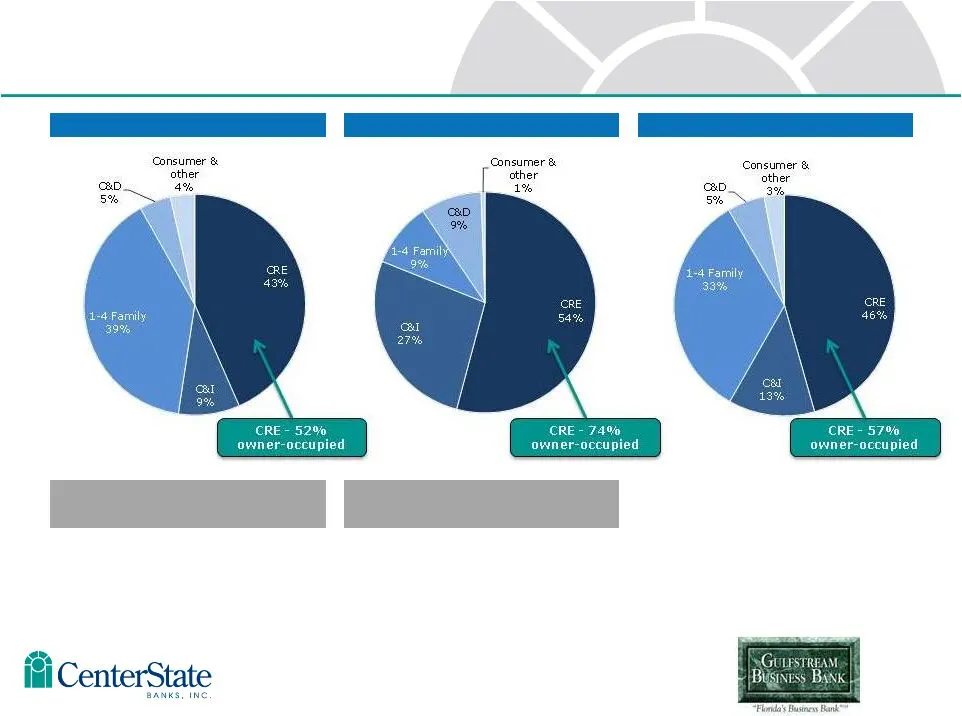
CSFL Loan Composition Gulfstream Loan Composition Pro Forma Loan Composition (1) Pro Forma Loan Composition (1) Excludes purchase accounting adjustments Data as of June 30, 2013 Source: CSFL Earnings Release dated July 22, and Gulfstream management MRQ CSFL Yield on Non- Covered Loans: 4.86% MRQ Gul
Slide 23: Pro Forma Deposit Composition
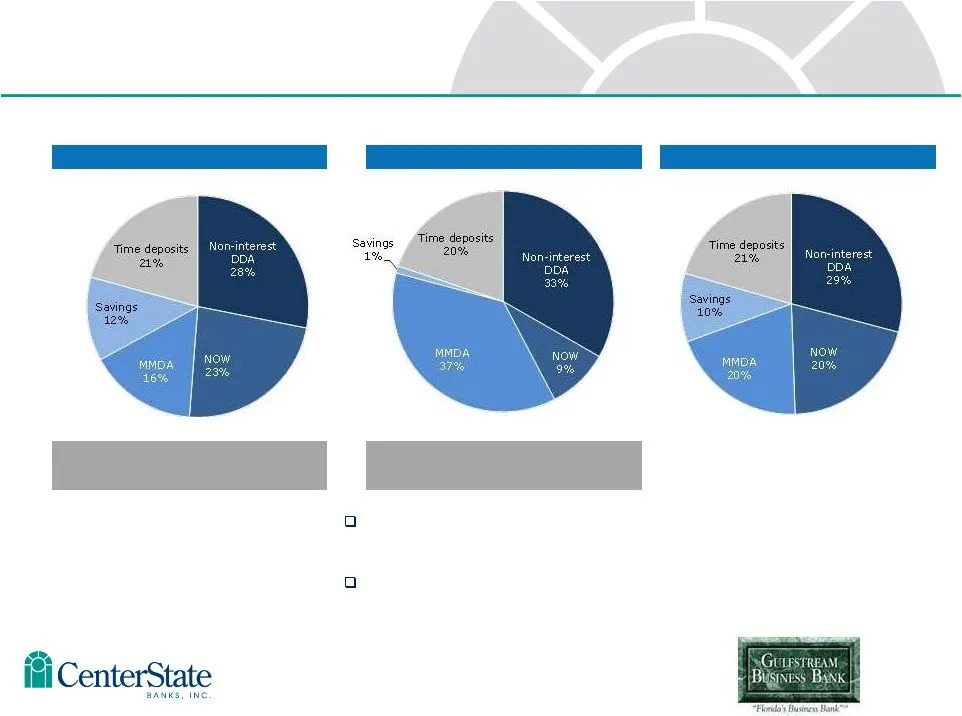
CSFL Deposit Composition Gulfstream Deposit Composition Pro Forma Deposit Composition (1) Pro Forma Deposit Composition (1) Excludes purchase accounting adjustments Data as of June 30, 2013 Source: CSFL Earnings Release dated July 22, and Gulfstream management MRQ CSFL Cost of Total Deposits: 0.27%
Slide 24: iti CenterState
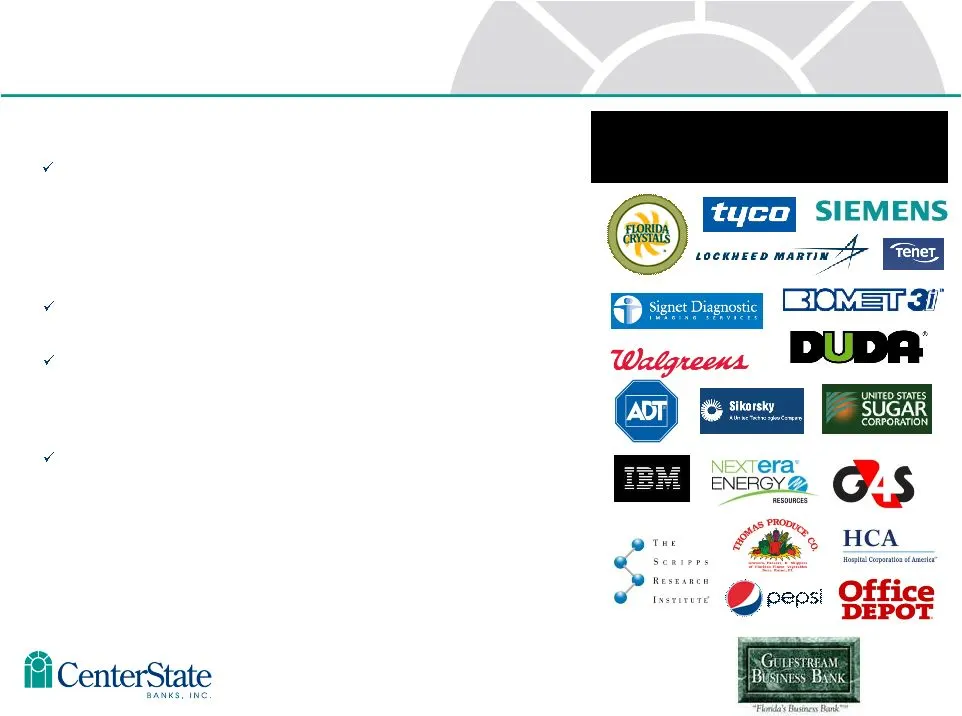
iti CenterState Petite SIEMENS NexTera nae Gi§ ote , o Reseancn Insrivere Qeoers O Office
Slide 25: Financial Impact
Financial Impact (1)(2)(3) COST SAVINGS OF 22%, $2.6 MILLION 75% realized in 2014 100% realized in 2015 ONE-TIME MERGER RELATED EXPENSES $5.3 million (After-tax) NO REVENUE SYNERGIES MODELED CDI - 1.00%, amortized over 10 years 150% DDB SBLF REDEEMED AT PAR AT CLOSING GROSS CREDIT MARK 5%, $18.6 MIL
Slide 26: Due Diligence
Due Diligence Summary CenterState’s diligence team has completed due diligence assignments on 27 banks since 2008. All acquired banks are outperforming their initial marks. 460 loan files were reviewed representing 80% of the portfolio balance and 100% of nonperforming loans balance 100% of OREO was
Slide 27: Attractive Position in Desirable Markets
Number Total of FL Deposits Rank Company City Offices ($MMs) 2 CSFL - Gulfstream Pro Forma Davenport 59 2,478 Florida Community Bank Total 570 49,176 Number Total of FL Deposits Rank Company City Offices ($MMs) 1 CSFL - Gulfstream Pro Forma Davenport 59 2,508 CSFL - Gulfstream Market Total 518 22,45
Slide 28: Concluding Thoughts
Concluding Thoughts Complements our existing Treasure Coast franchise and provides entry into Palm Beach County with growth potential Strategically and financially attractive combination with significant EPS accretion and accelerated profitability metrics Integration experience and existing local te
Slide 29: Investor Contacts
Investor Contacts Ernie Pinner Chairman & Chief Executive Officer John Corbett Executive Vice President / Bank - President & Chief Executive Officer Jim Antal Senior Vice President & Chief Financial Officer Steve Young Treasurer / Bank - Chief Operating Officer Holding Company Headquarters in Davenp

Slide 30: Appendix
Appendix
Slide 31: Profitability Metrics – 6 Years
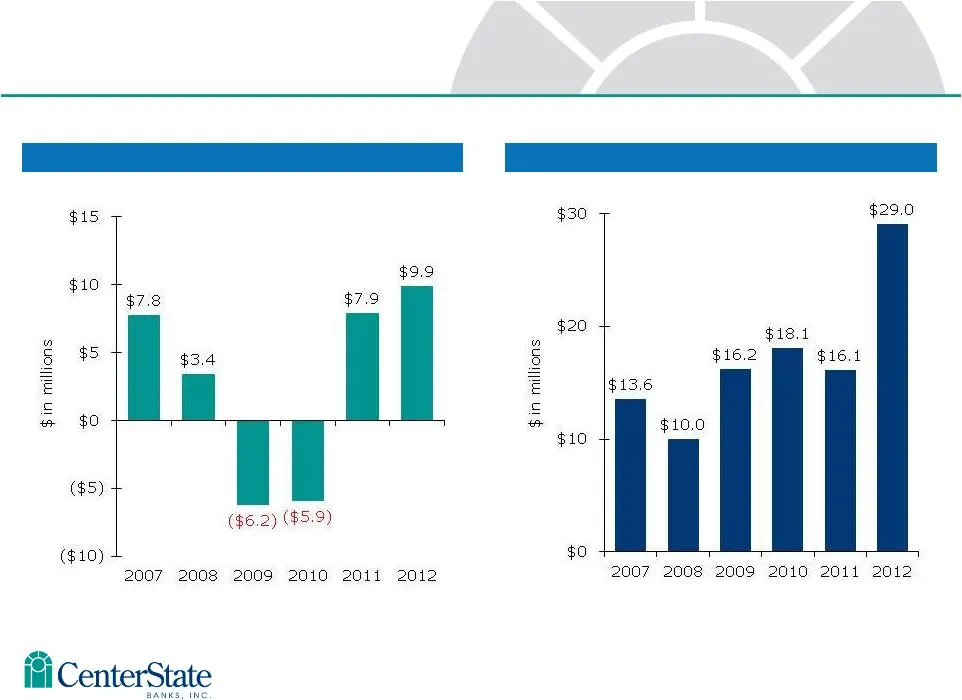
Net Income Pre-Tax Pre-Provision Income ¹ 1. Pre-tax pre-provision income (“PTPP”) is a non-GAAP measure that is defined as income (loss) before income tax excluding provision for loan losses, gain on sale of available for sale securities, income from FDIC loan pool impairment, OREO indemnification
Slide 32: Profitability Metrics – 5 Quarters
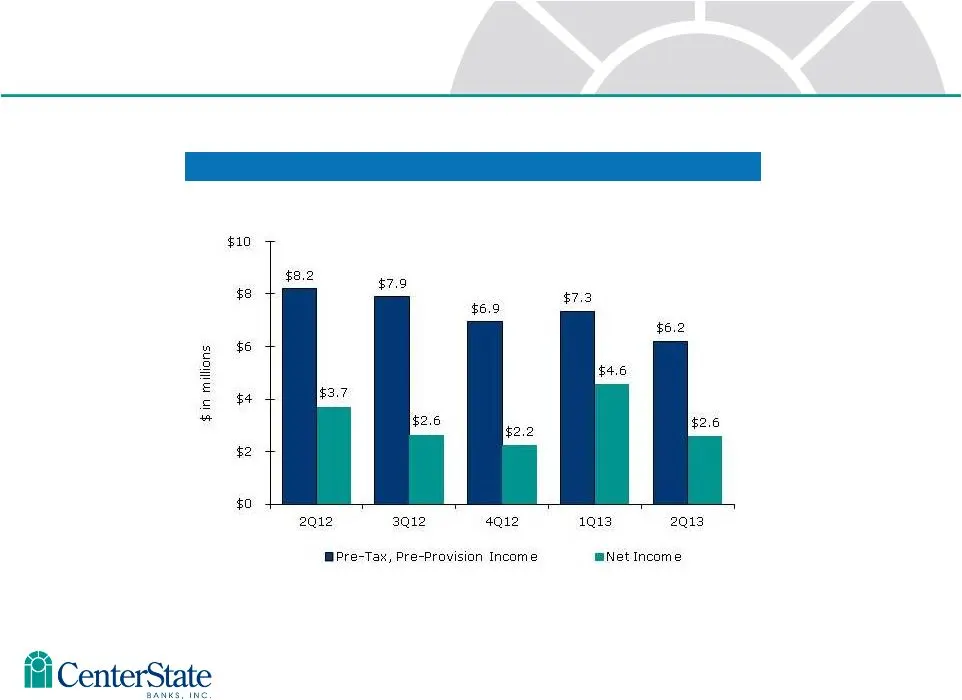
26 Pre-Tax Pre-Provision Income ¹ & Net Income Profitability Metrics – 5 Quarters 1. Pre-tax pre-provision income (“PTPP”) is a non-GAAP measure that is defined as income (loss) before income tax excluding provision for loan losses, gain on sale of available for sale securities, income from FDIC loa
Slide 33: Net Interest Margin FTE
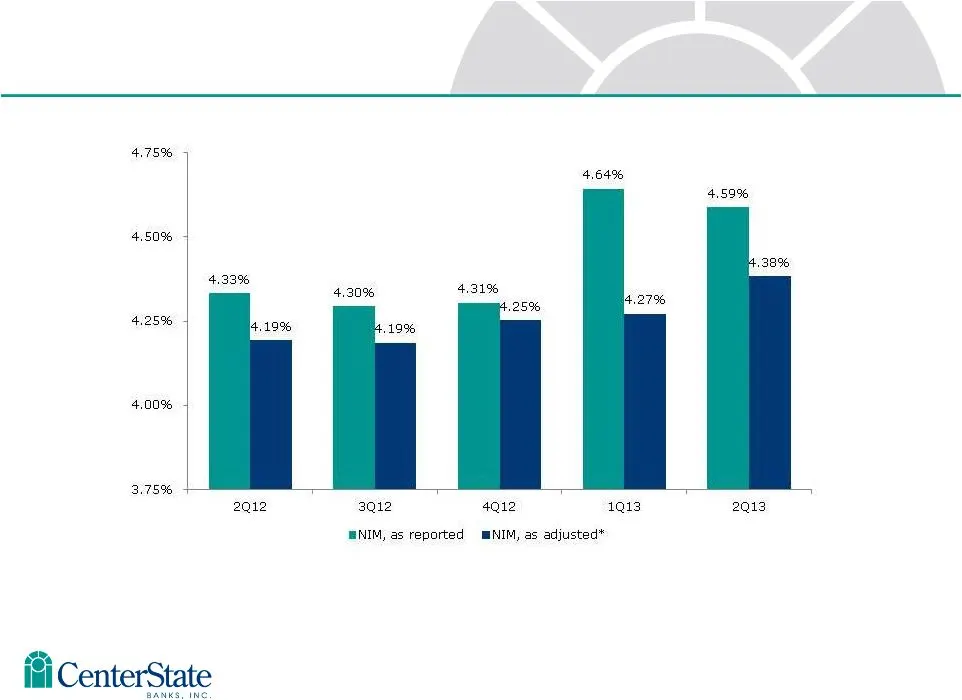
27 Net Interest Margin FTE * Excluding accelerated accretion related to ASC 310-10 loans and other adjustments
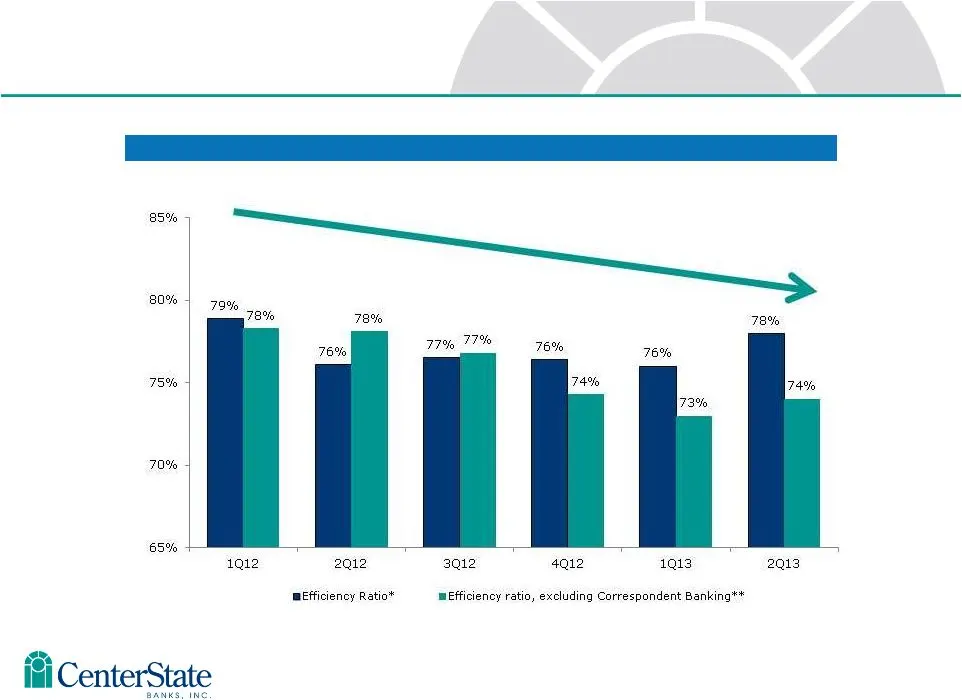
Slide 34: Operating Efficiencies: Efficiency Ratio
10 Efficiency Ratio Operating Efficiencies * Efficiency Ratio is defined as follows: [non-interest expense – intangible amortization – credit related expenses – merger related expenses – other nonrecurring expense] / [net interest income (fully tax equivalent) + non-interest income – gain on sale of
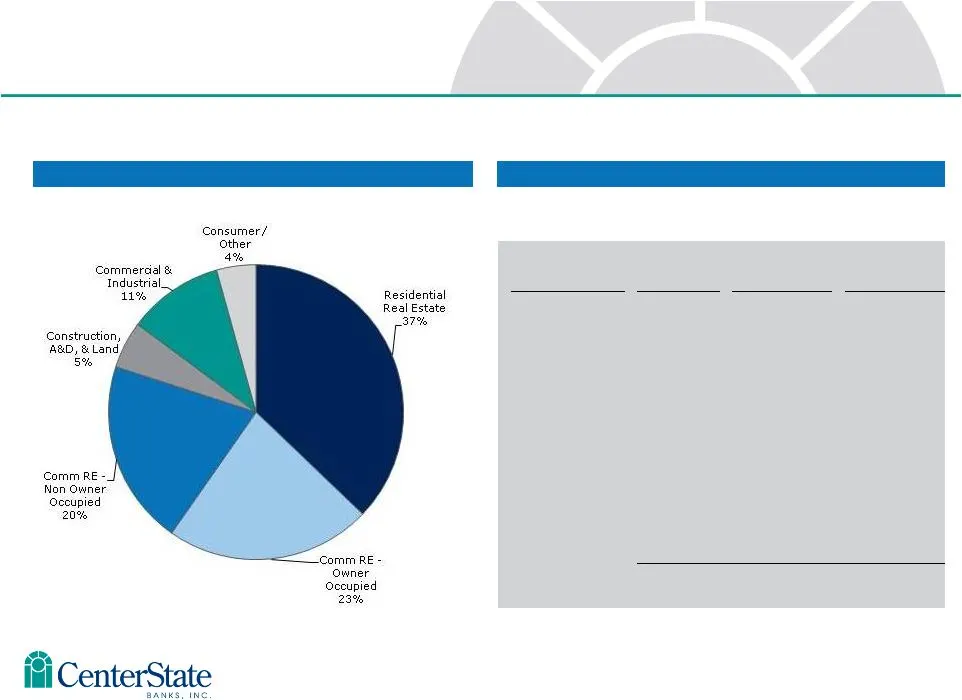
Slide 35: Total Loans by Type
Total Loans by Type Total Loans Detail Loan Type No. of Loans Balance Avg Loan Balance Residential Real Estate 4,191 $ 438 MM $104,500 CRE-Owner Occupied $ 266 MM $362,900 CRE-Non Owner Occupied $ 239 MM $467,700 Construction, A&D, & Land $ 61 MM $136,500 Commercial & Industrial 1,242 $ 124 MM $99,8
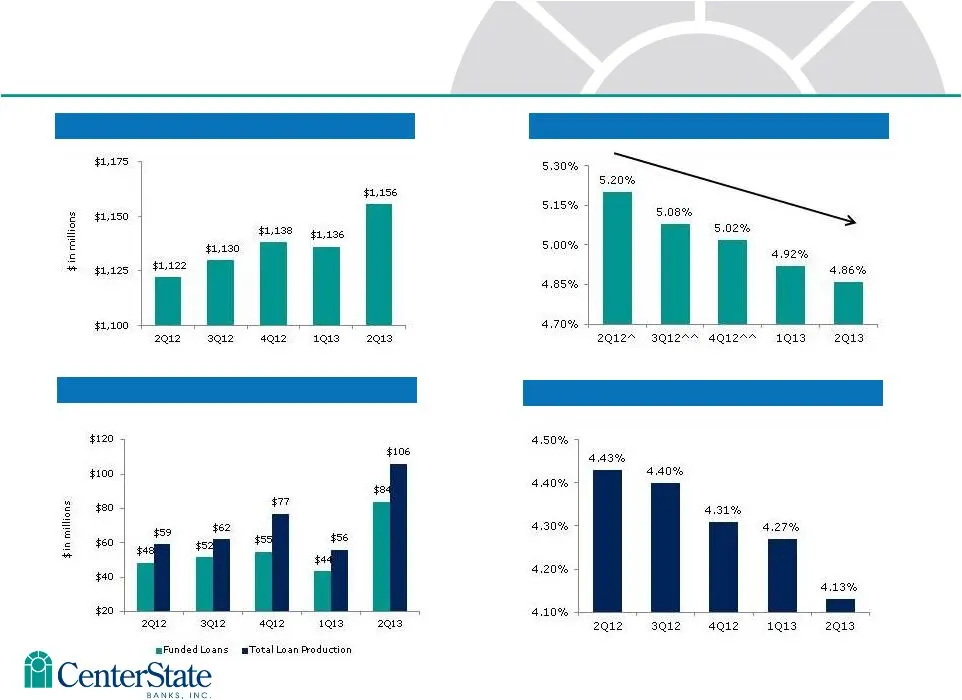
Slide 36: Non-Covered Loans and New Loan Production
Non-Covered Loans - Average Yields, FTE Non-Covered Loans – Average Balances New Loan Production New Loan Production – Average Yields Non-Covered Loans ^ Adjusted for non-accrual loan upgrades ^^ Adjusted for accelerated accretion related to noncovered ASC 310-10 loans
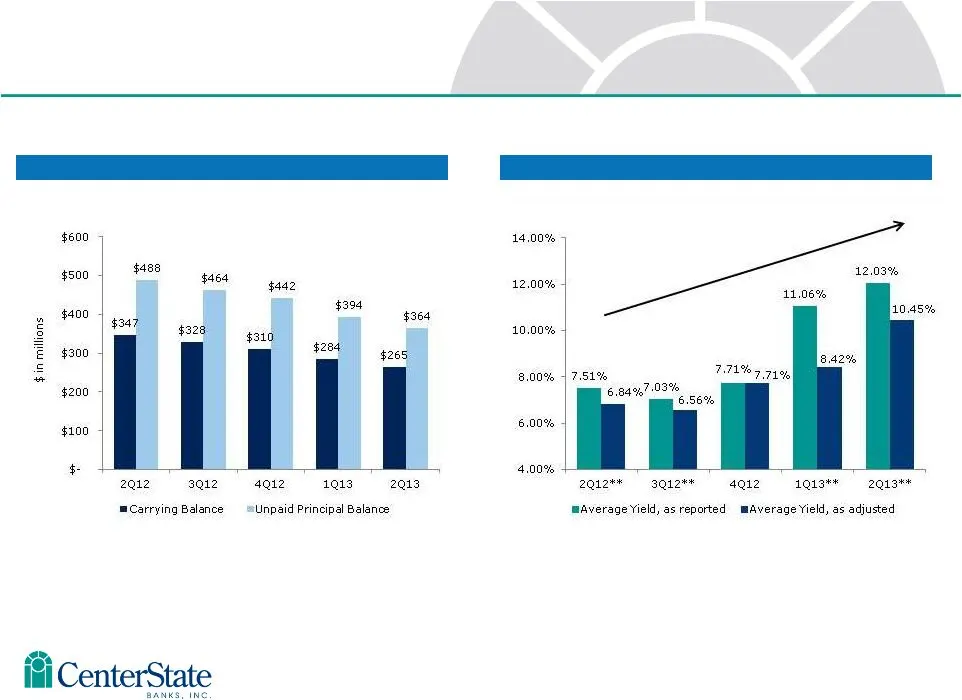
Slide 37: Covered Loans
Covered Loans – Average Yields* Covered Loans – Average Balances* Covered Loans * Adjusted for measurement period adjustment. ** Excluding accelerated accretion related to ASC 310-10 loans
Slide 38: FDIC Indemnification Asset
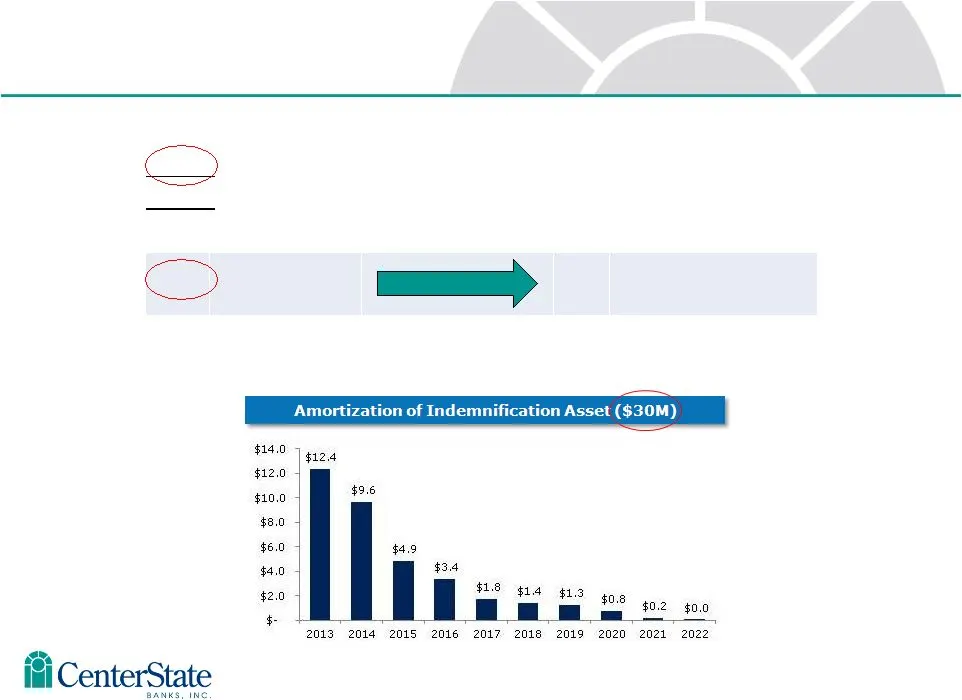
32 FDIC Indemnification Asset as of June 30, $30M FDIC Reimbursement Write-Off $38M Collect from Borrower (or sale of OREO) $59M Expected reimbursements from FDIC for 80% of expected losses $30M Previously expected reimbursements for previously expected losses no longer expected $89M Total indemnifi
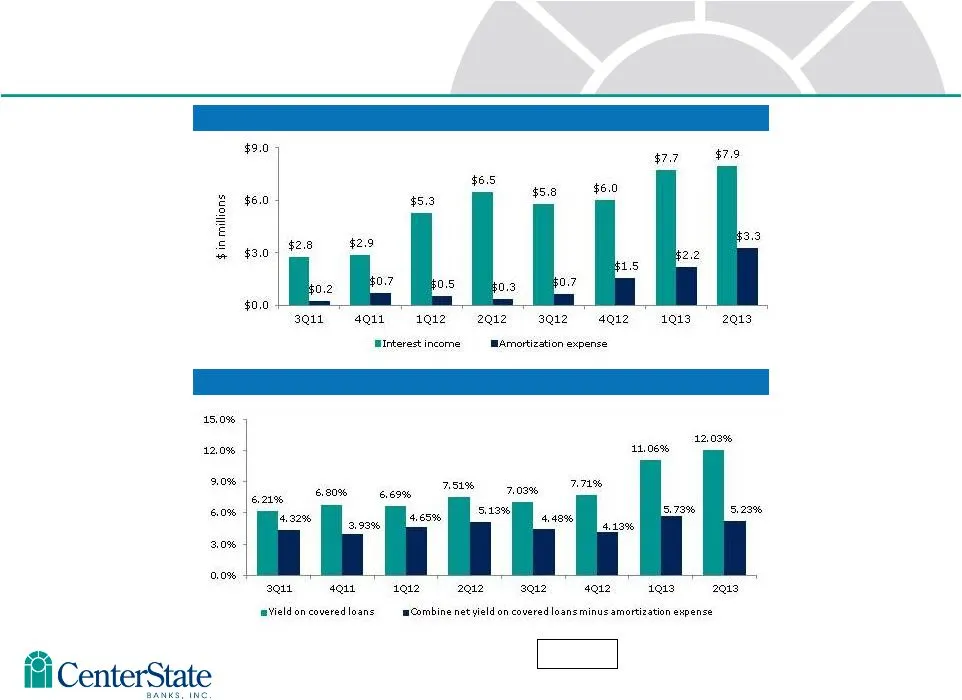
Slide 39: Interest Income and Amortization Expense
33 Interest Income and Amortization Expense Yields on Covered Loans and Indemnification Asset Indemnification Asset (“IA”) amortization and its relationship with FDIC covered loan interest income accretion 8 Quarter Average = 4.70%
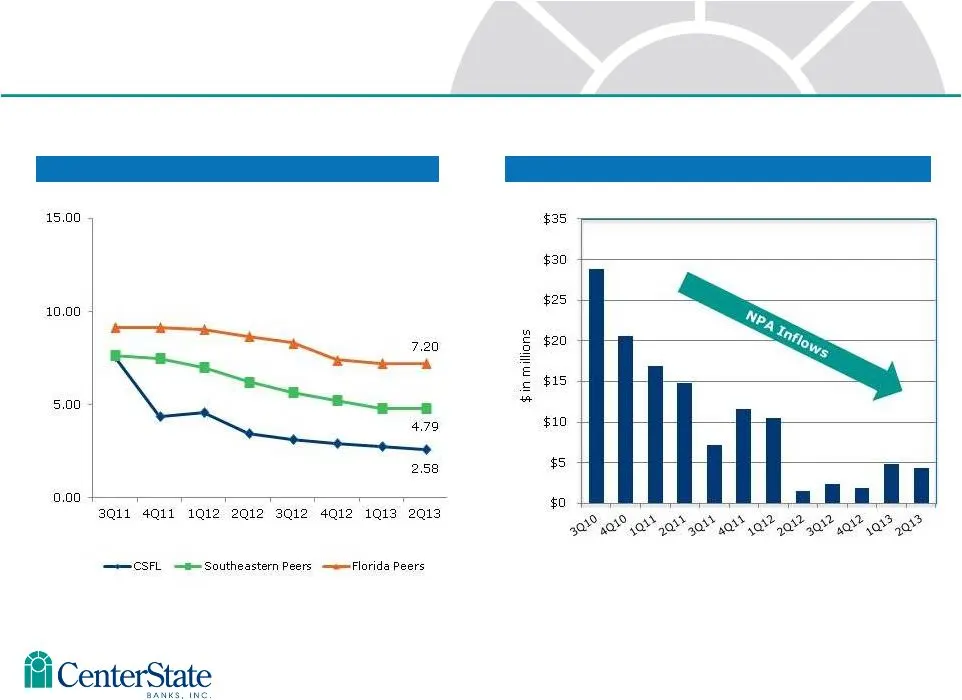
Slide 40: Credit Trends Improving
NPAs / Loans & OREO (%) NPA Inflows Slowing Down Credit Trends Improving Source: SNL Financial Nonperforming assets include loans 90 days or more past due, nonaccrual loans, and OREO/ORA; and exclude FDIC covered assets Southeastern peers include ABCB, PNFP, RNST, SCBT, UBSH and UCBI. Florida peers
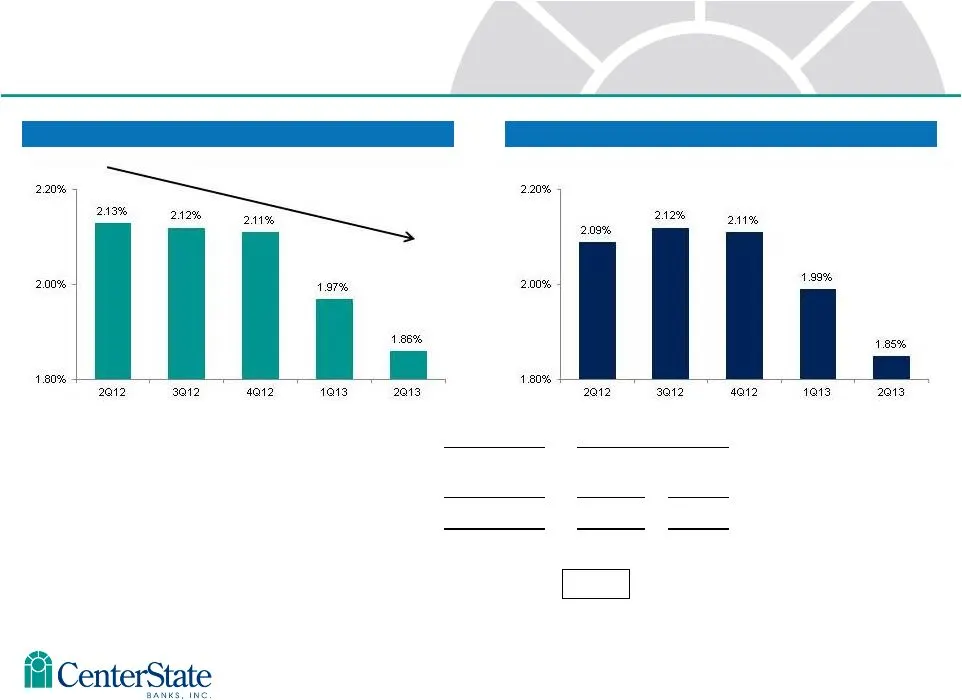
Slide 41: Total ALLL – Non-Covered Loans
35 FAS 5 Component Total ALLL – Non-Covered Loans ALLL – Non-Covered Loans Loan Balance ALLL Loans (Fas 5) $1,140,066 $21,200 1.86% Impaired Loans (Fas 114) 38,693 1.55% Total Non-Covered Loans $1,178,759 $21,800 1.85% ALLL as a % of NPLs= 88%
Slide 42: Total Deposits by Type
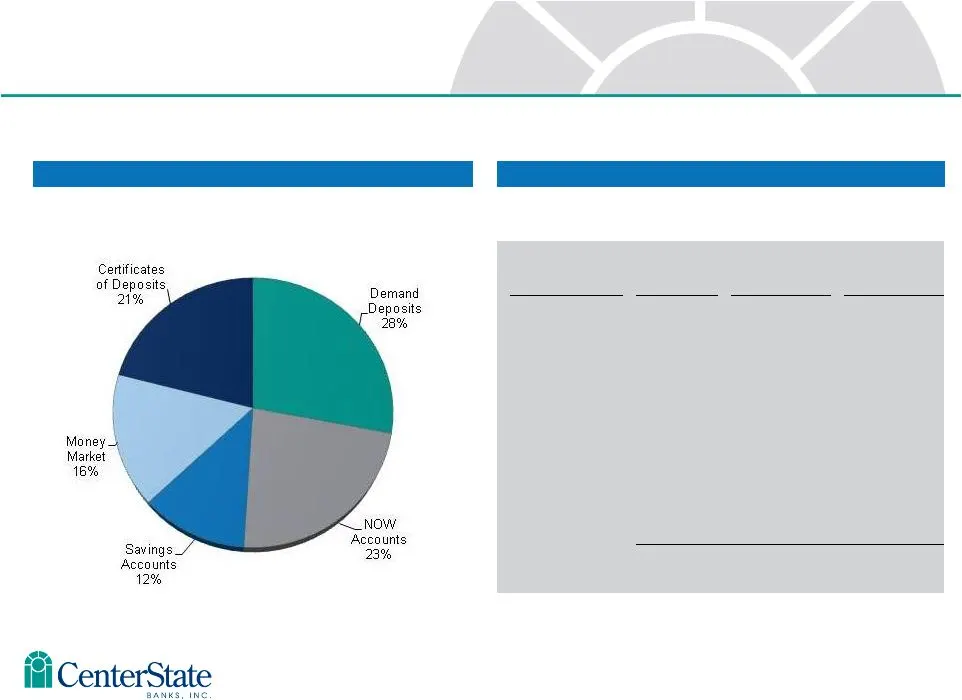
Total Deposits by Type Total Deposits Detail 23 Total Deposit Portfolio as of June 30, Deposit Type No. of Deposits Balance Avg Deposit Balance Demand Deposits 36,817 $ 556 MM $15,100 Now Accounts 49,732 $ 457 MM $9,200 Savings Deposits 17,965 $ 241 MM $13,400 Money Market 3,178 $ 313 MM $98,500 Cer
Slide 43: Capital Ratios
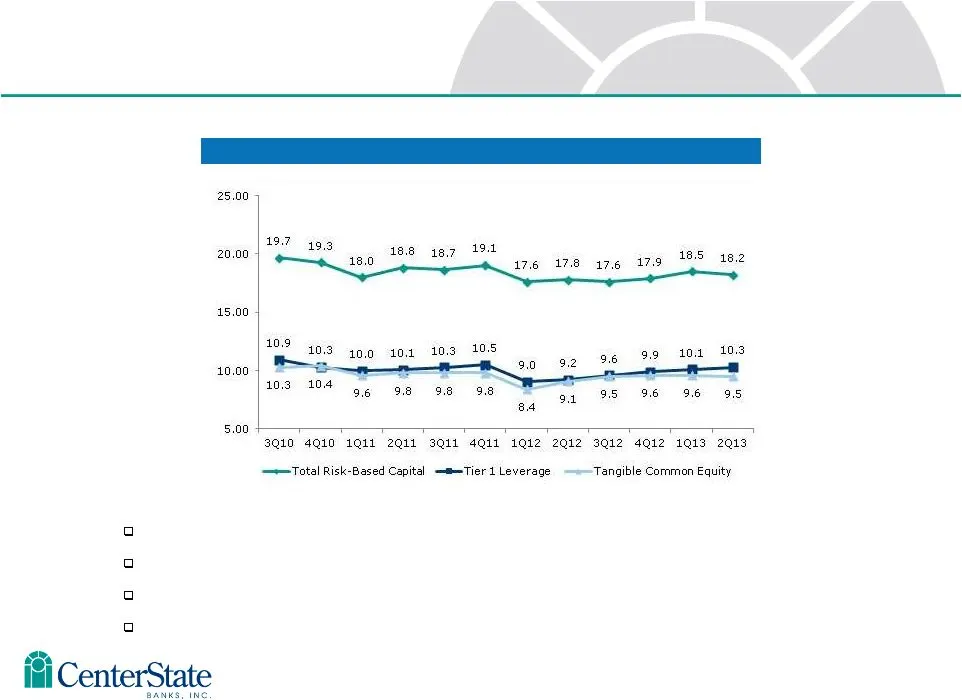
Total Risk-Based, Tier 1 Leverage & Tangible Common Equity Ratios Two successful capital raises in 2009 and 2010 totaling $114 million First publicly traded bank in Florida to successfully complete a capital raise during financial crisis in 2009 Over “Blue Chip” active institutional investors – Aver
Slide 44: Price to Tangible Book Value – M&A Transactions
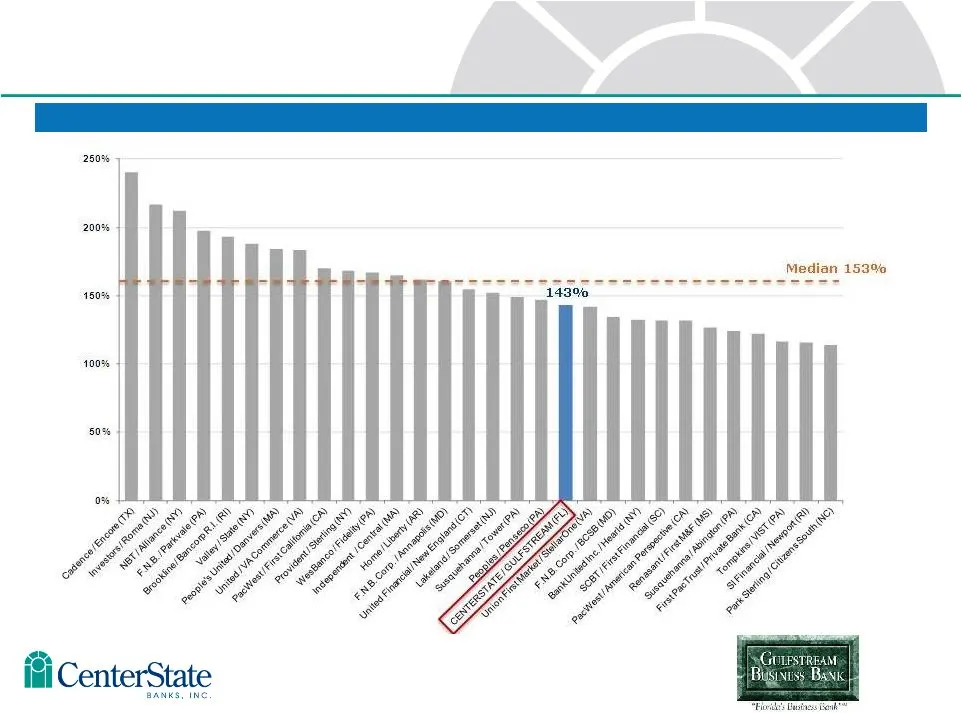
Price to Tangible Book Value – M&A Transactions Announced Since January 1, 2011 Favorable Valuation Compared with Recent Transactions Bank and thrift M&A transactions with disclosed Price / TBV per share greater than 100% and deal values between $50 million and $500 million announced since January 1
Slide 45: CenterState Banks
igi CenterState www.centerstatebaniscom BANKS. INC
Source: SEC EDGAR · 8-K filed Jul 30, 2013
More decks from CenterState Bank Corporation
 IPO Roadshow (May 2020)42 slides · May 21, 2020
 D.A. Davidson 22nd Annual Financial Institution Virtual Conference (May 2020)25 slides · May 6, 2020
 Q1 2020 Earnings Presentation25 slides · Apr 23, 2020
 Merger or Acquisition (January 2020)24 slides · Jan 27, 2020
 Q3 2019 Earnings Presentation28 slides · Nov 4, 2019
 Investor Presentation (July 2019)28 slides · Jul 30, 2019