CenterState Bank — IPO Roadshow (May 2020)
42 slides from CenterState Bank's IPO roadshow presentation, May 21, 2020
Slide 1: Fixed Income Investor Presentation
Issuer Free Writing Prospectus Filed Pursuant to Rule 433 Registration No. 333-238144 May 21, 2020 Fixed Income Investor Presentation May 2020 1
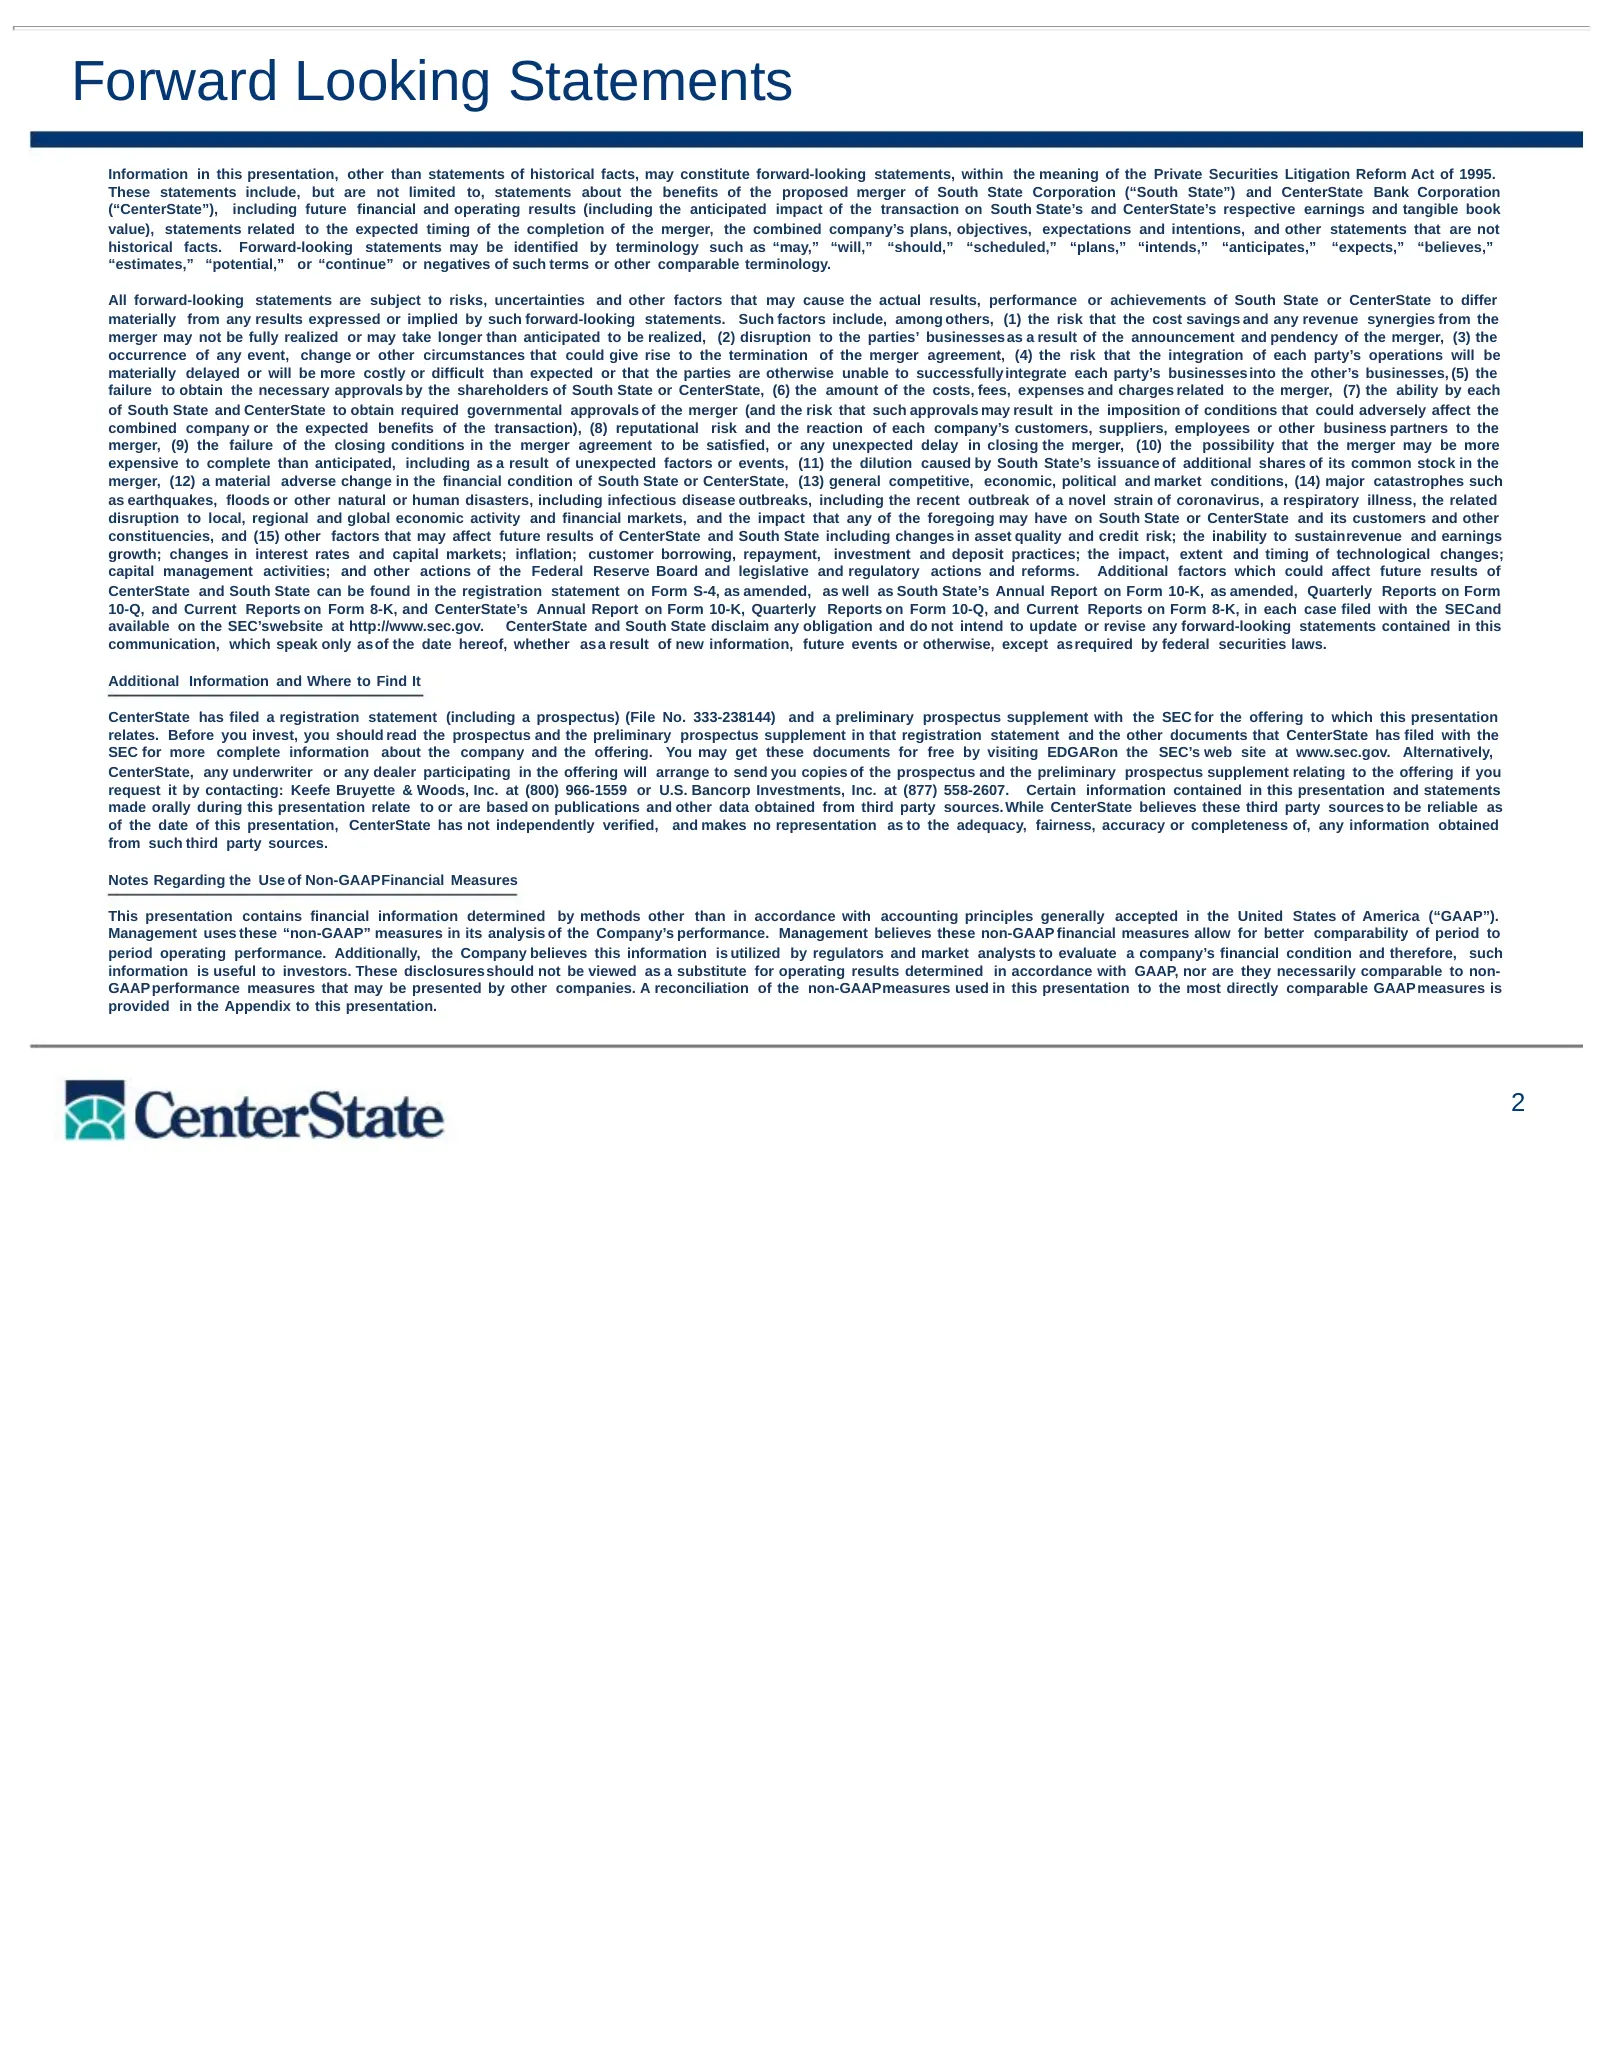
Slide 2: Forward Looking Statements
Forward Looking Statements Information in this presentation, other than statements of historical facts, may constitute forward-looking statements, within the meaning of the Private Securities Litigation Reform Act of 1995. These statements include, but are not limited to, statements about the benefi
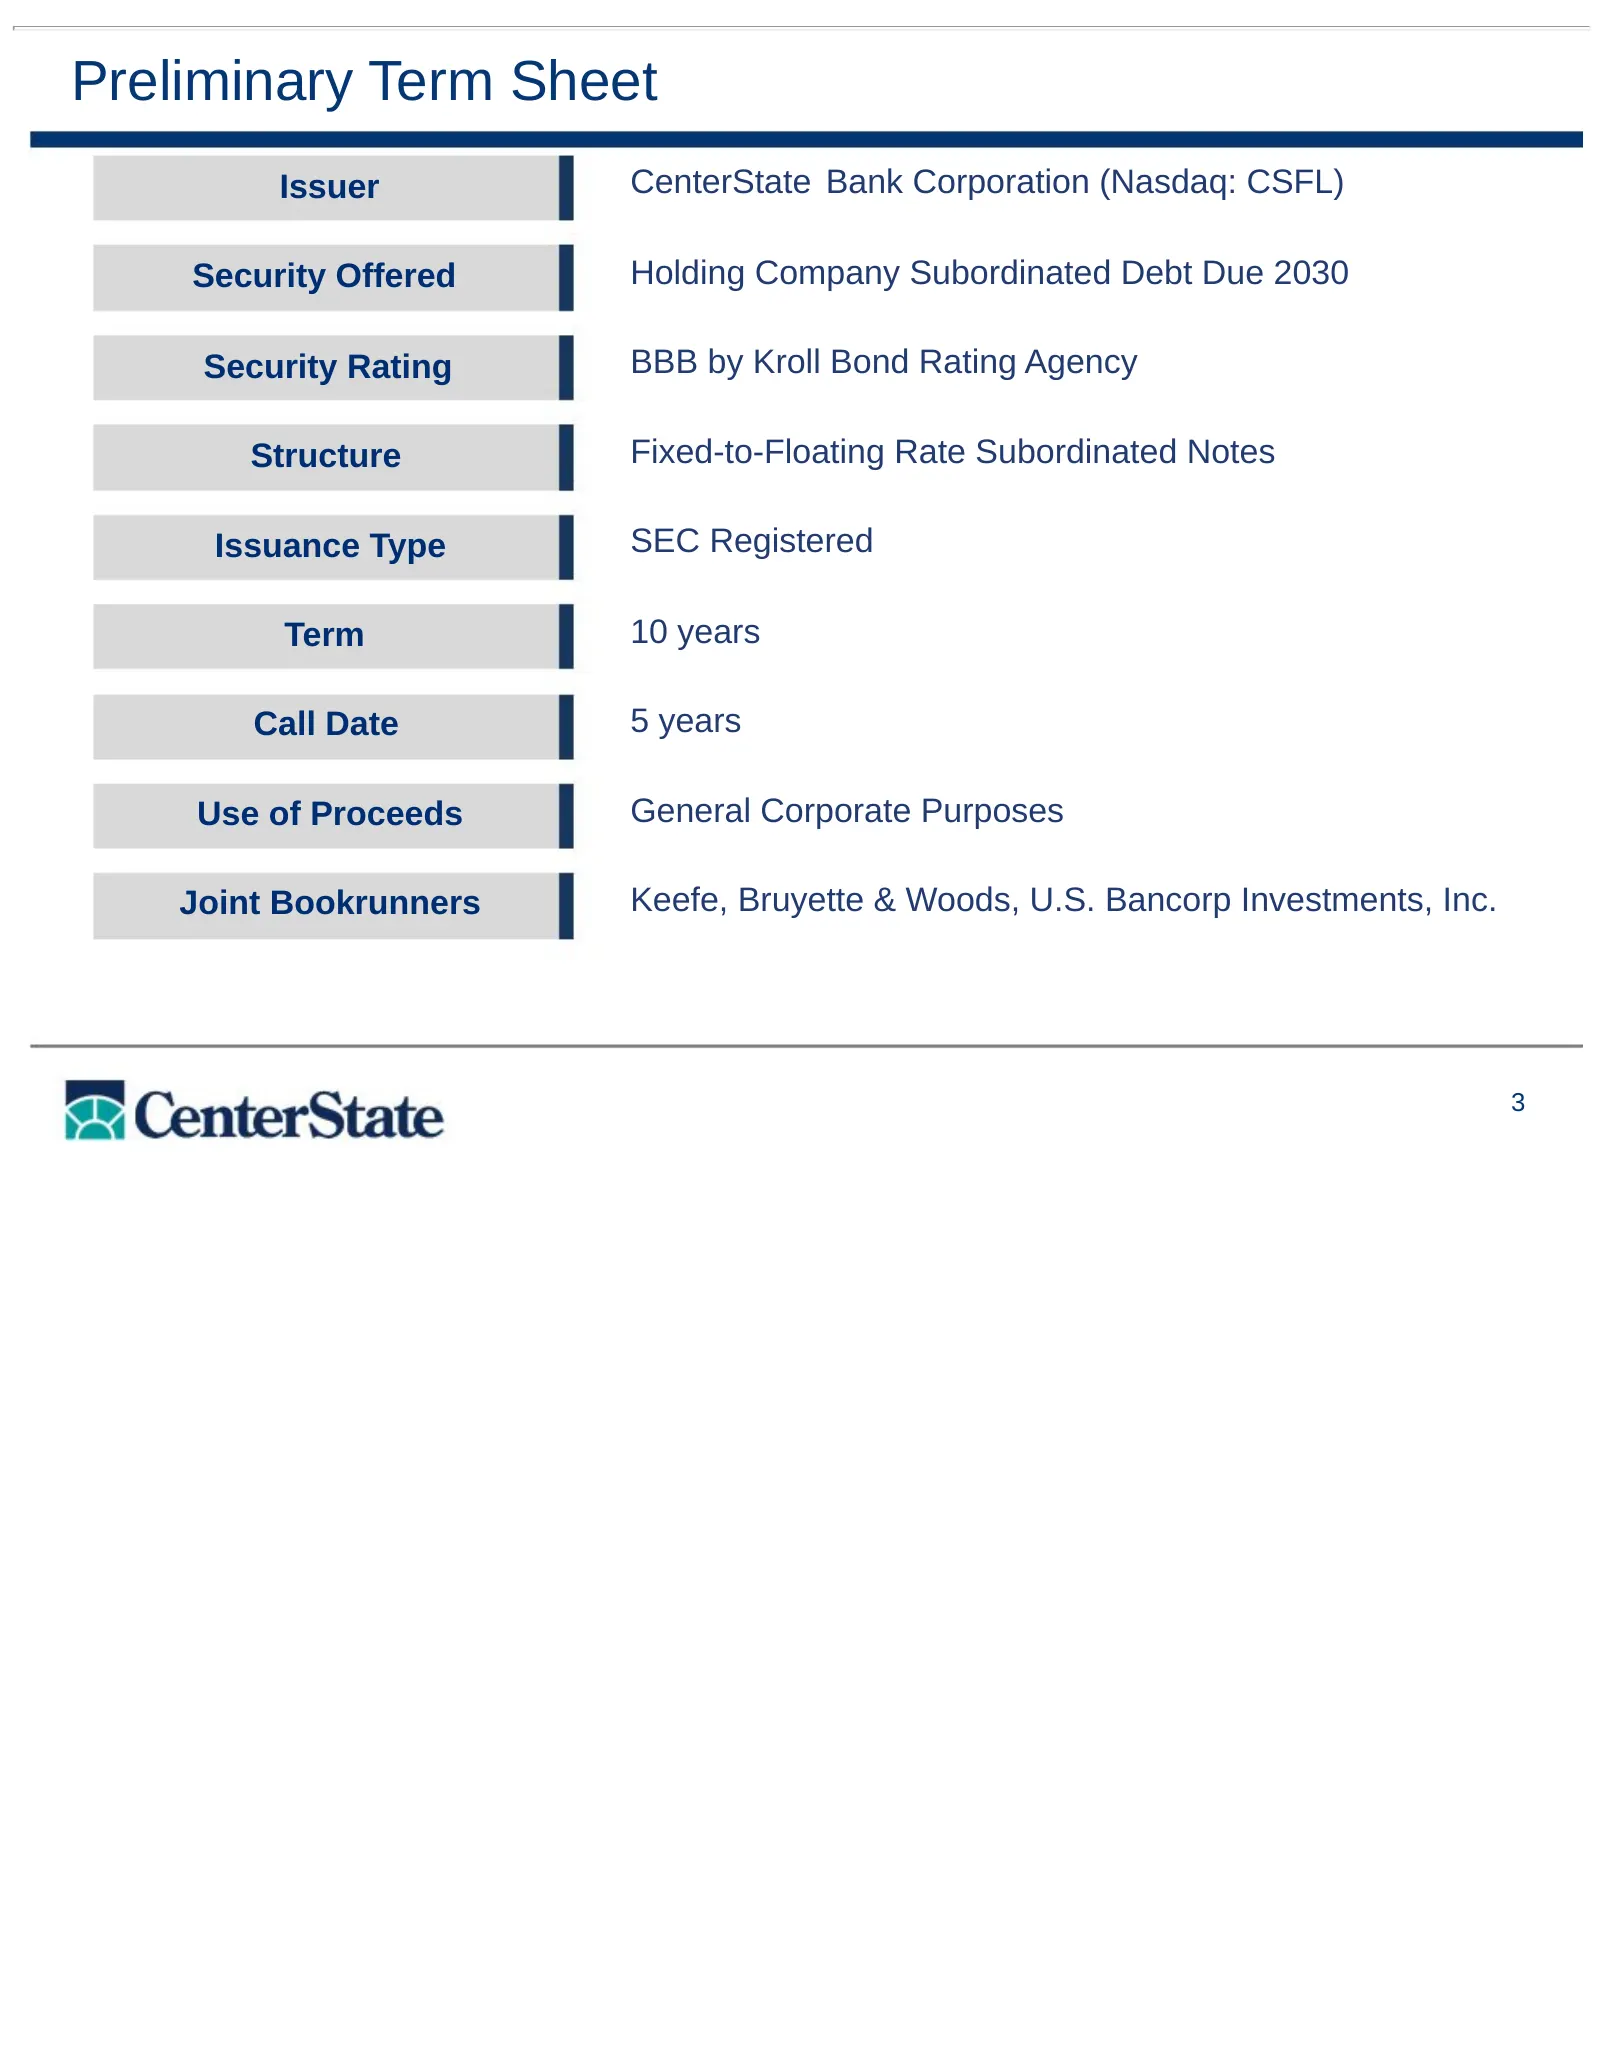
Slide 3: Preliminary Term Sheet
Preliminary Term Sheet Issuer CenterState Bank Corporation (Nasdaq: CSFL) Security Offered Holding Company Subordinated Debt Due 2030 Security Rating BBB by Kroll Bond Rating Agency Structure Fixed-to-Floating Rate Subordinated Notes Issuance Type SEC Registered Term 10 years Call Date 5 years Use o
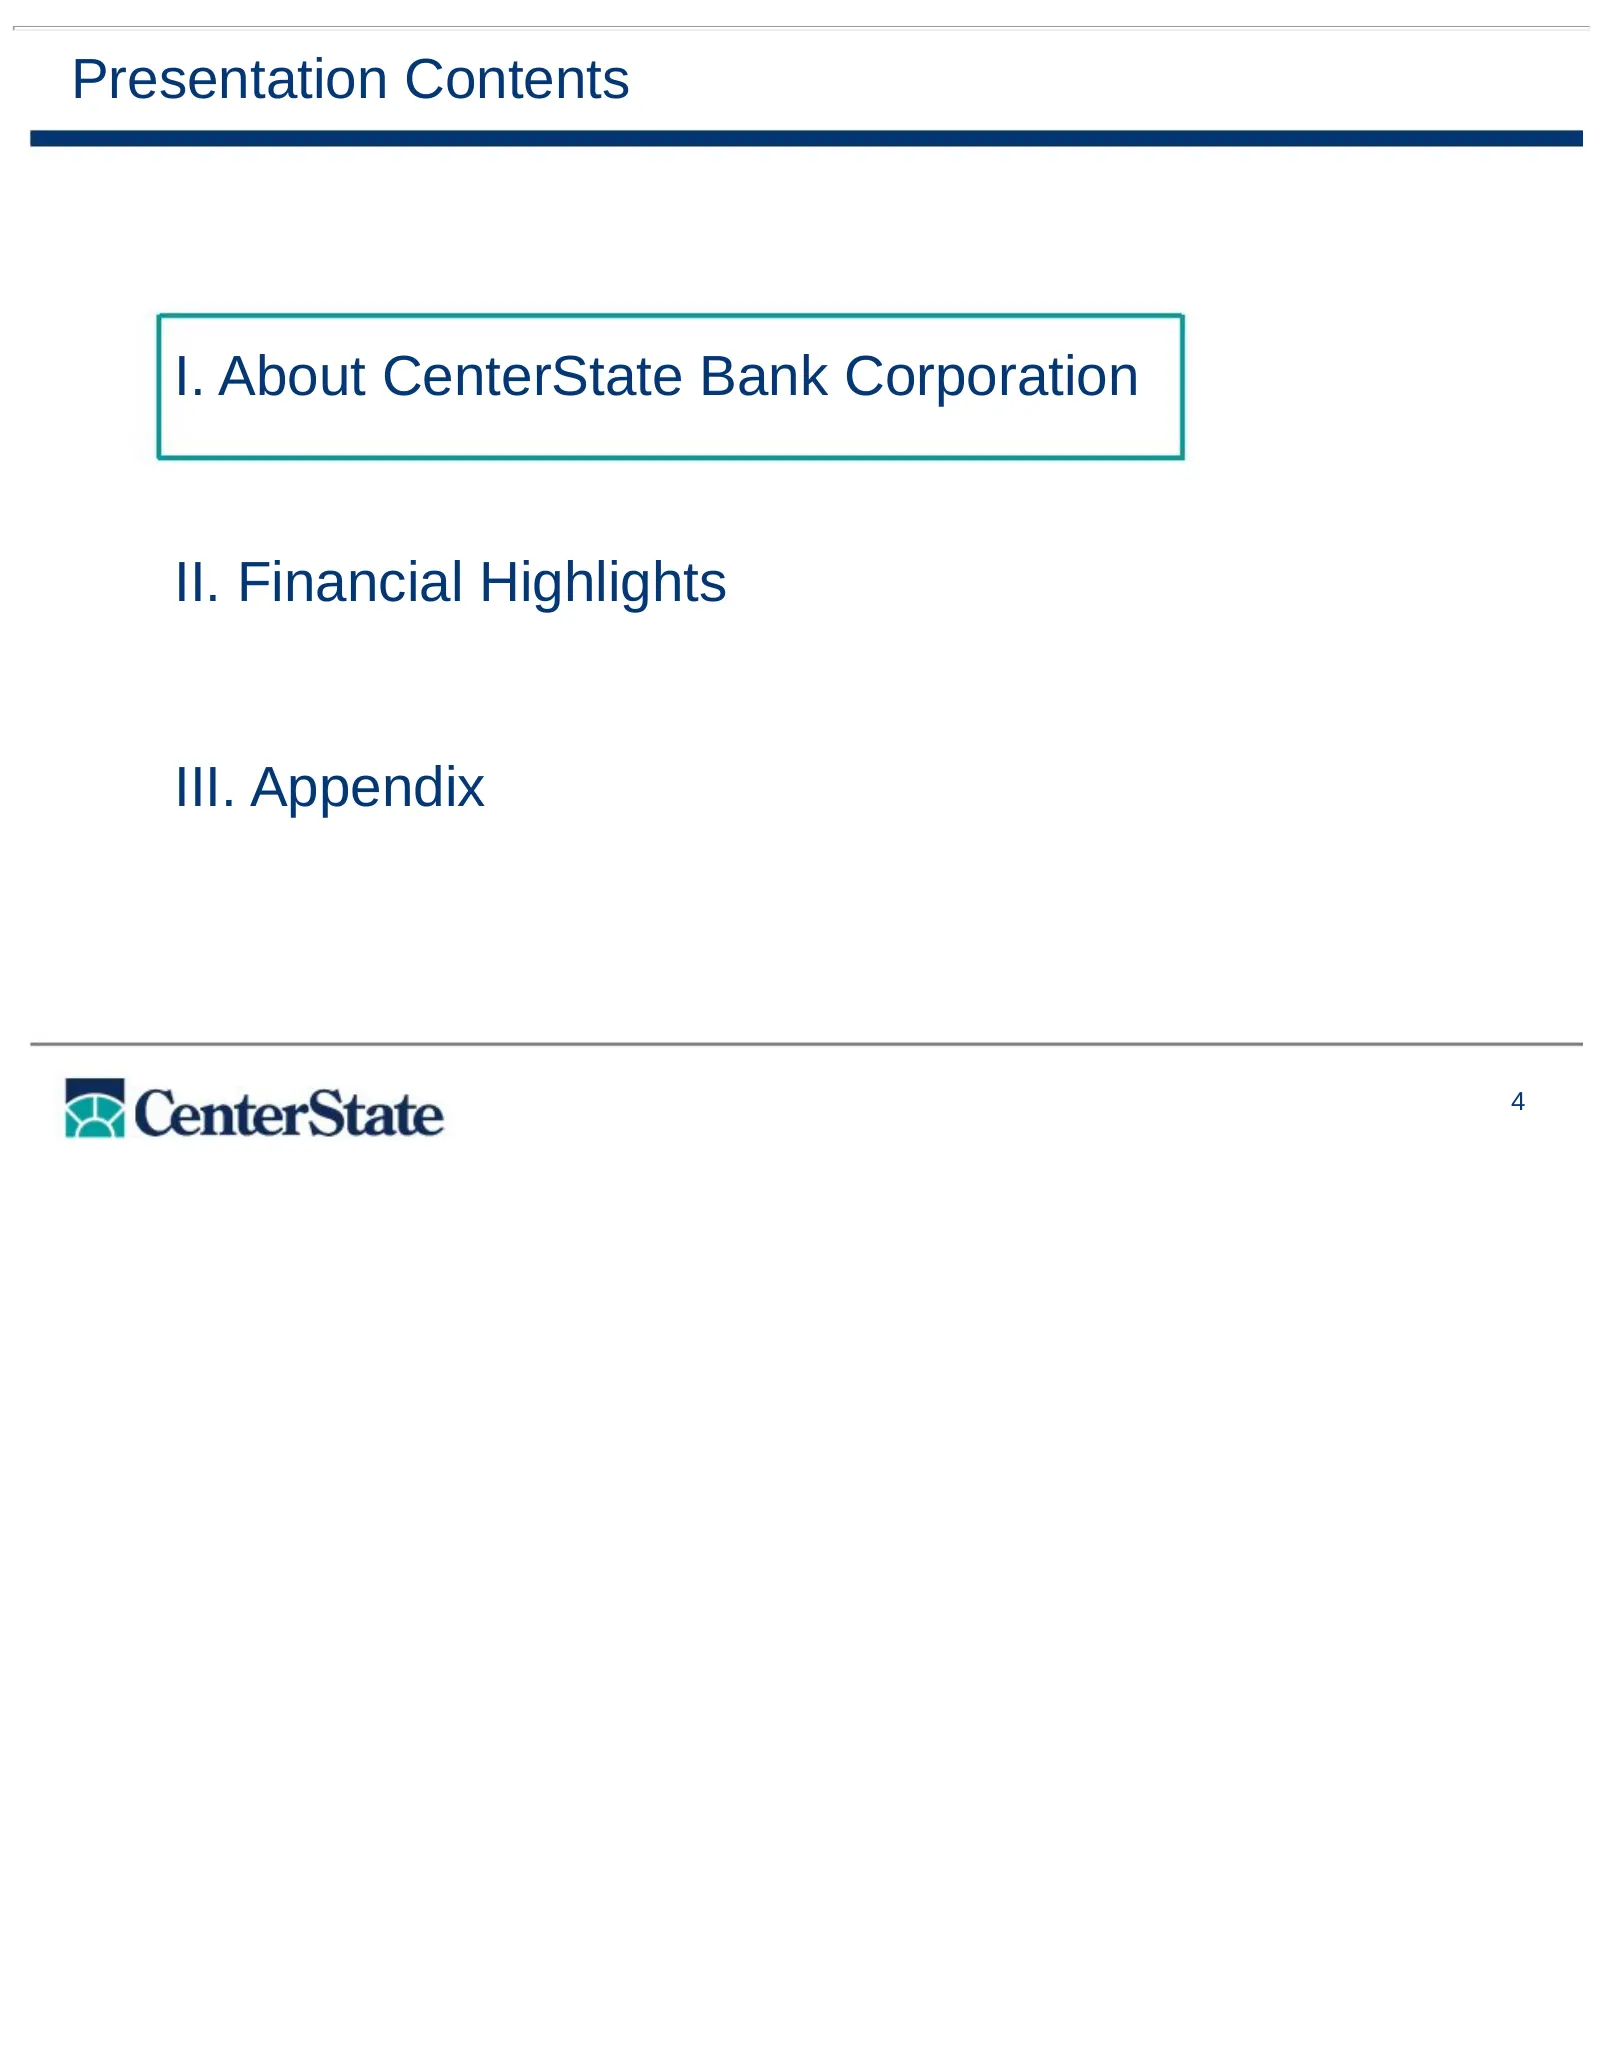
Slide 4: Presentation Contents
Presentation Contents Click I. About to editBank CenterState Master title style Corporation Edit Master text styles II. Financial Highlights III. Appendix 4
Slide 5: Merger Update
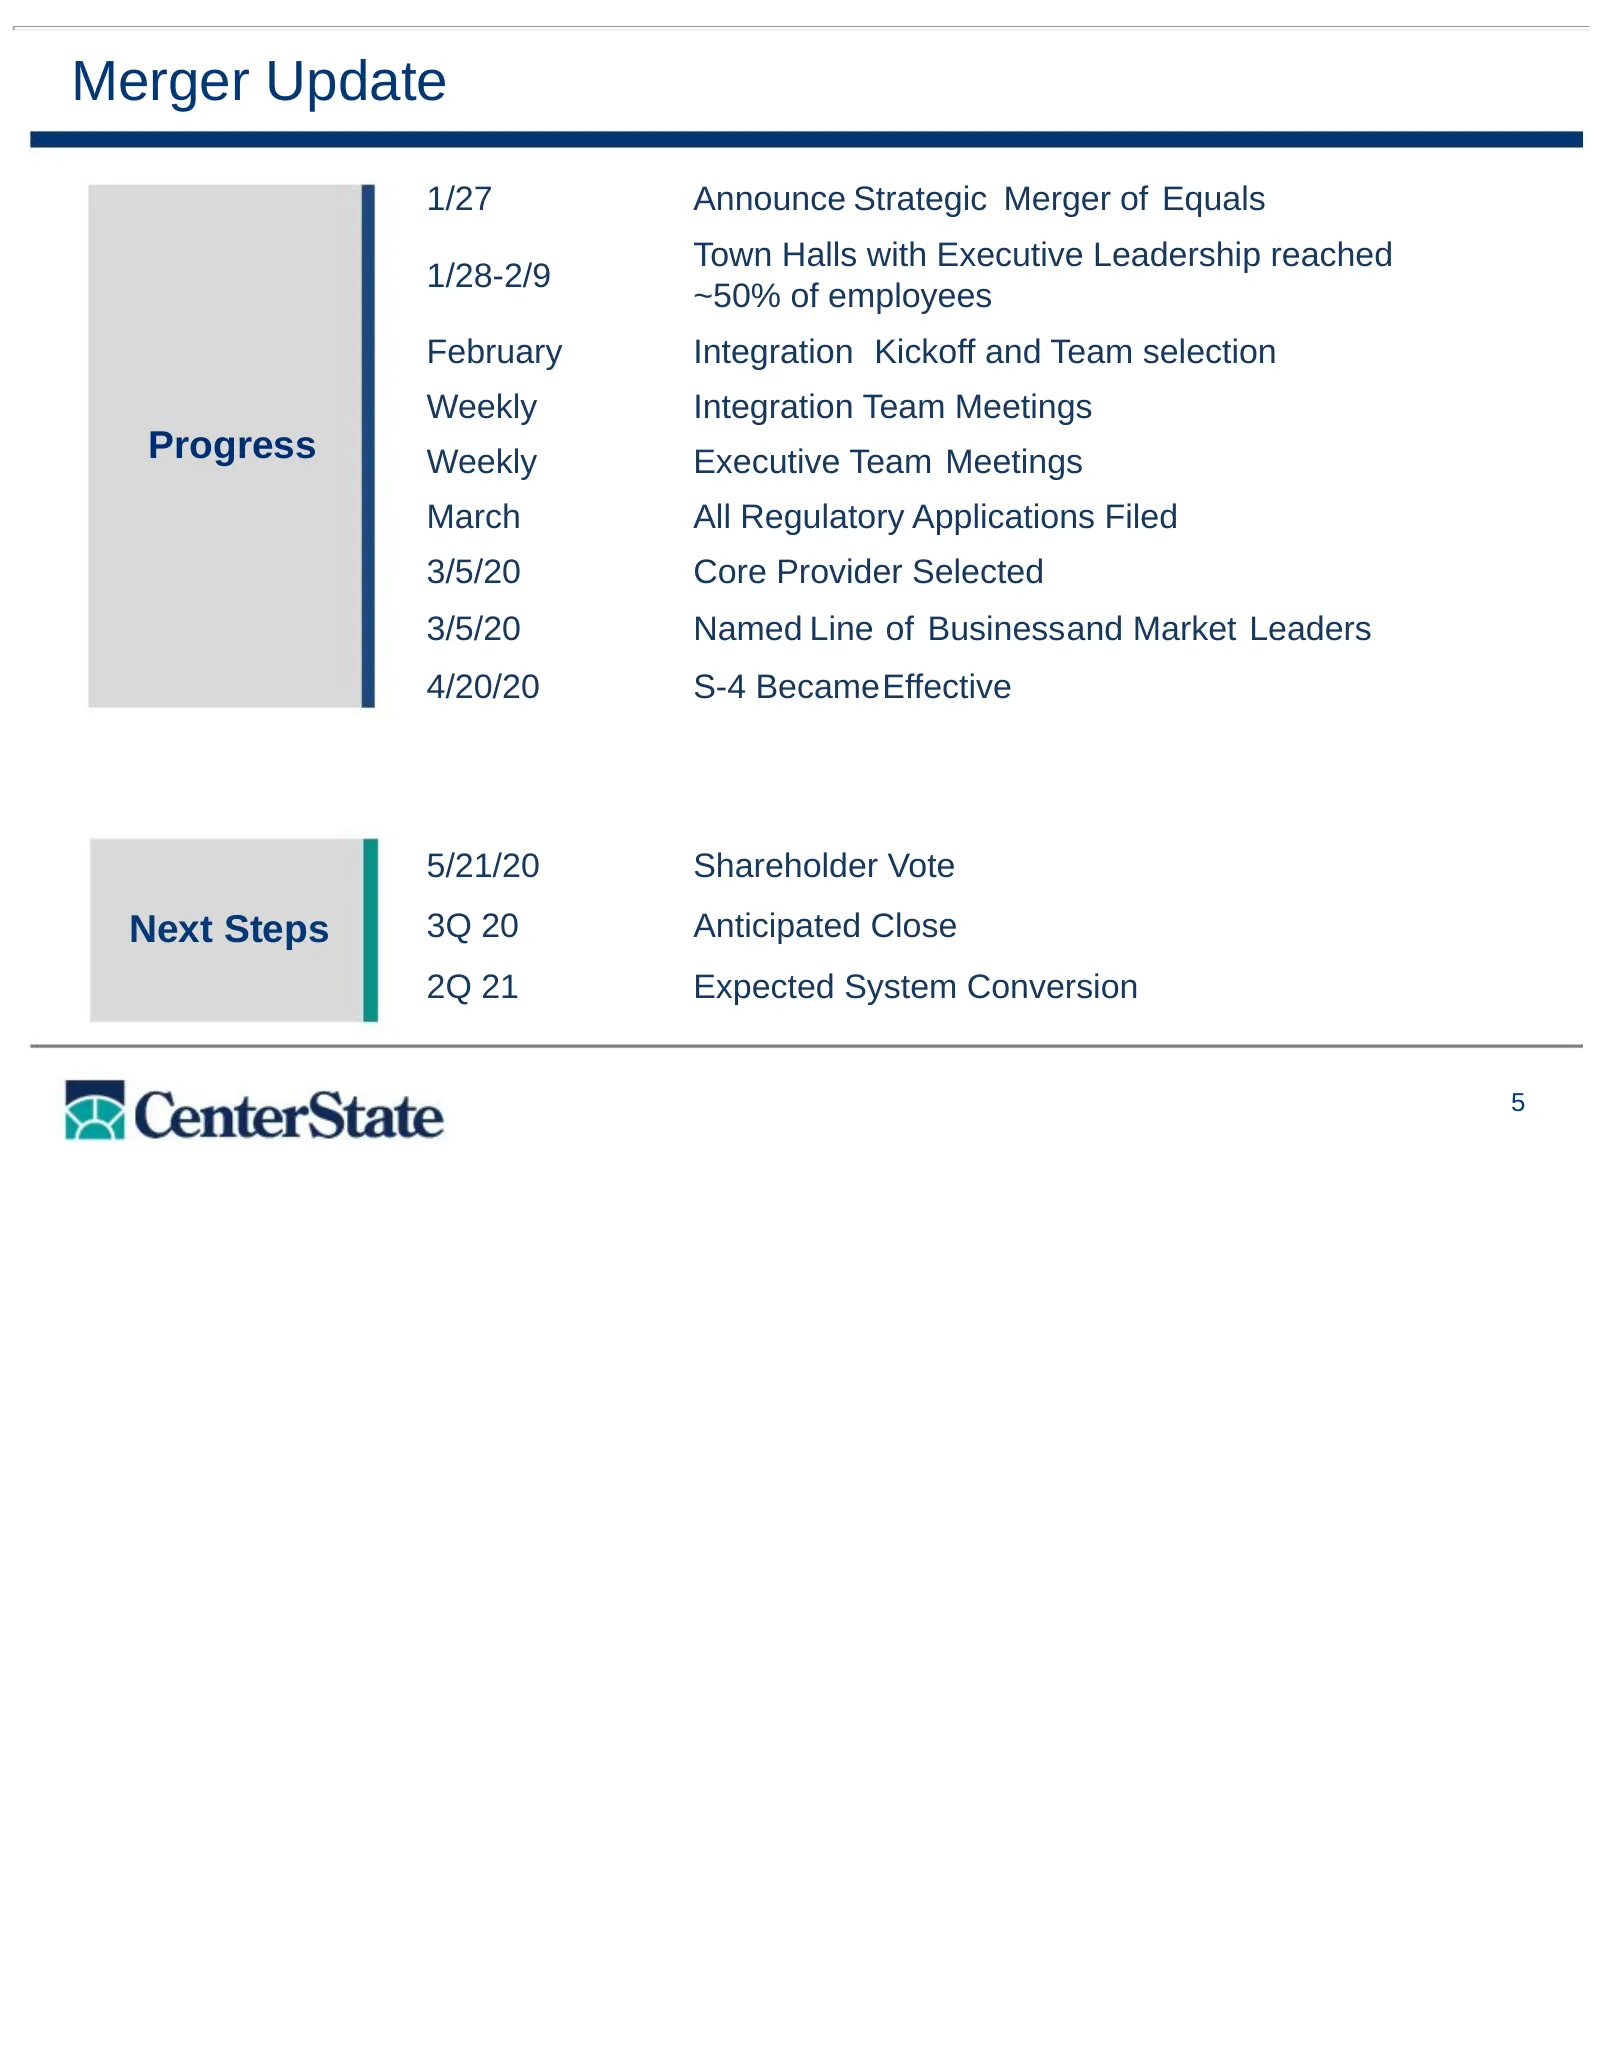
Merger Update 1/27 Announce Strategic Merger of Equals Town Halls with Executive Leadership reached 1/28-2/9 ~50% of employees February Integration Kickoff and Team selection Weekly Integration Team Meetings Progress Weekly Executive Team Meetings March All Regulatory Applications Filed 3/5/20 Core
Slide 6: Overview of Pro Forma Company
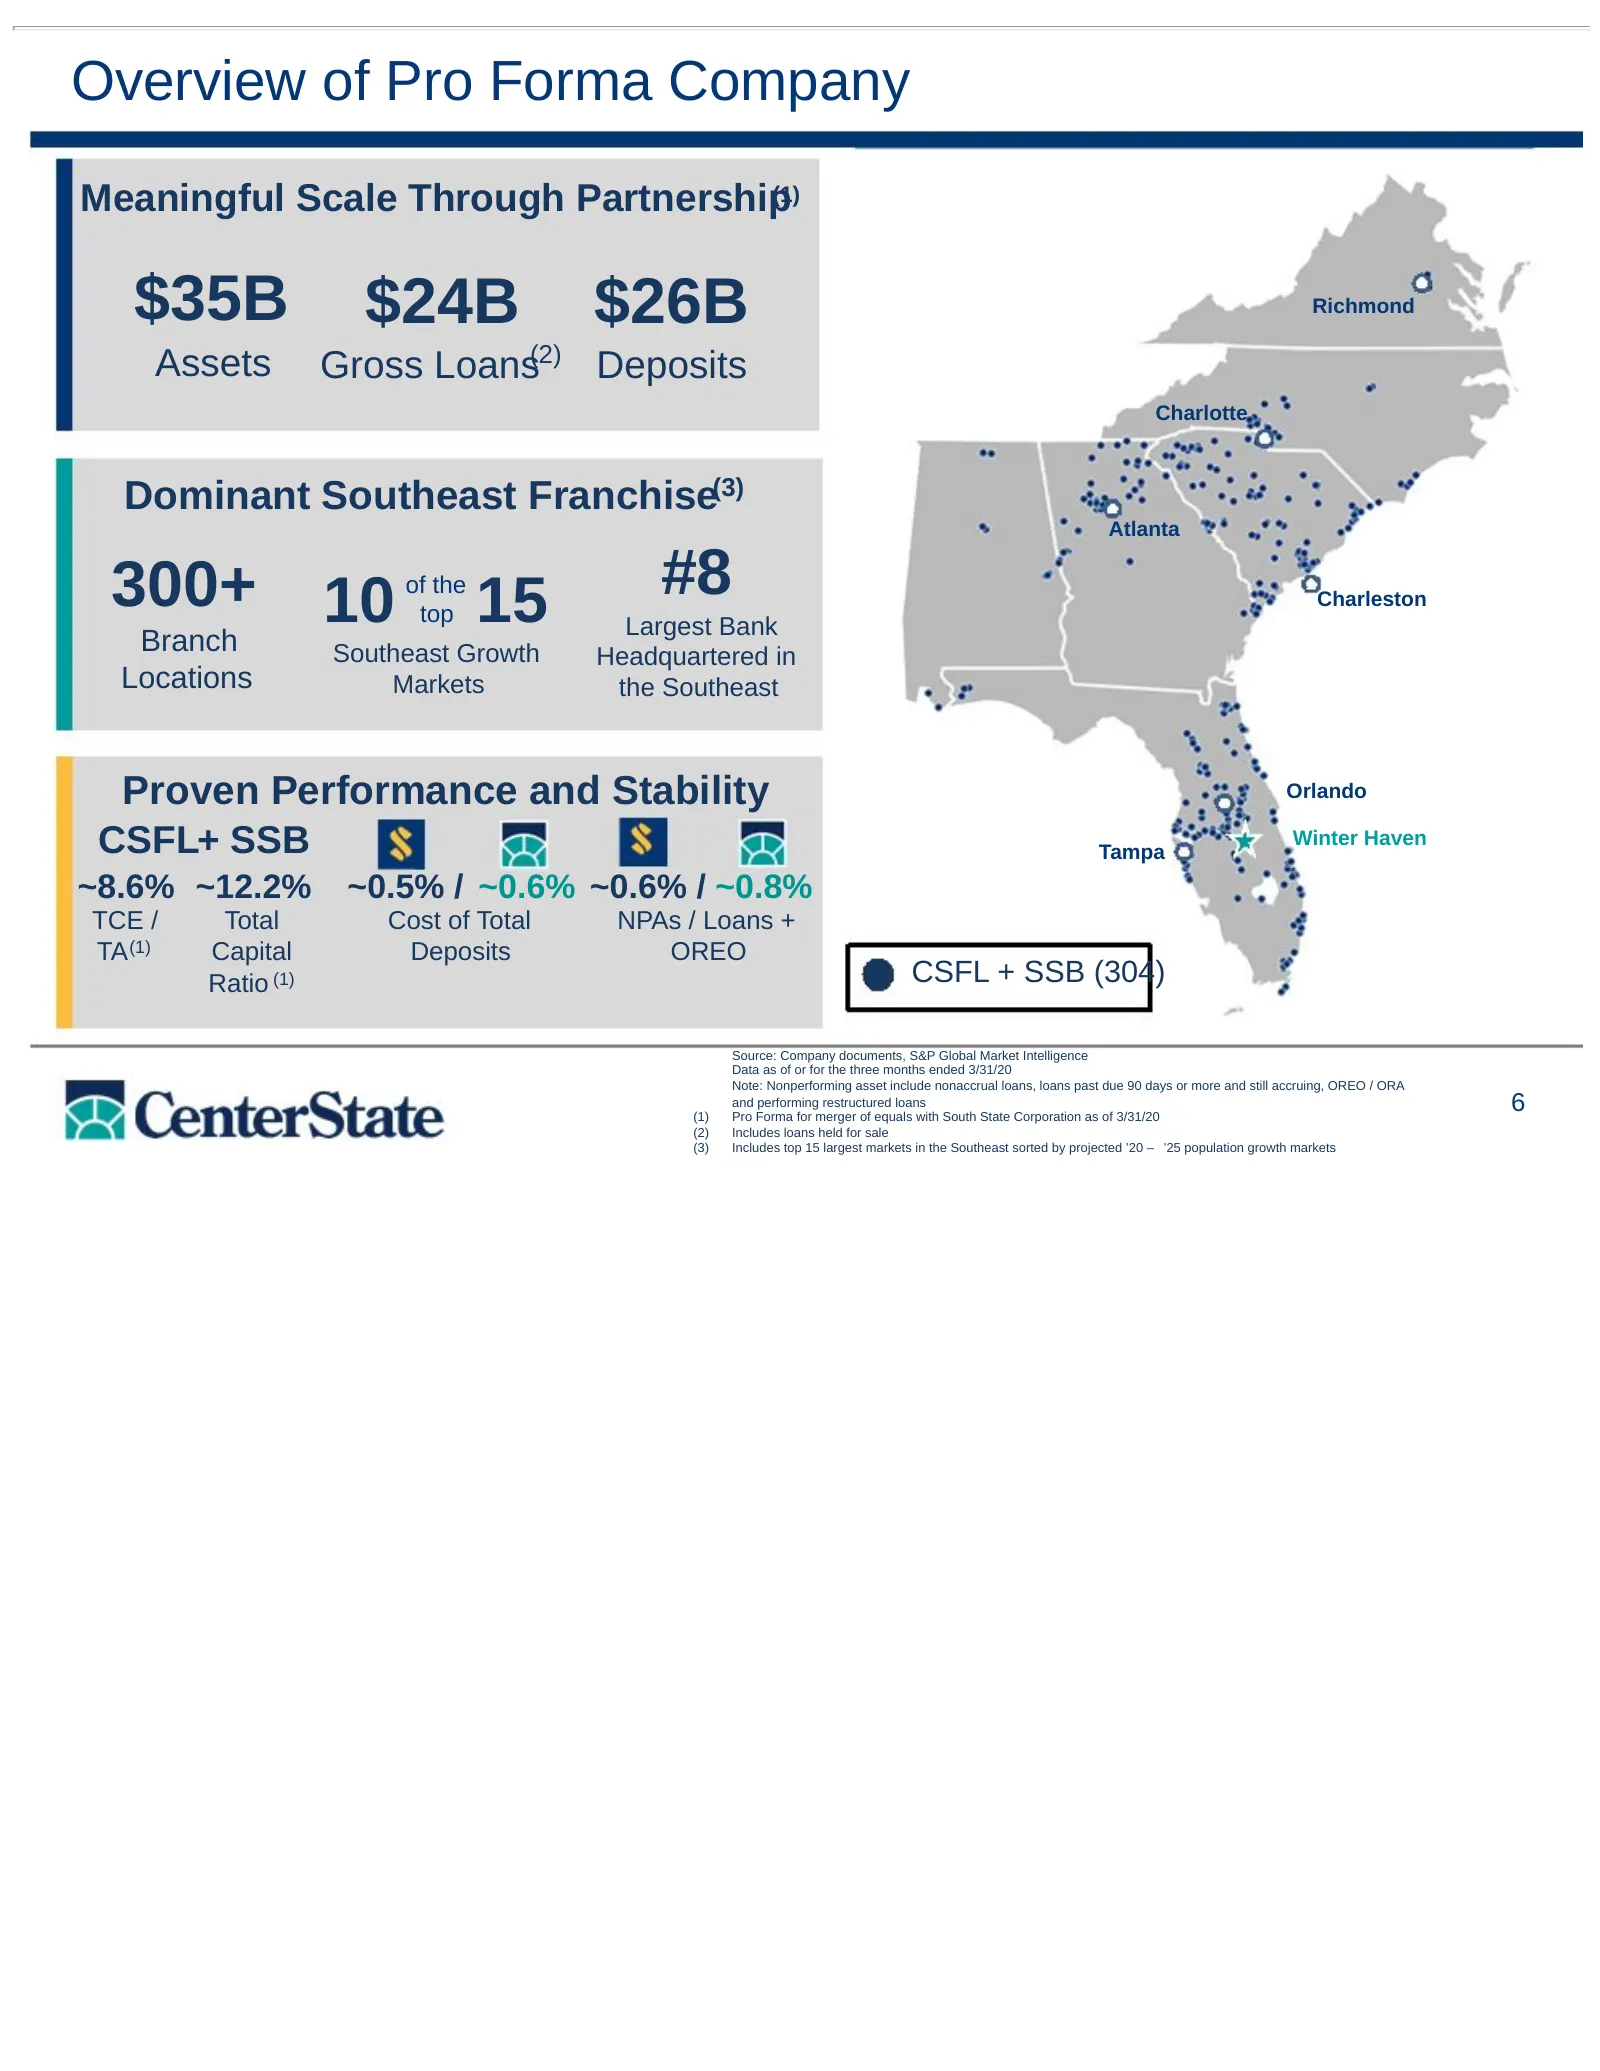
Overview of Pro Forma Company Meaningful Scale Through Partnership (1) $35B $24B $26B Richmond Assets Gross Loans(2) Deposits Charlotte Dominant Southeast Franchise(3) Atlanta 300+ 10 of the top 15 #8 Charleston Largest Bank Branch Southeast Growth Headquartered in Locations Markets the Southeast Pr
Slide 7: Proven Successful Acquirors
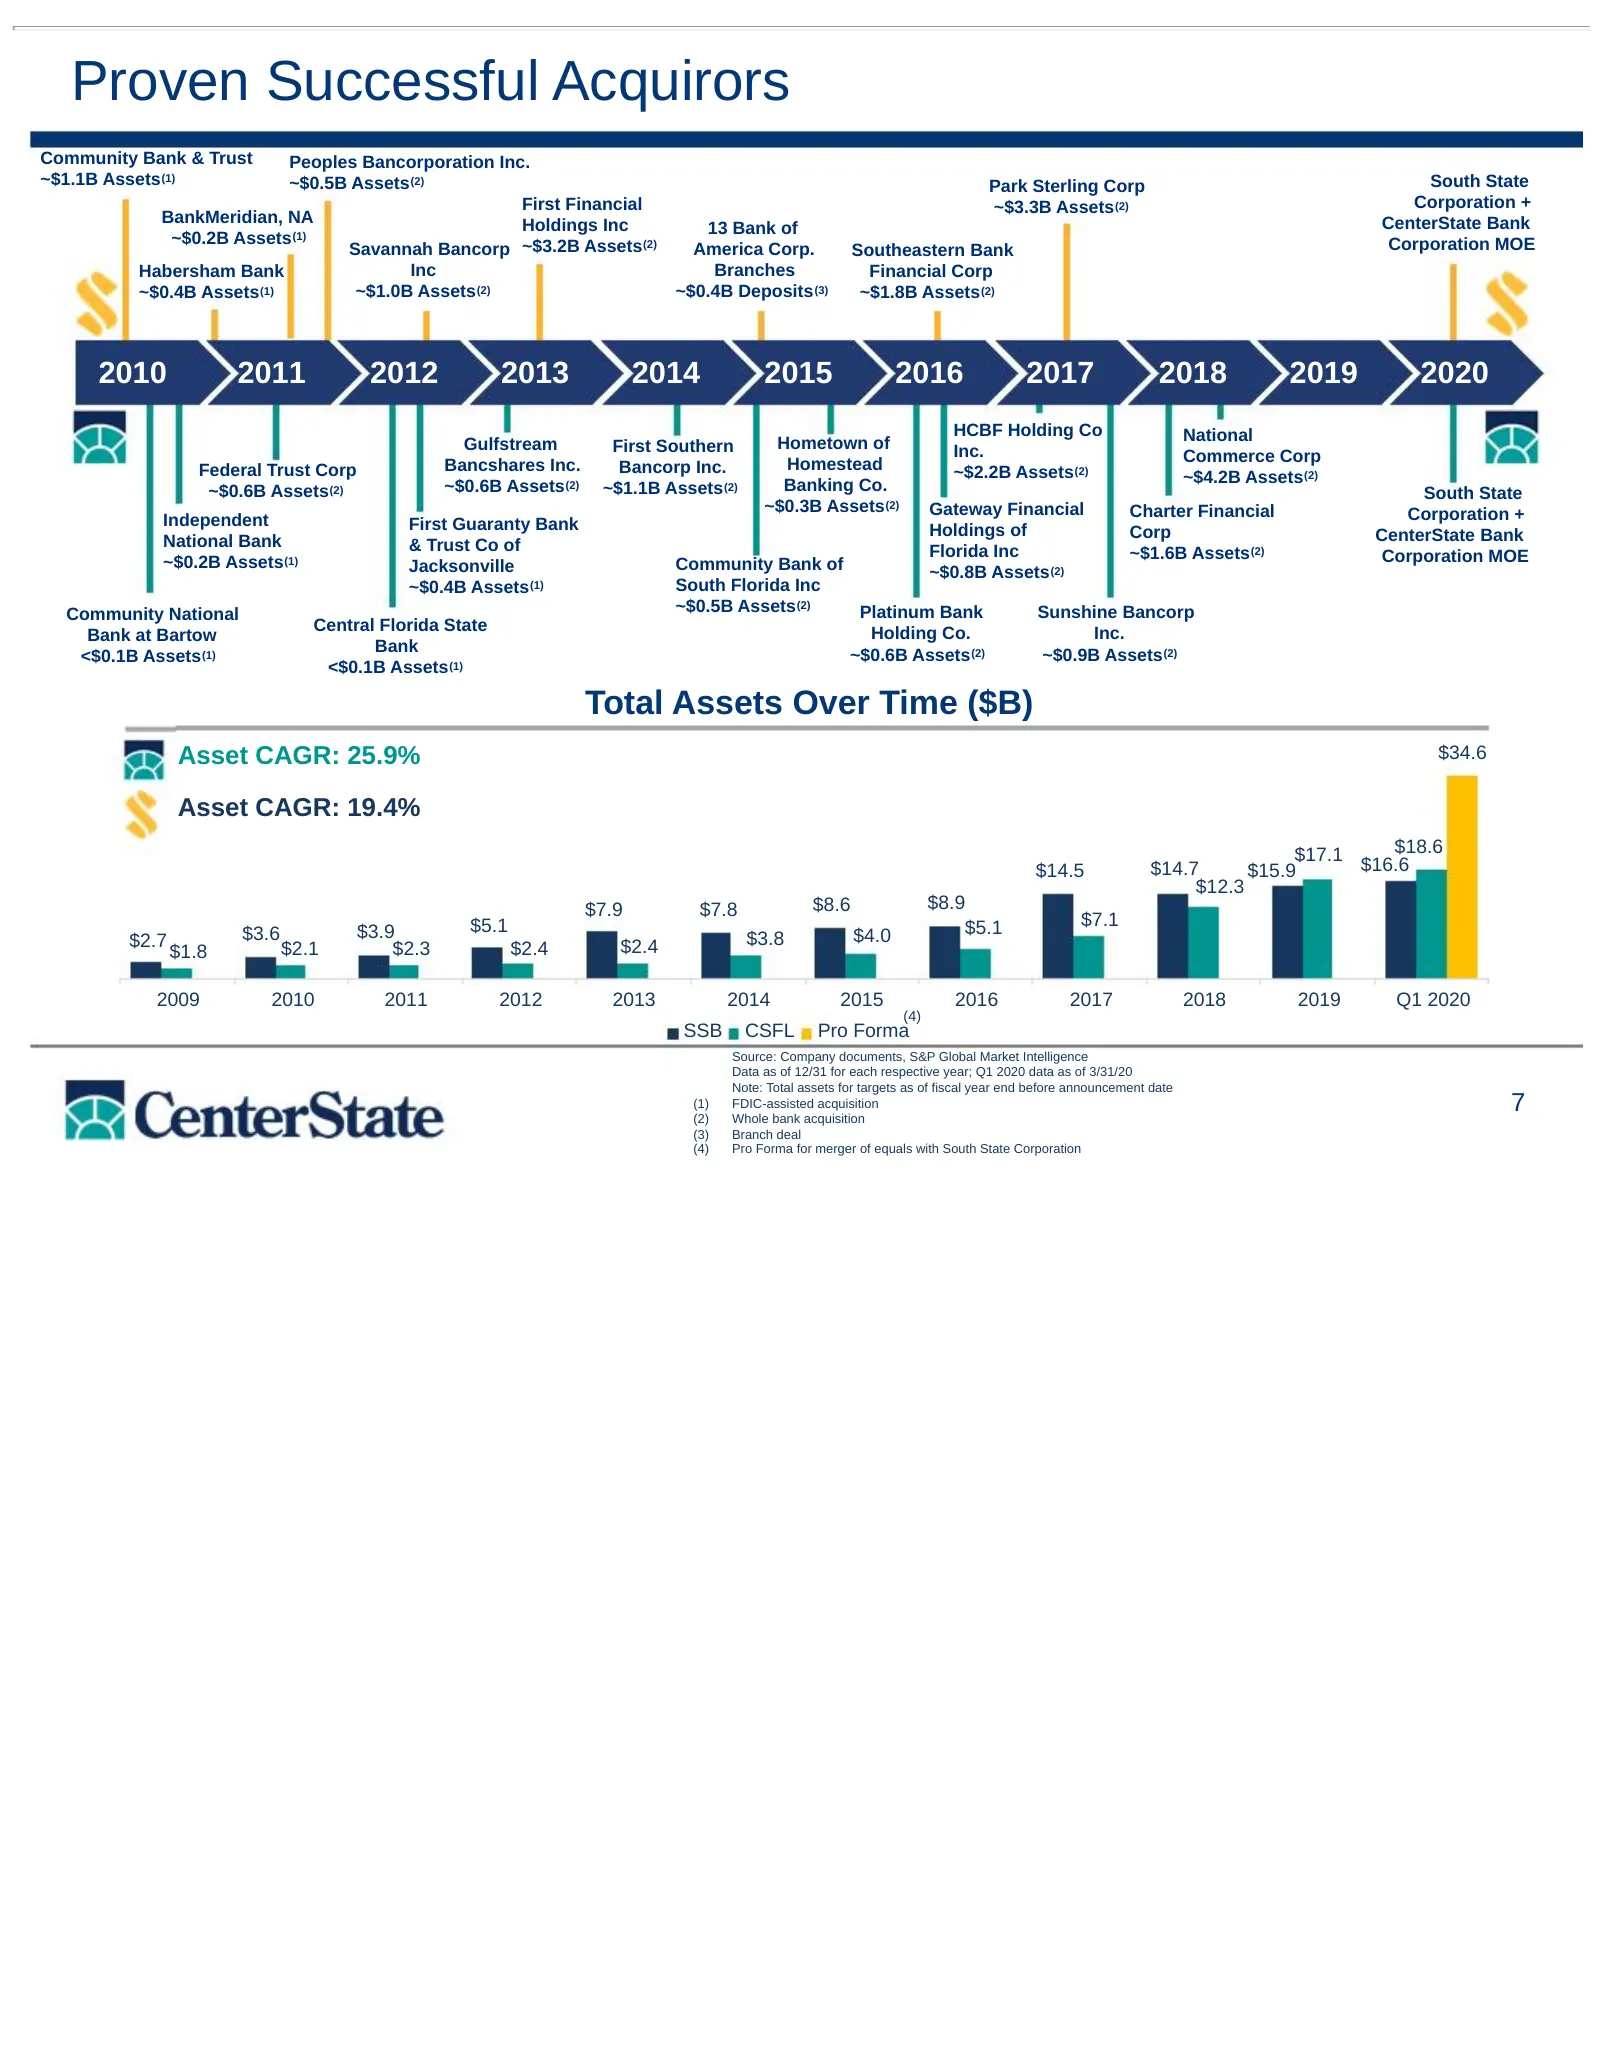
Proven Successful Acquirors Community Bank & Trust Peoples Bancorporation Inc. ~$1.1B Assets (1) ~$0.5B Assets (2) Park Sterling Corp South State First Financial ~$3.3B Assets (2) Corporation + BankMeridian, NA Holdings Inc CenterState Bank 13 Bank of ~$0.2B Assets (1) Corporation MOE Savannah Banco
Slide 8: Key Investment Highlights
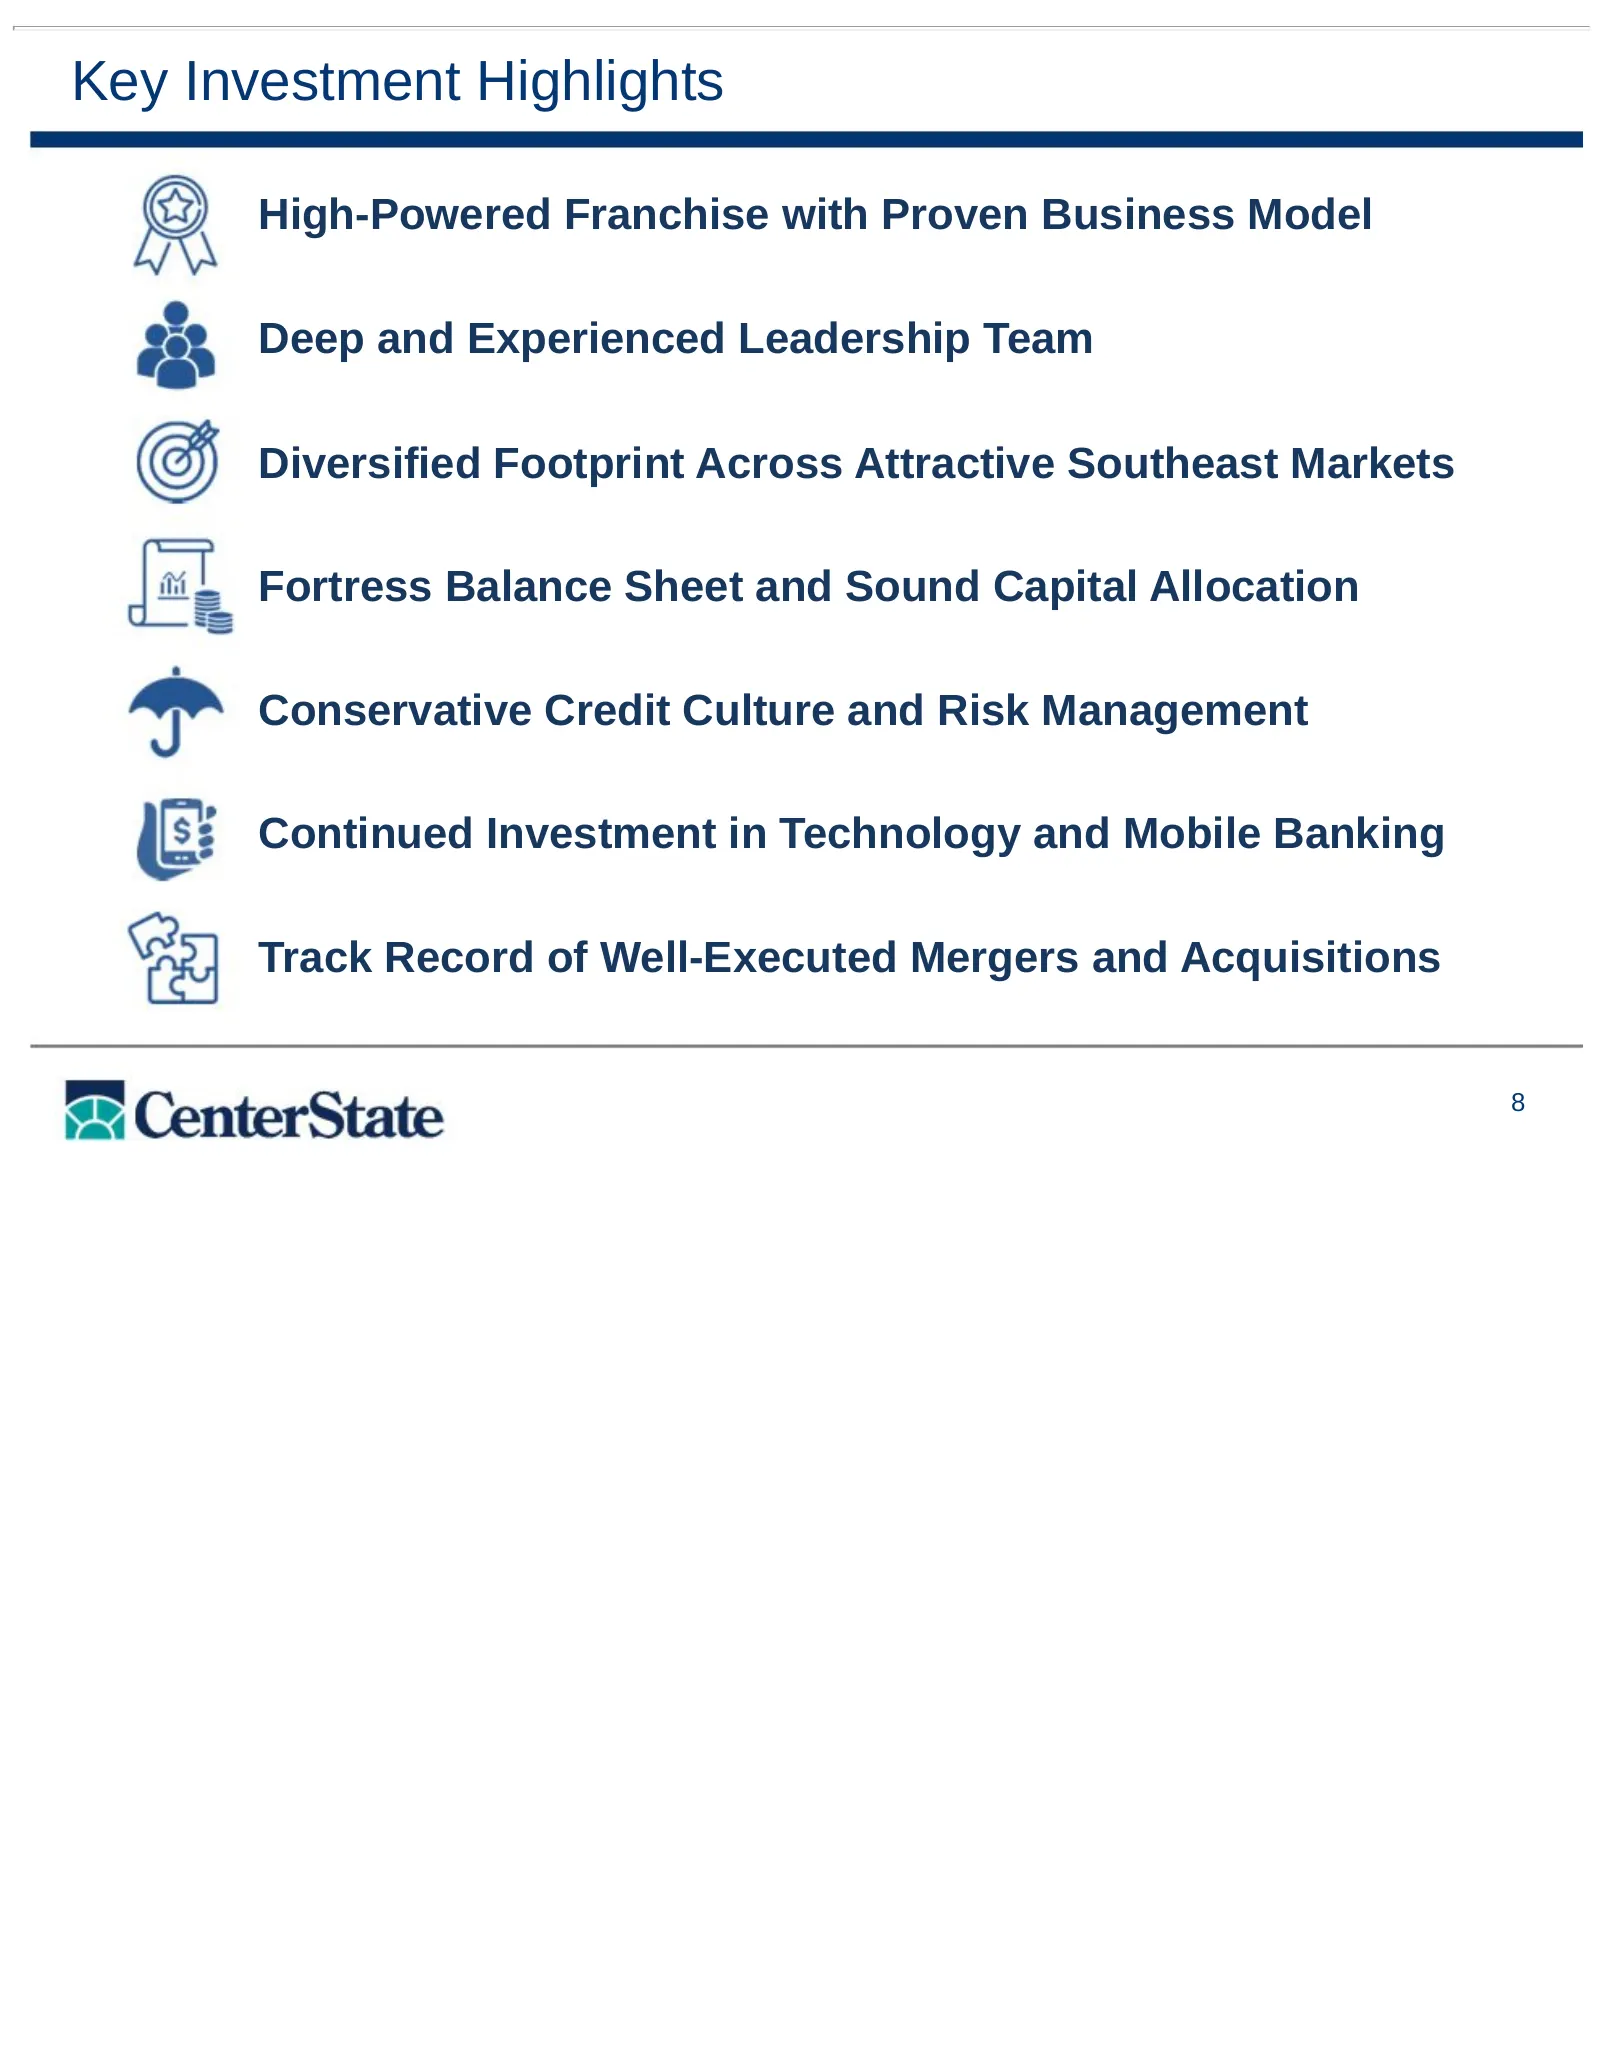
Key Investment Highlights High-Powered Franchise with Proven Business Model Deep and Experienced Leadership Team Diversified Footprint Across Attractive Southeast Markets Fortress Balance Sheet and Sound Capital Allocation Conservative Credit Culture and Risk Management Continued Investment in Techn
Slide 9: Deep and Experienced Management Team
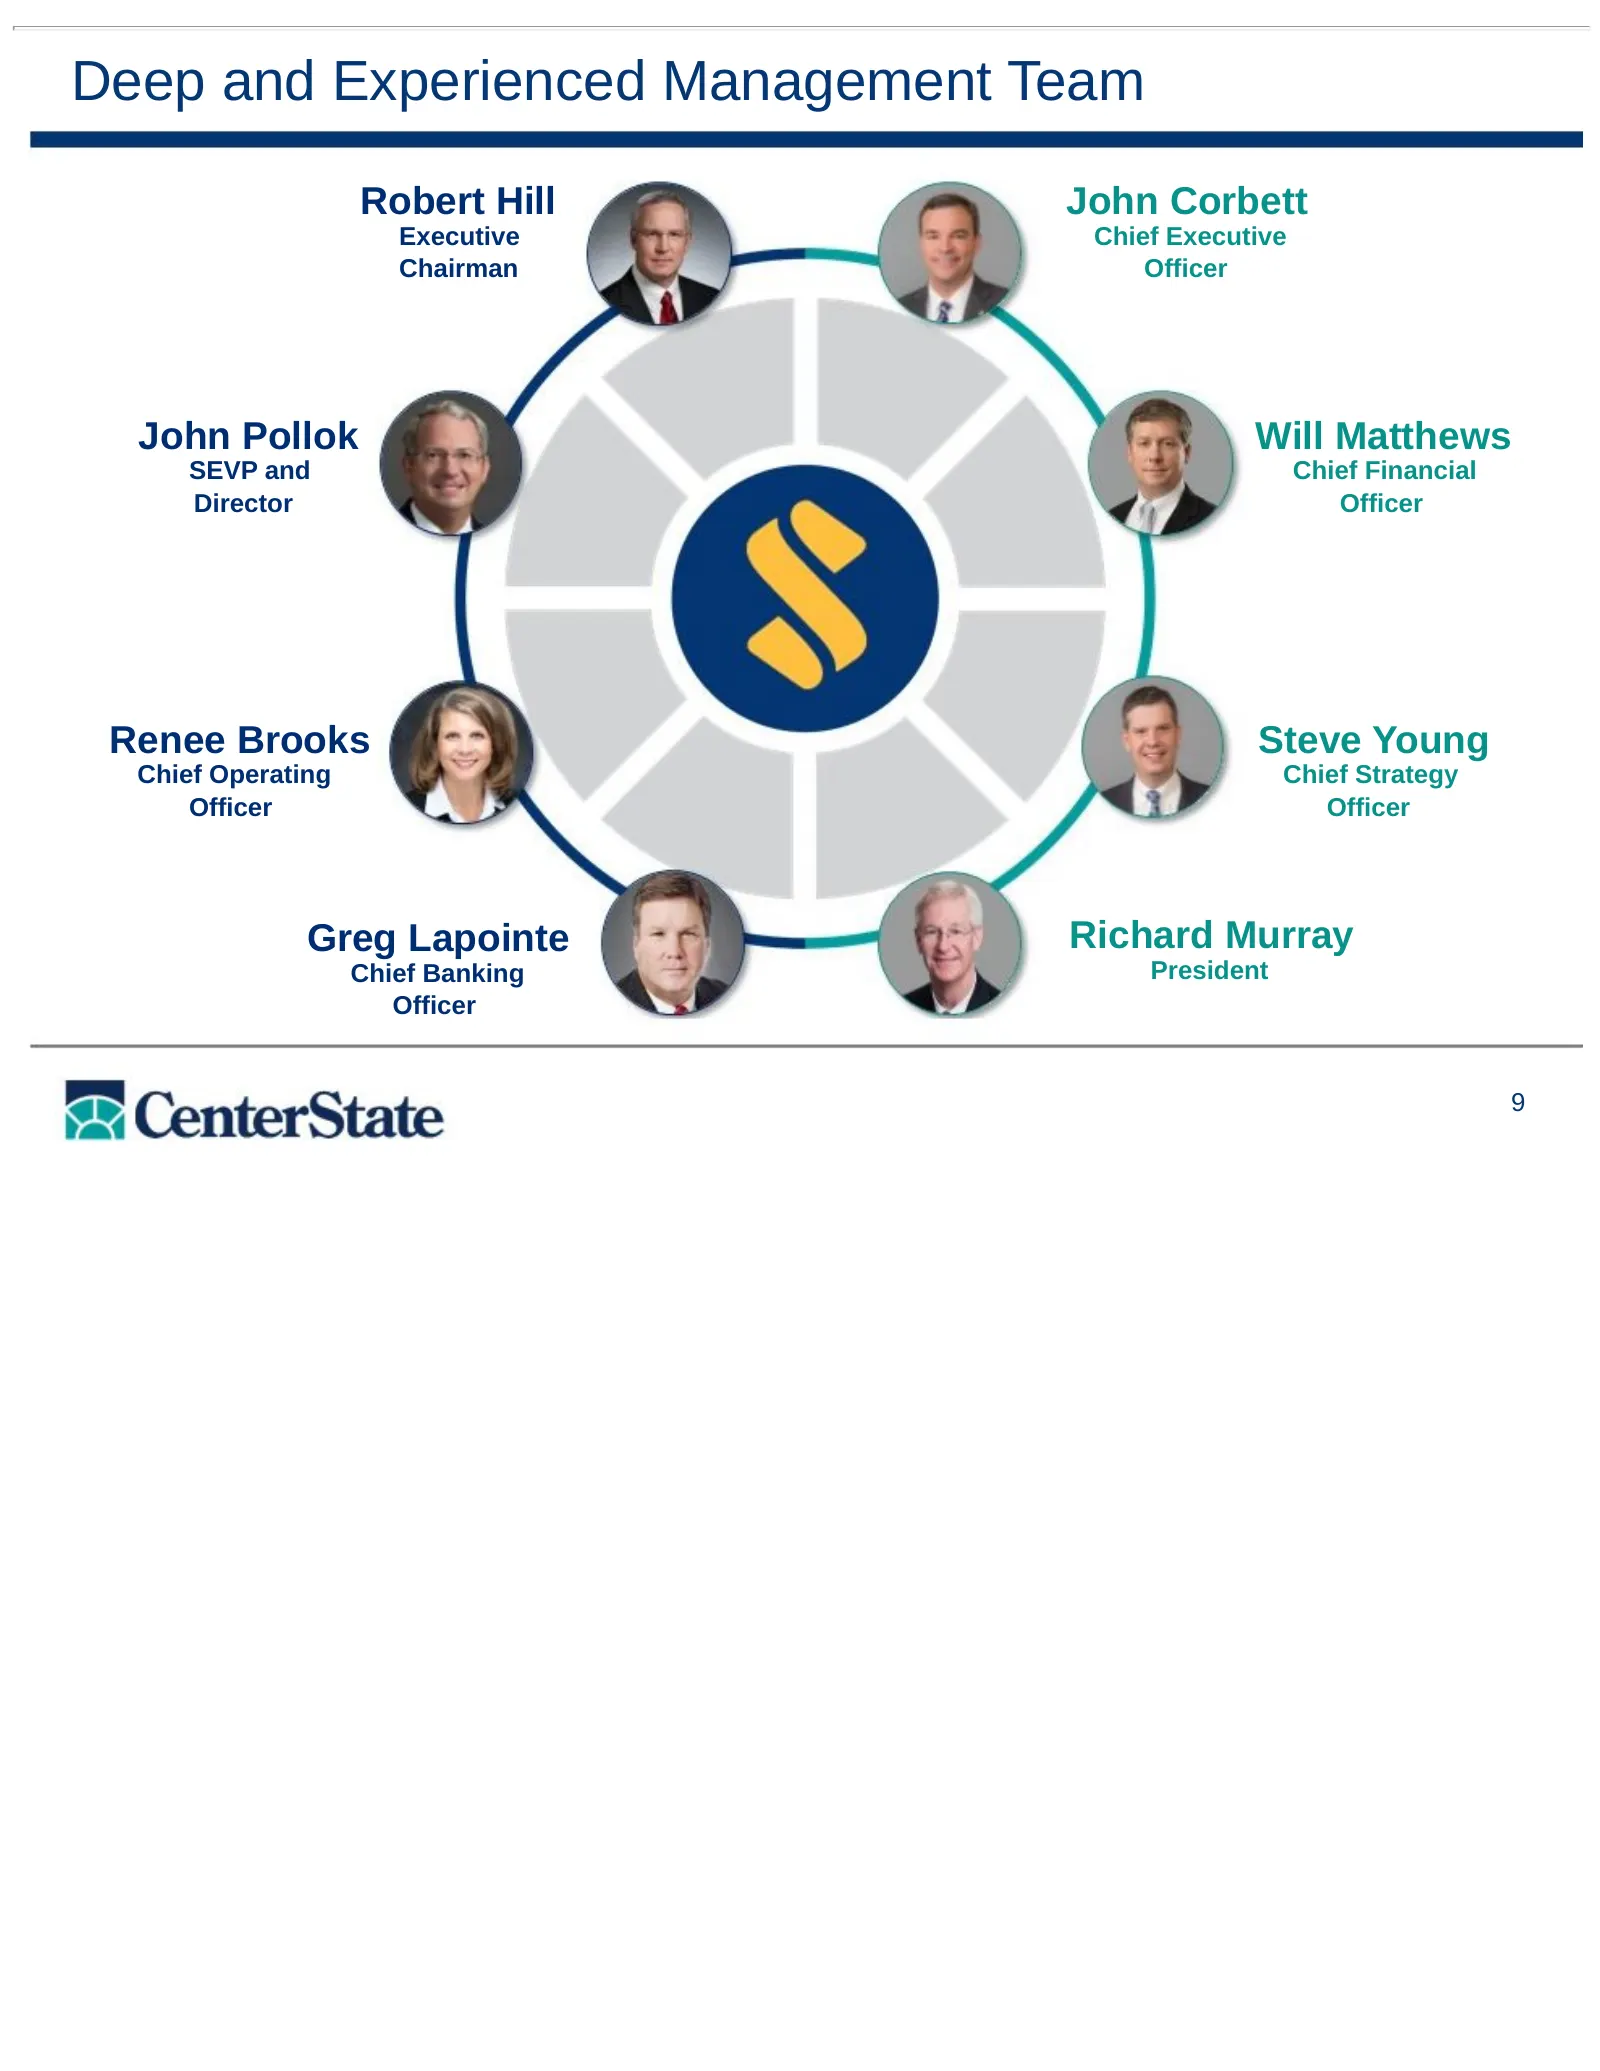
Deep and Experienced Management Team Robert Hill John Corbett Executive Chief Executive Chairman Officer John Pollok Will Matthews SEVP and Chief Financial Director Officer Renee Brooks Steve Young Chief Operating Chief Strategy Officer Officer Greg Lapointe Richard Murray Chief Banking President Of
Slide 10: Attractive Markets of Operation
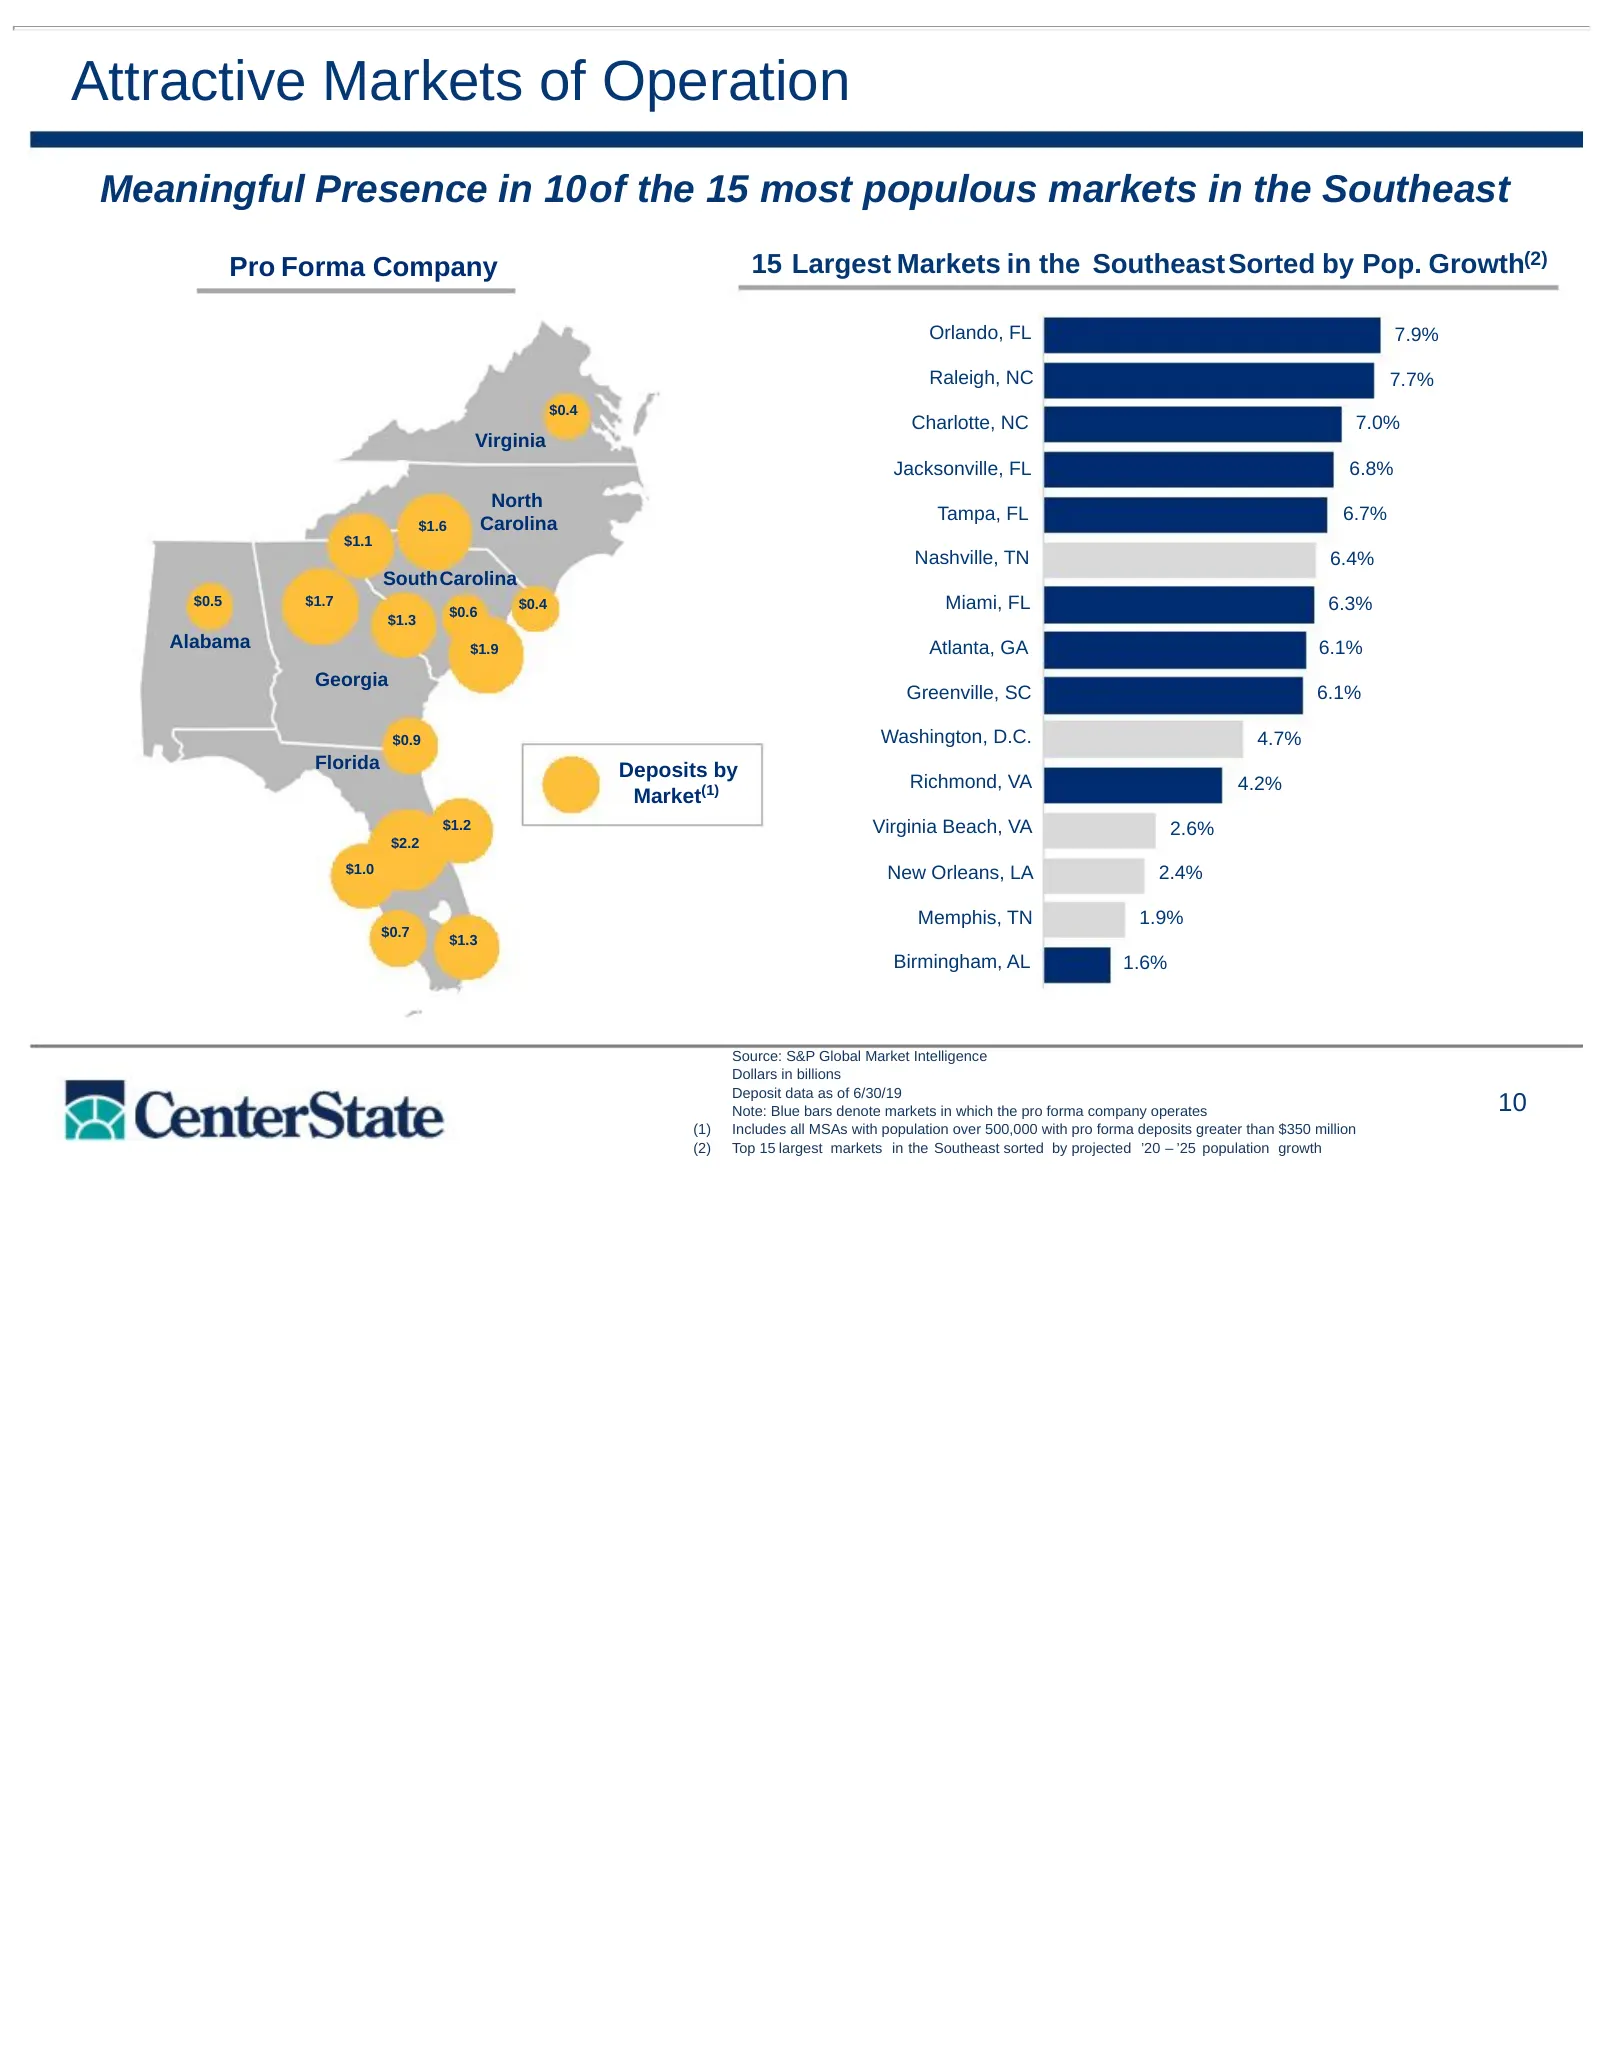
Attractive Markets of Operation Meaningful Presence in 10of the 15 most populous markets in the Southeast Pro Forma Company 15 Largest Markets in the Southeast Sorted by Pop. Growth(2) Orlando, FL 7.9% Raleigh, NC 7.7% $0.4 Charlotte, NC 7.0% Virginia Jacksonville, FL 6.8% North Tampa, FL 6.7% $1.6
Slide 11: Peer-leading Pro Forma Demographics and Deposit Base
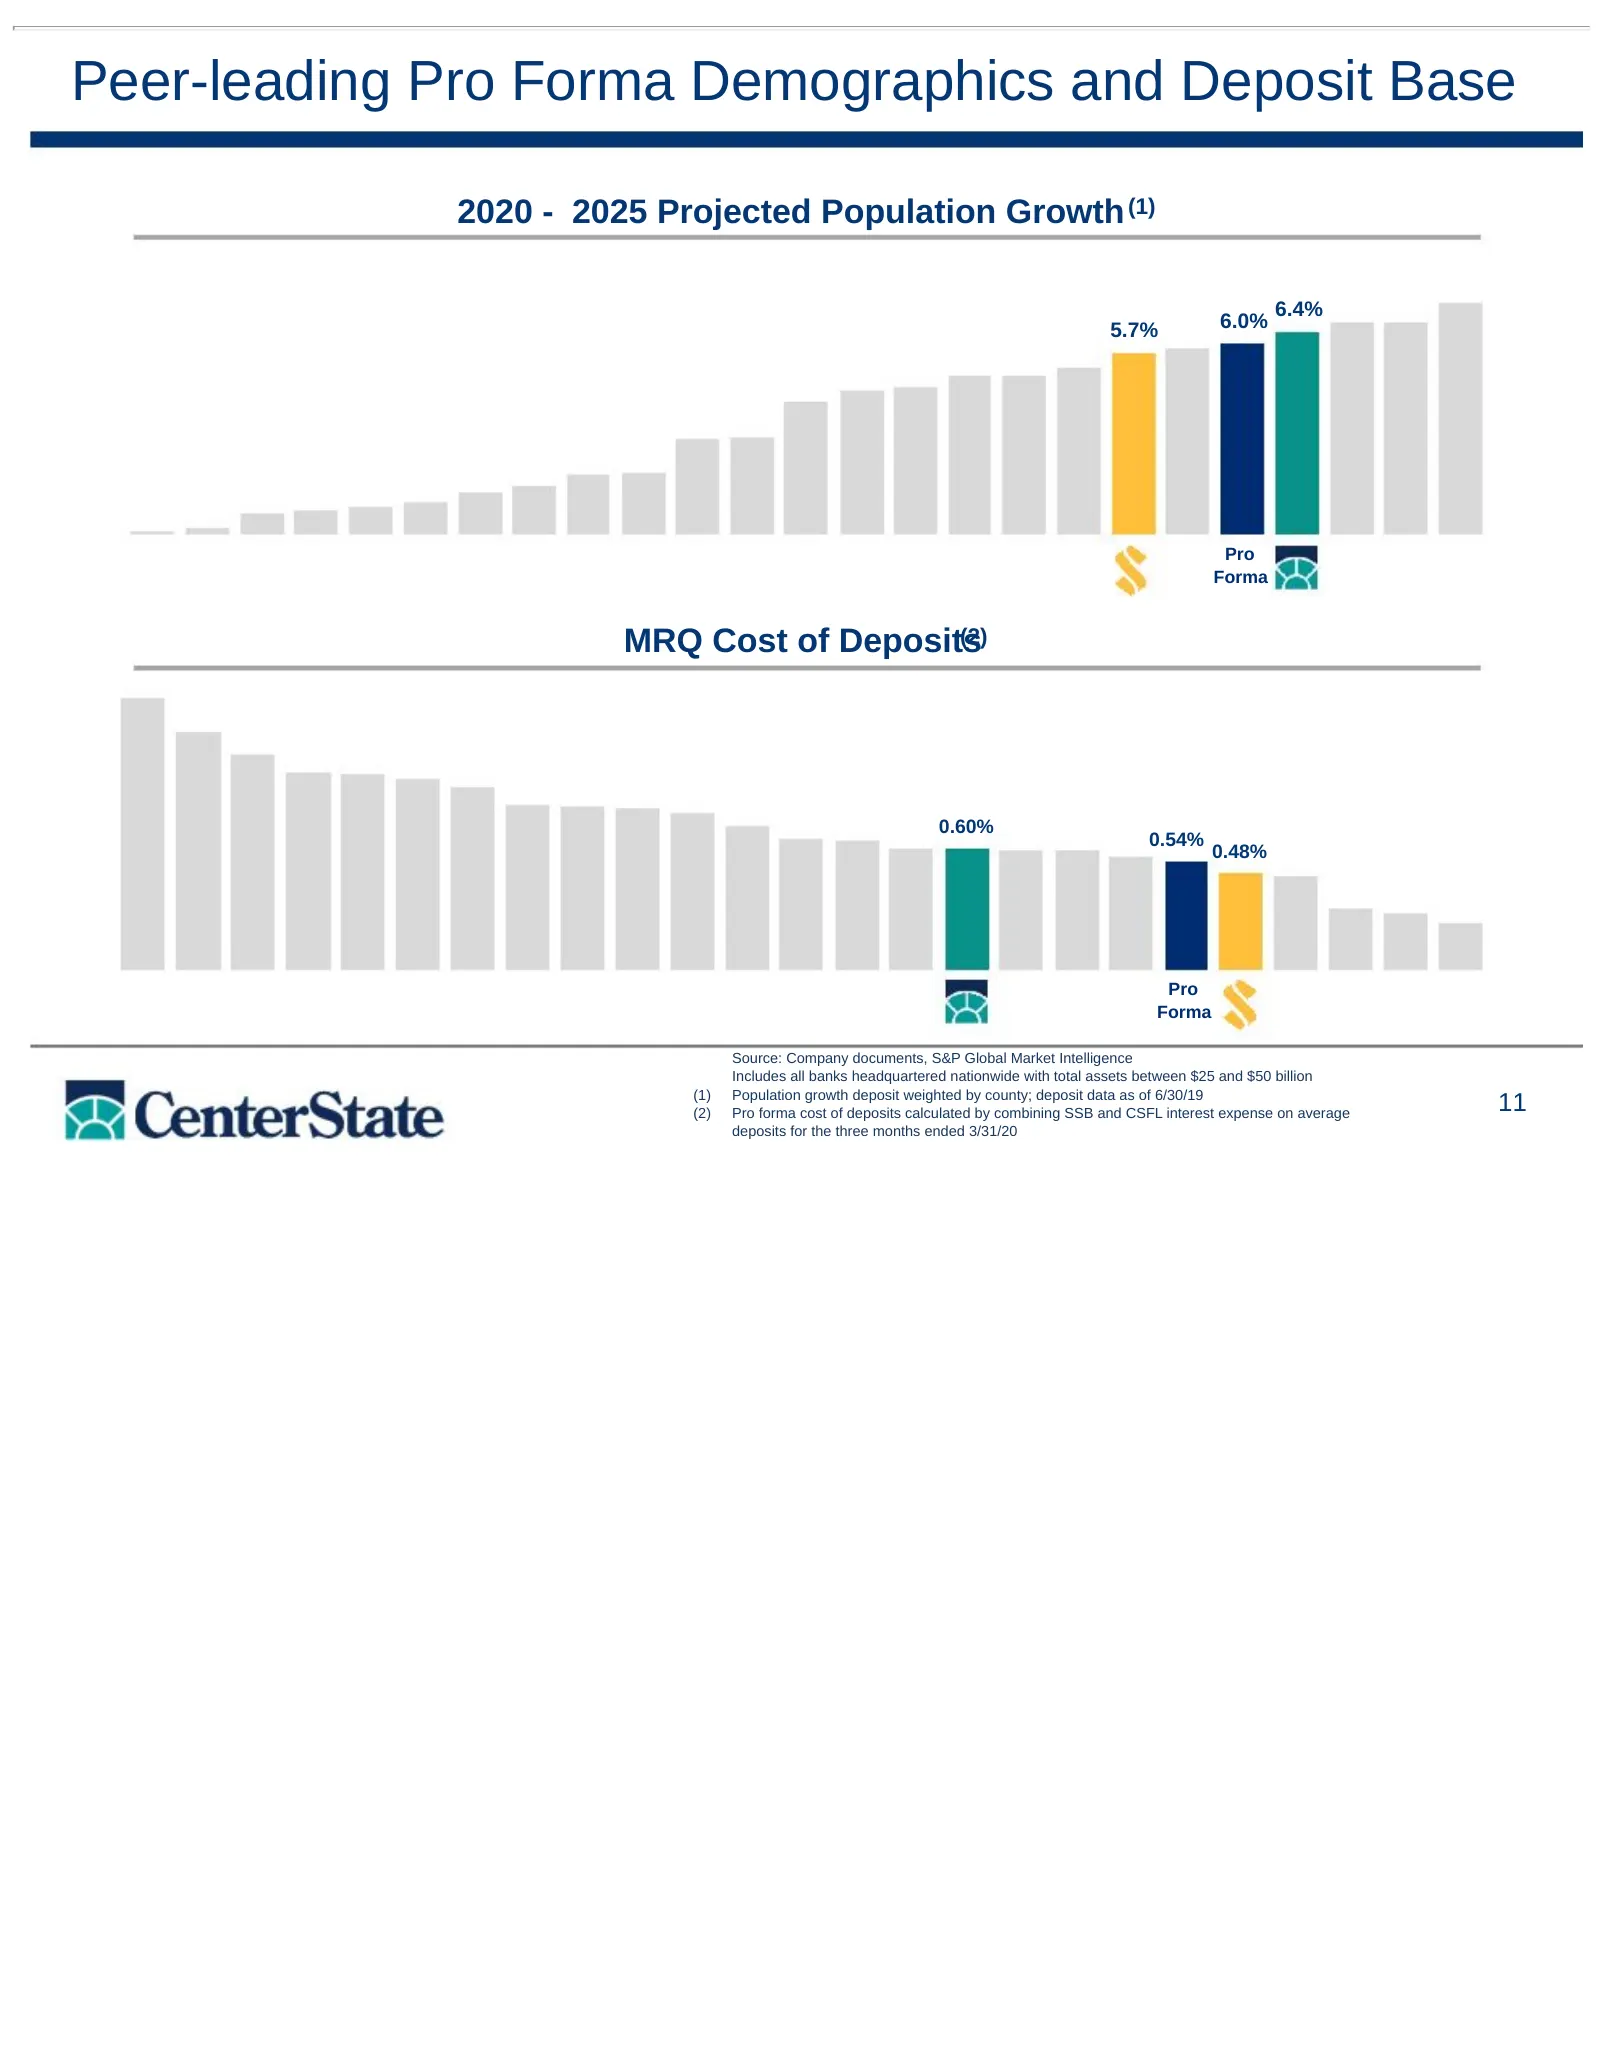
Peer-leading Pro Forma Demographics and Deposit Base 2020 - 2025 Projected Population Growth (1) 6.4% 5.7% 6.0% Pro Forma MRQ Cost of Deposits (2) 0.60% 0.54% 0.48% Pro Forma Source: Company documents, S&P Global Market Intelligence Includes all banks headquartered nationwide with total assets betwe
Slide 12: Southeast Deposit Market Share
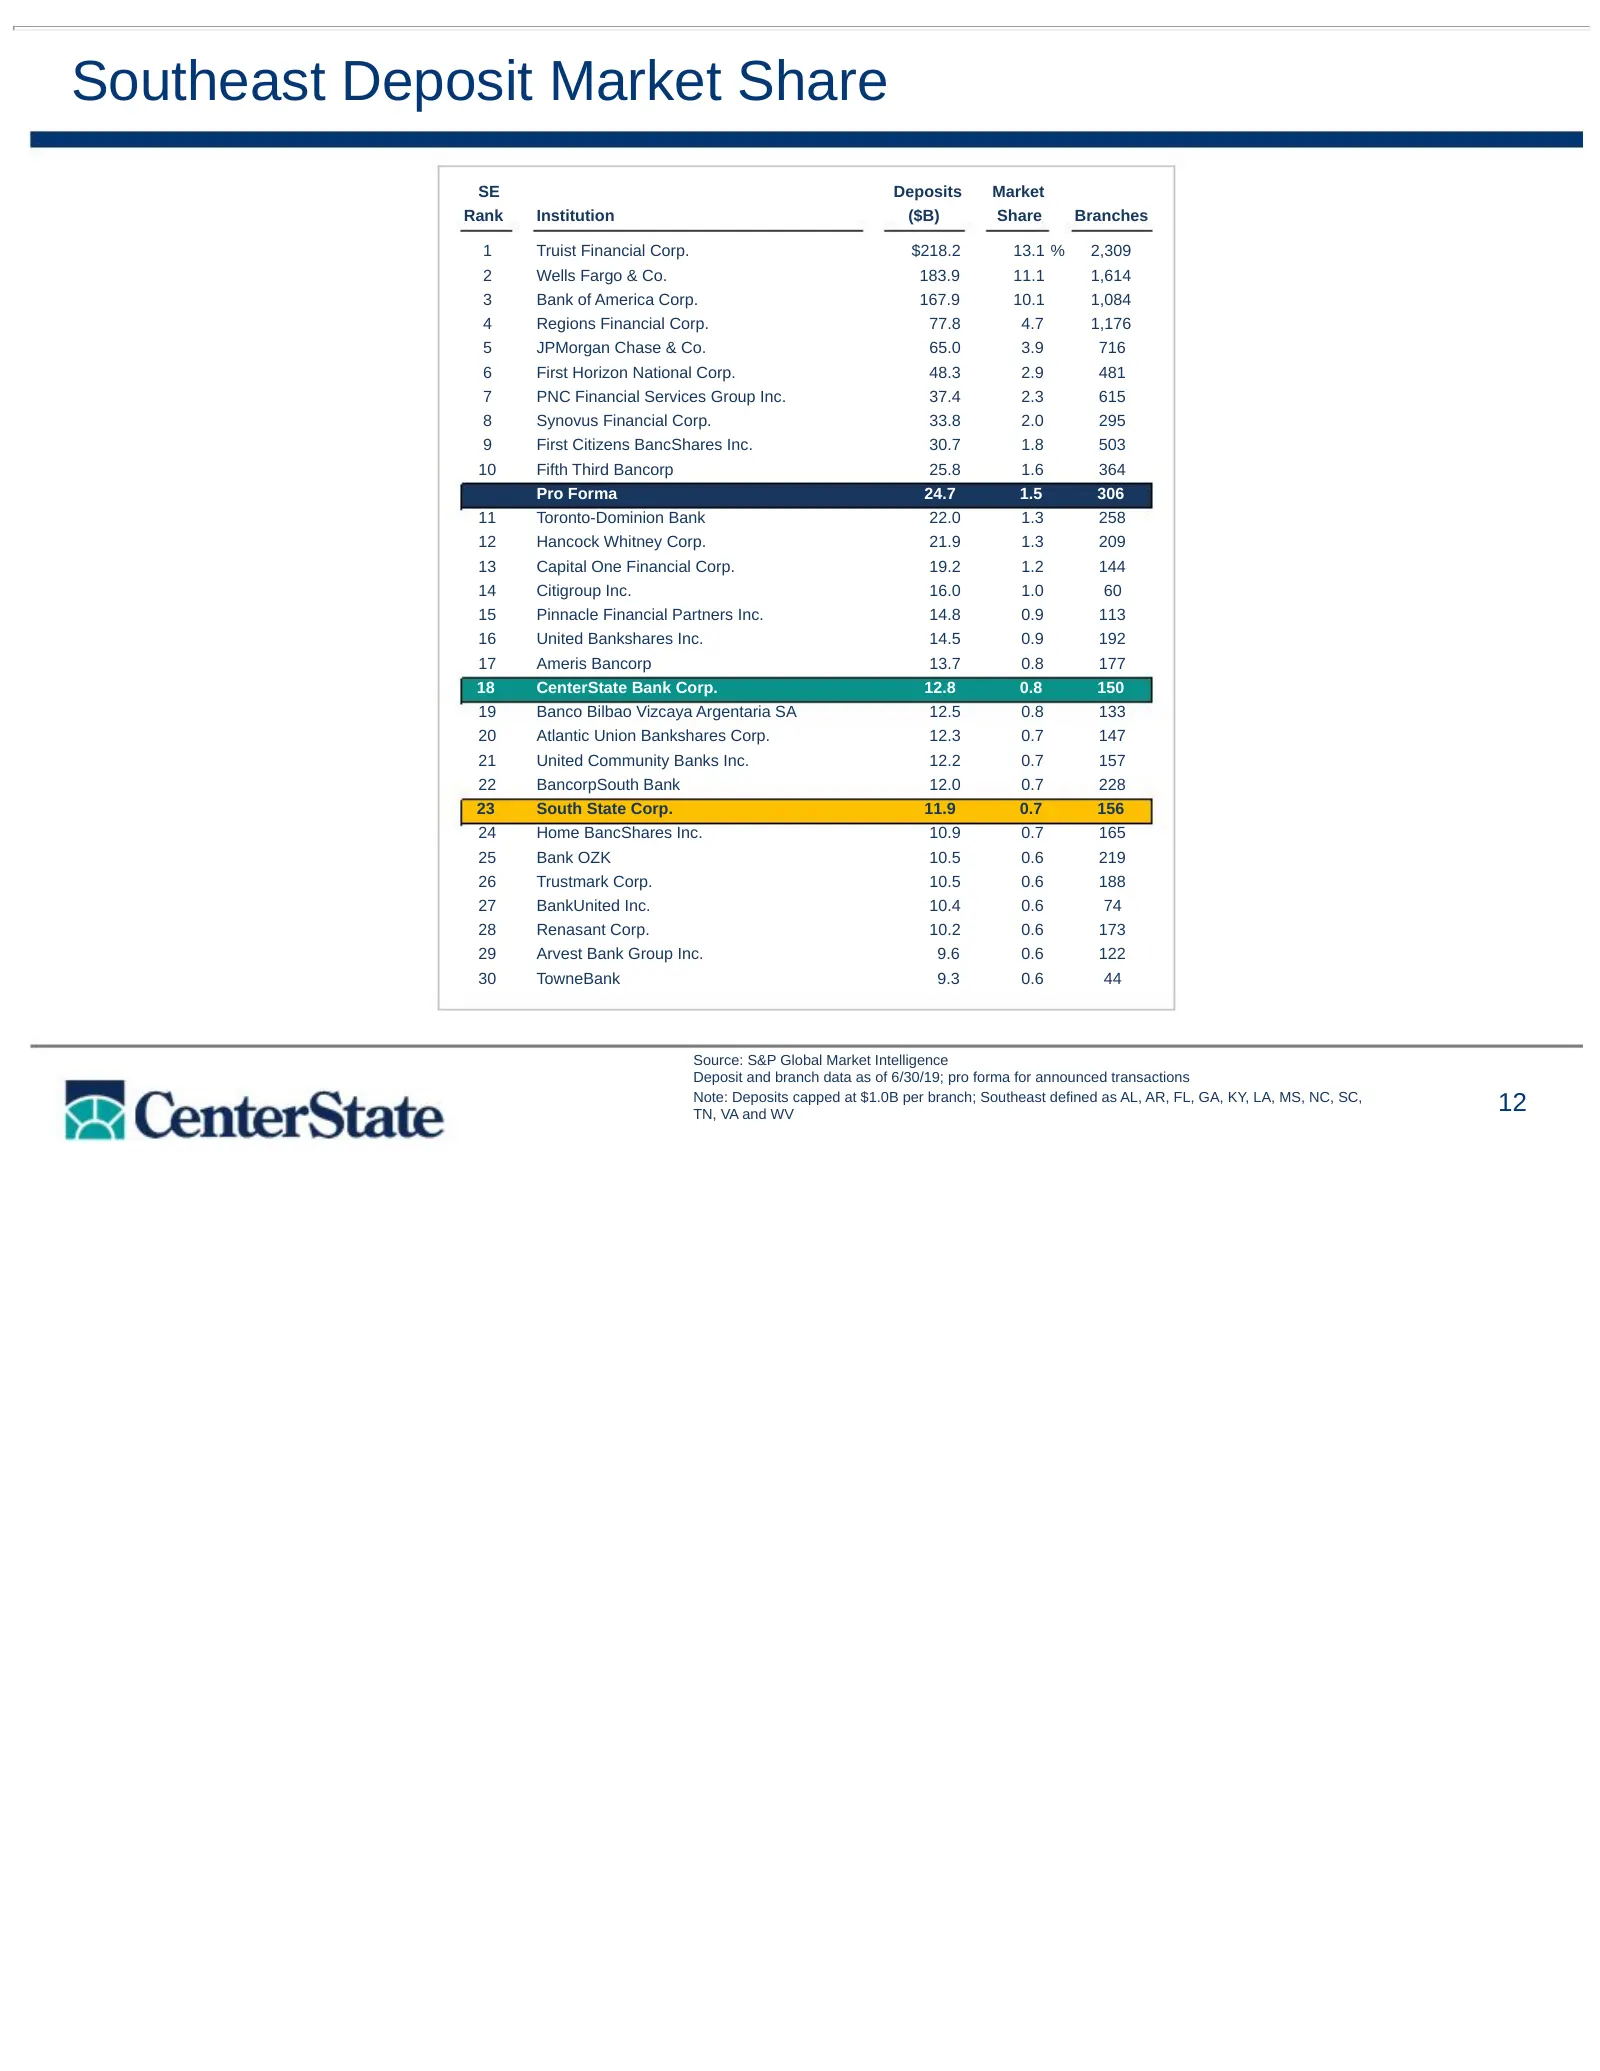
Southeast Deposit Market Share SE Deposits Market Rank Institution ($B) Share Branches 1 Truist Financial Corp. $218.2 13.1 % 2,309 2 Wells Fargo & Co. 183.9 11.1 1,614 3 Bank of America Corp. 167.9 10.1 1,084 4 Regions Financial Corp. 77.8 4.7 1,176 5 JPMorgan Chase & Co. 65.0 3.9 716 6 First Horiz
Slide 13: COVID-19 Impact
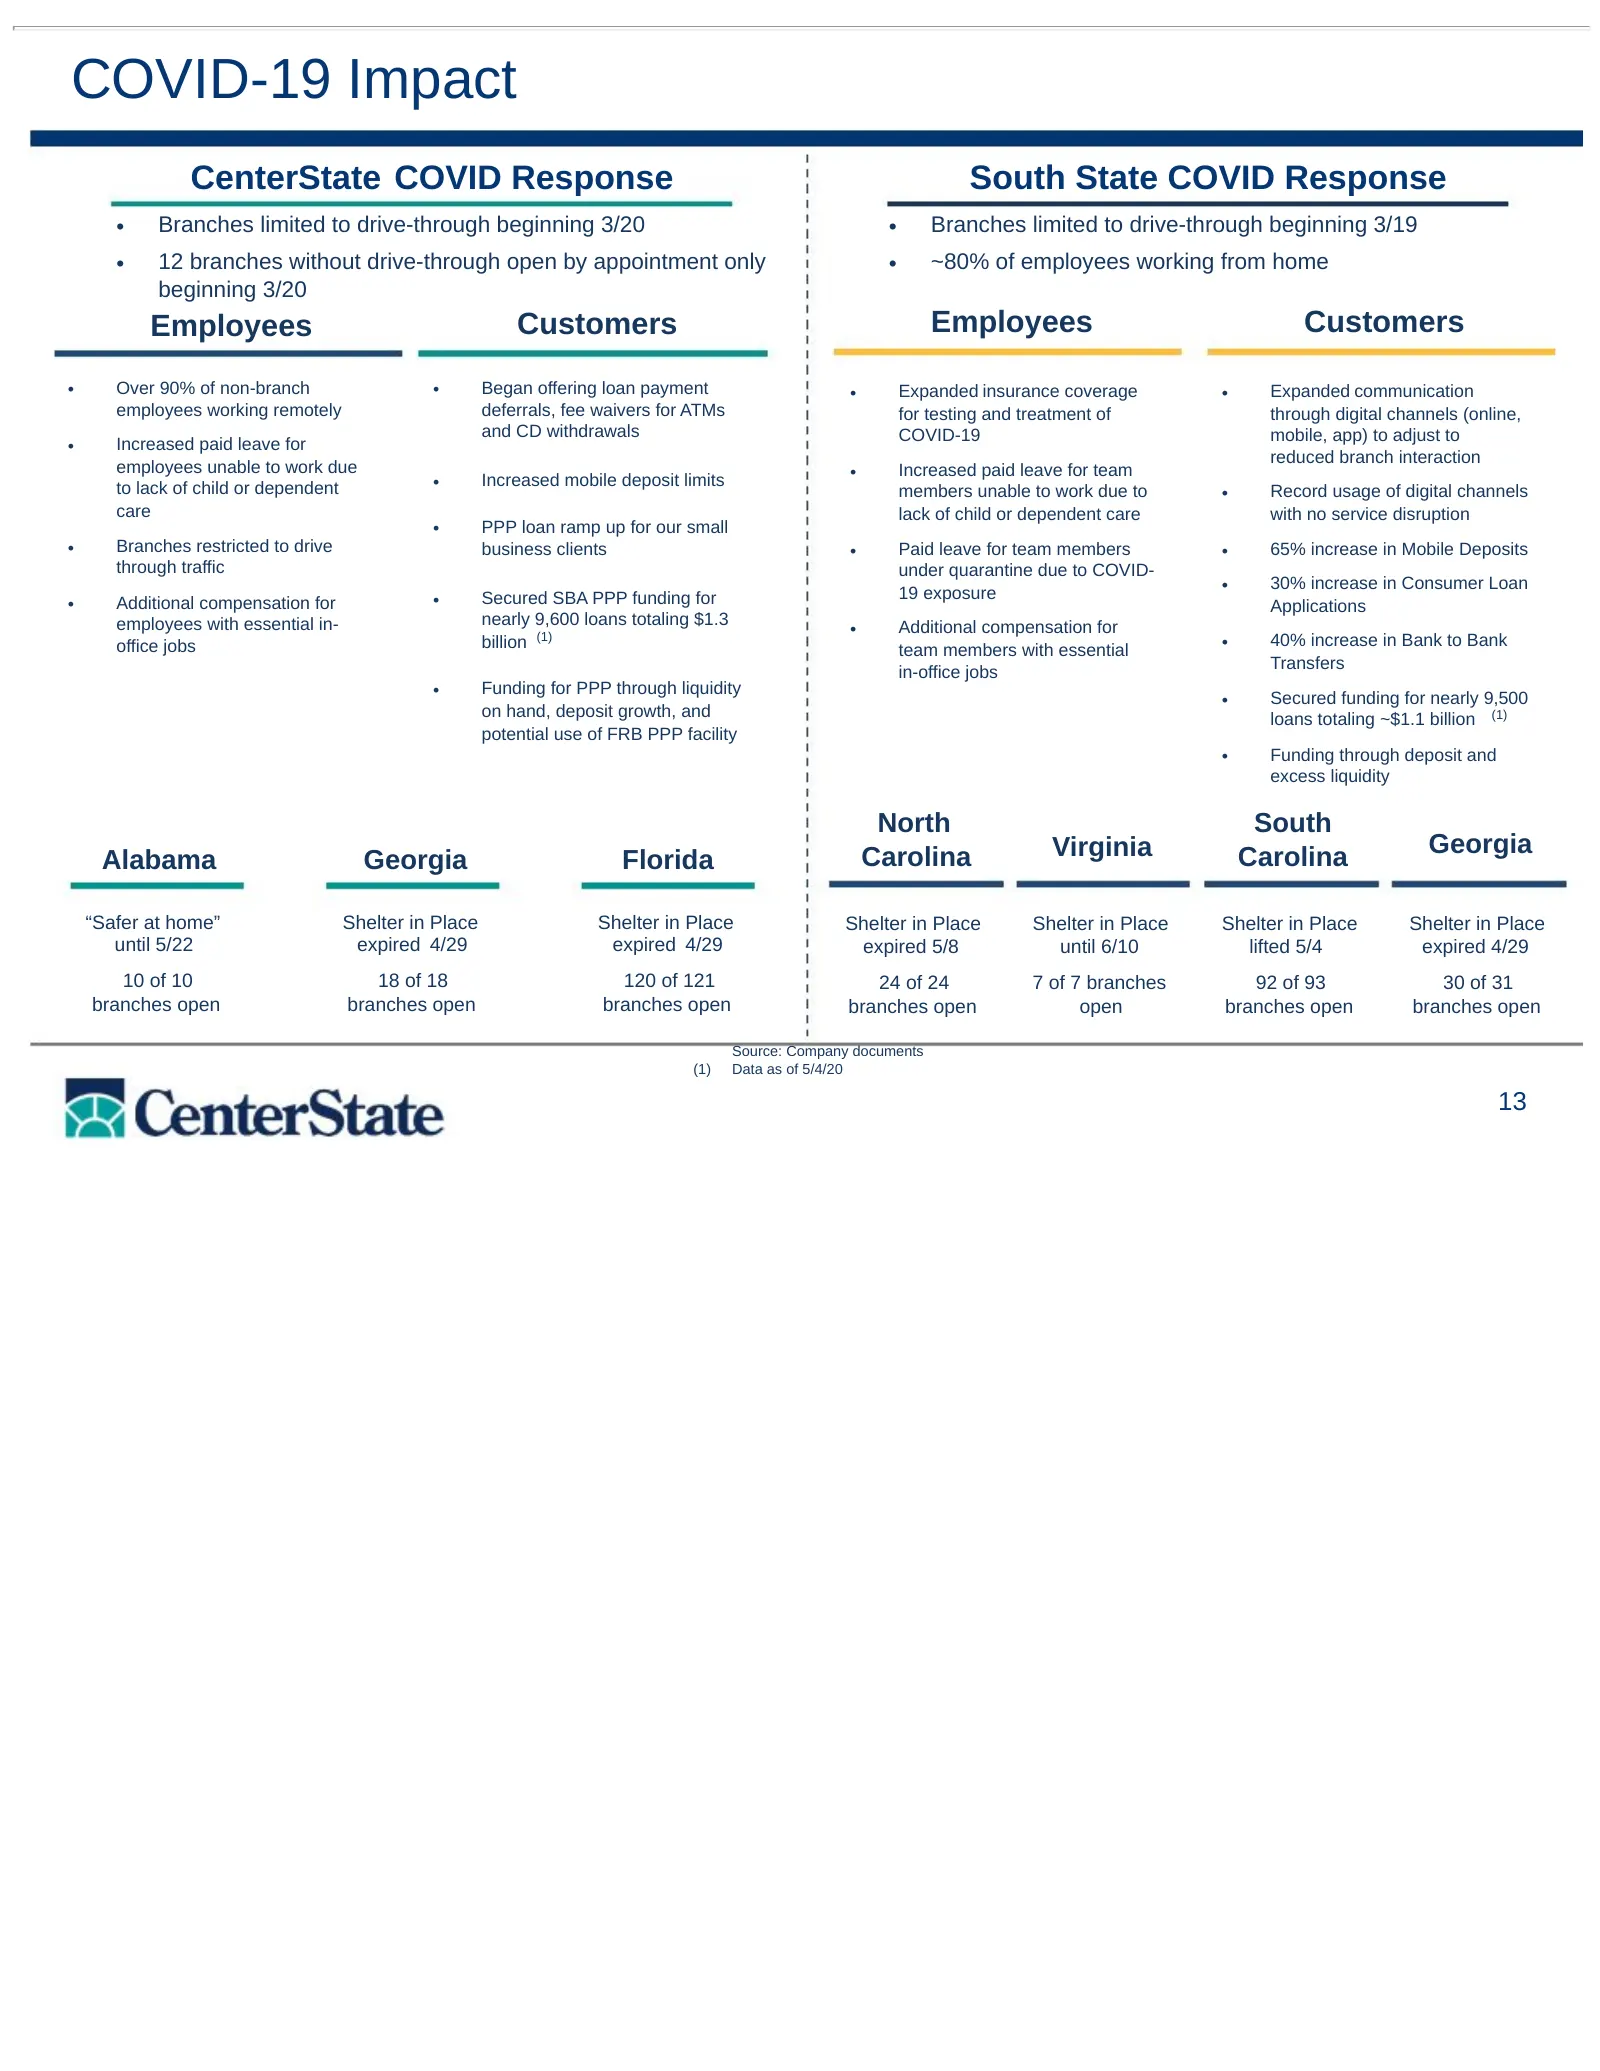
COVID-19 Impact CenterState COVID Response South State COVID Response • Branches limited to drive-through beginning 3/20 • Branches limited to drive-through beginning 3/19 • 12 branches without drive-through open by appointment only • ~80% of employees working from home beginning 3/20 Employees Cust
Slide 14: Presentation Contents
Presentation Contents I. About CenterState Bank Corporation II. Financial Highlights III. Appendix 14
Slide 15: Update of Pro Forma Financials
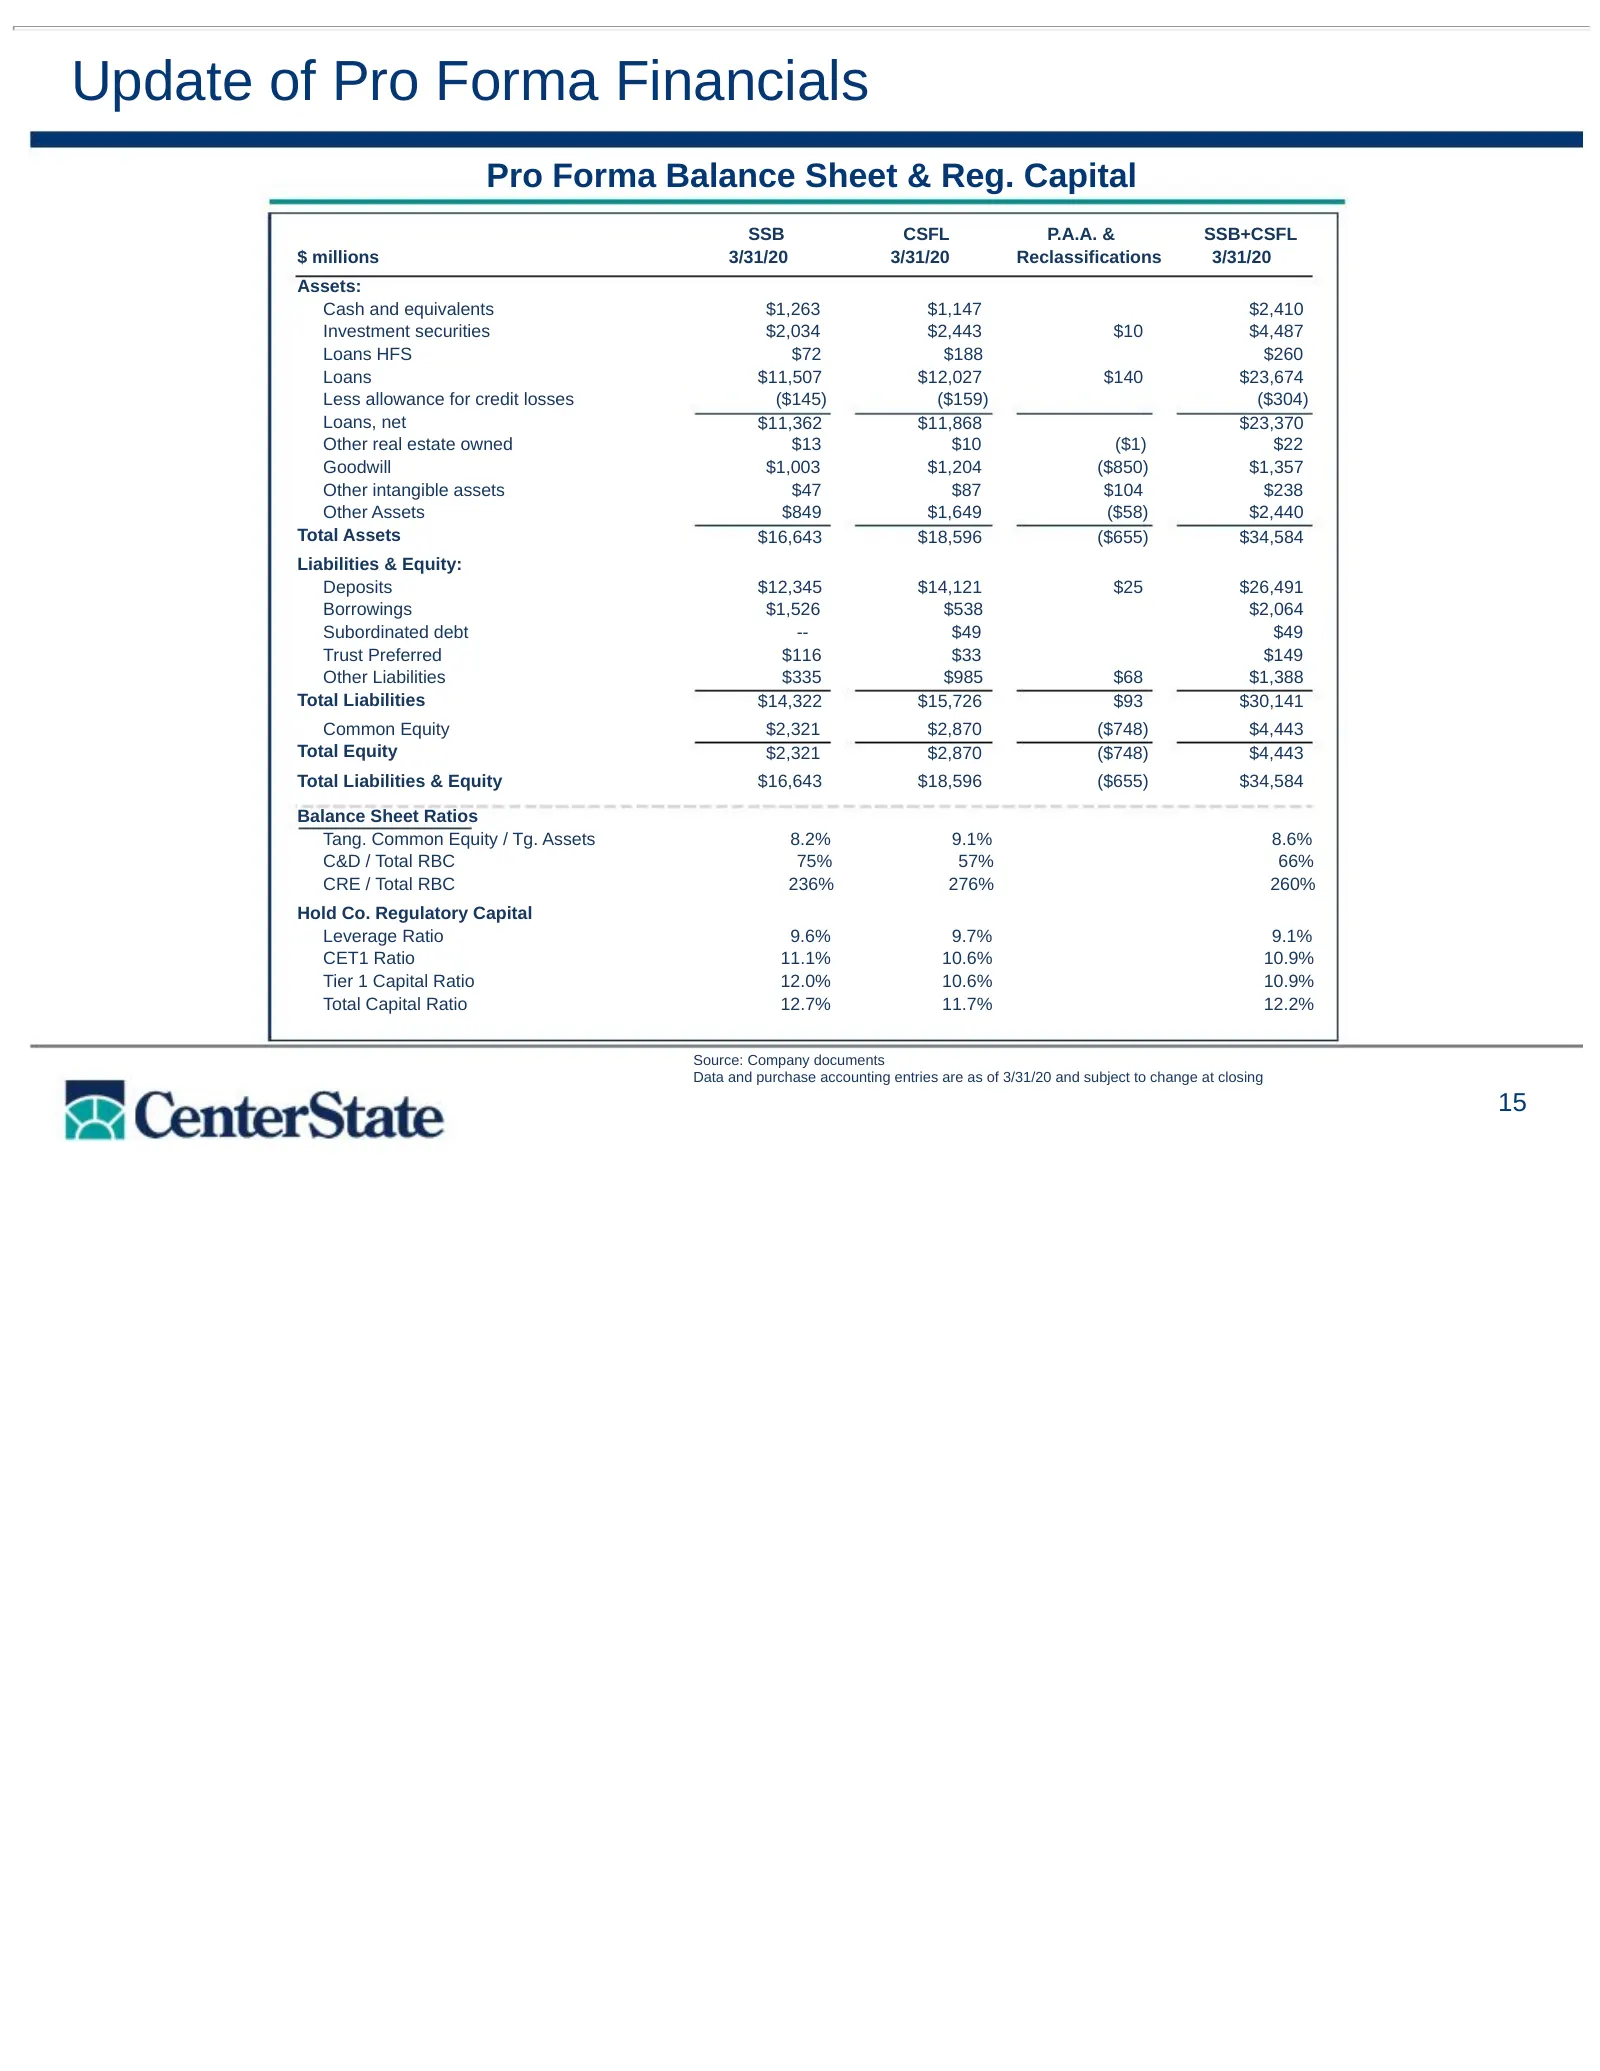
Update of Pro Forma Financials Pro Forma Balance Sheet & Reg. Capital SSB CSFL P.A.A. & SSB+CSFL $ millions 3/31/20 3/31/20 Reclassifications 3/31/20 Assets: Cash and equivalents $1,263 $1,147 $2,410 Investment securities $2,034 $2,443 $10 $4,487 Loans HFS $72 $188 $260 Loans $11,507 $12,027 $140 $2
Slide 16: 1Q 2020 Highlights – Linked Quarter
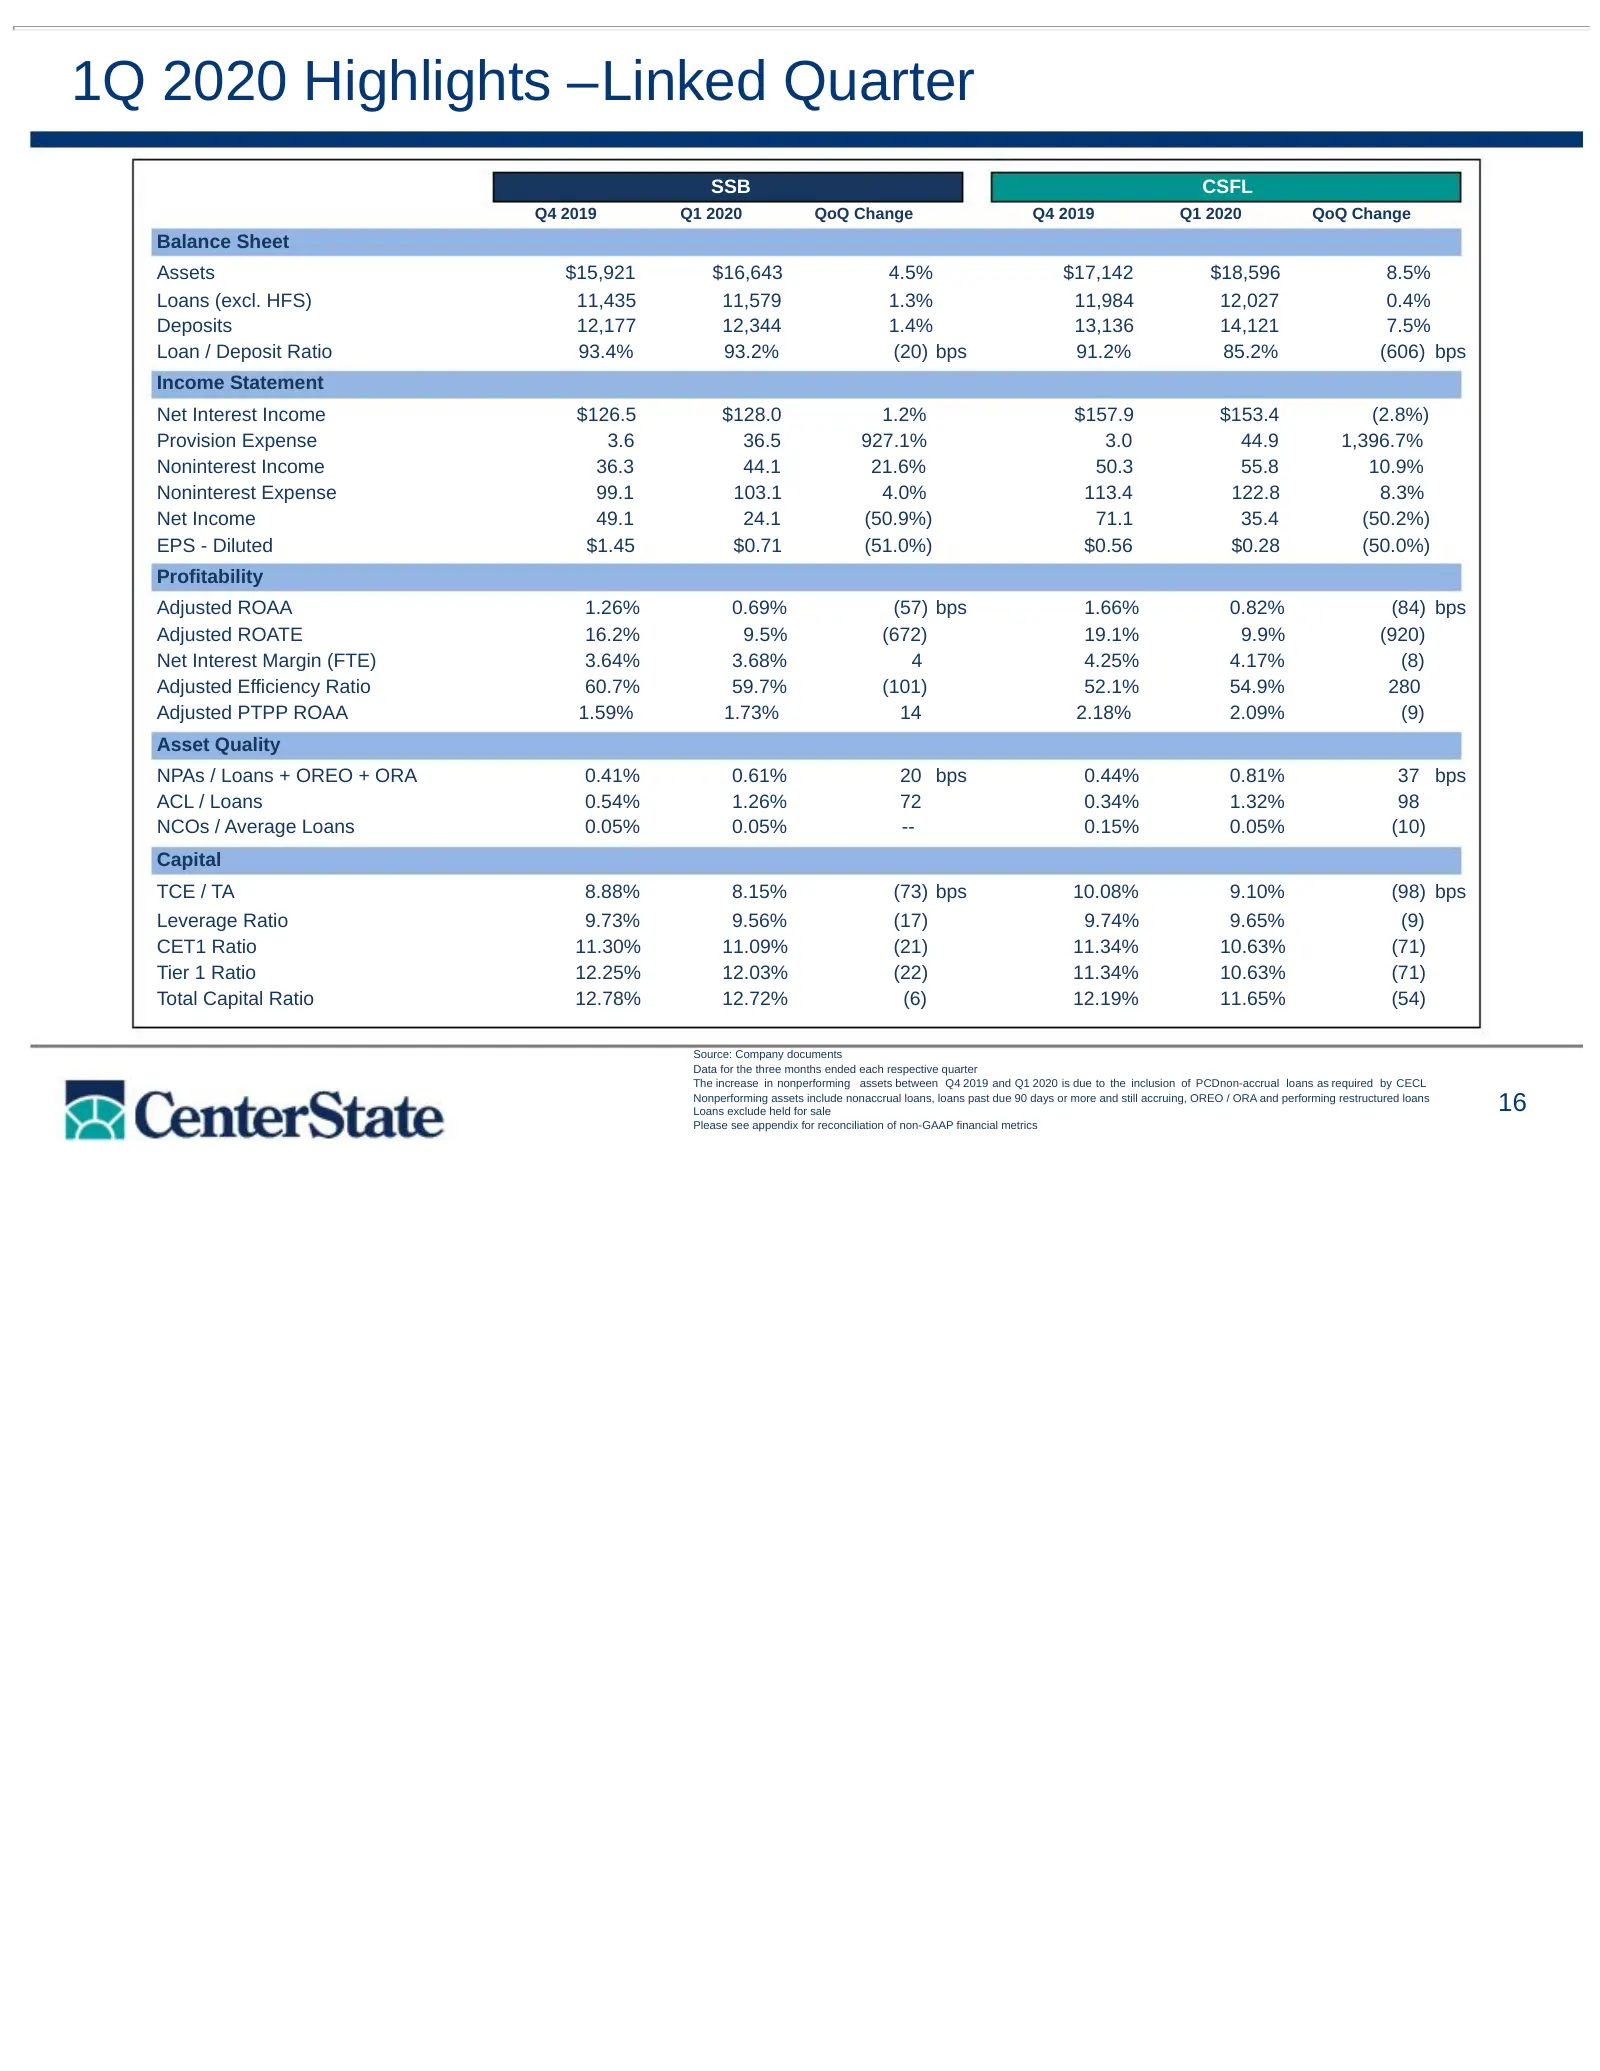
1Q 2020 Highlights –Linked Quarter SSB CSFL Q4 2019 Q1 2020 QoQ Change Q4 2019 Q1 2020 QoQ Change Balance Sheet Assets $15,921 $16,643 4.5% $17,142 $18,596 8.5% Loans (excl. HFS) 11,435 11,579 1.3% 11,984 12,027 0.4% Deposits 12,177 12,344 1.4% 13,136 14,121 7.5% Loan / Deposit Ratio 93.4% 93.2% (20
Slide 17: CenterState Profitability
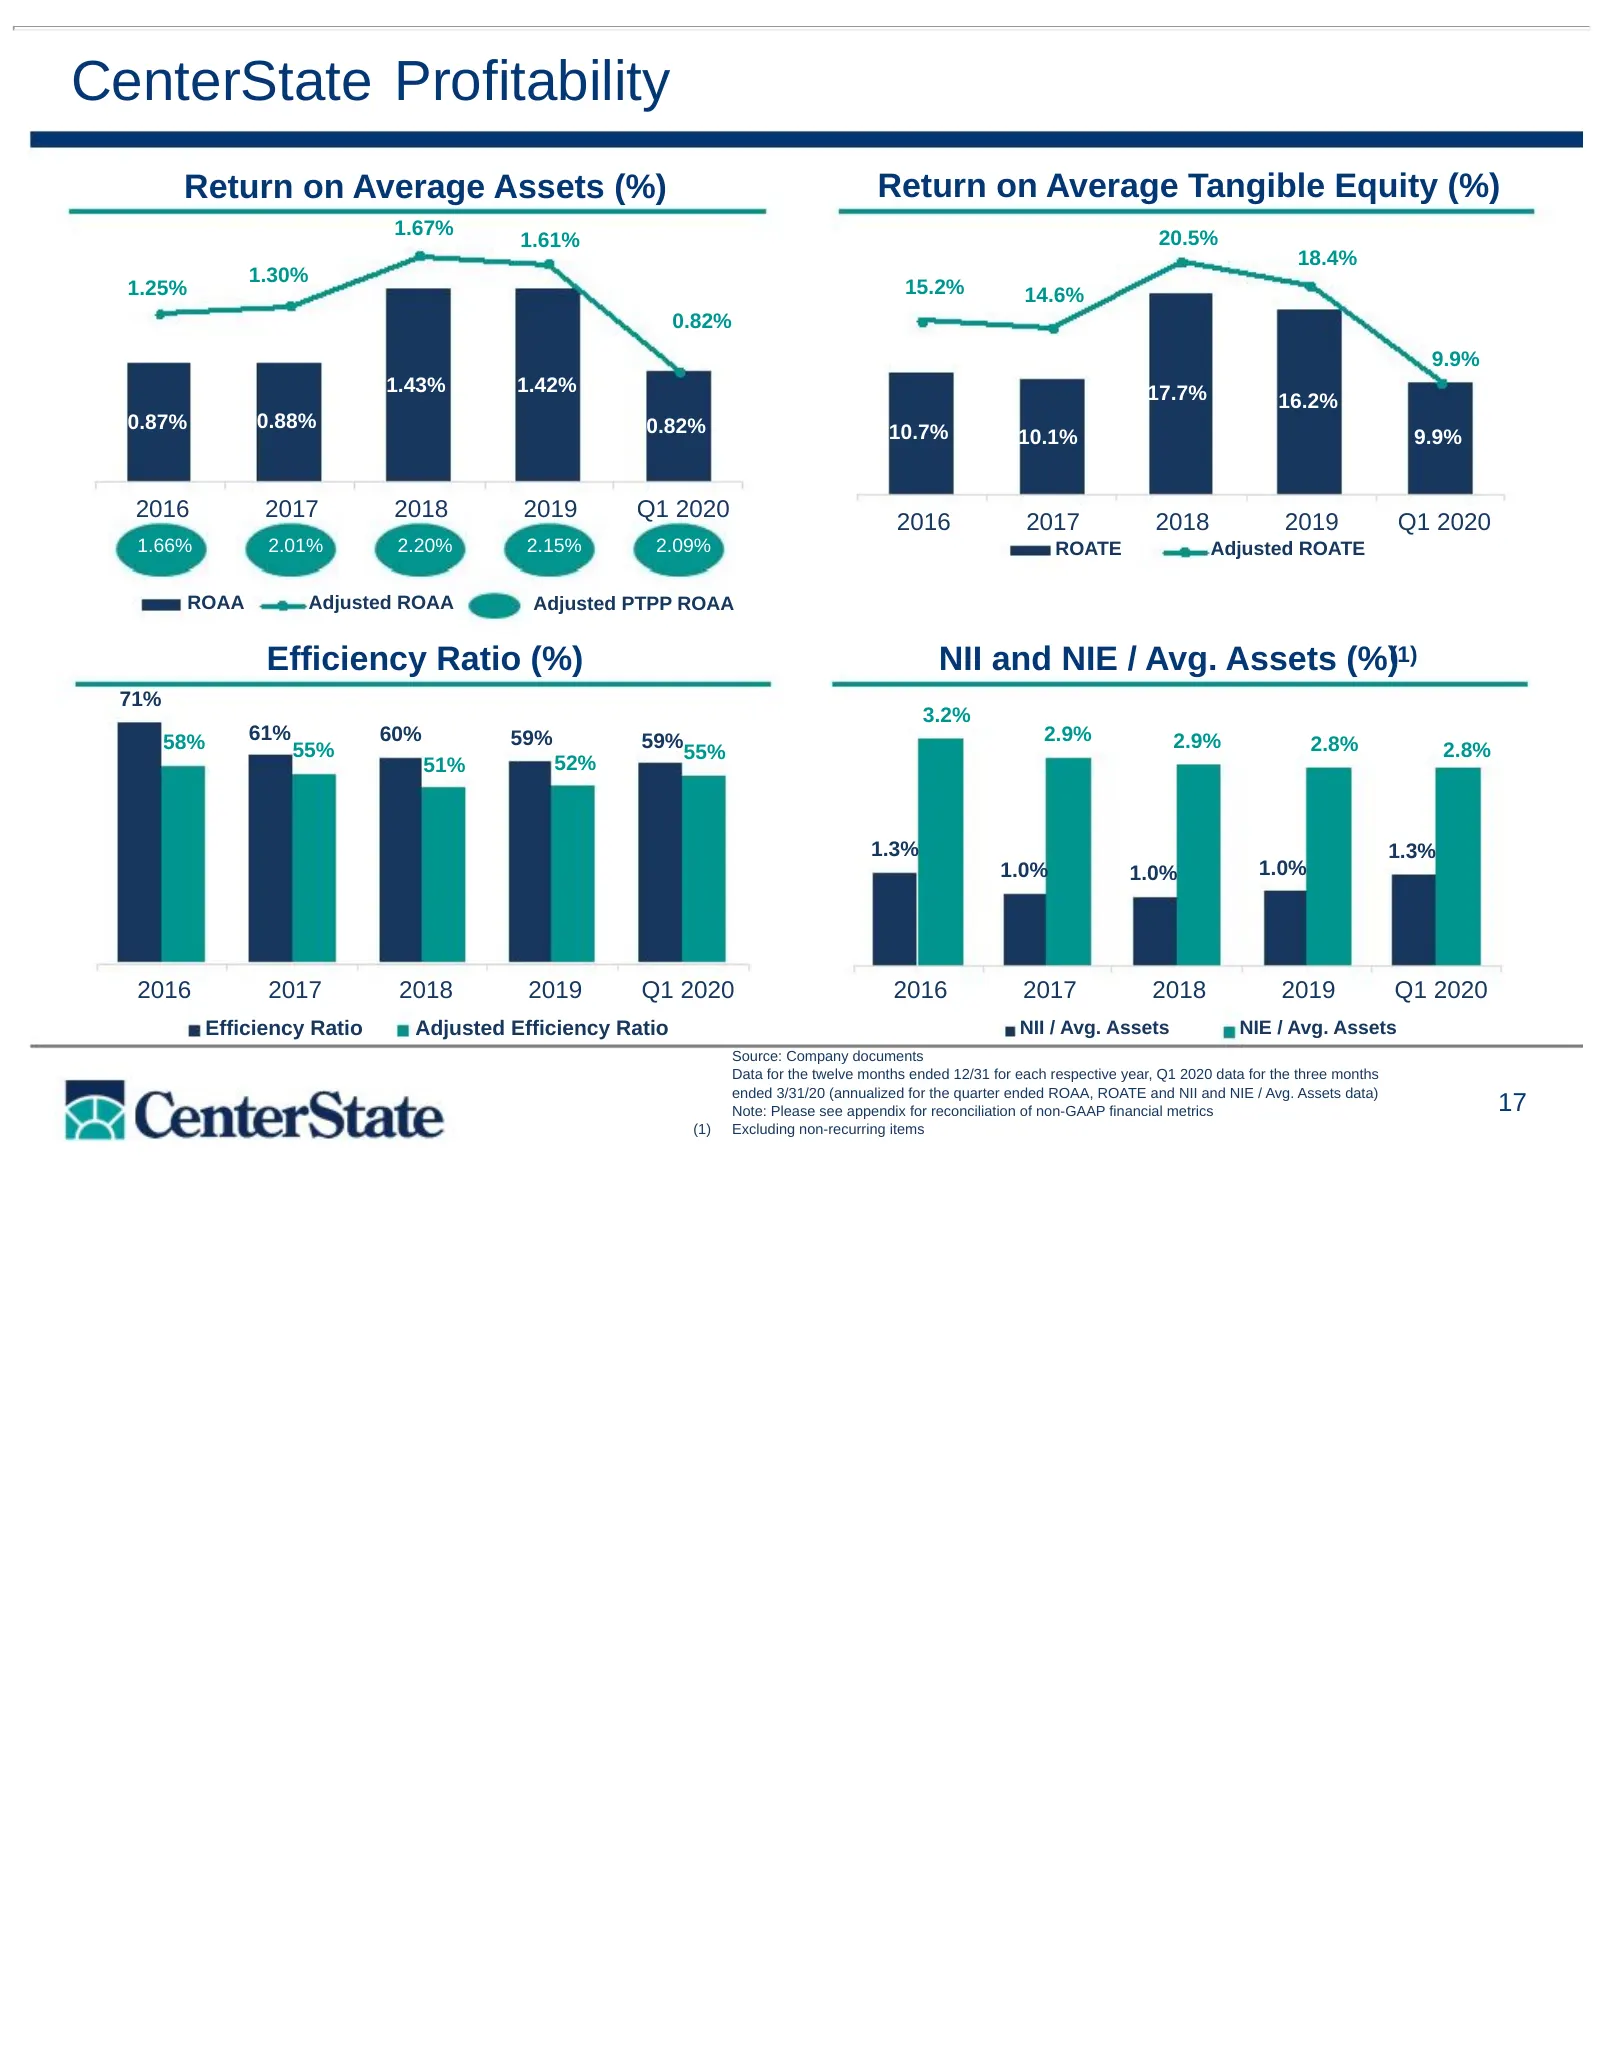
CenterState Profitability Return on Average Assets (%) Return on Average Tangible Equity (%) 1.67% 20.5% 1.61% 18.4% 1.30% 1.25% 15.2% 14.6% 0.82% 9.9% 1.43% 1.42% 17.7% 16.2% 0.87% 0.88% 0.82% 10.7% 10.1% 9.9% 2016 2017 2018 2019 Q1 2020 2016 2017 2018 2019 Q1 2020 1.66% 2.01% 2.20% 2.15% 2.09% ROA
Slide 18: South State Profitability
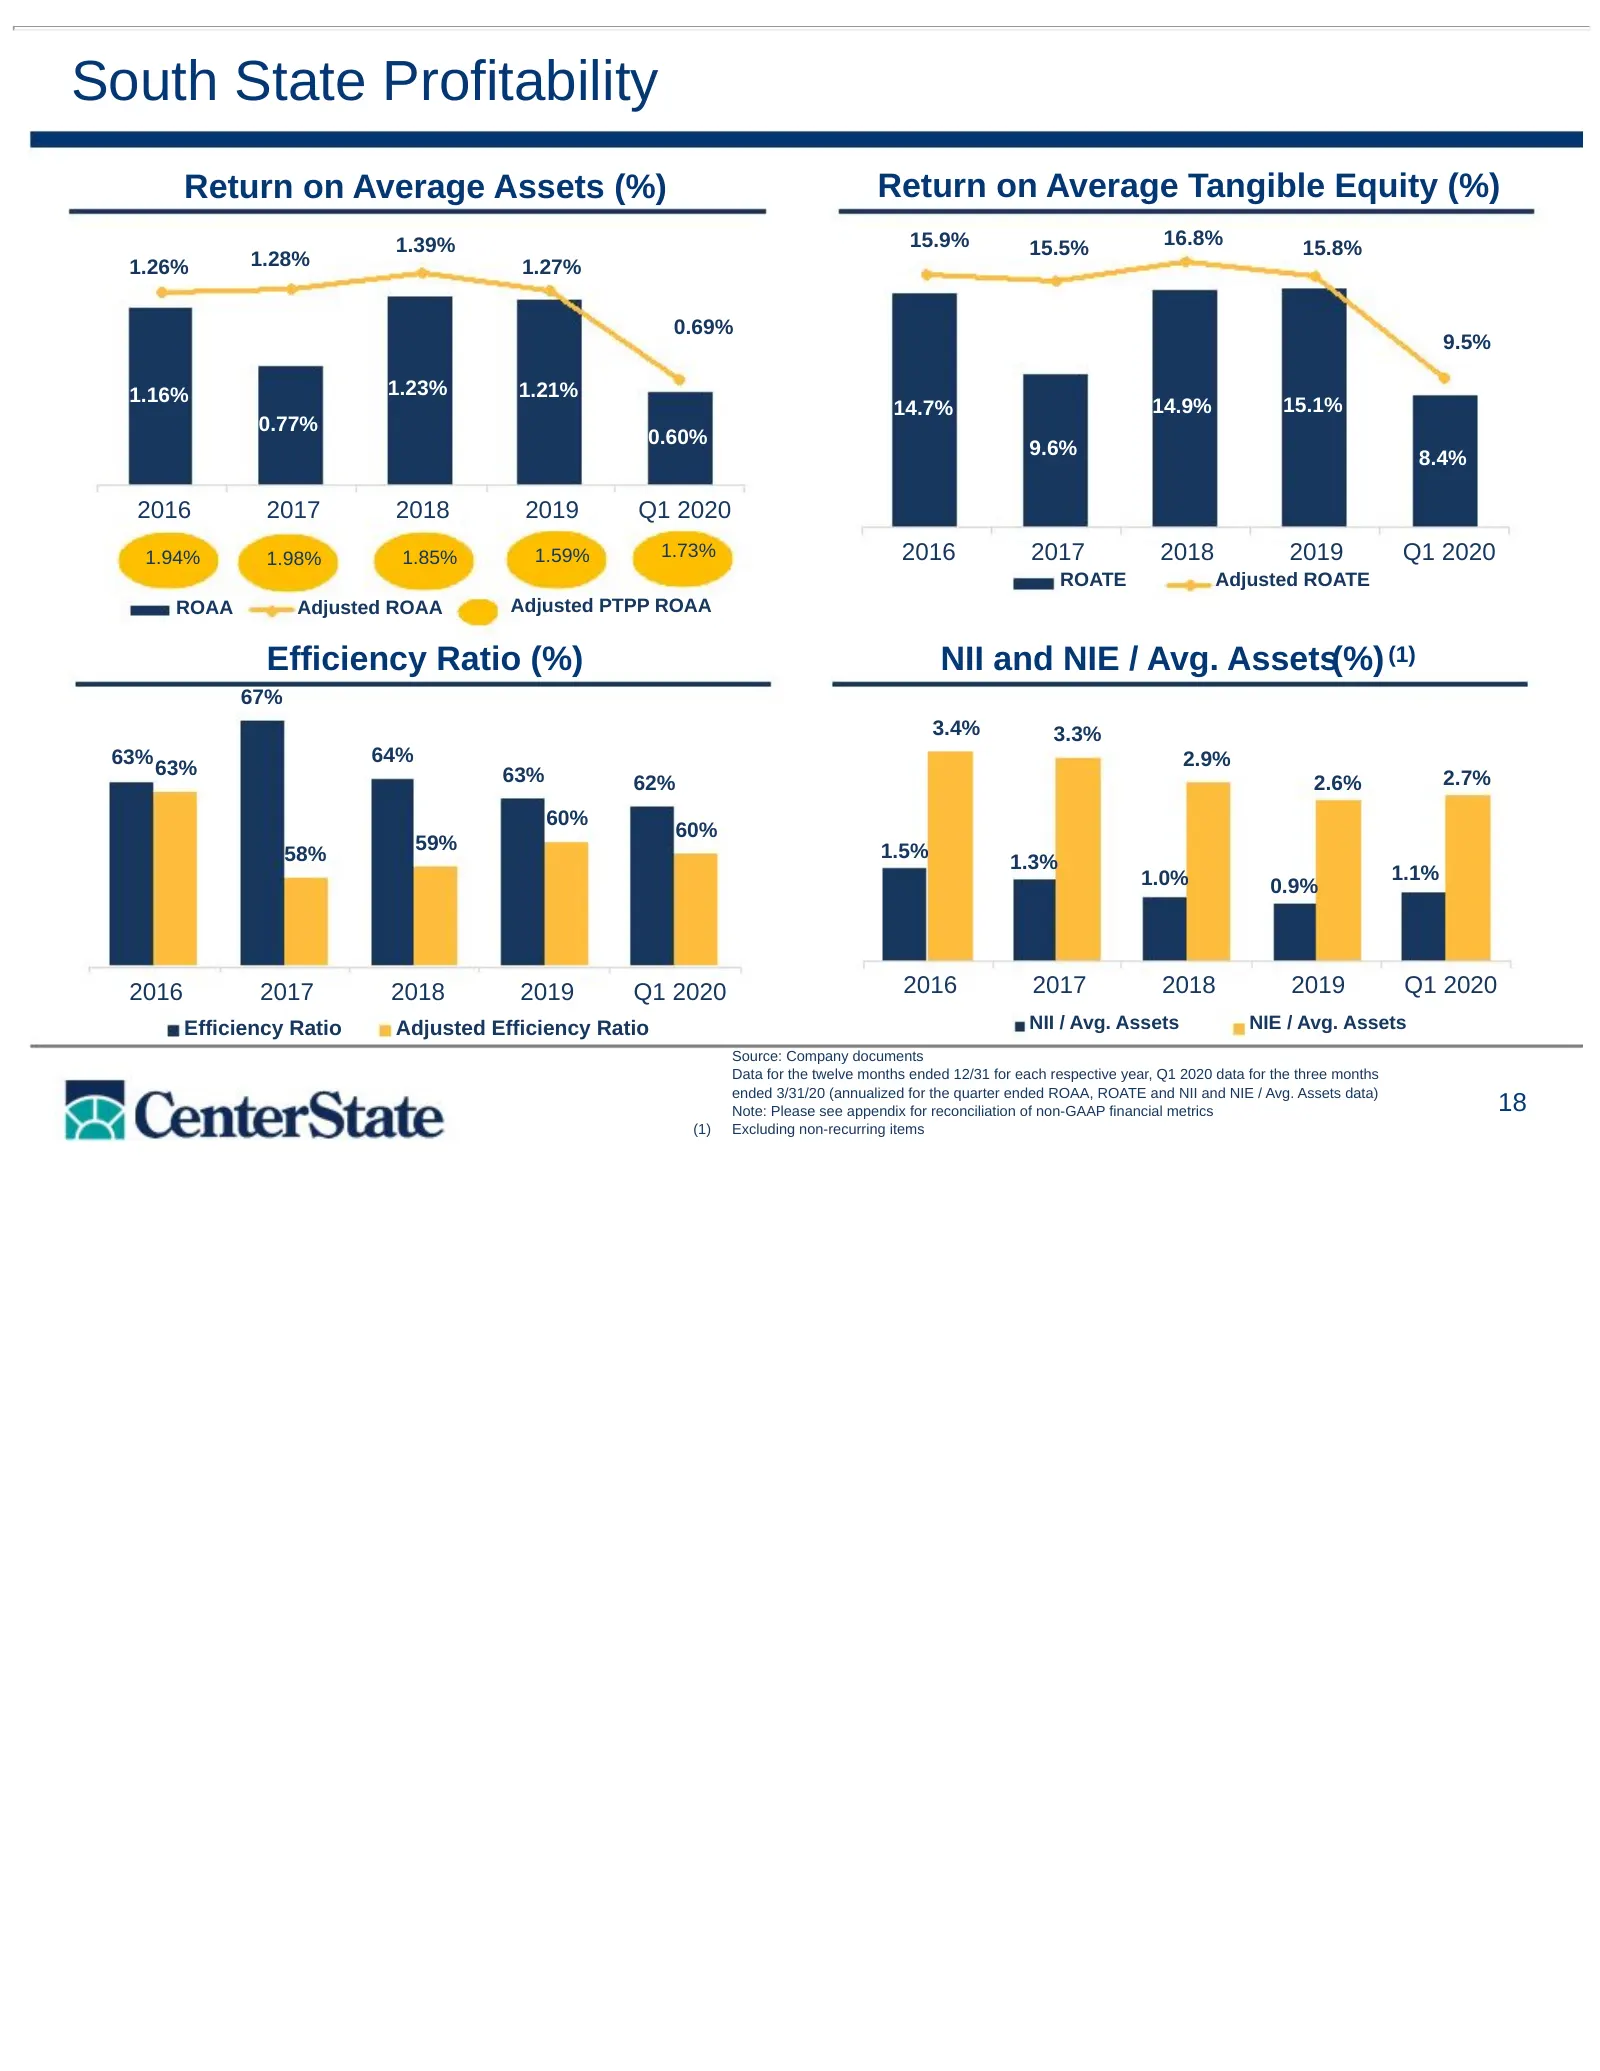
South State Profitability Return on Average Assets (%) Return on Average Tangible Equity (%) 1.39% 15.9% 15.5% 16.8% 15.8% 1.26% 1.28% 1.27% 0.69% 9.5% 1.16% 1.23% 1.21% 14.7% 14.9% 15.1% 0.77% 0.60% 9.6% 8.4% 2016 2017 2018 2019 Q1 2020 1.94% 1.98% 1.85% 1.59% 1.73% 2016 2017 2018 2019 Q1 2020 ROAT
Slide 19: Net Interest Margin
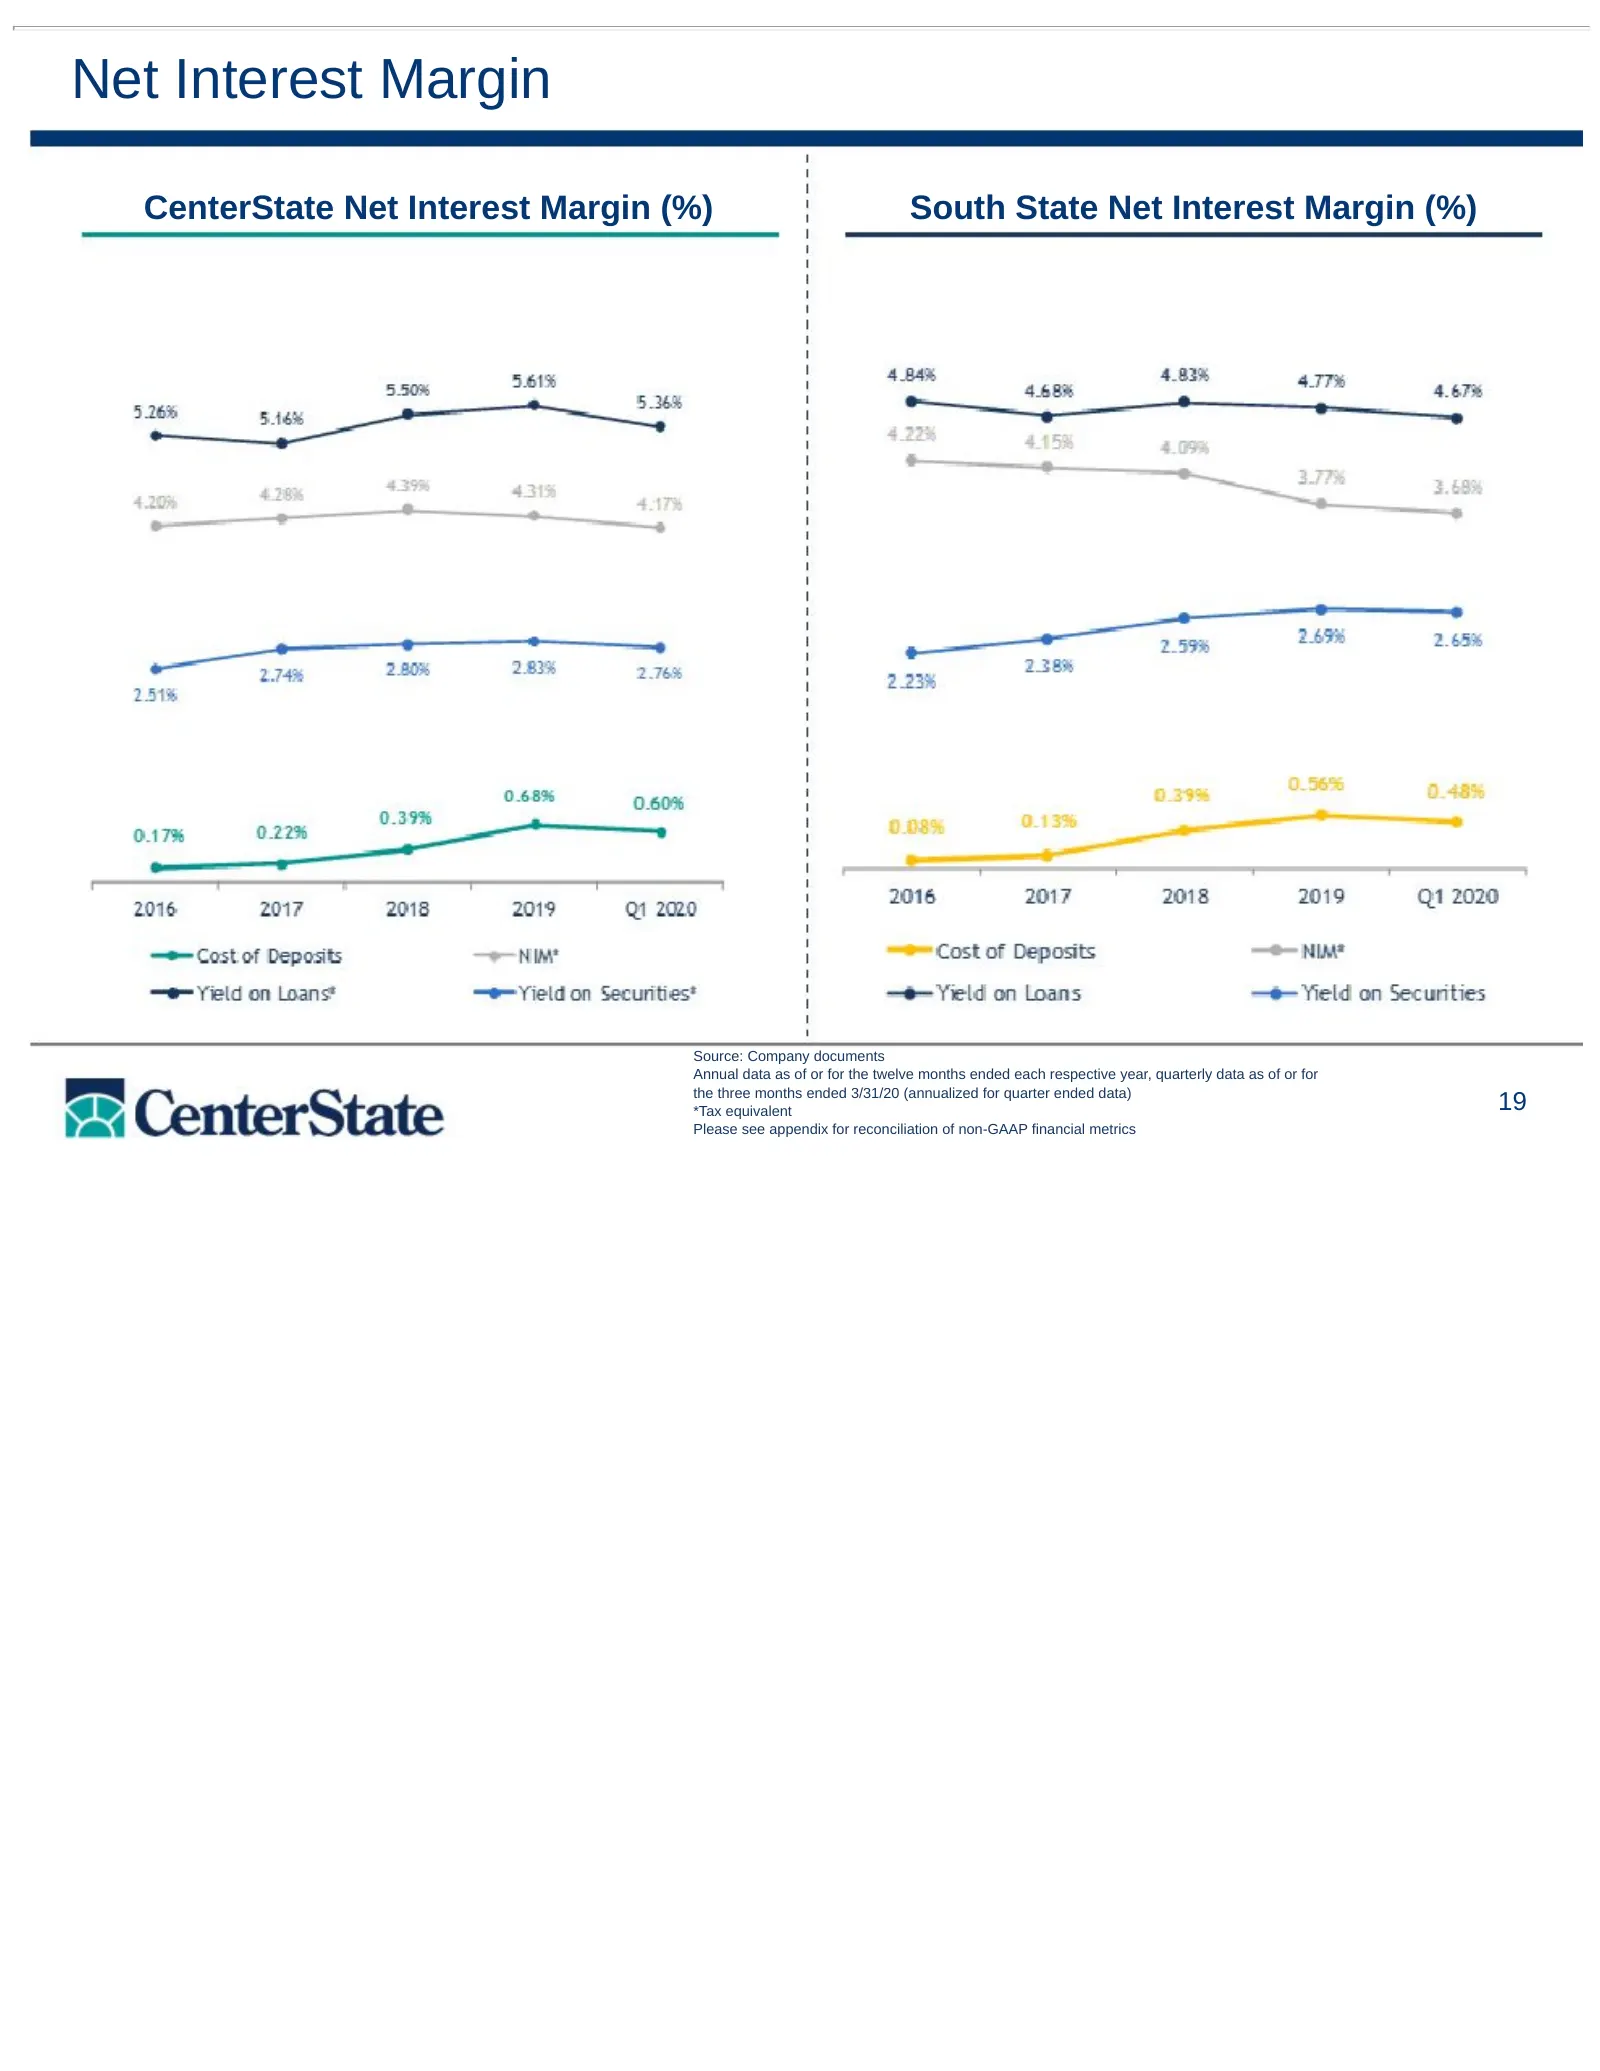
Net Interest Margin CenterState Net Interest Margin (%) South State Net Interest Margin (%) Source: Company documents Annual data as of or for the twelve months ended each respective year, quarterly data as of or for the three months ended 3/31/20 (annualized for quarter ended data) *Tax equivalent
Slide 20: Diversified Revenue Streams
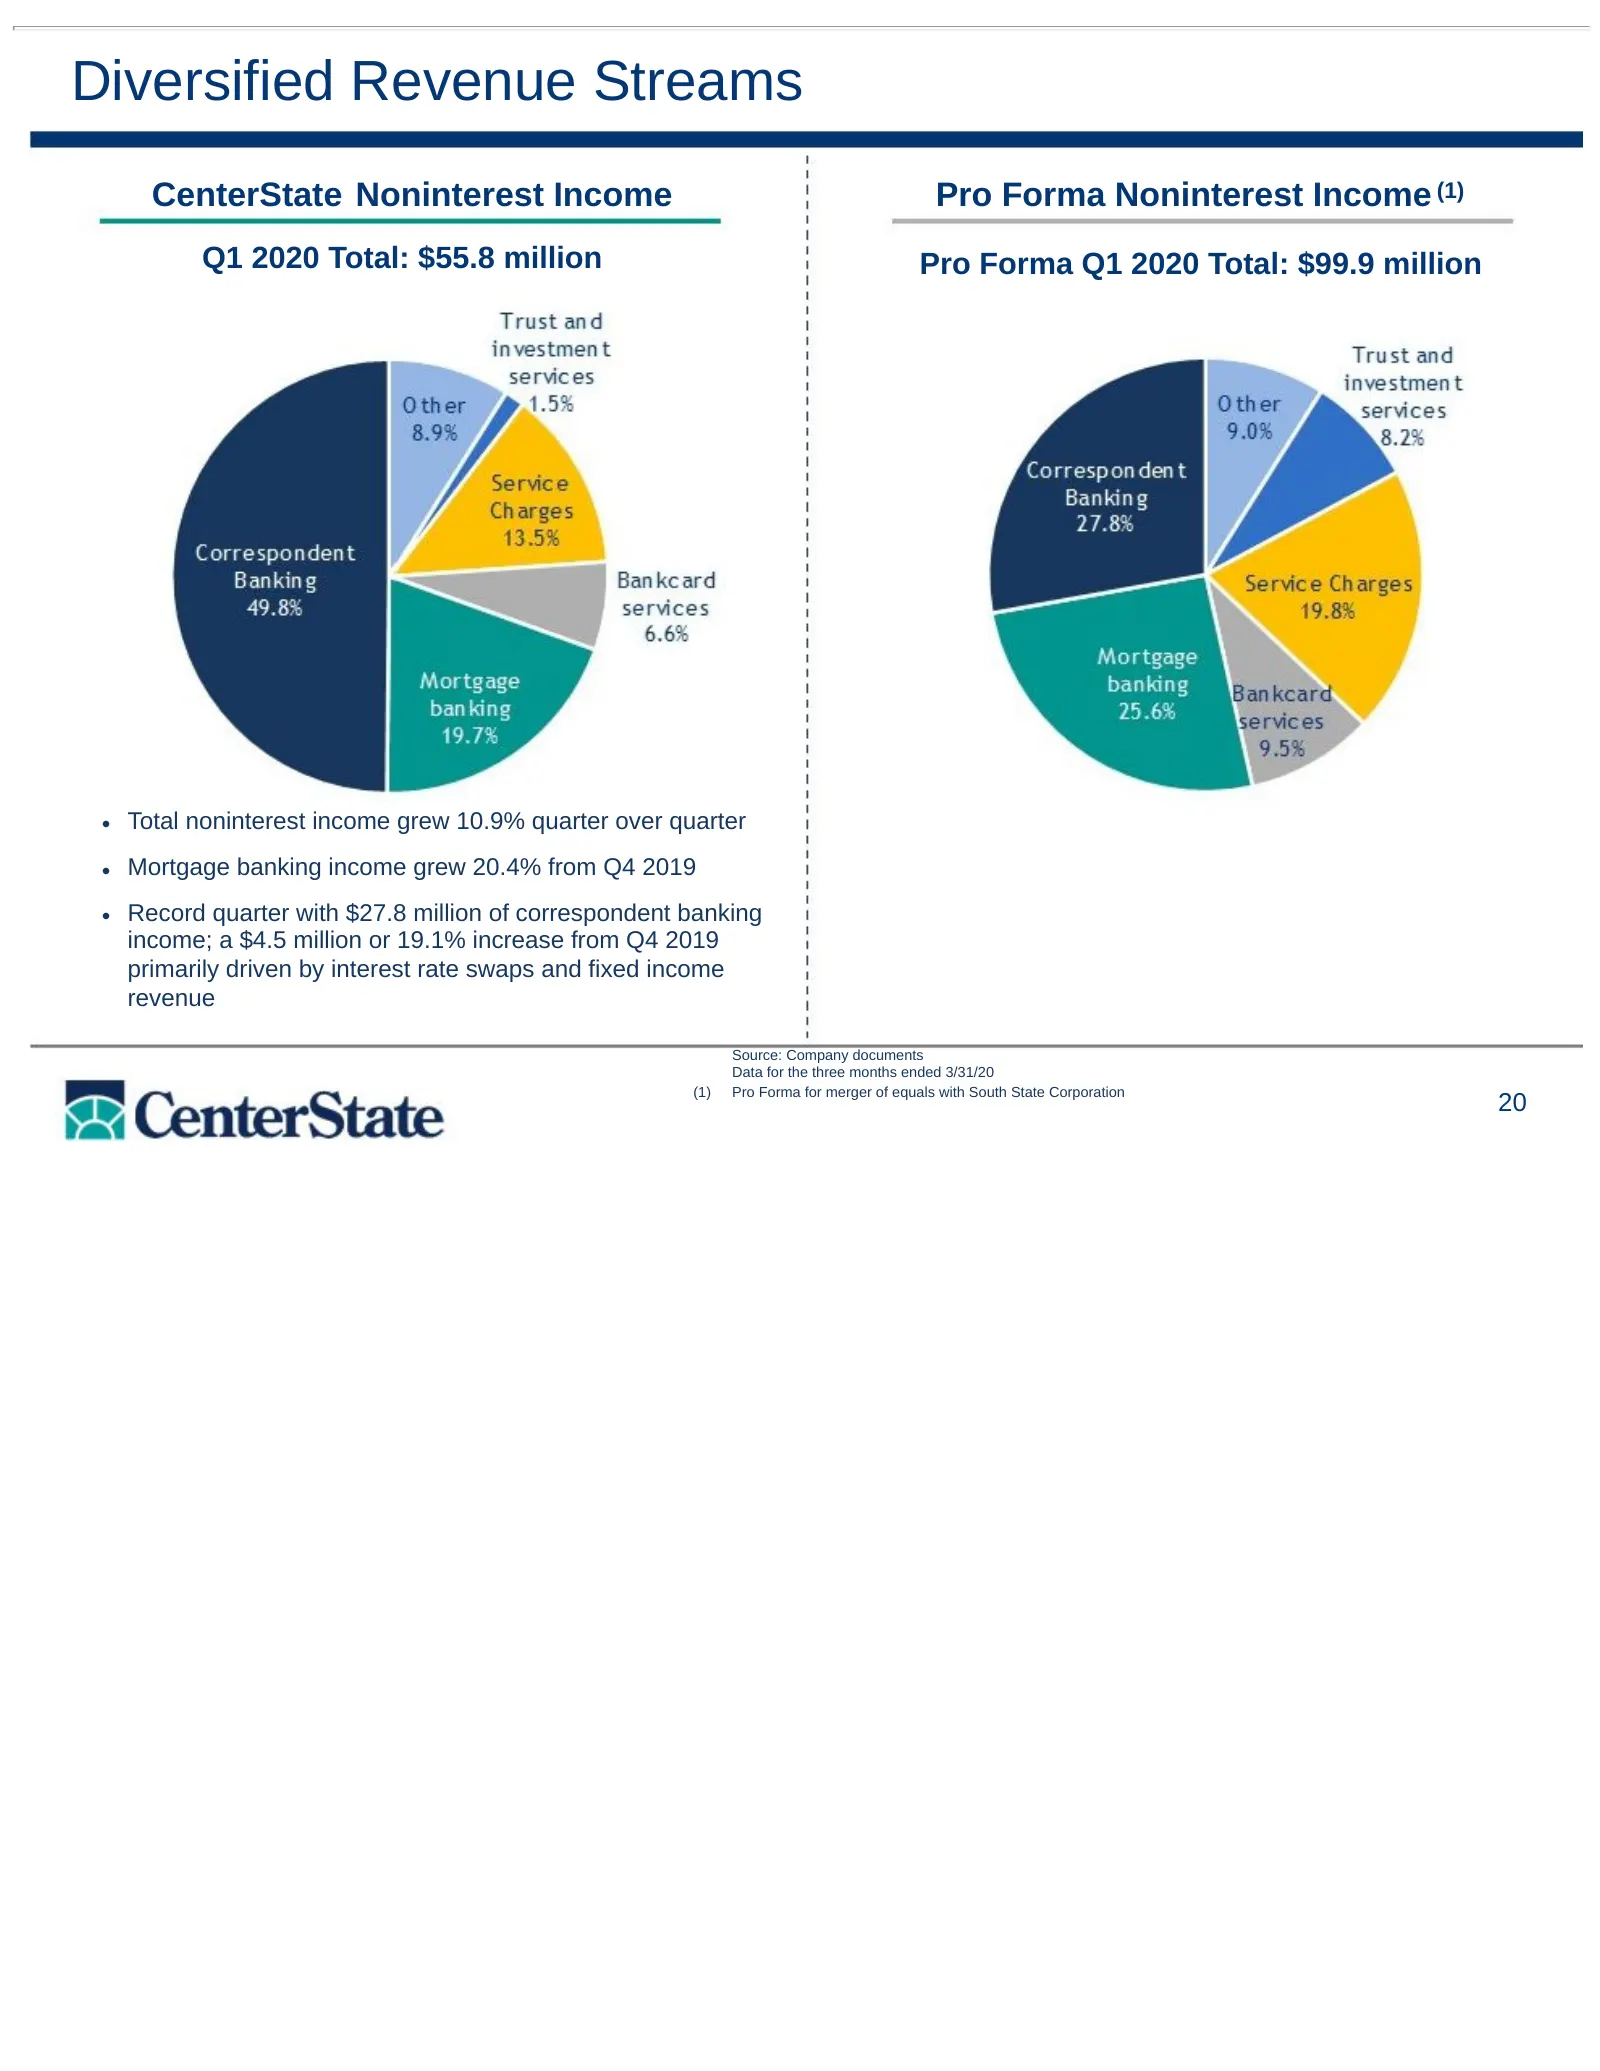
Diversified Revenue Streams CenterState Noninterest Income Pro Forma Noninterest Income (1) Q1 2020 Total: $55.8 million Pro Forma Q1 2020 Total: $99.9 million • Total noninterest income grew 10.9% quarter over quarter • Mortgage banking income grew 20.4% from Q4 2019 • Record quarter with $27.8 mil
Slide 21: Deposit Portfolio
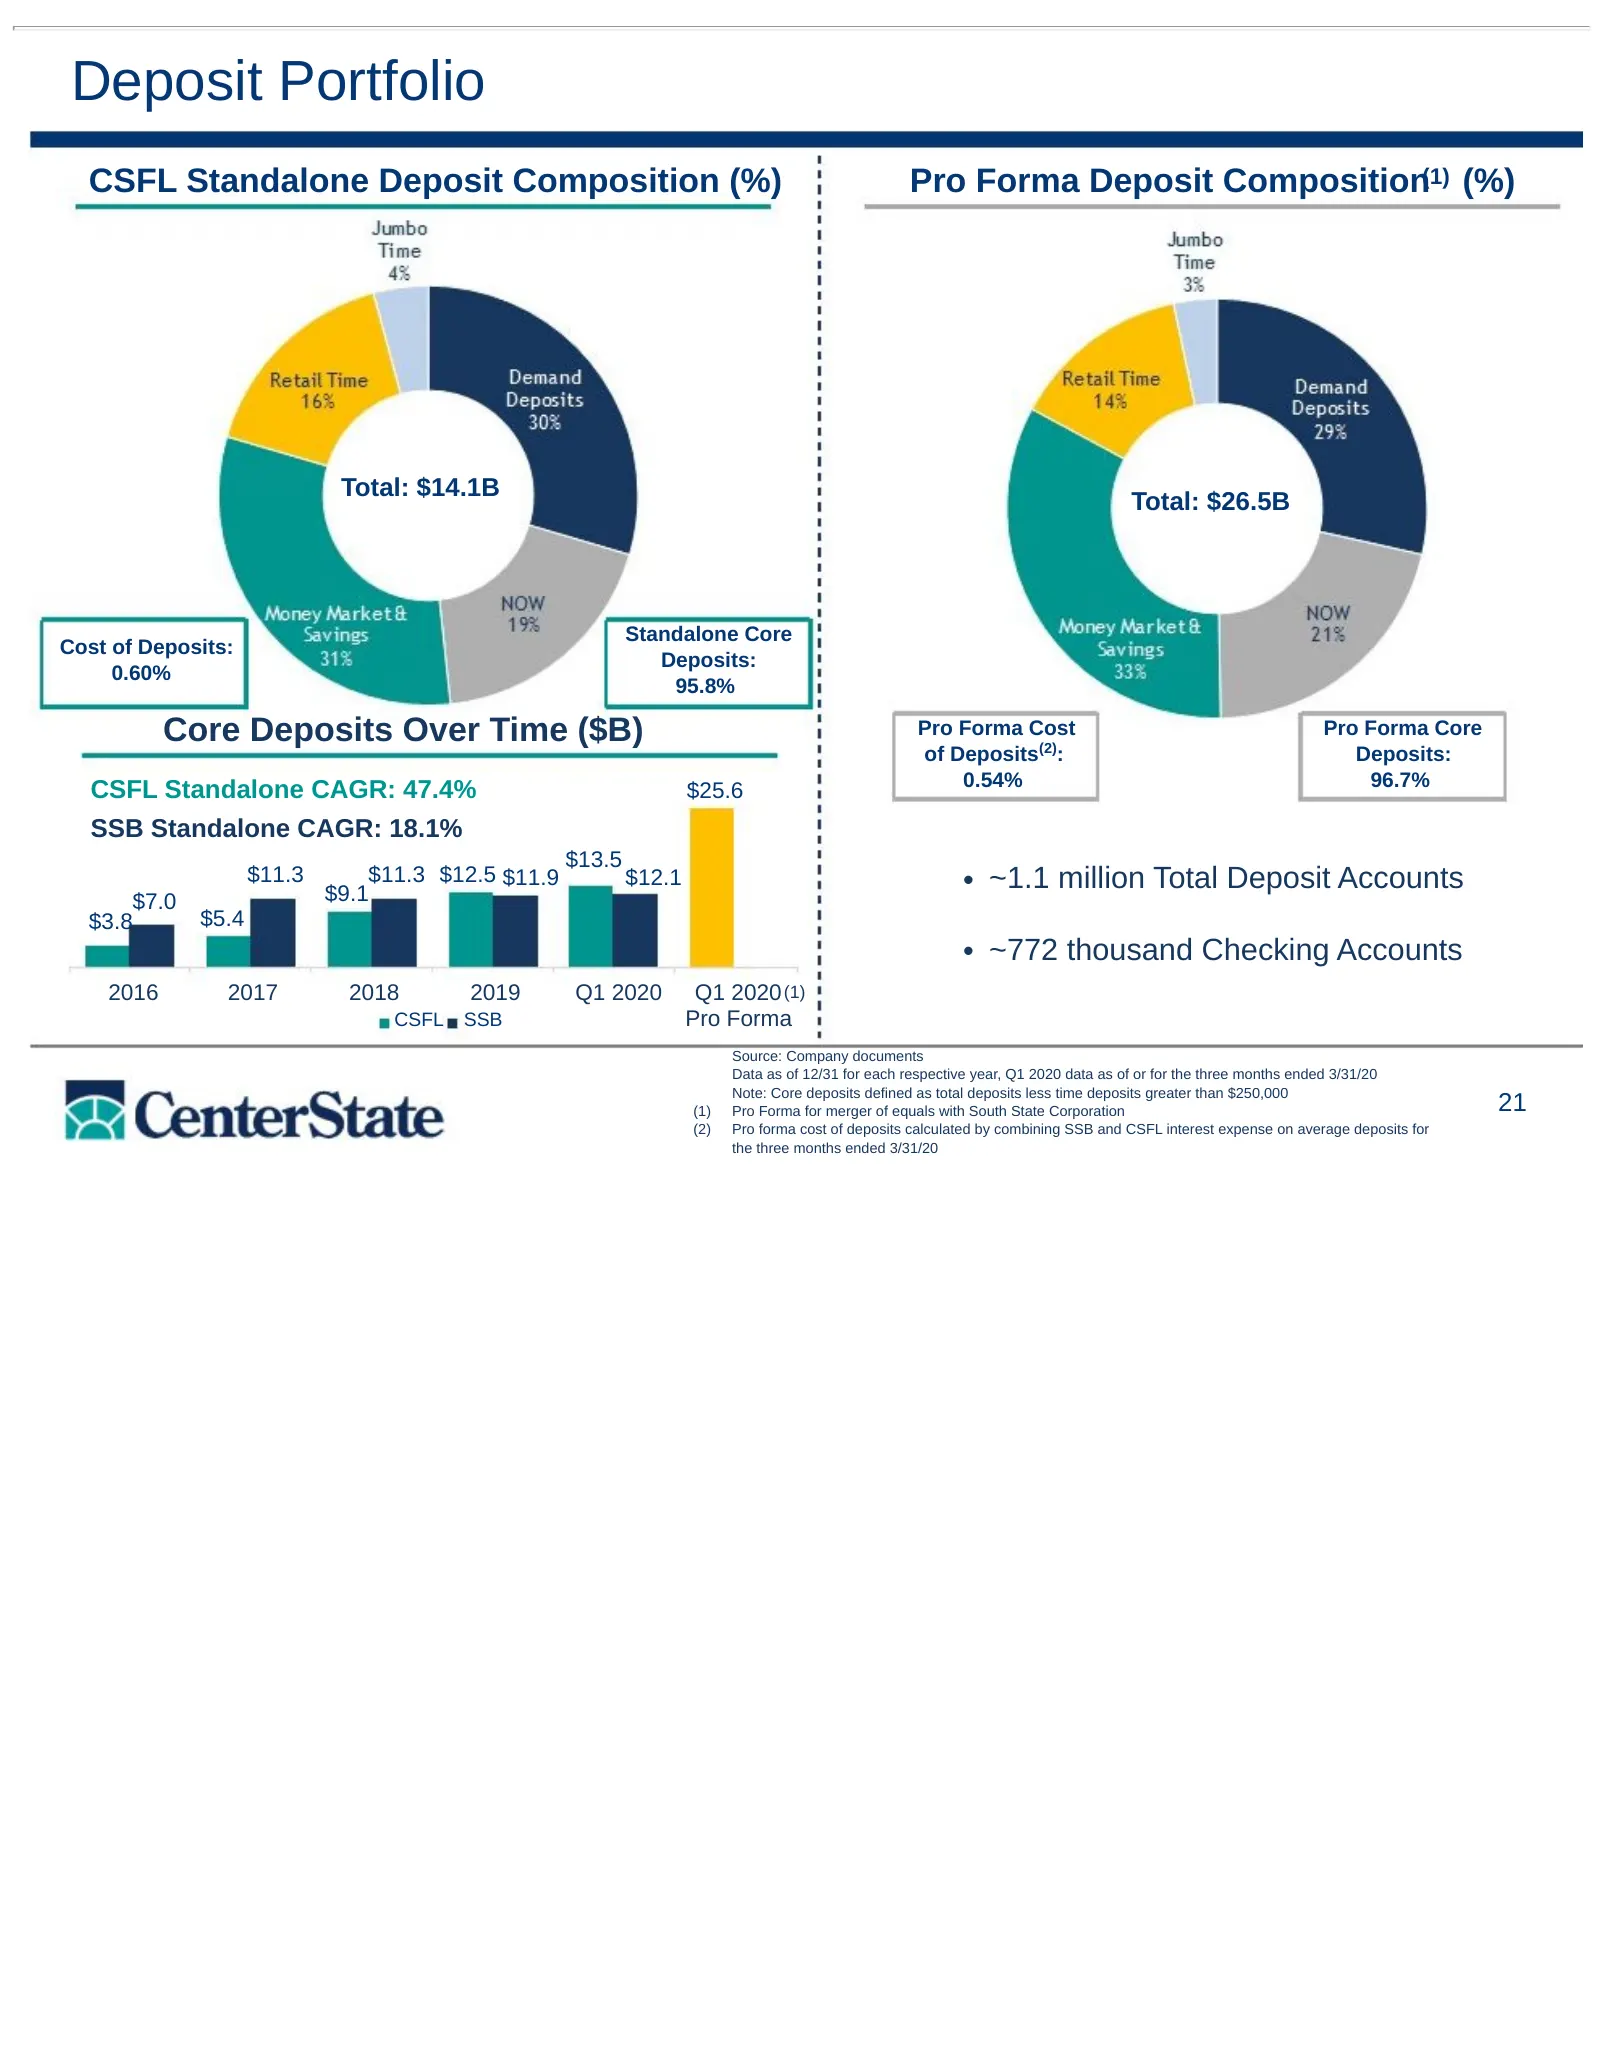
Deposit Portfolio CSFL Standalone Deposit Composition (%) Pro Forma Deposit Composition(1) (%) Total: $14.1B Total: $26.5B Standalone Core Cost of Deposits: Deposits: 0.60% 95.8% Core Deposits Over Time ($B) Pro Forma Cost Pro Forma Core of Deposits(2): Deposits: 0.54% 96.7% CSFL Standalone CAGR: 47
Slide 22: Loan Portfolio
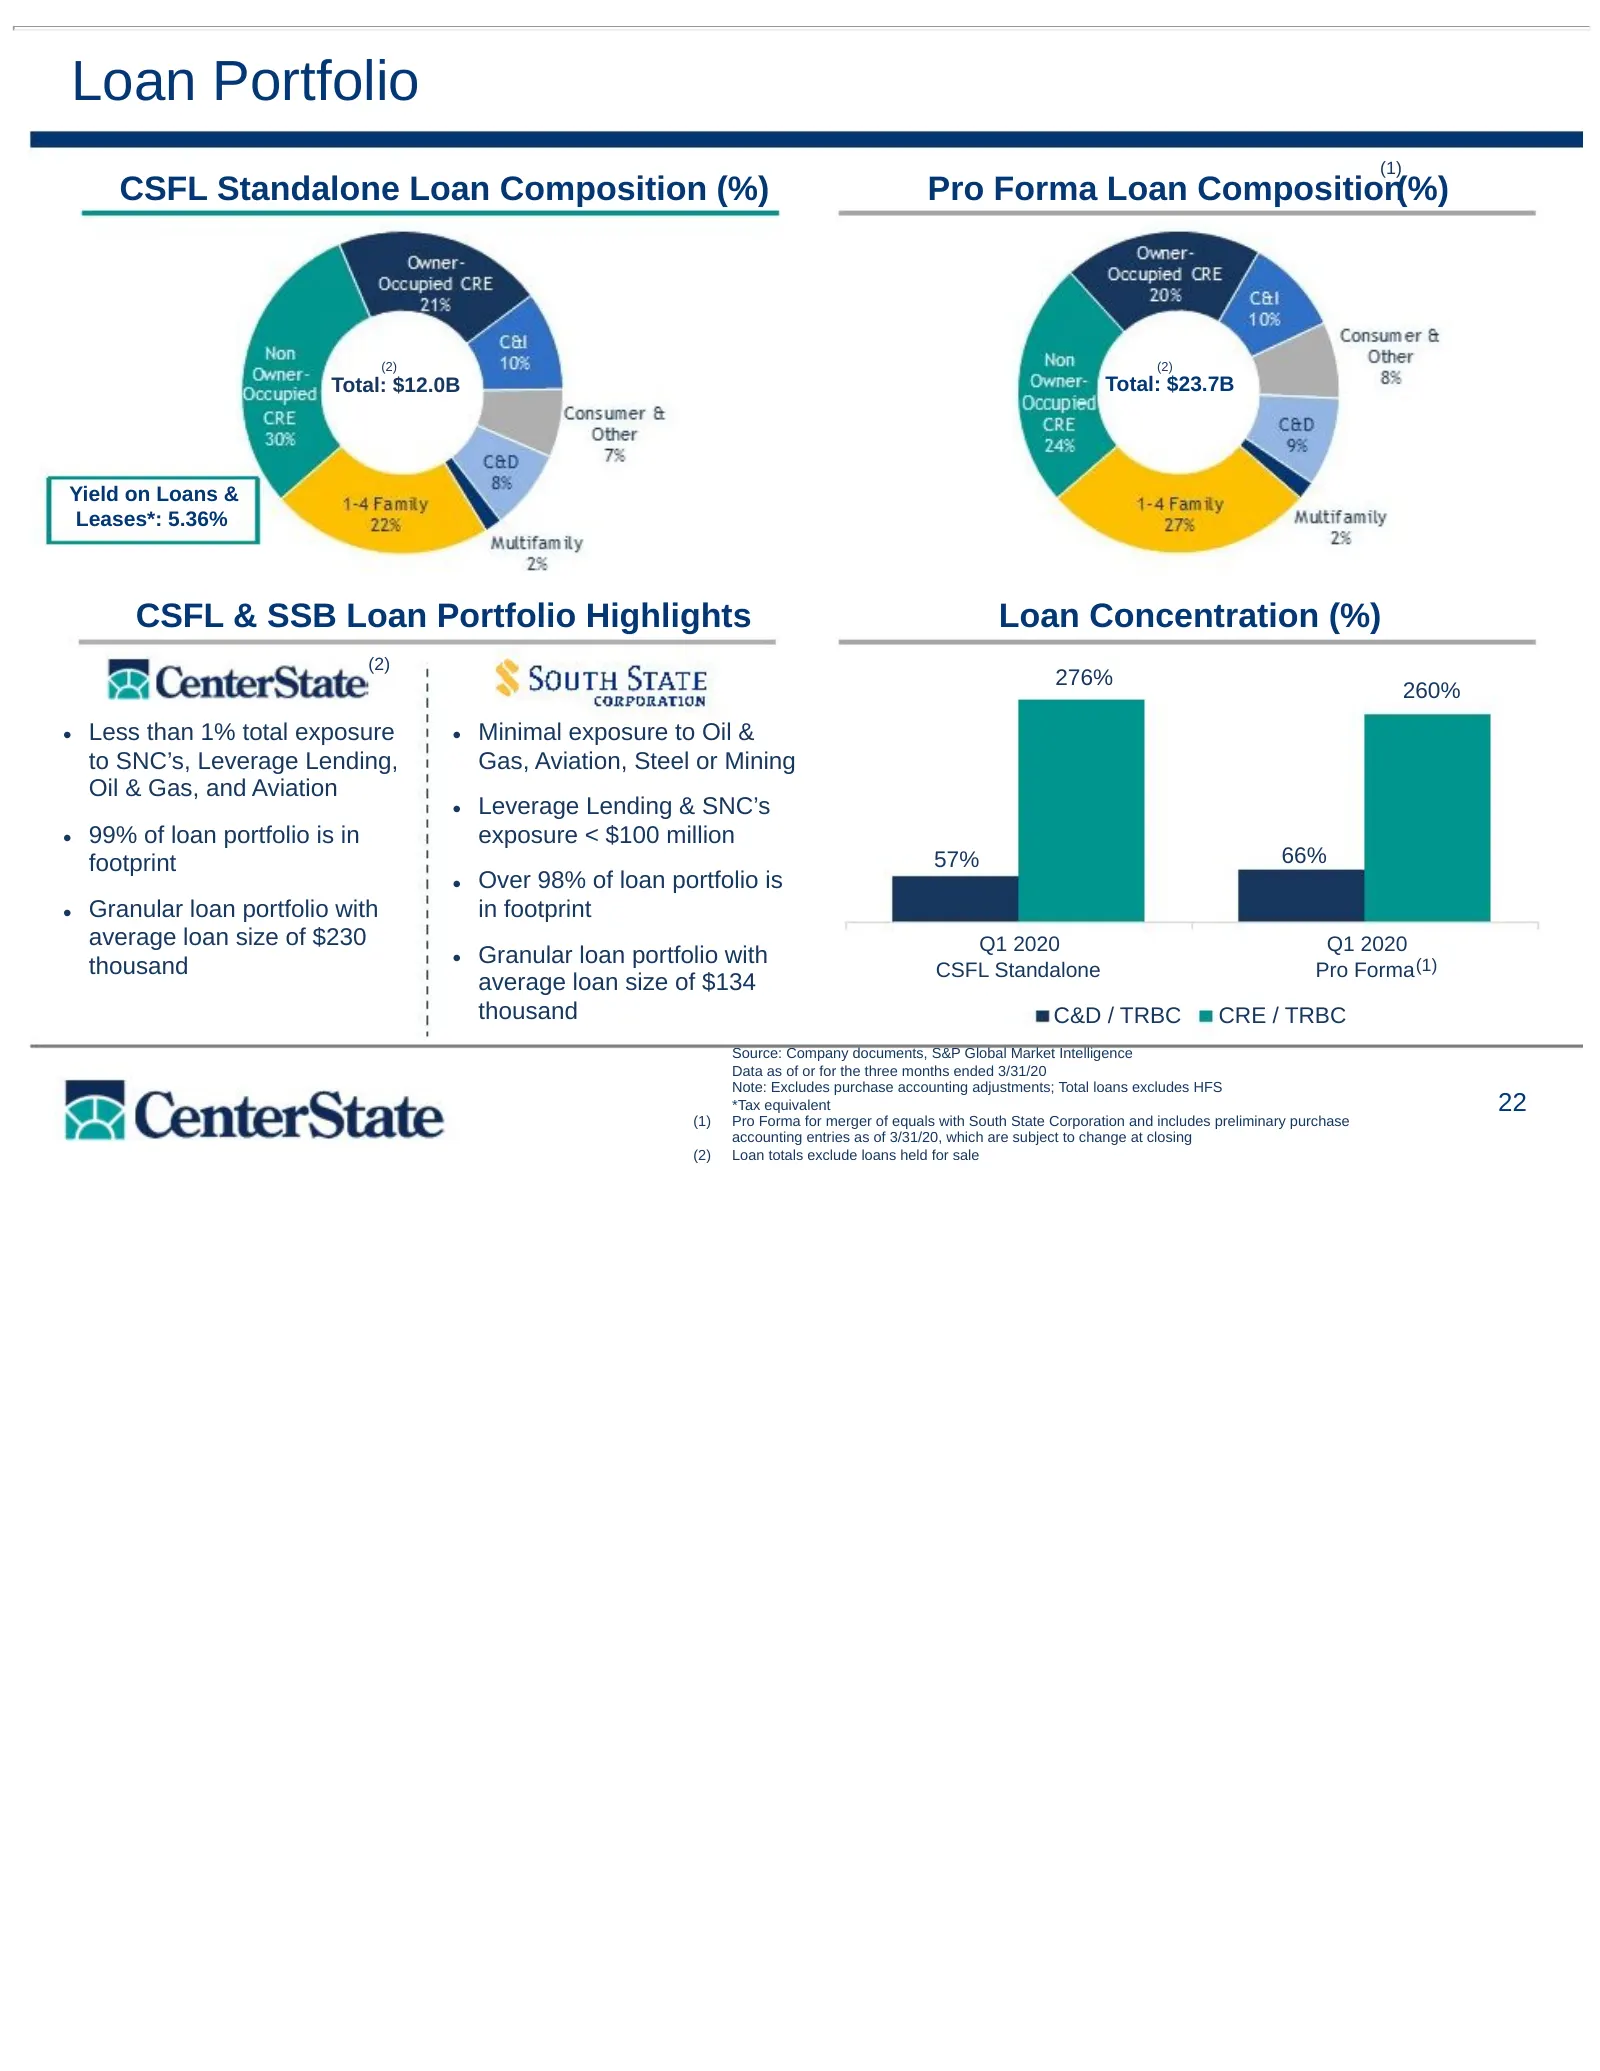
Loan Portfolio (1) CSFL Standalone Loan Composition (%) Pro Forma Loan Composition(%) (2) (2) Total: $12.0B Total: $23.7B Yield on Loans & Leases*: 5.36% CSFL & SSB Loan Portfolio Highlights Loan Concentration (%) (2) 276% 260% • Less than 1% total exposure • Minimal exposure to Oil & to SNC’s, Leve
Slide 23: Industry Exposure
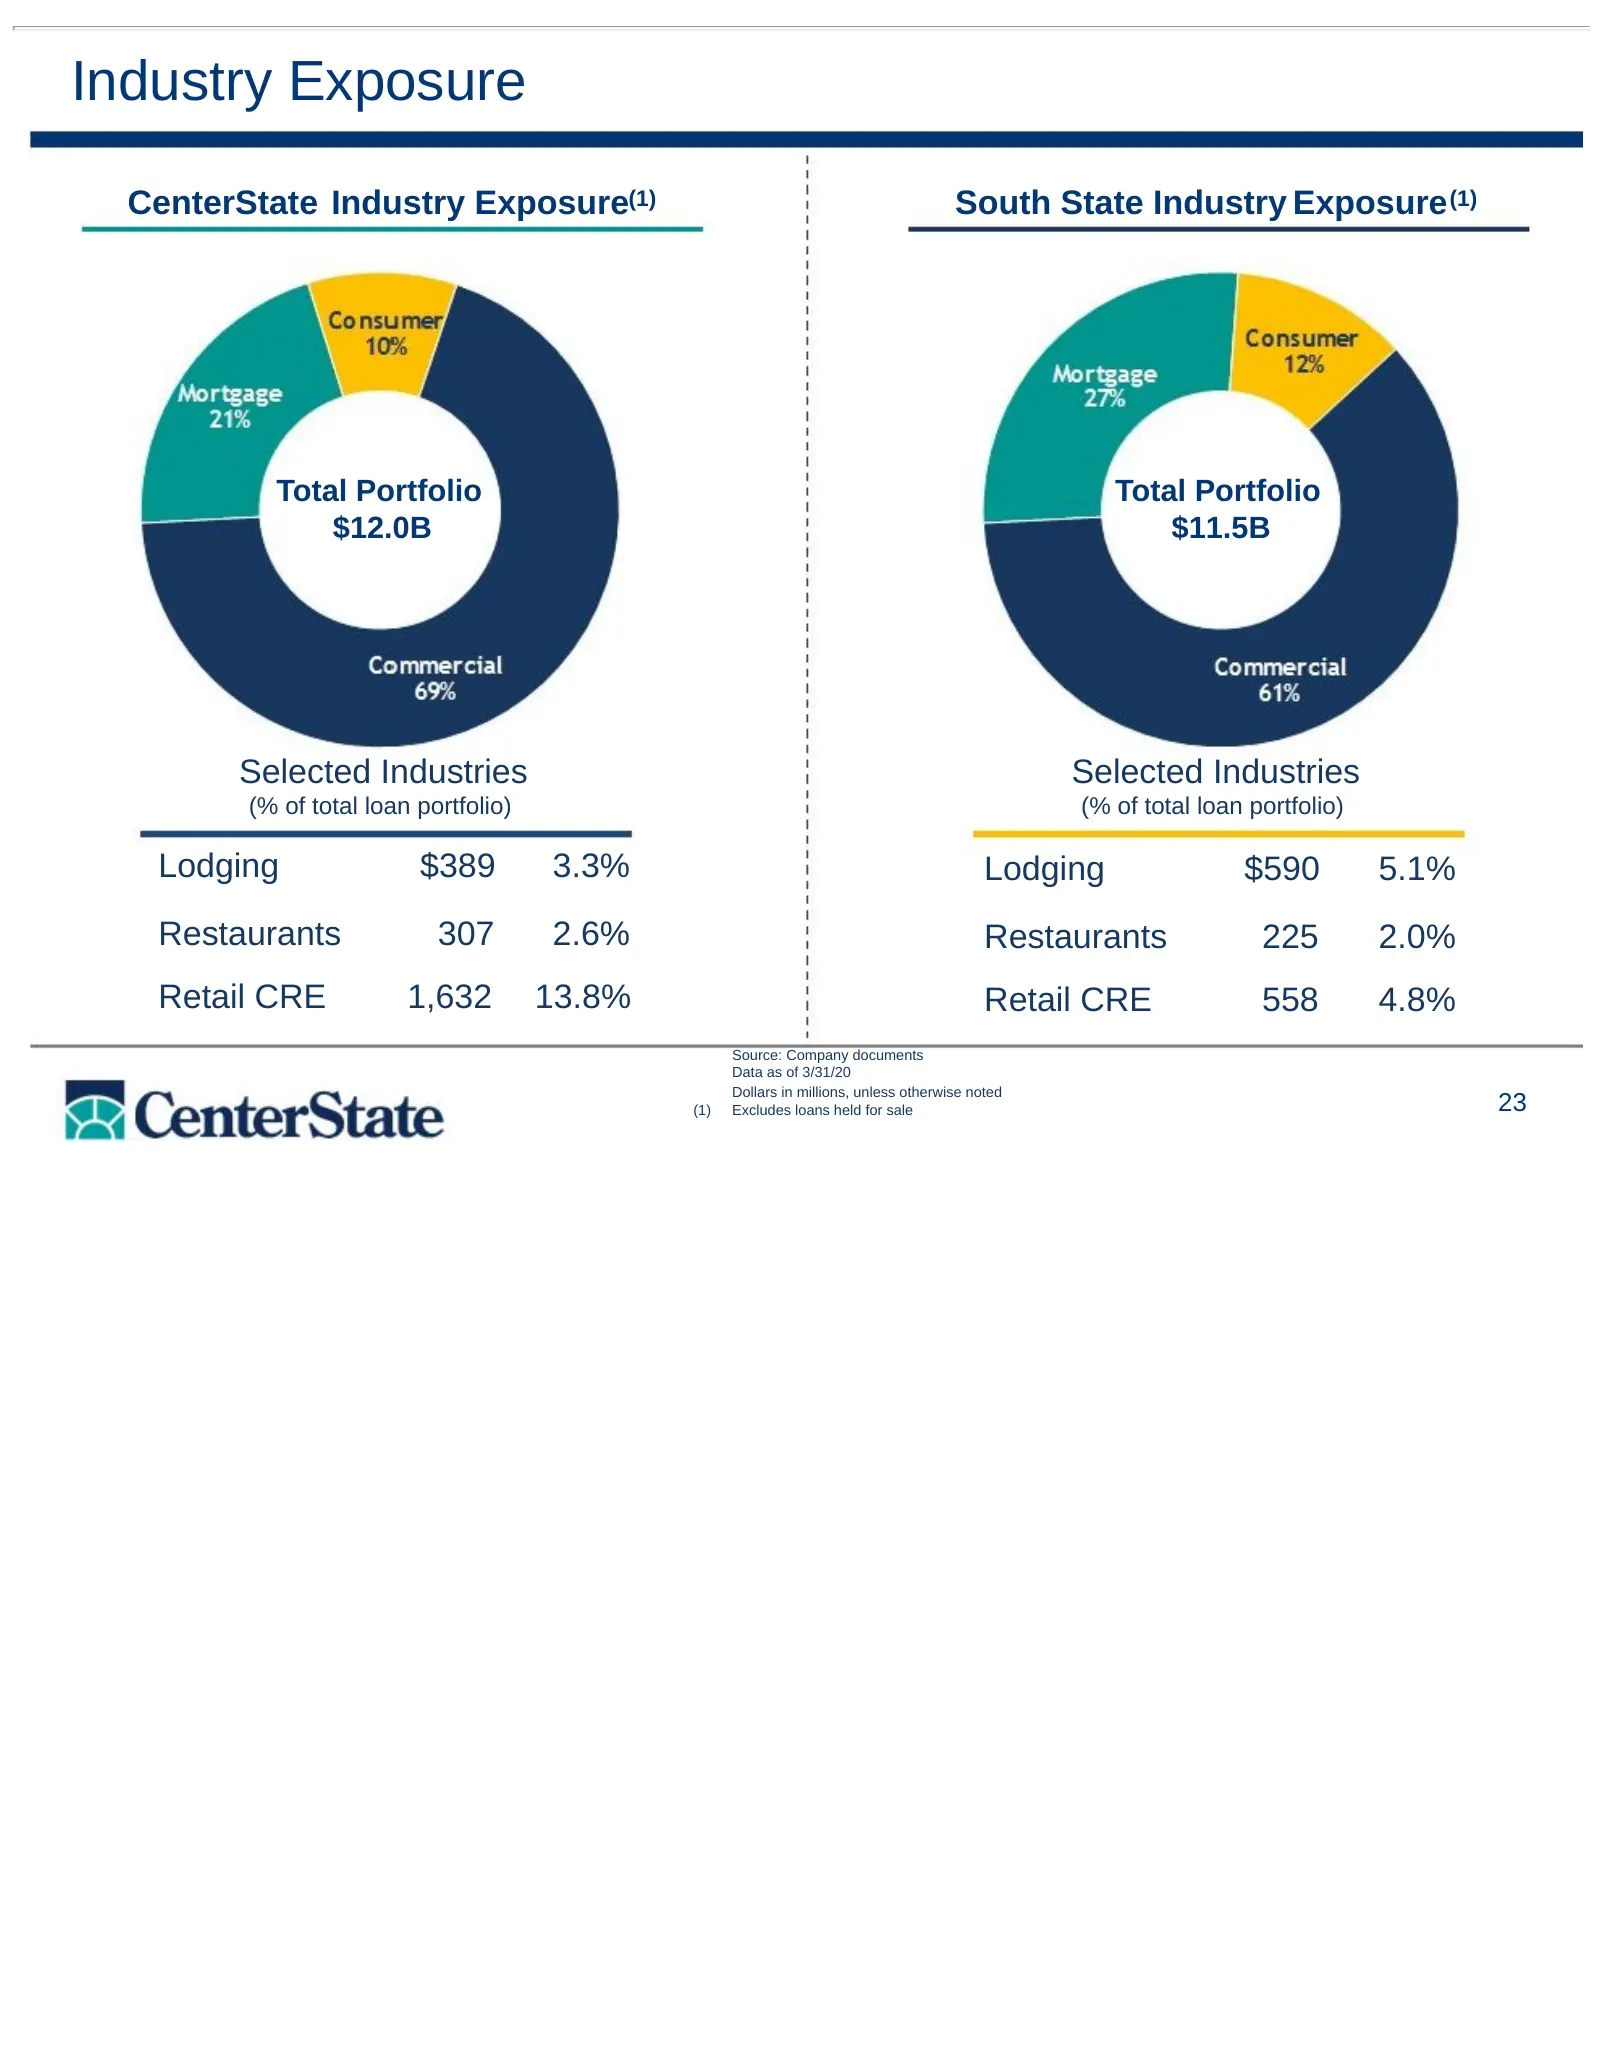
Industry Exposure CenterState Industry Exposure(1) South State Industry Exposure (1) Total Portfolio Total Portfolio $12.0B $11.5B Selected Industries Selected Industries (% of total loan portfolio) (% of total loan portfolio) Lodging $389 3.3% Lodging $590 5.1% Restaurants 307 2.6% Restaurants 225
Slide 24: Loan Deferral Requests
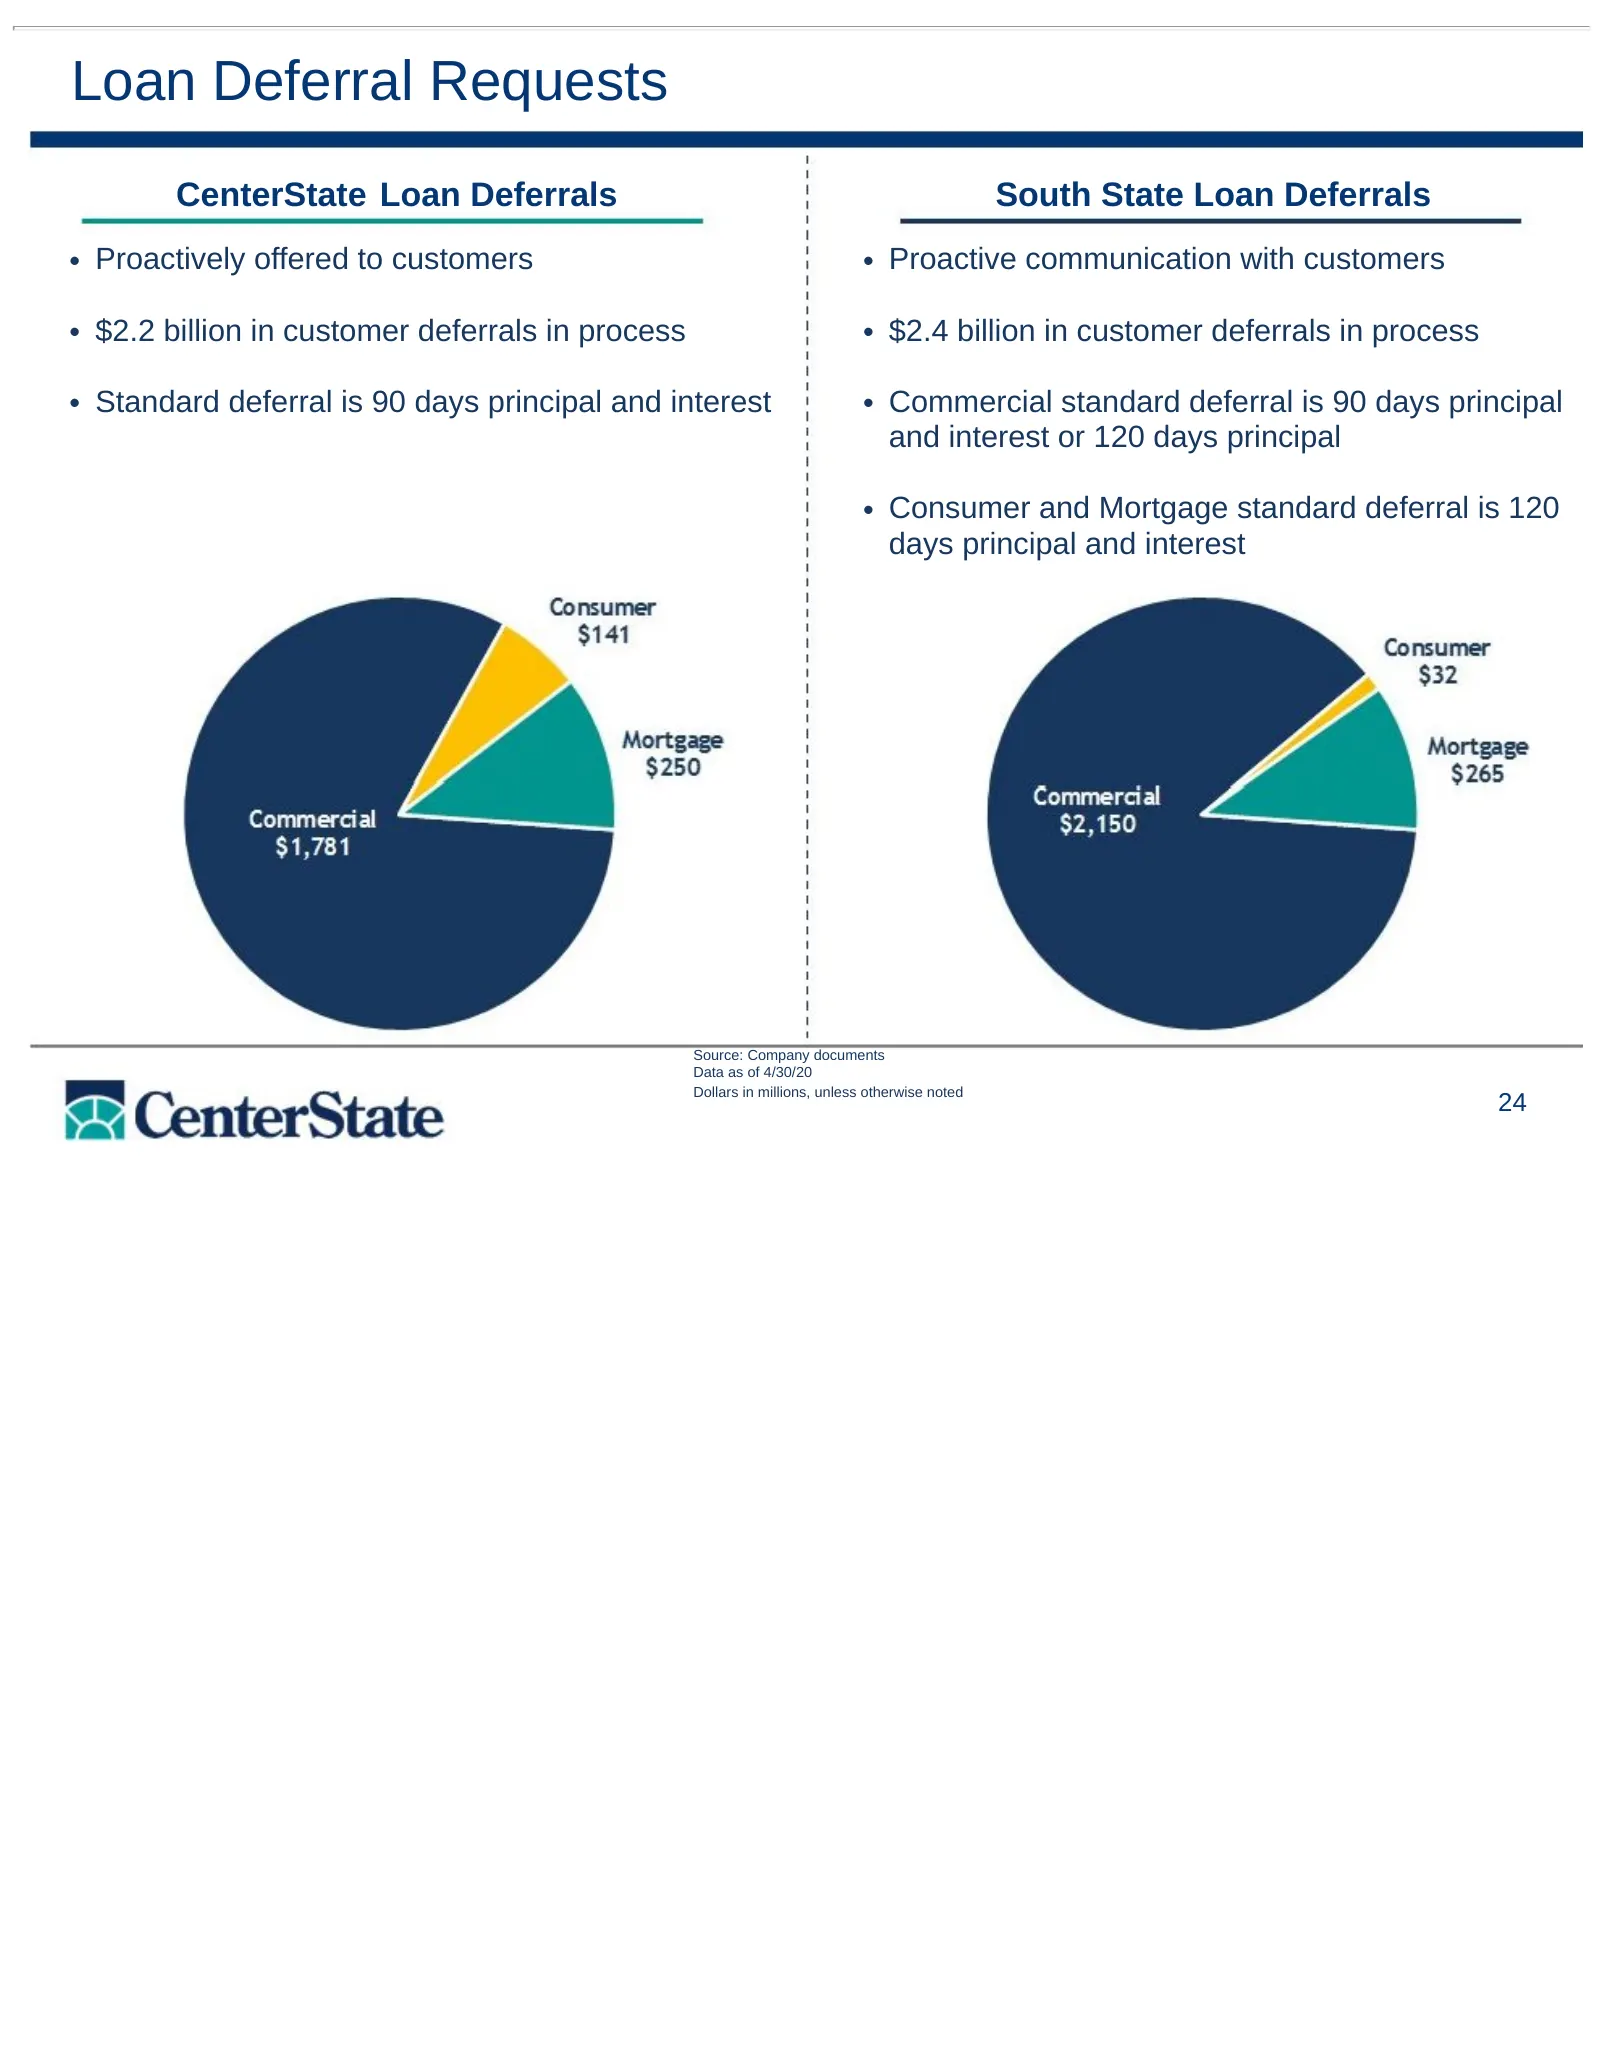
Loan Deferral Requests CenterState Loan Deferrals South State Loan Deferrals • Proactively offered to customers • Proactive communication with customers • $2.2 billion in customer deferrals in process • $2.4 billion in customer deferrals in process • Standard deferral is 90 days principal and intere
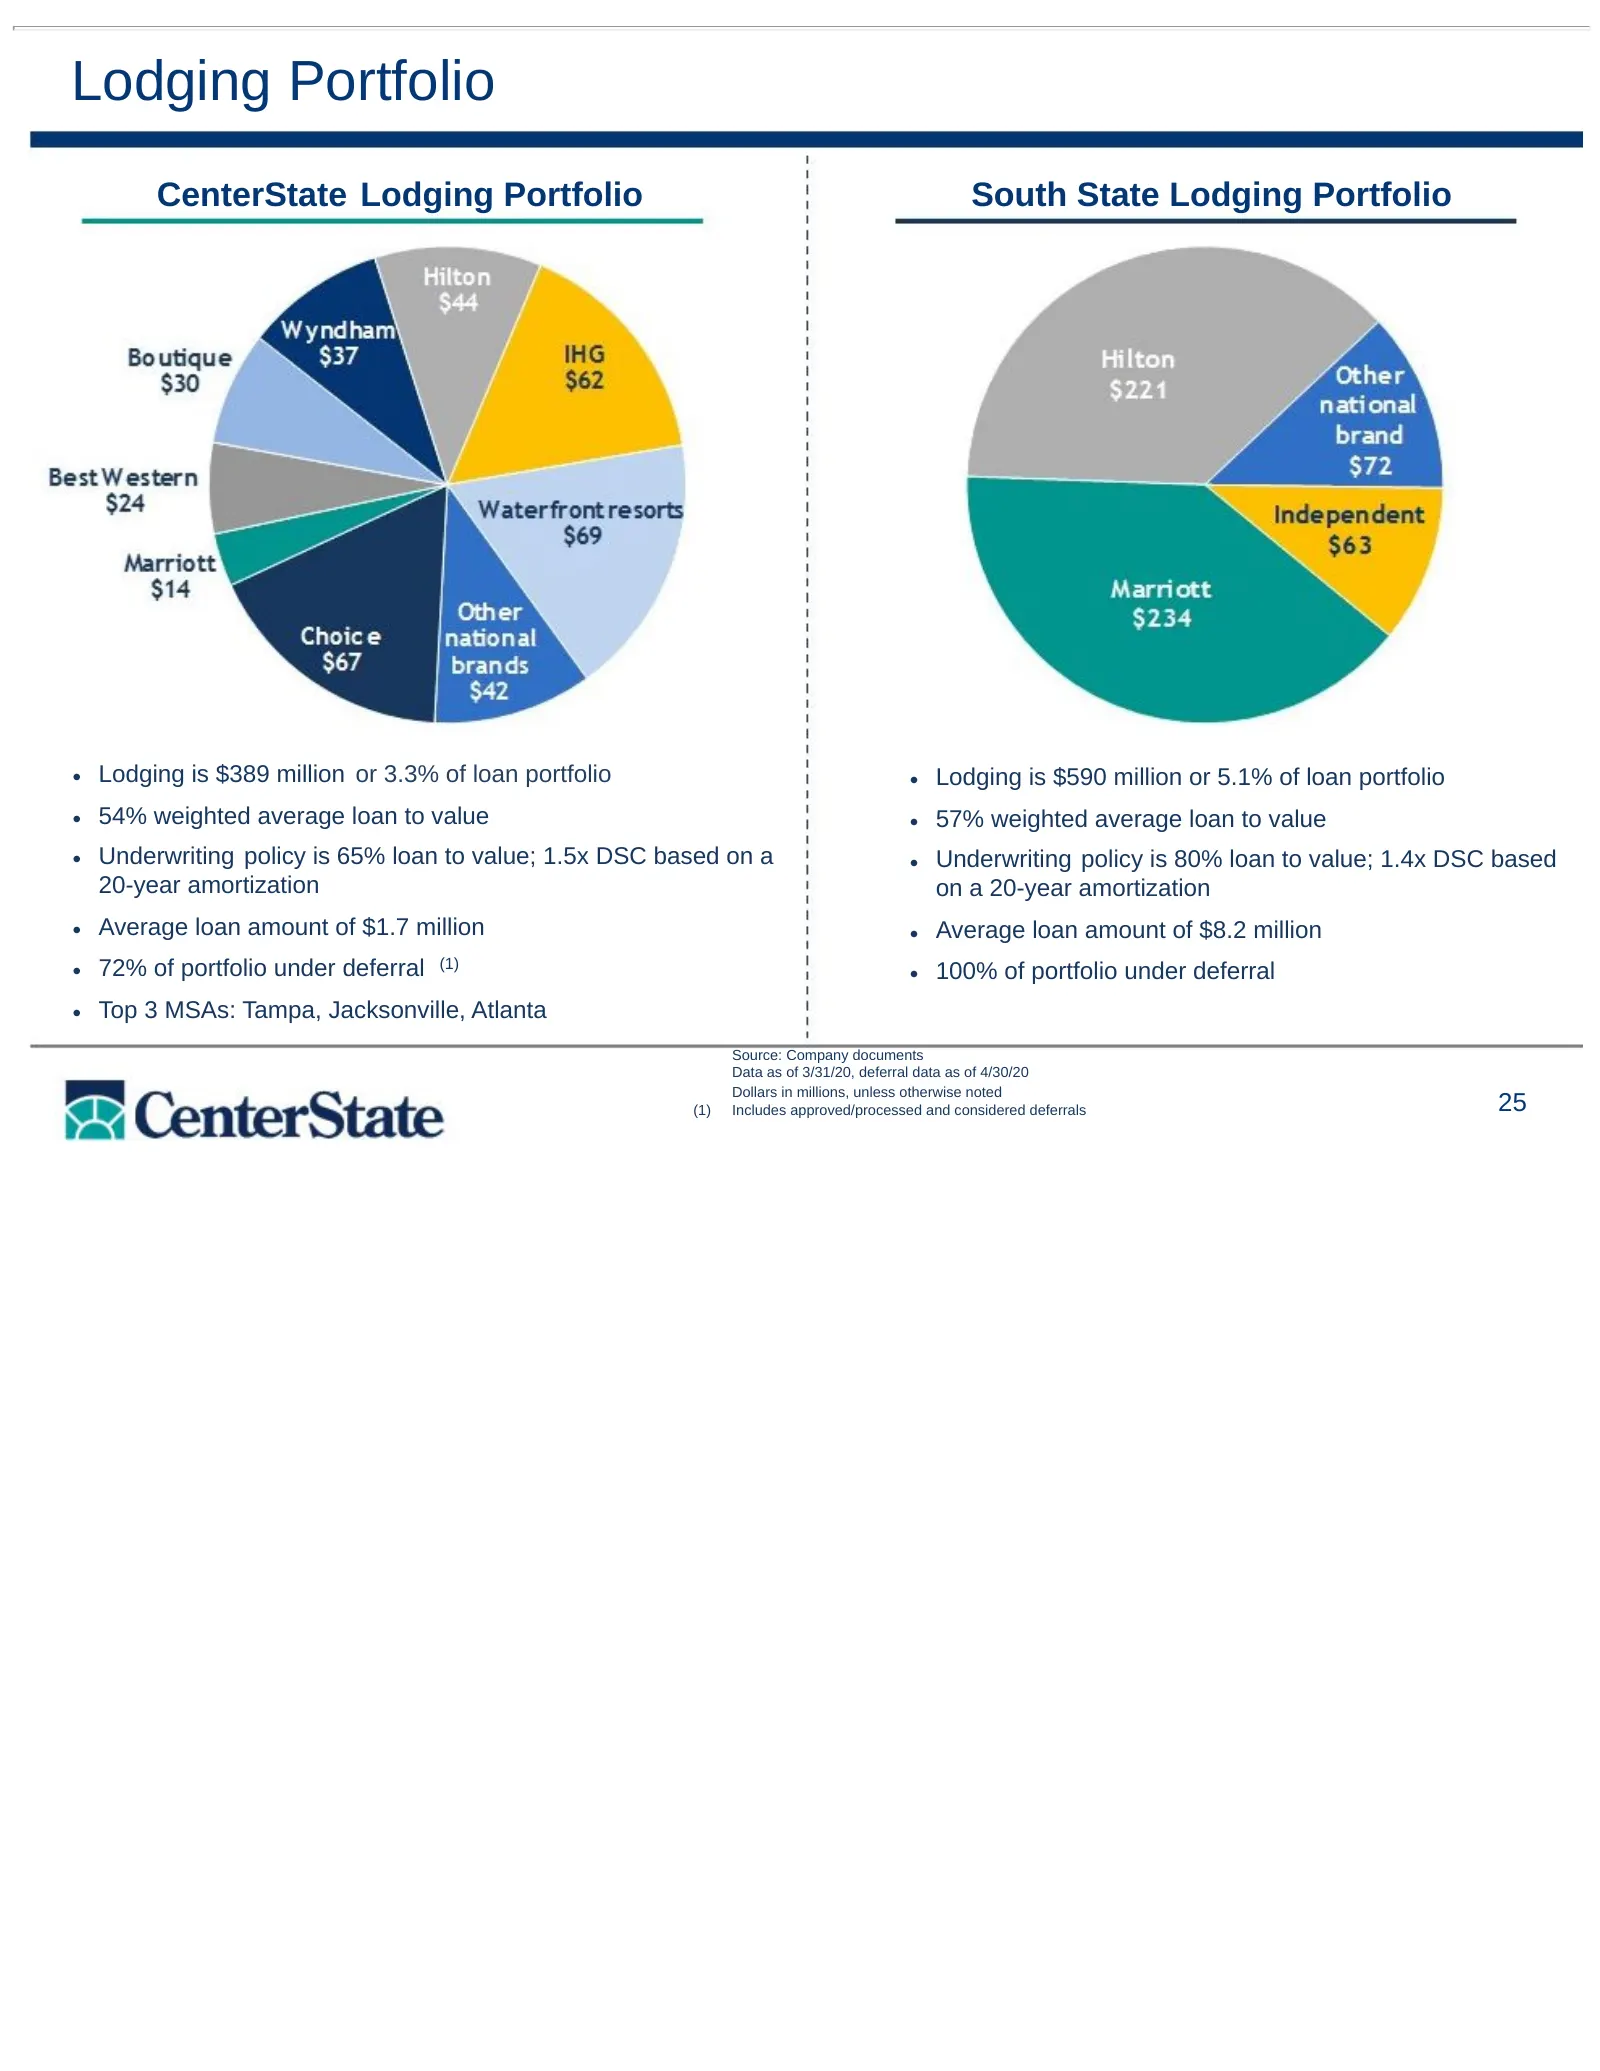
Slide 25: Lodging Portfolio
Lodging Portfolio CenterState Lodging Portfolio South State Lodging Portfolio • Lodging is $389 million or 3.3% of loan portfolio • Lodging is $590 million or 5.1% of loan portfolio • 54% weighted average loan to value • 57% weighted average loan to value • Underwriting policy is 65% loan to value;
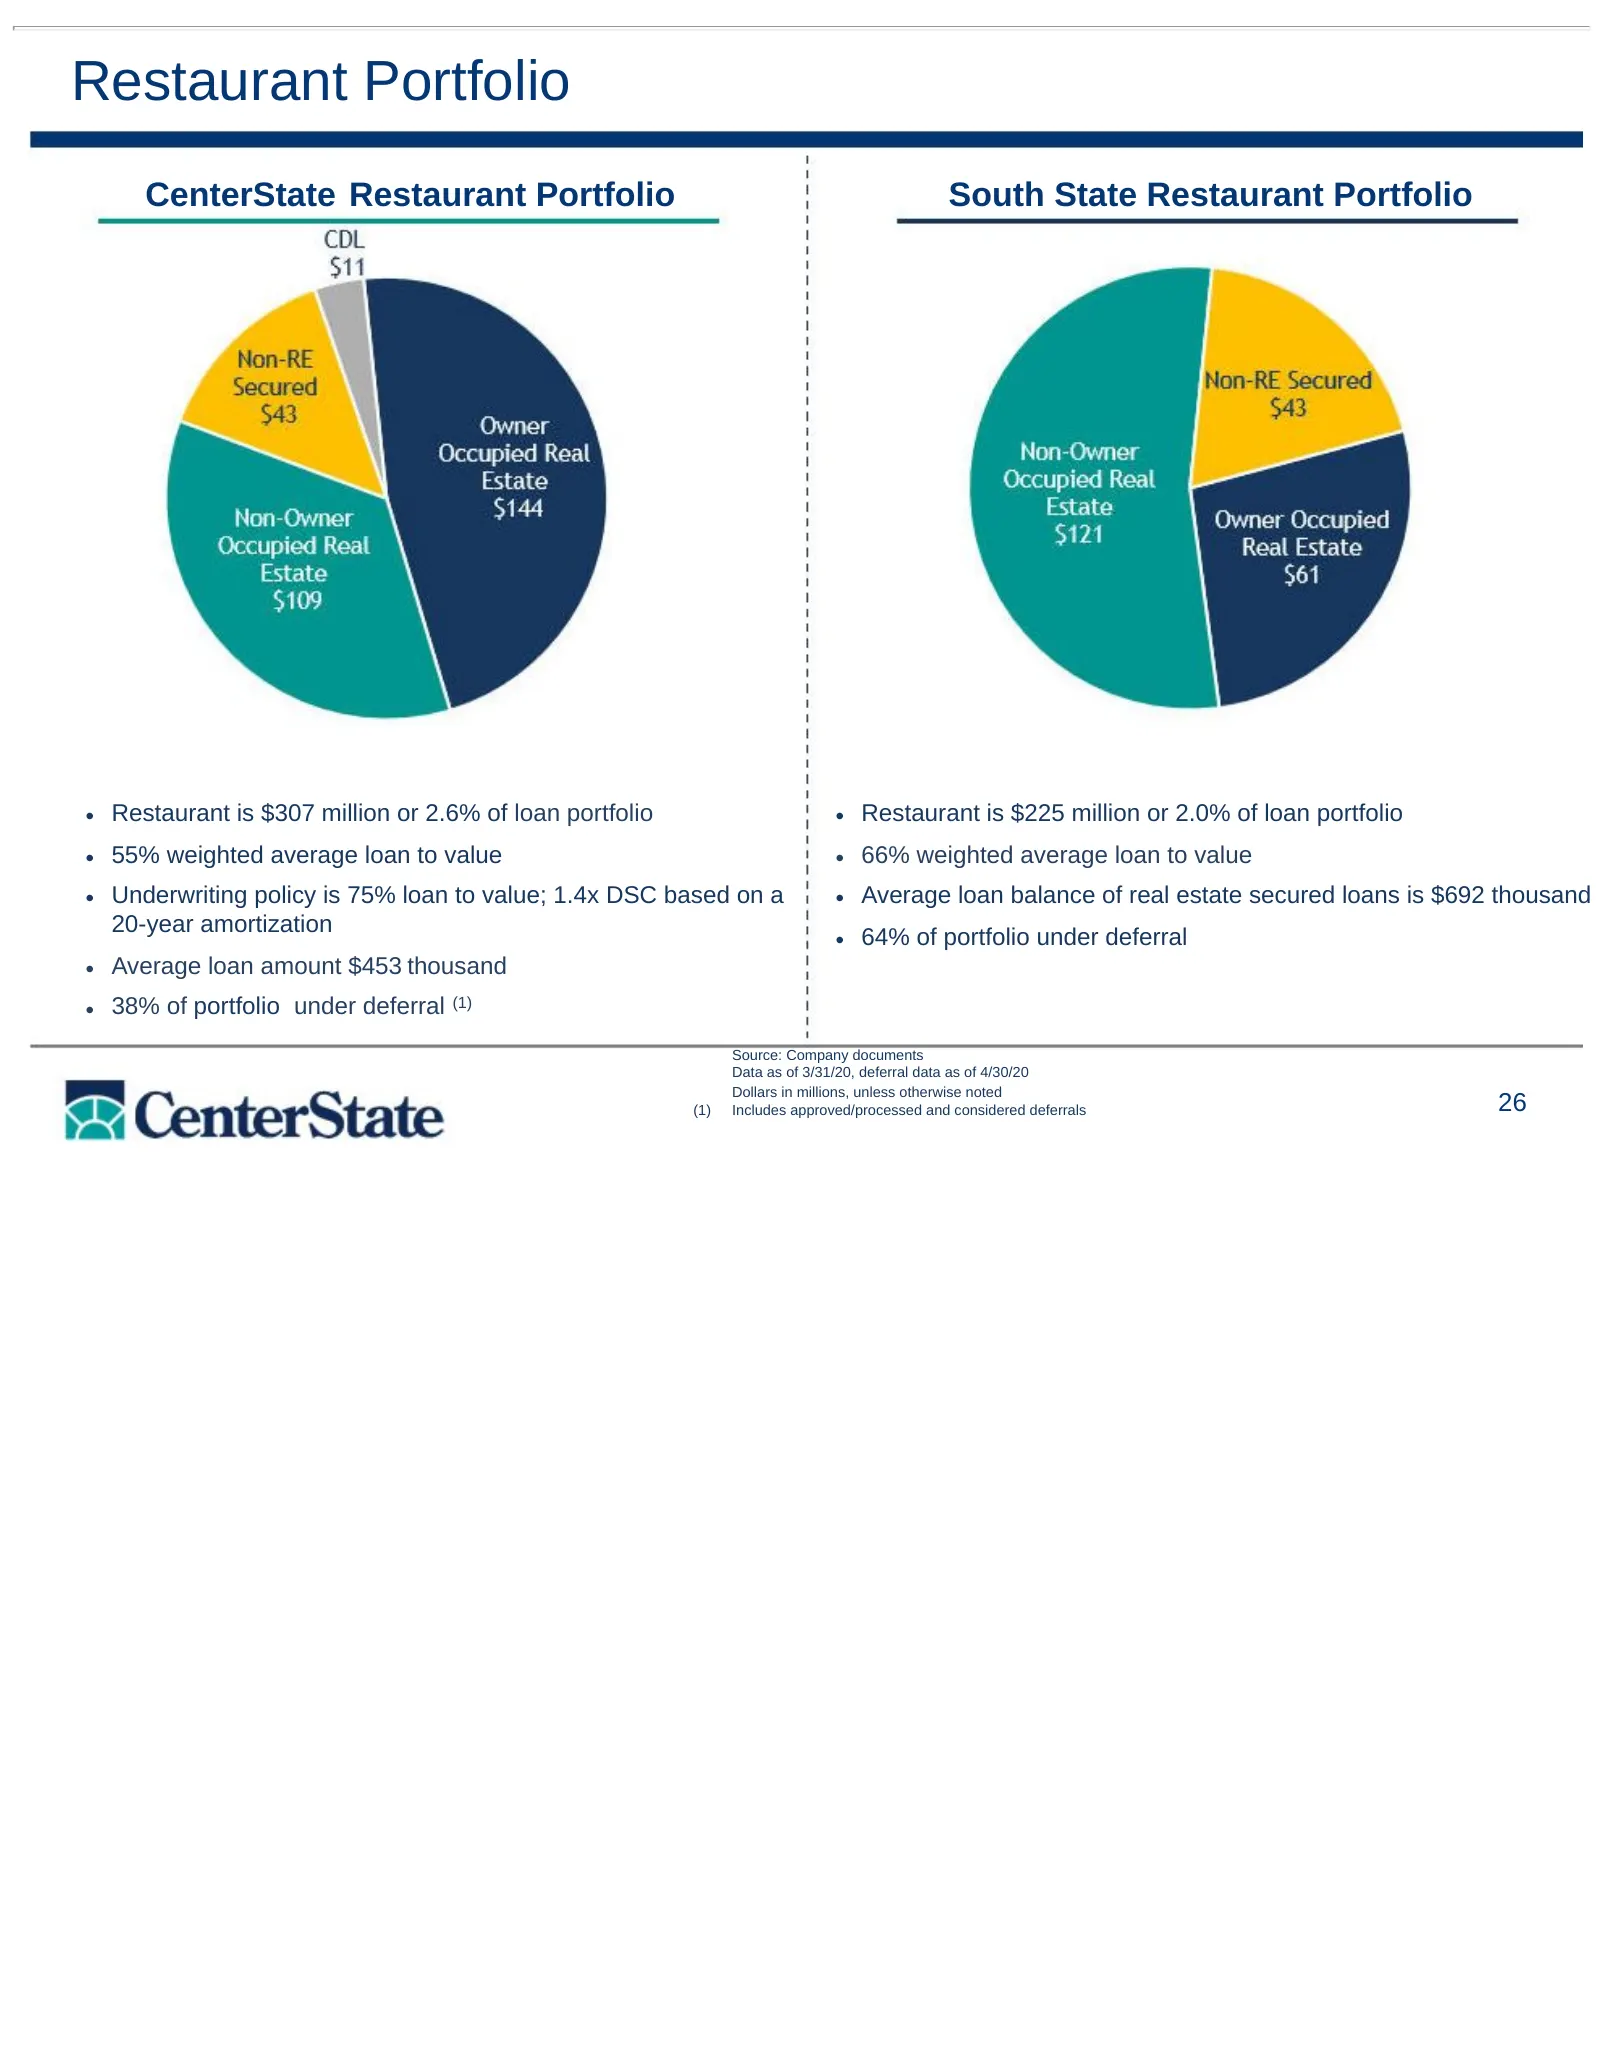
Slide 26: Restaurant Portfolio
Restaurant Portfolio CenterState Restaurant Portfolio South State Restaurant Portfolio • Restaurant is $307 million or 2.6% of loan portfolio • Restaurant is $225 million or 2.0% of loan portfolio • 55% weighted average loan to value • 66% weighted average loan to value • Underwriting policy is 75%
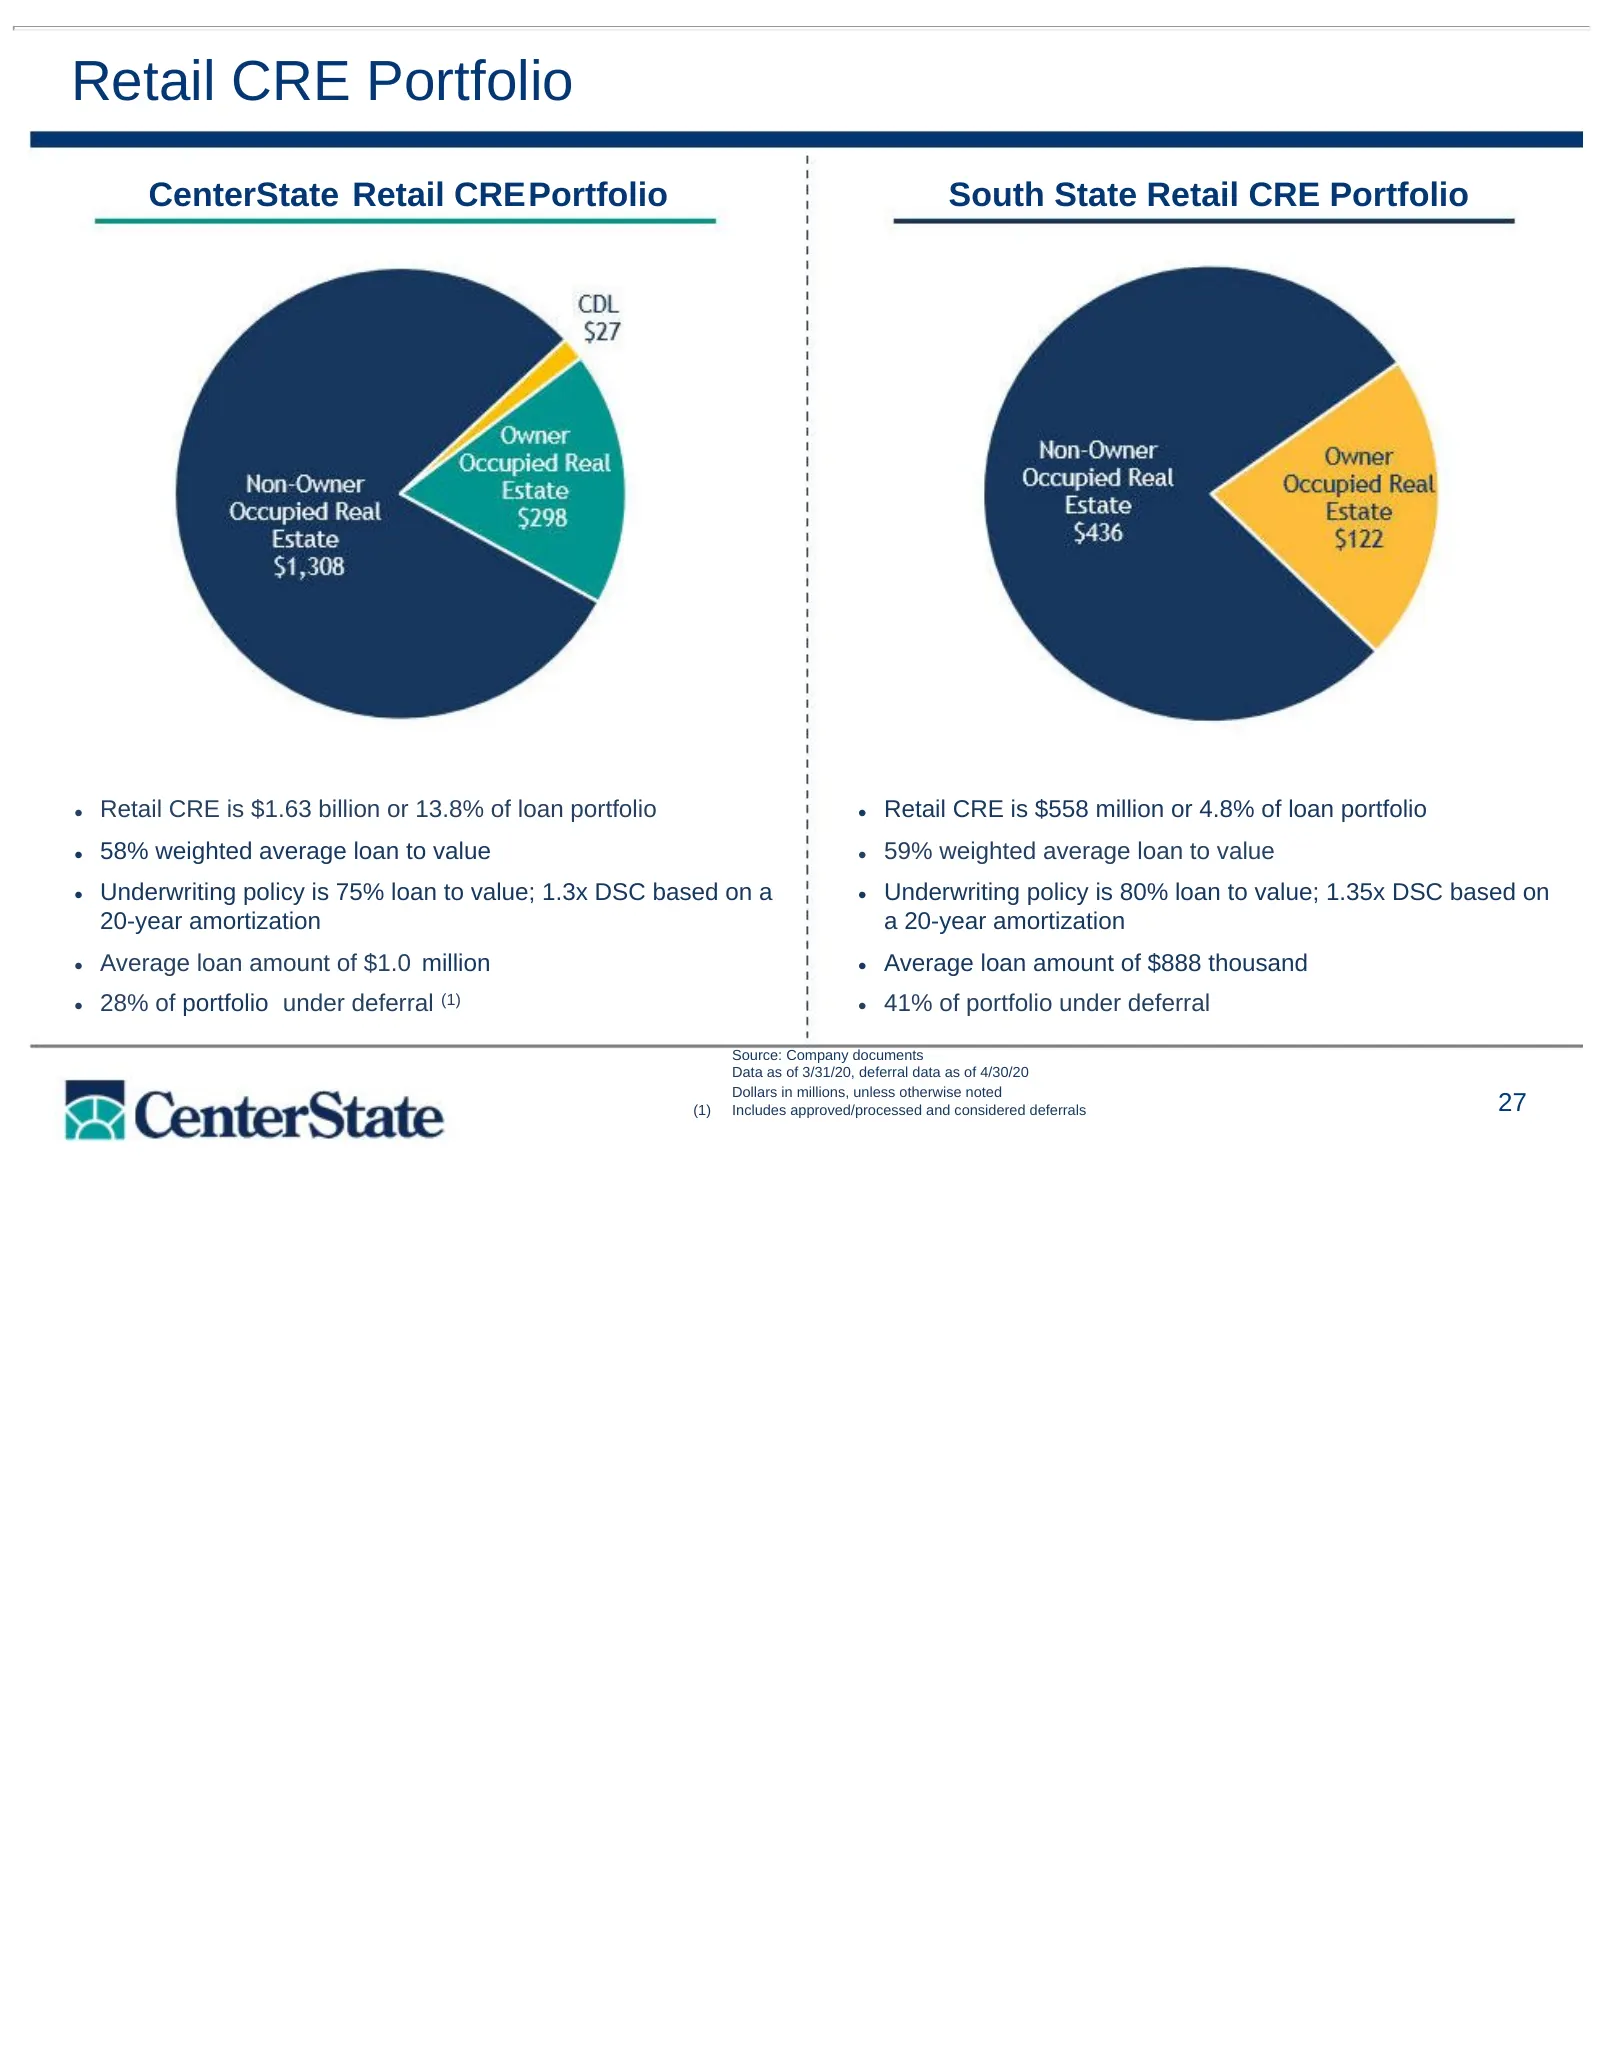
Slide 27: Retail CRE Portfolio
Retail CRE Portfolio CenterState Retail CREPortfolio South State Retail CRE Portfolio • Retail CRE is $1.63 billion or 13.8% of loan portfolio • Retail CRE is $558 million or 4.8% of loan portfolio • 58% weighted average loan to value • 59% weighted average loan to value • Underwriting policy is 75%
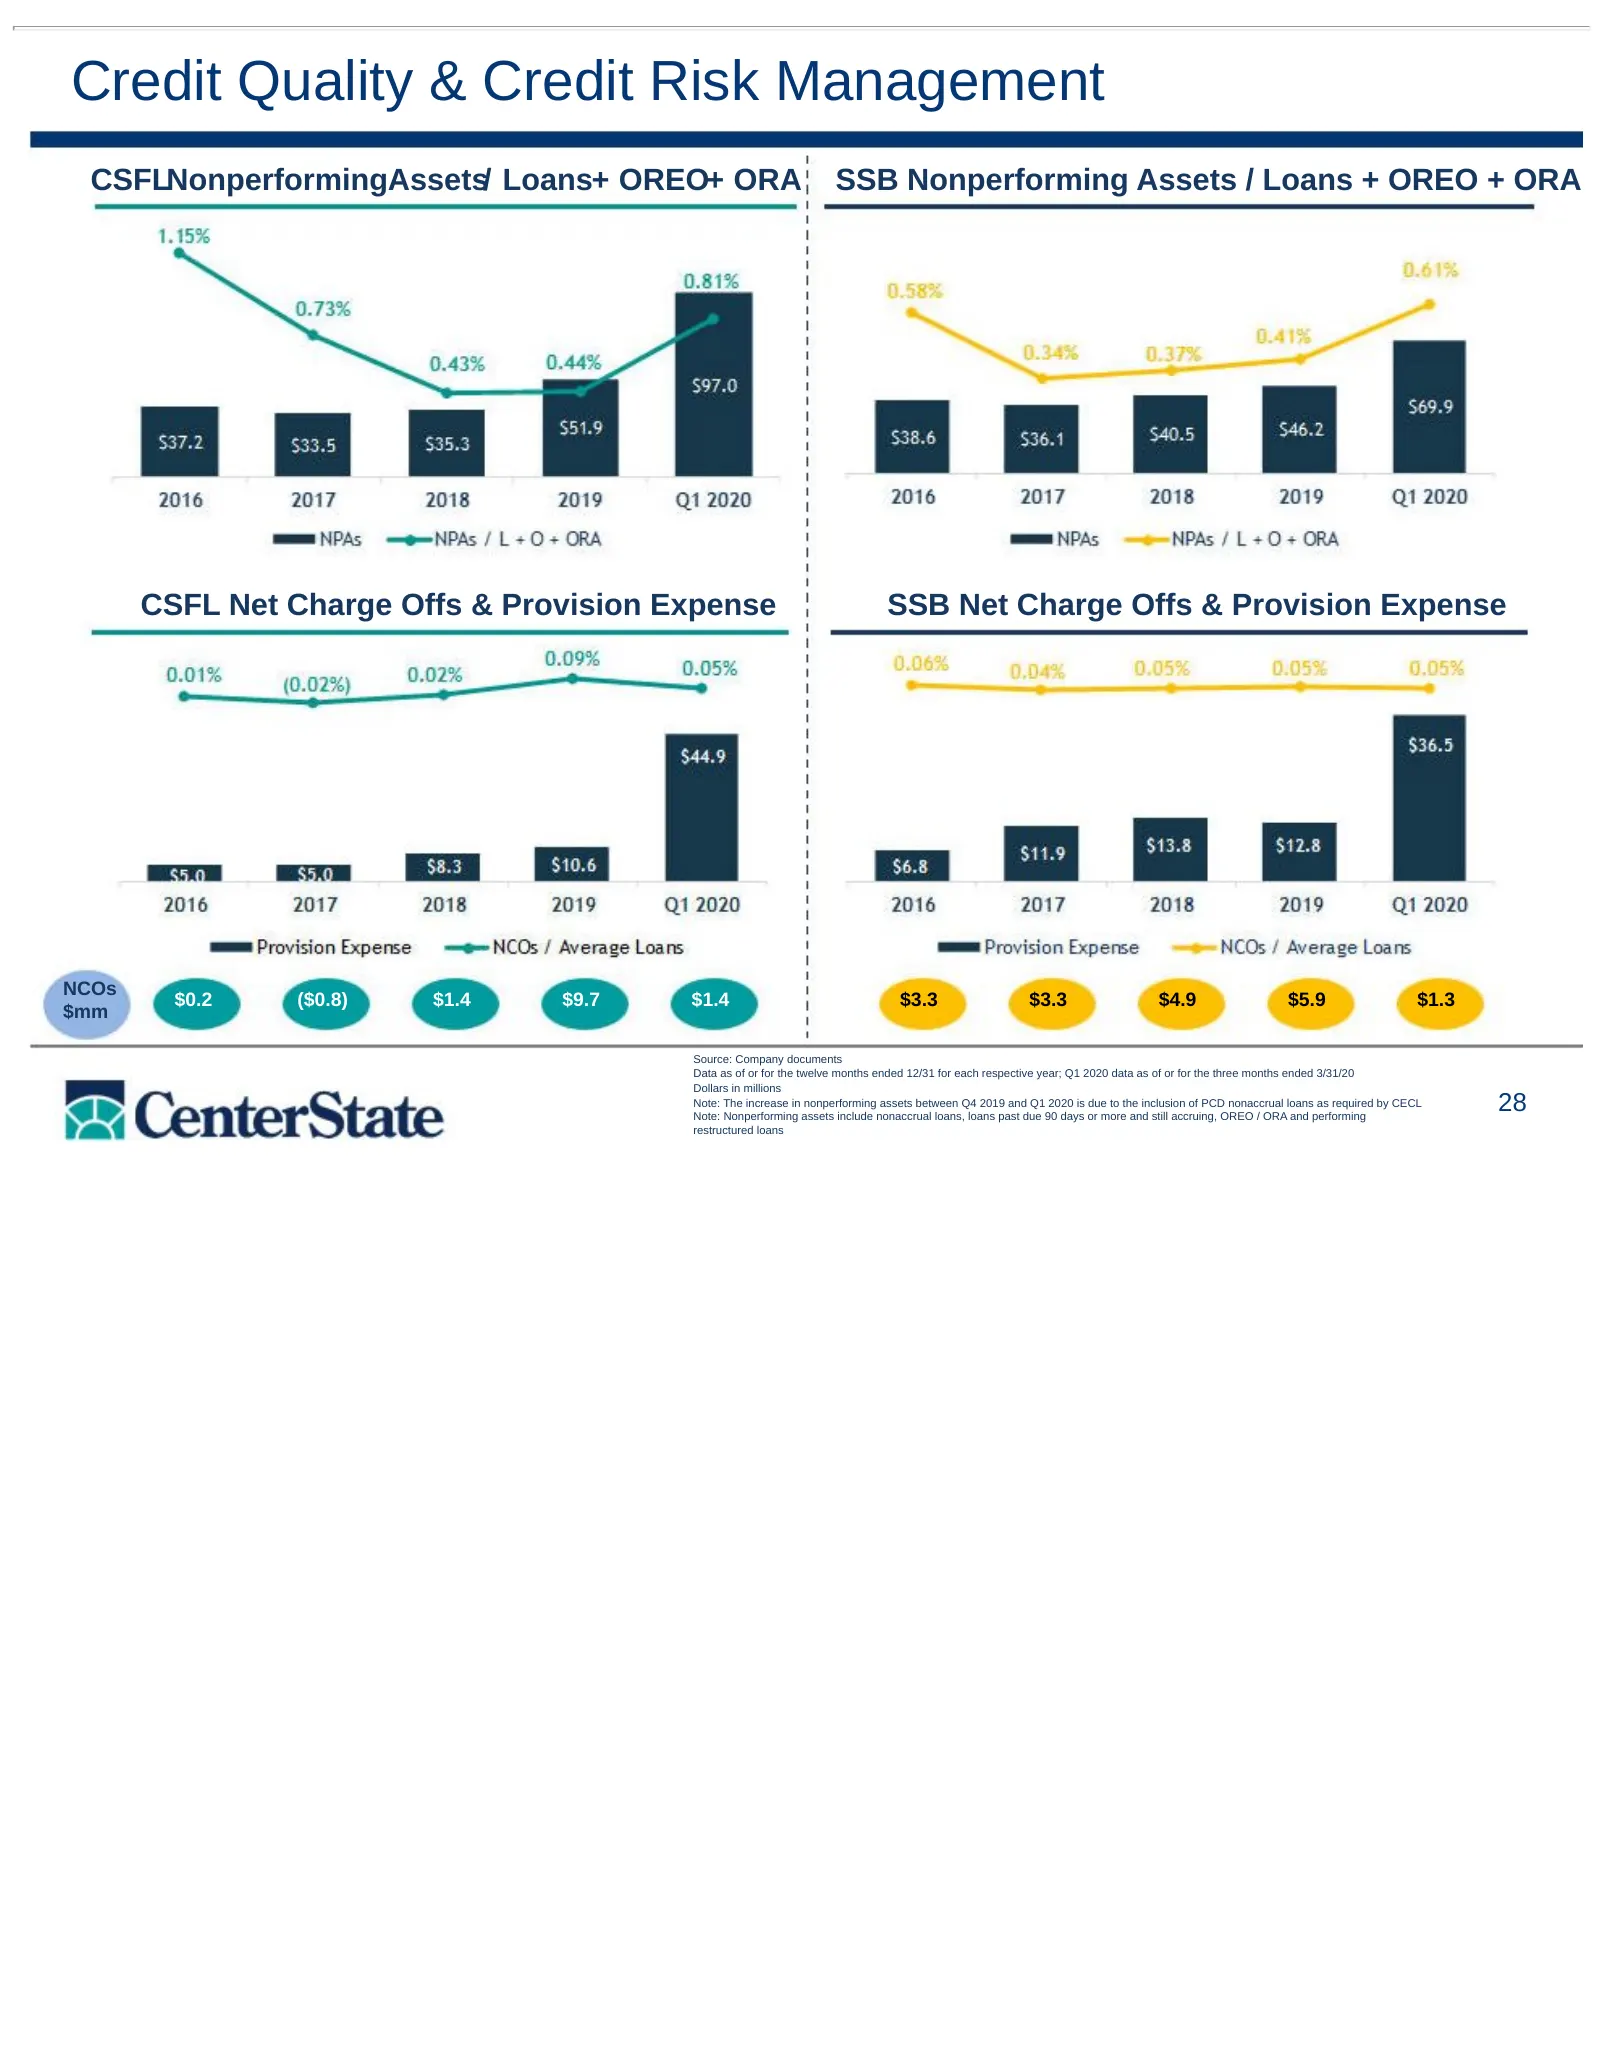
Slide 28: Credit Quality & Credit Risk Management
Credit Quality & Credit Risk Management CSFLNonperformingAssets/ Loans+ OREO+ ORA SSB Nonperforming Assets / Loans + OREO + ORA CSFL Net Charge Offs & Provision Expense SSB Net Charge Offs & Provision Expense NCOs $0.2 ($0.8) $1.4 $9.7 $1.4 $3.3 $3.3 $4.9 $5.9 $1.3 $mm Source: Company documents Data
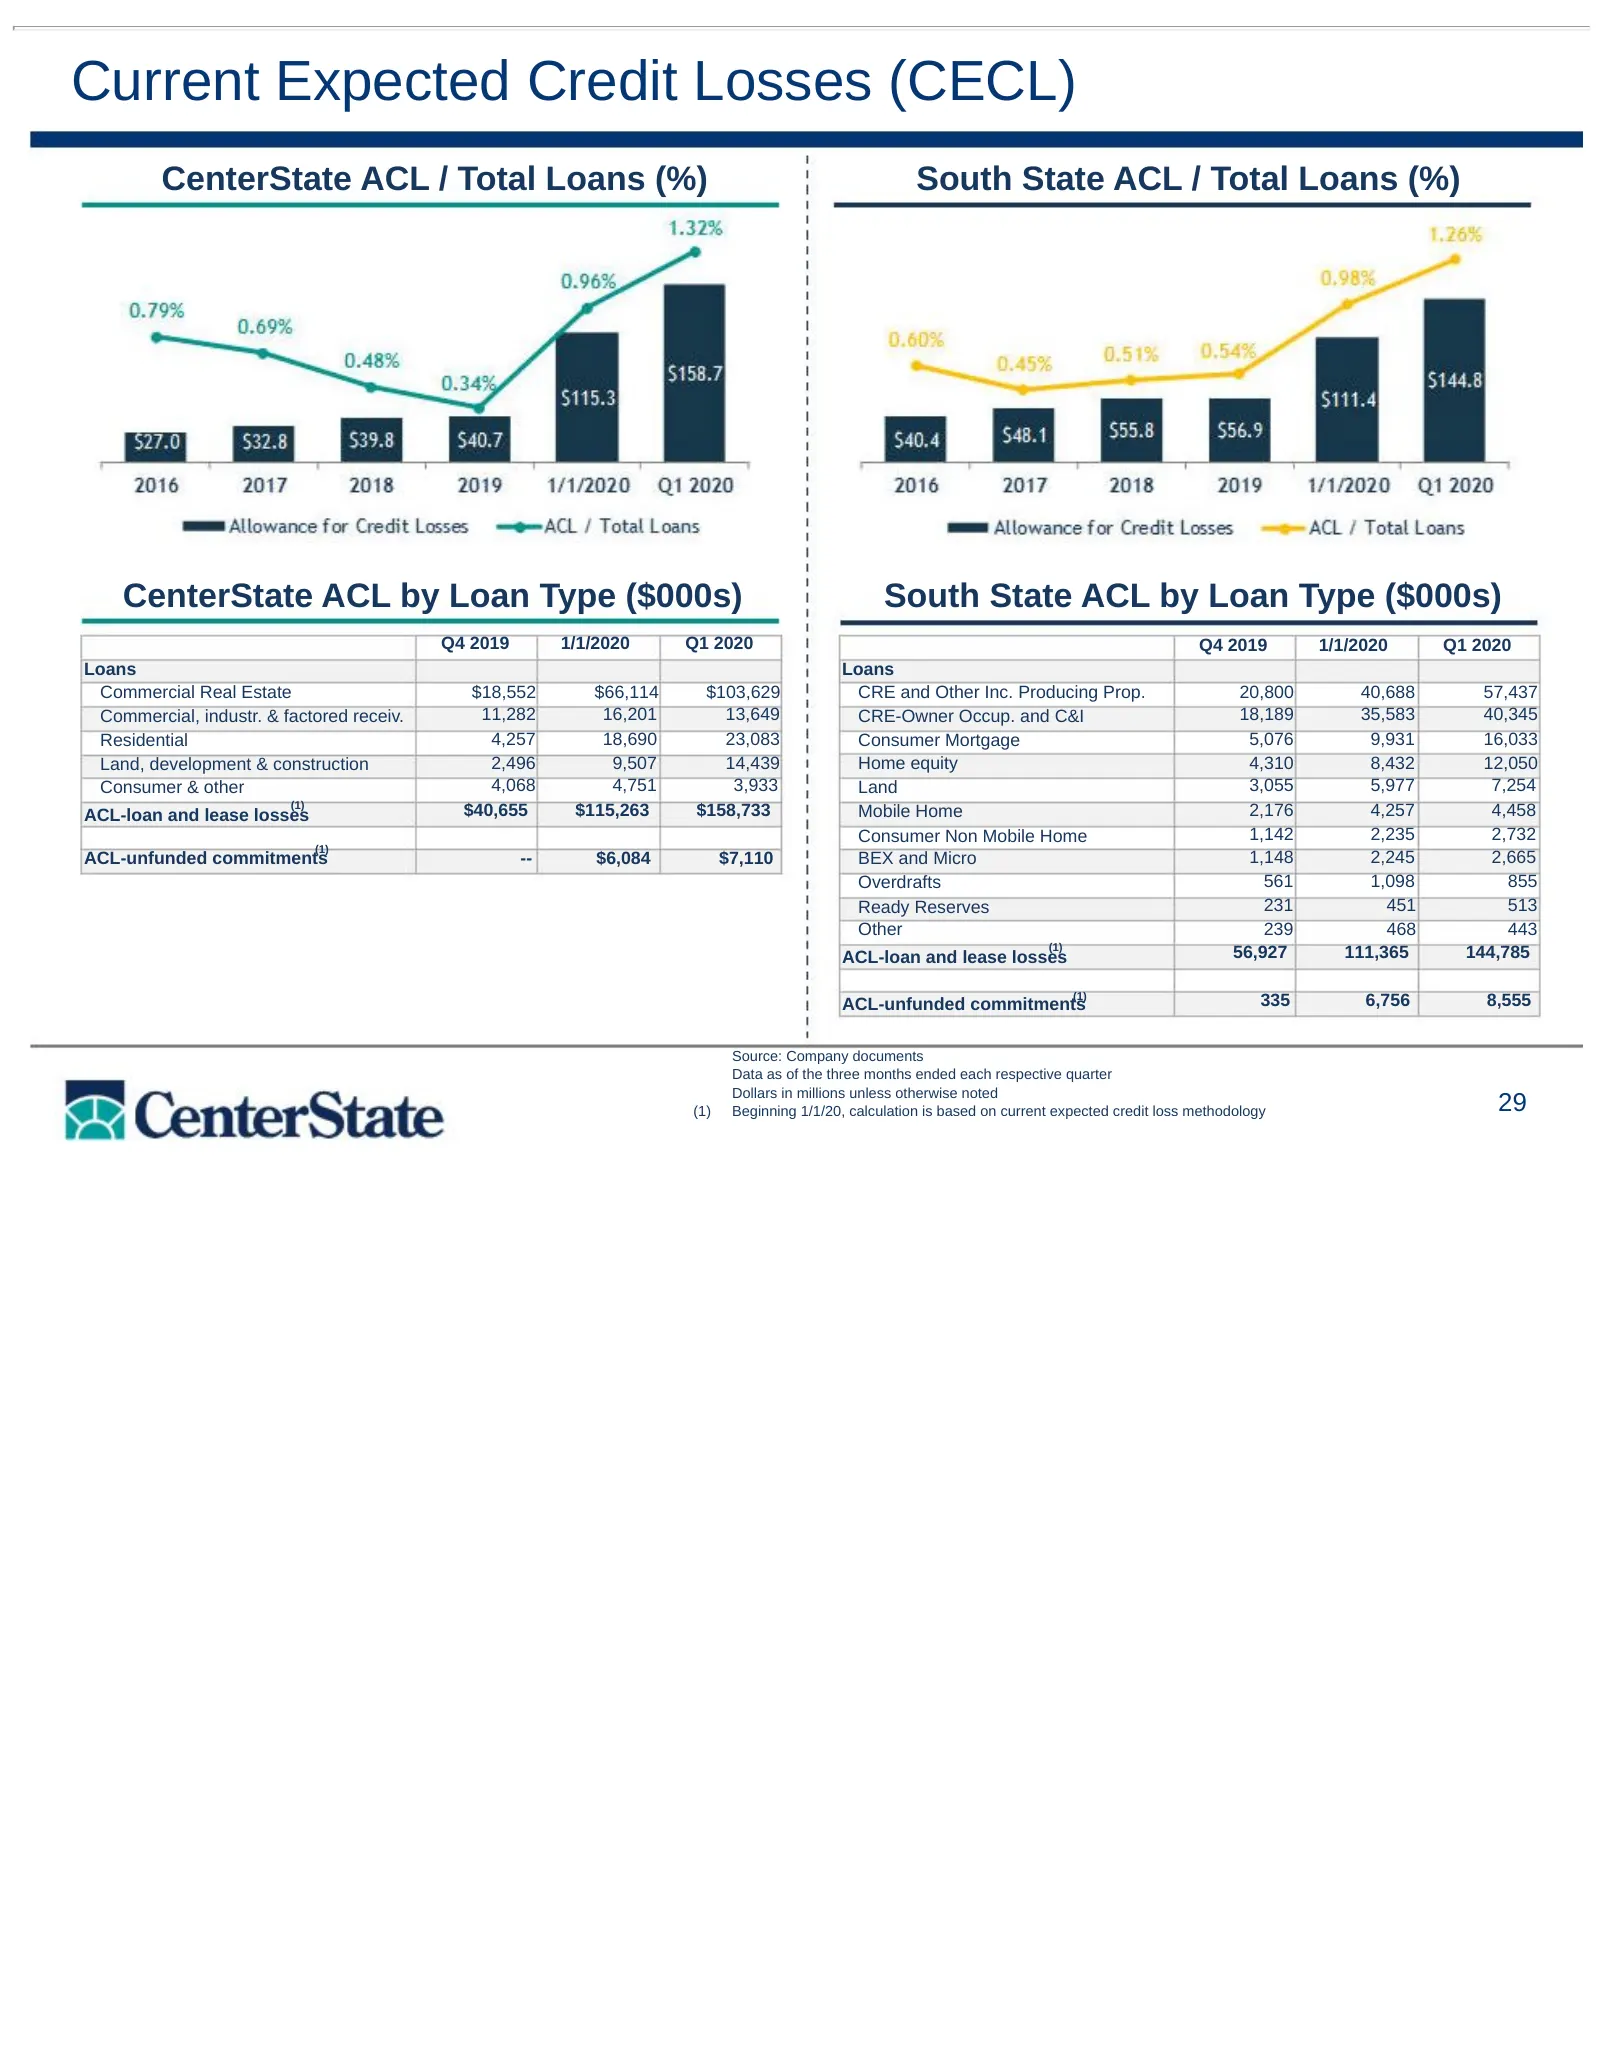
Slide 29: Current Expected Credit Losses (CECL)
Current Expected Credit Losses (CECL) CenterState ACL / Total Loans (%) South State ACL / Total Loans (%) CenterState ACL by Loan Type ($000s) South State ACL by Loan Type ($000s) Q4 2019 1/1/2020 Q1 2020 Q4 2019 1/1/2020 Q1 2020 Loans Loans Commercial Real Estate $18,552 $66,114 $103,629 CRE and Ot
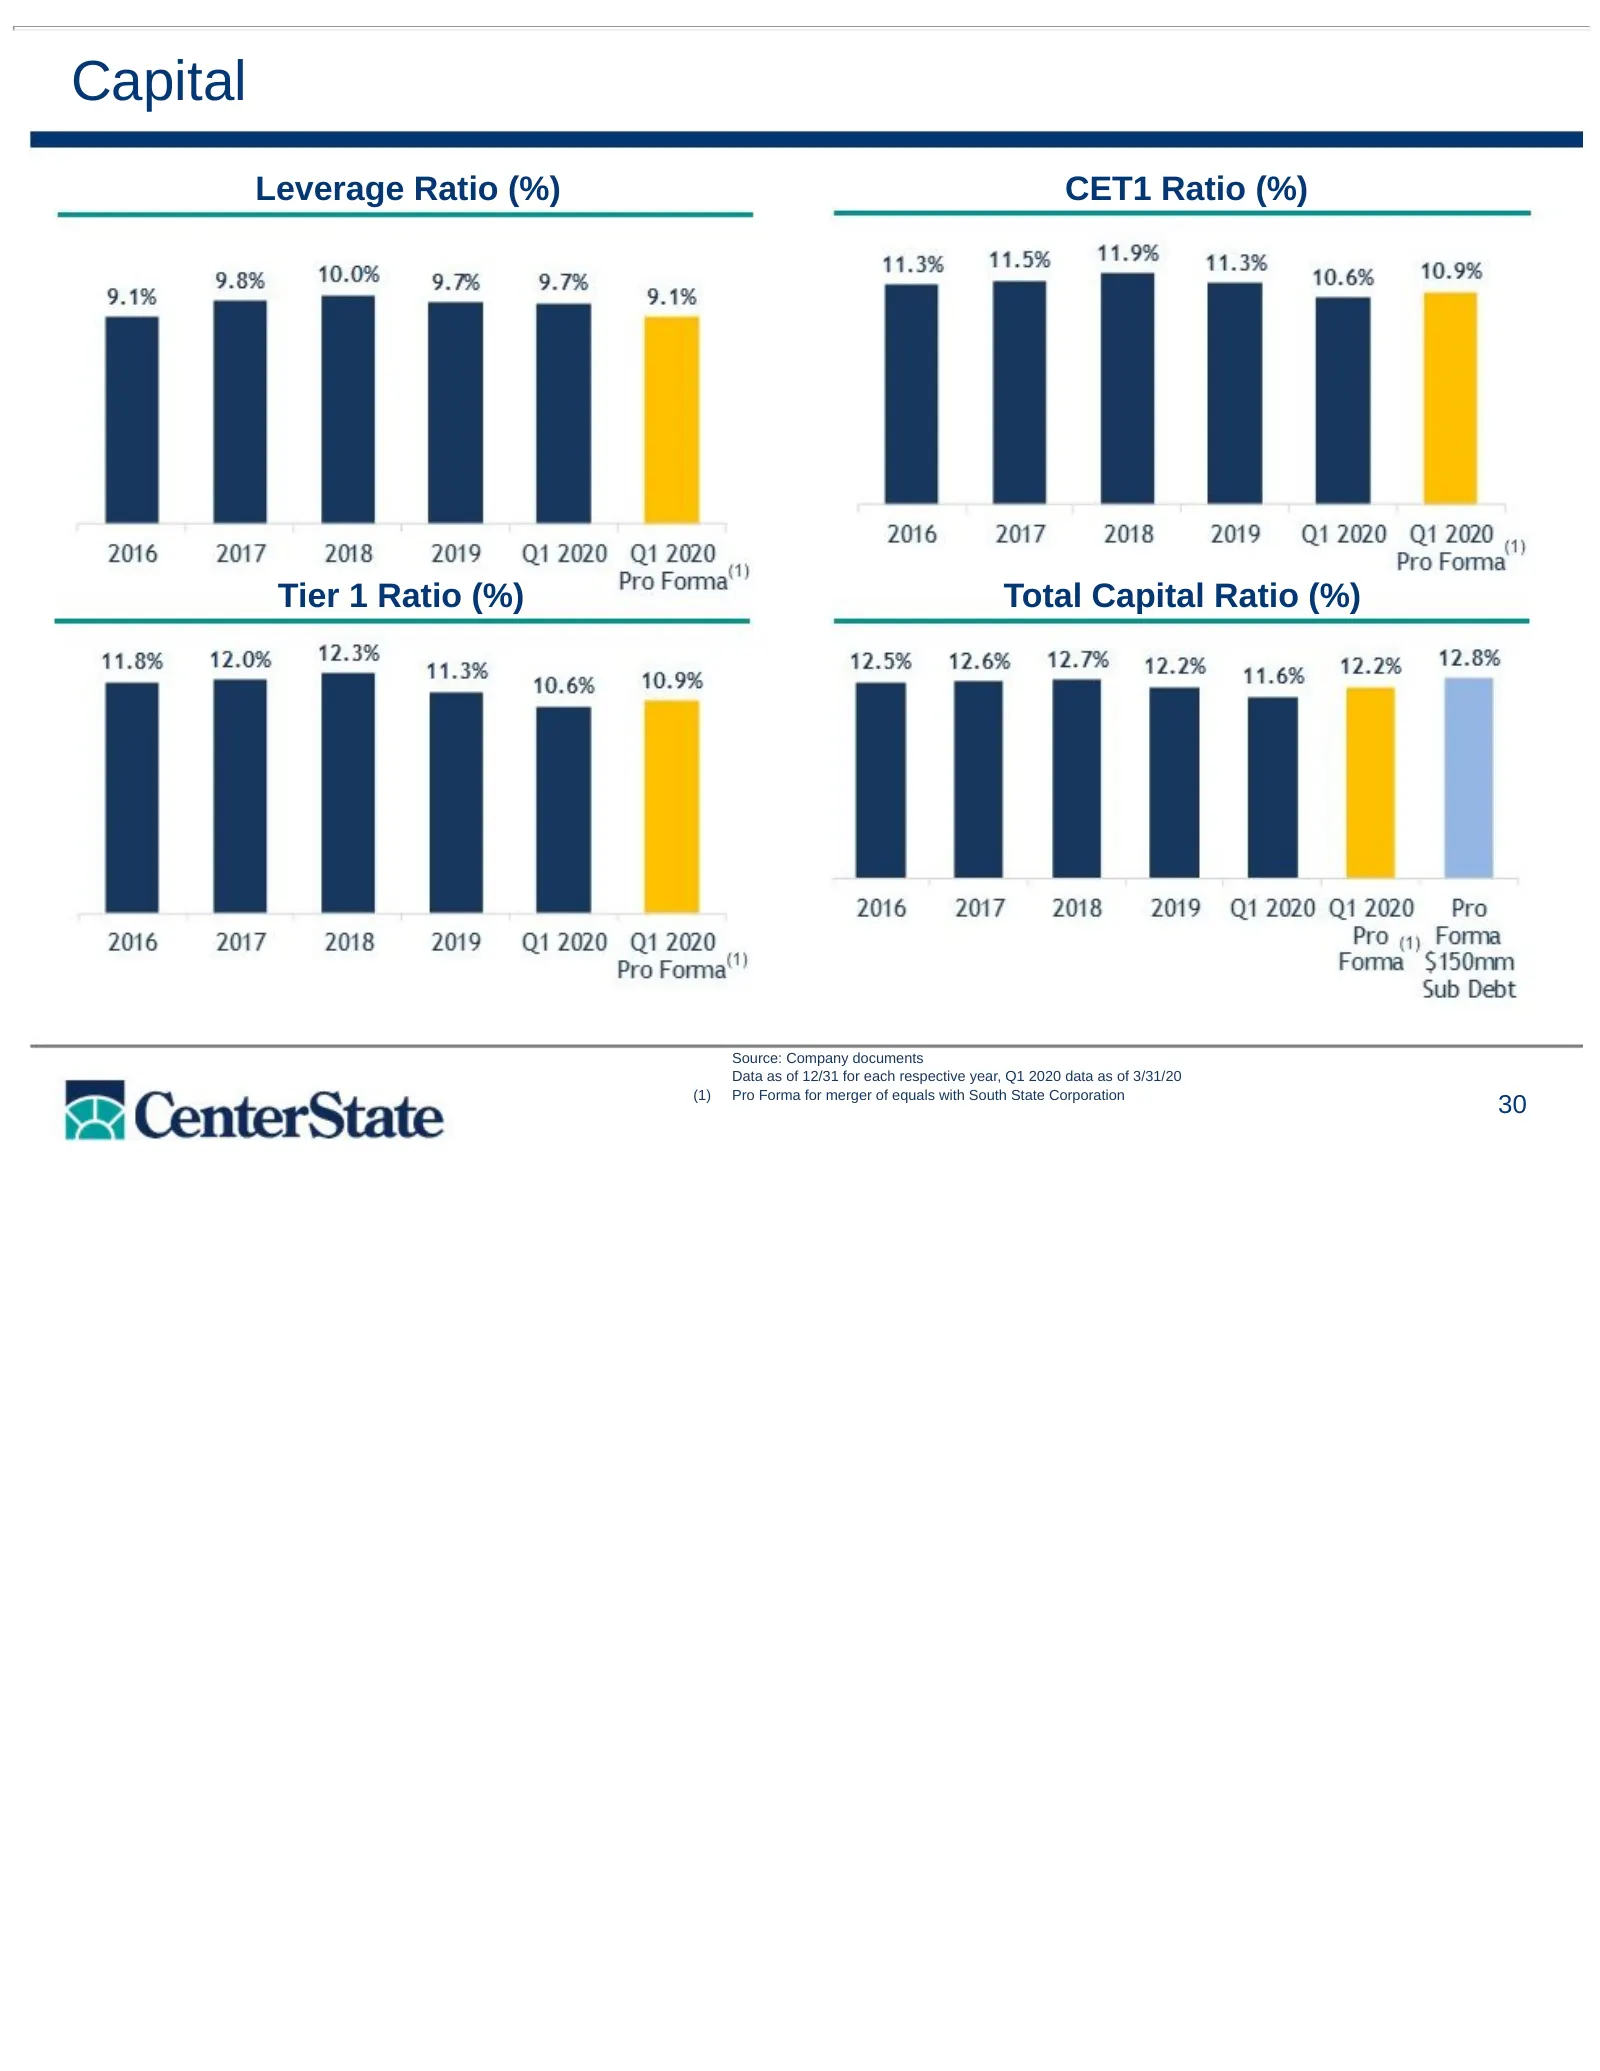
Slide 30: Capital
Capital Leverage Ratio (%) CET1 Ratio (%) Tier 1 Ratio (%) Total Capital Ratio (%) Source: Company documents Data as of 12/31 for each respective year, Q1 2020 data as of 3/31/20 (1) Pro Forma for merger of equals with South State Corporation 30
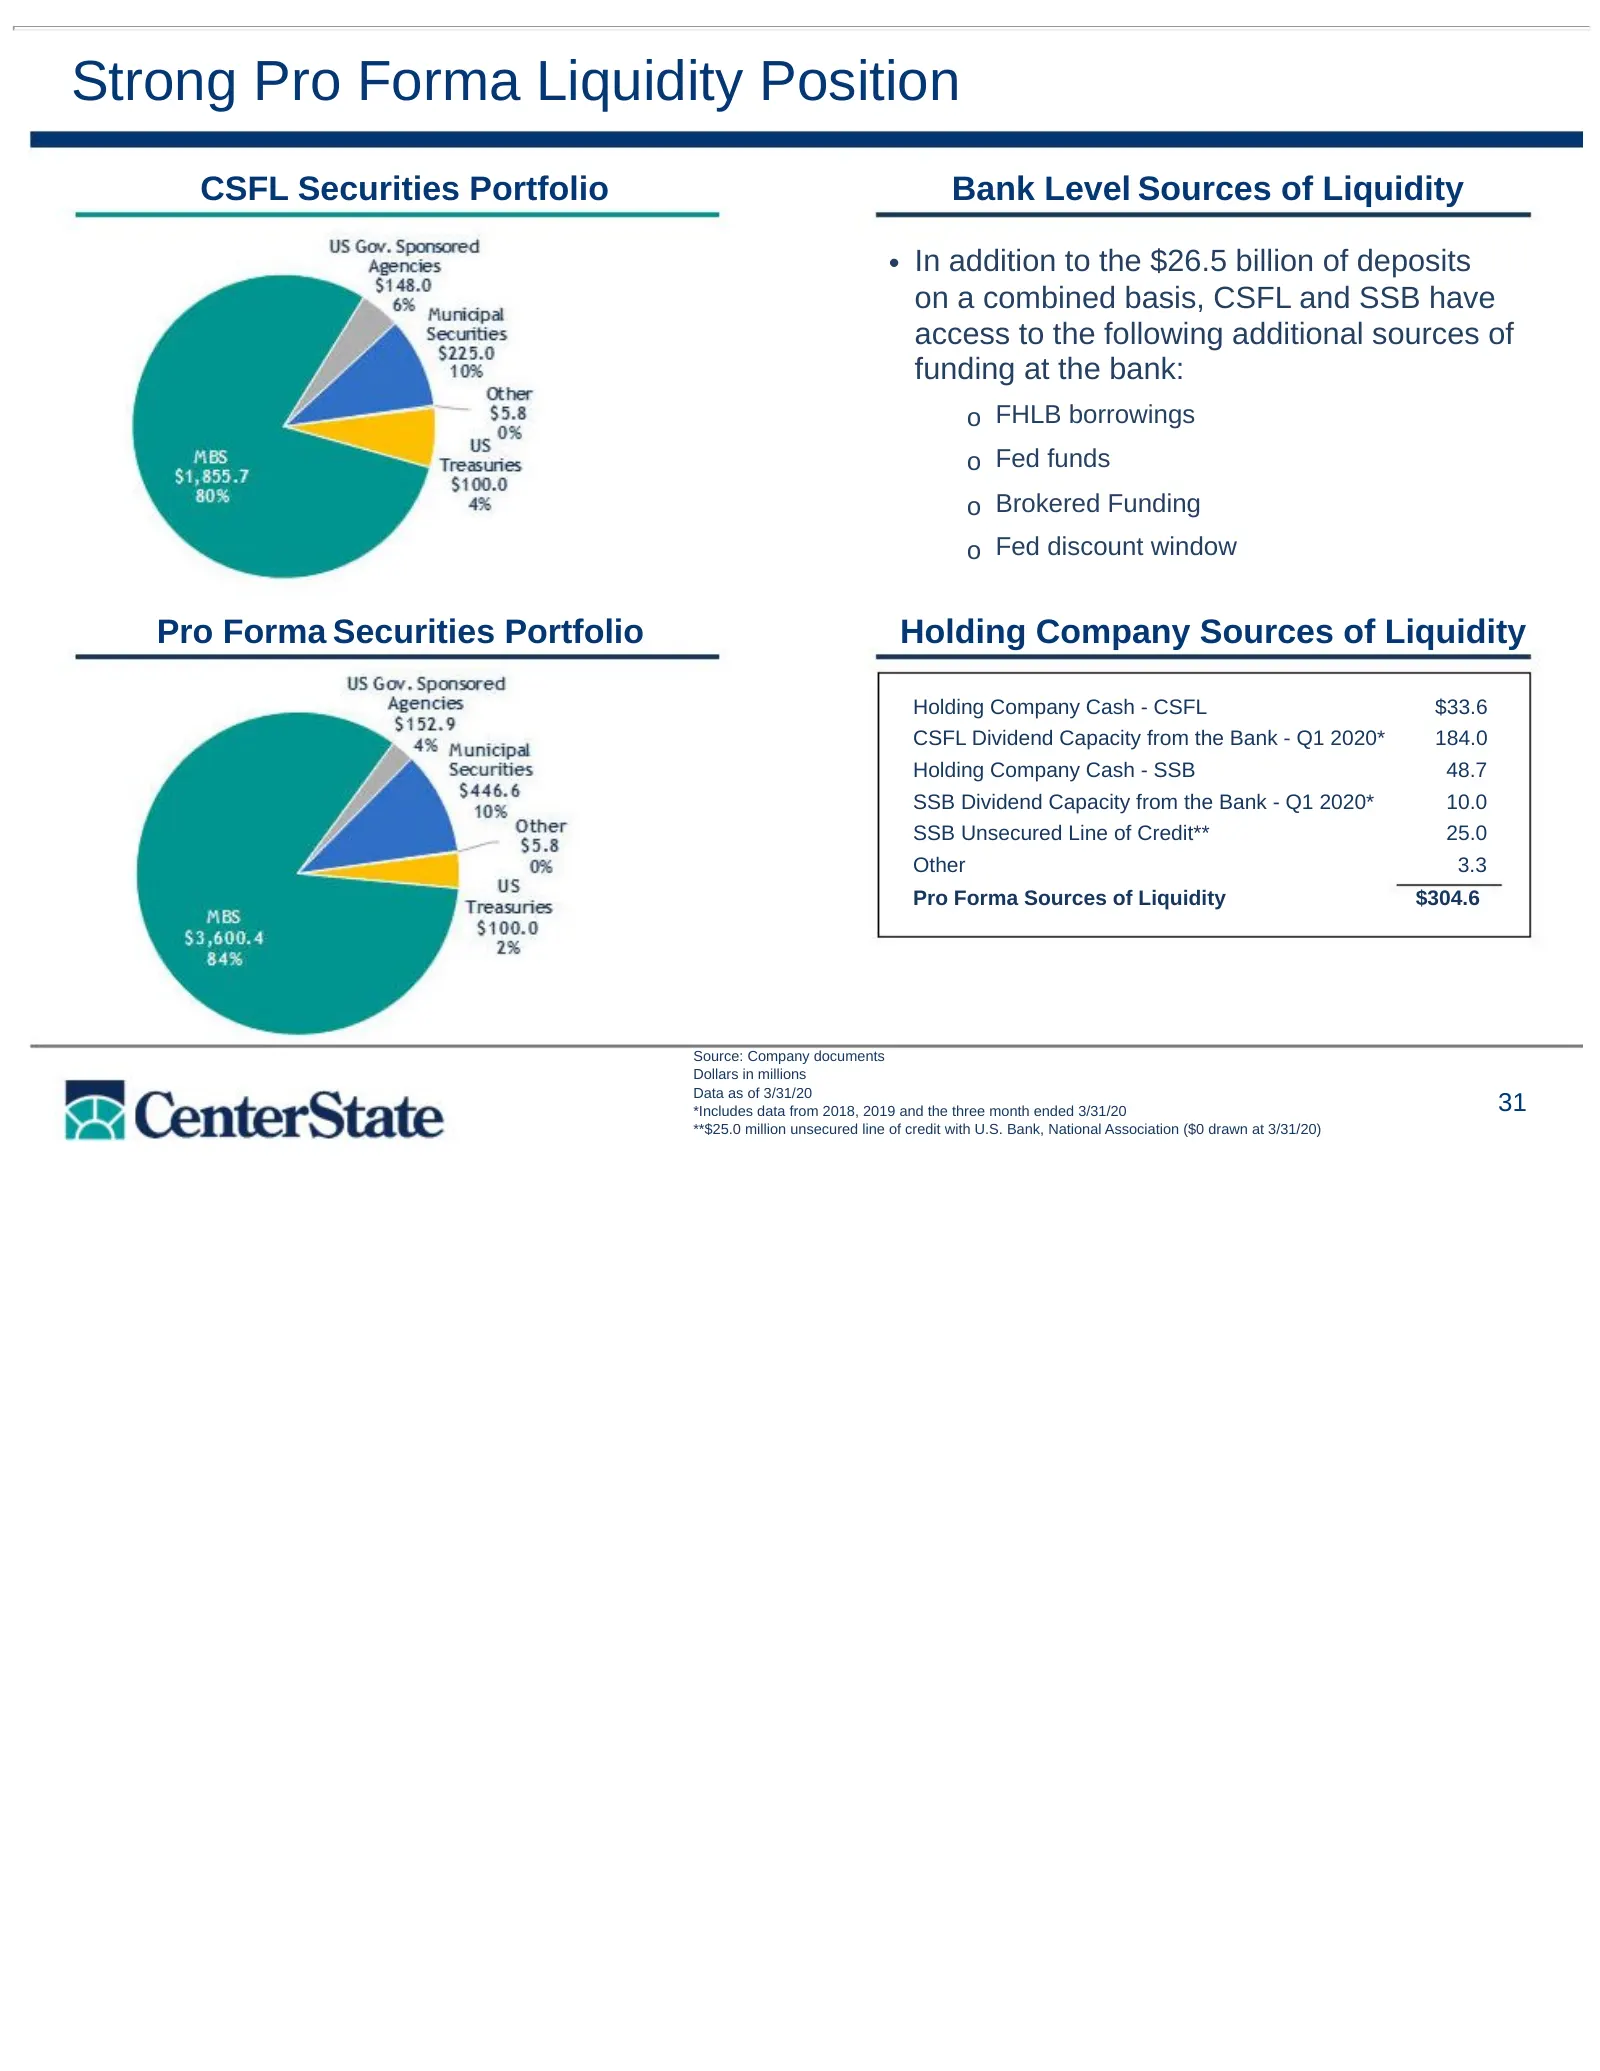
Slide 31: Strong Pro Forma Liquidity Position
Strong Pro Forma Liquidity Position CSFL Securities Portfolio Bank Level Sources of Liquidity • In addition to the $26.5 billion of deposits on a combined basis, CSFL and SSB have access to the following additional sources of funding at the bank: o FHLB borrowings o Fed funds o Brokered Funding o Fe
Slide 32: Presentation Contents
Presentation Contents I. About CenterState Bank Corporation II. Financial Highlights III. Appendix 32
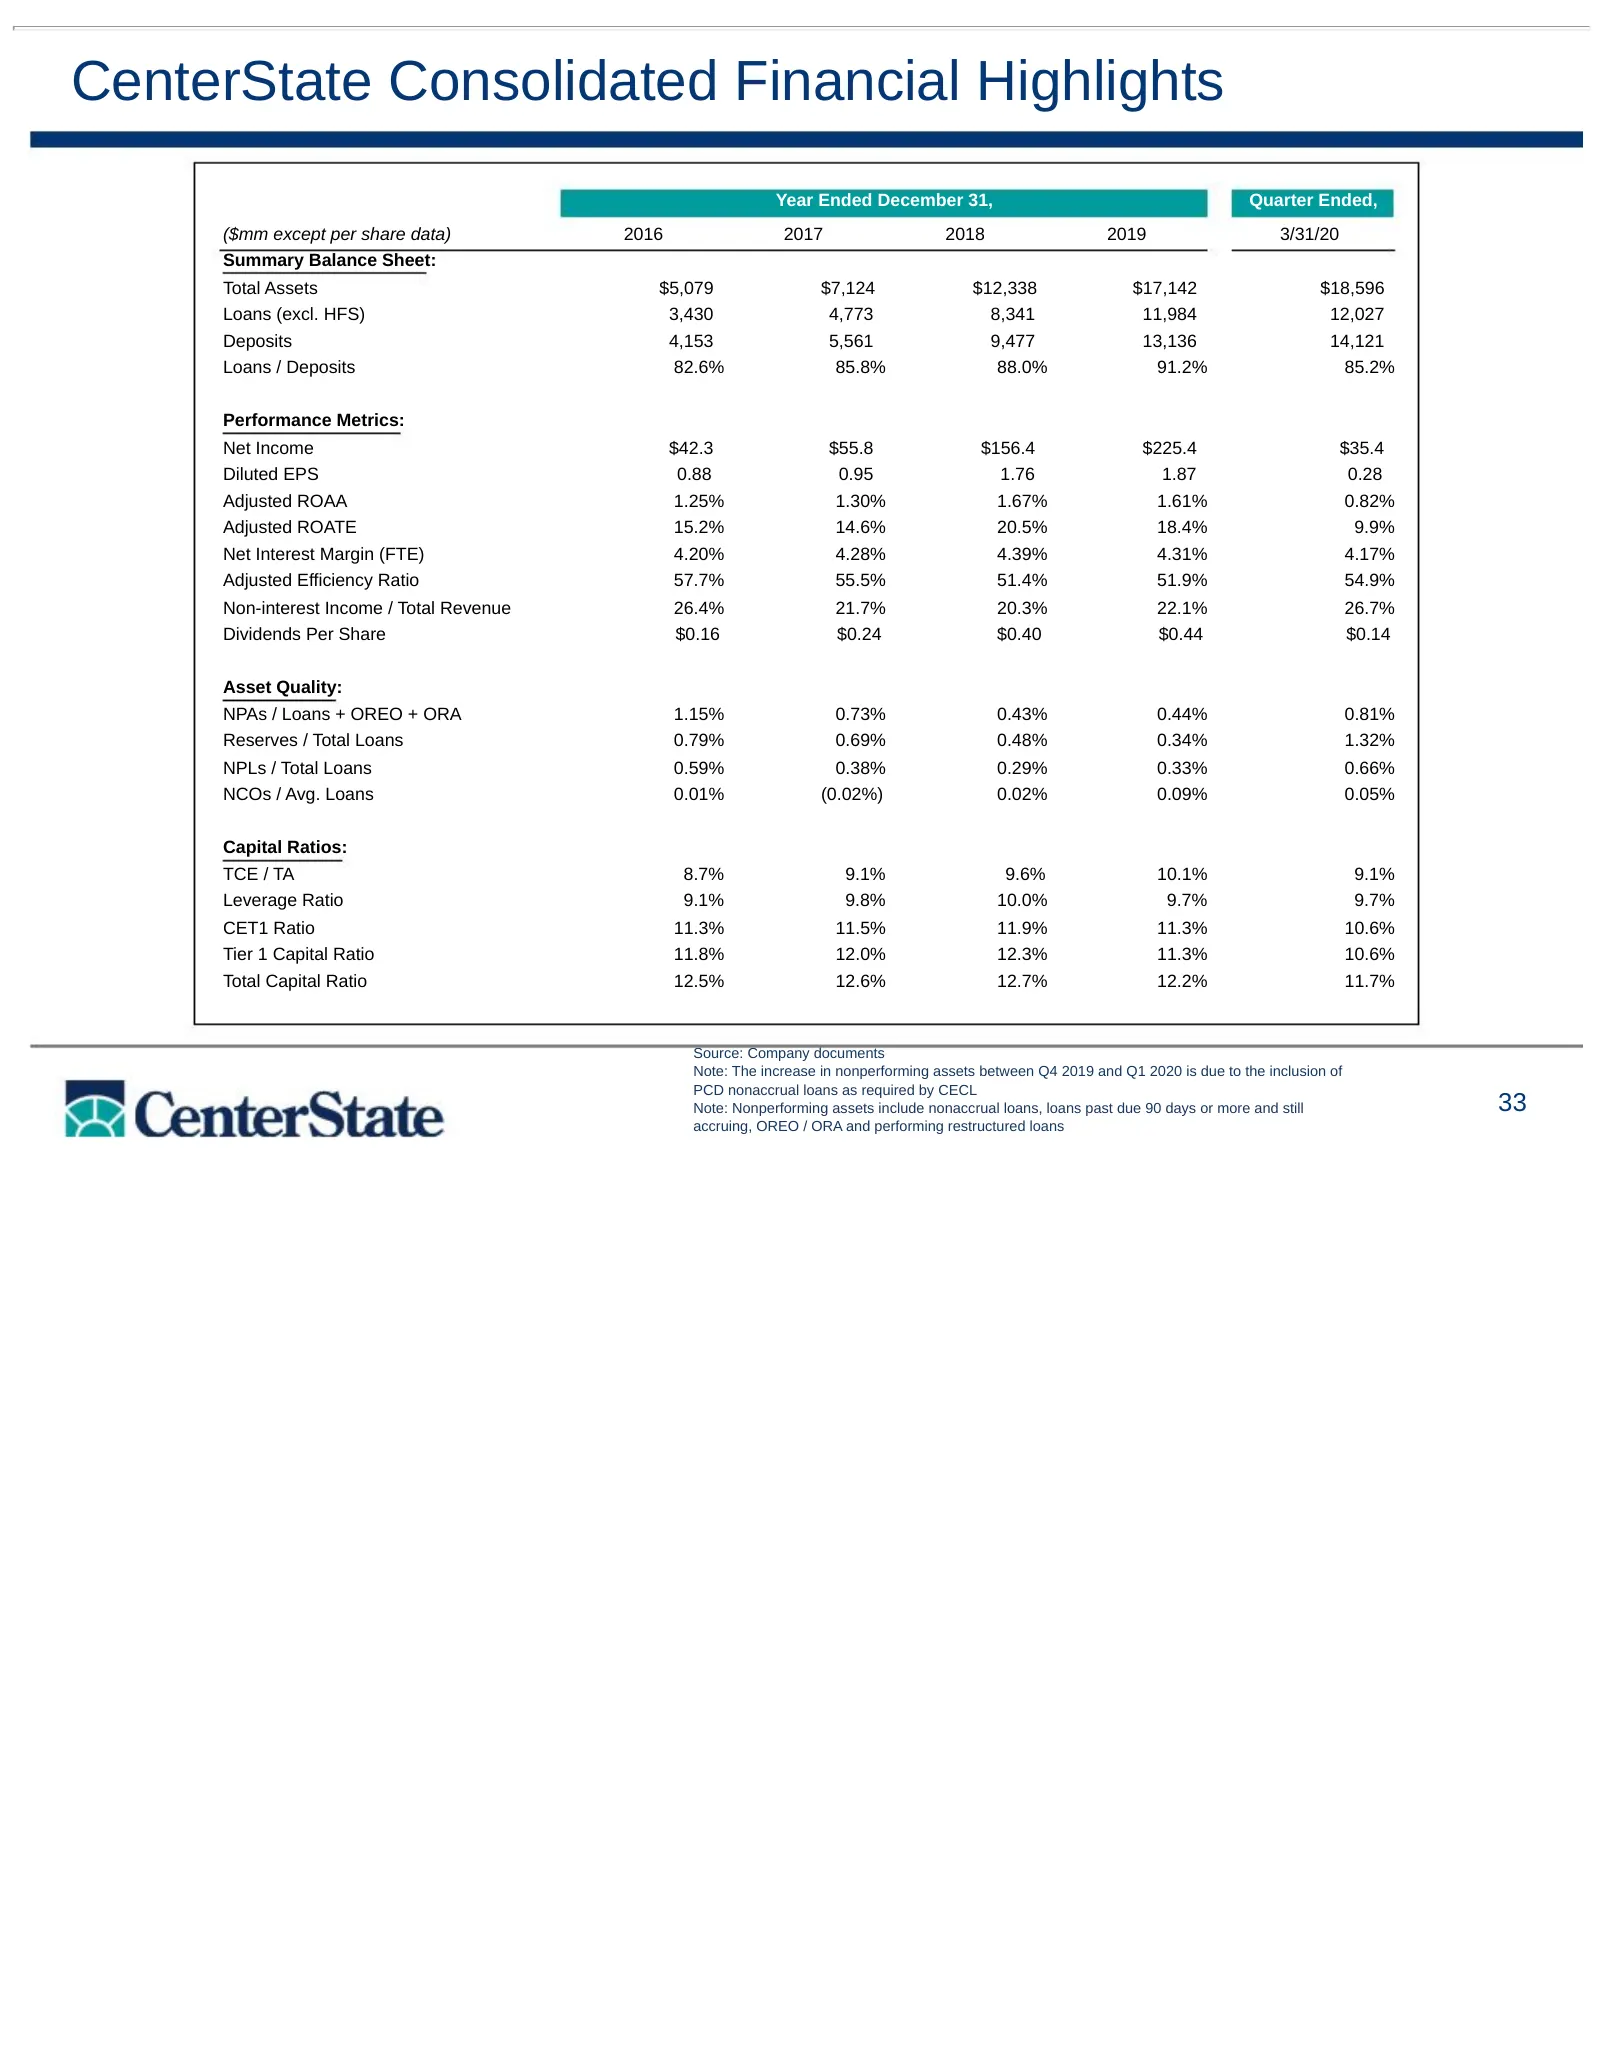
Slide 33: CenterState Consolidated Financial Highlights
CenterState Consolidated Financial Highlights Year Ended December 31, Quarter Ended, ($mm except per share data) 2016 2017 2018 2019 3/31/20 Summary Balance Sheet: Total Assets $5,079 $7,124 $12,338 $17,142 $18,596 Loans (excl. HFS) 3,430 4,773 8,341 11,984 12,027 Deposits 4,153 5,561 9,477 13,136 1
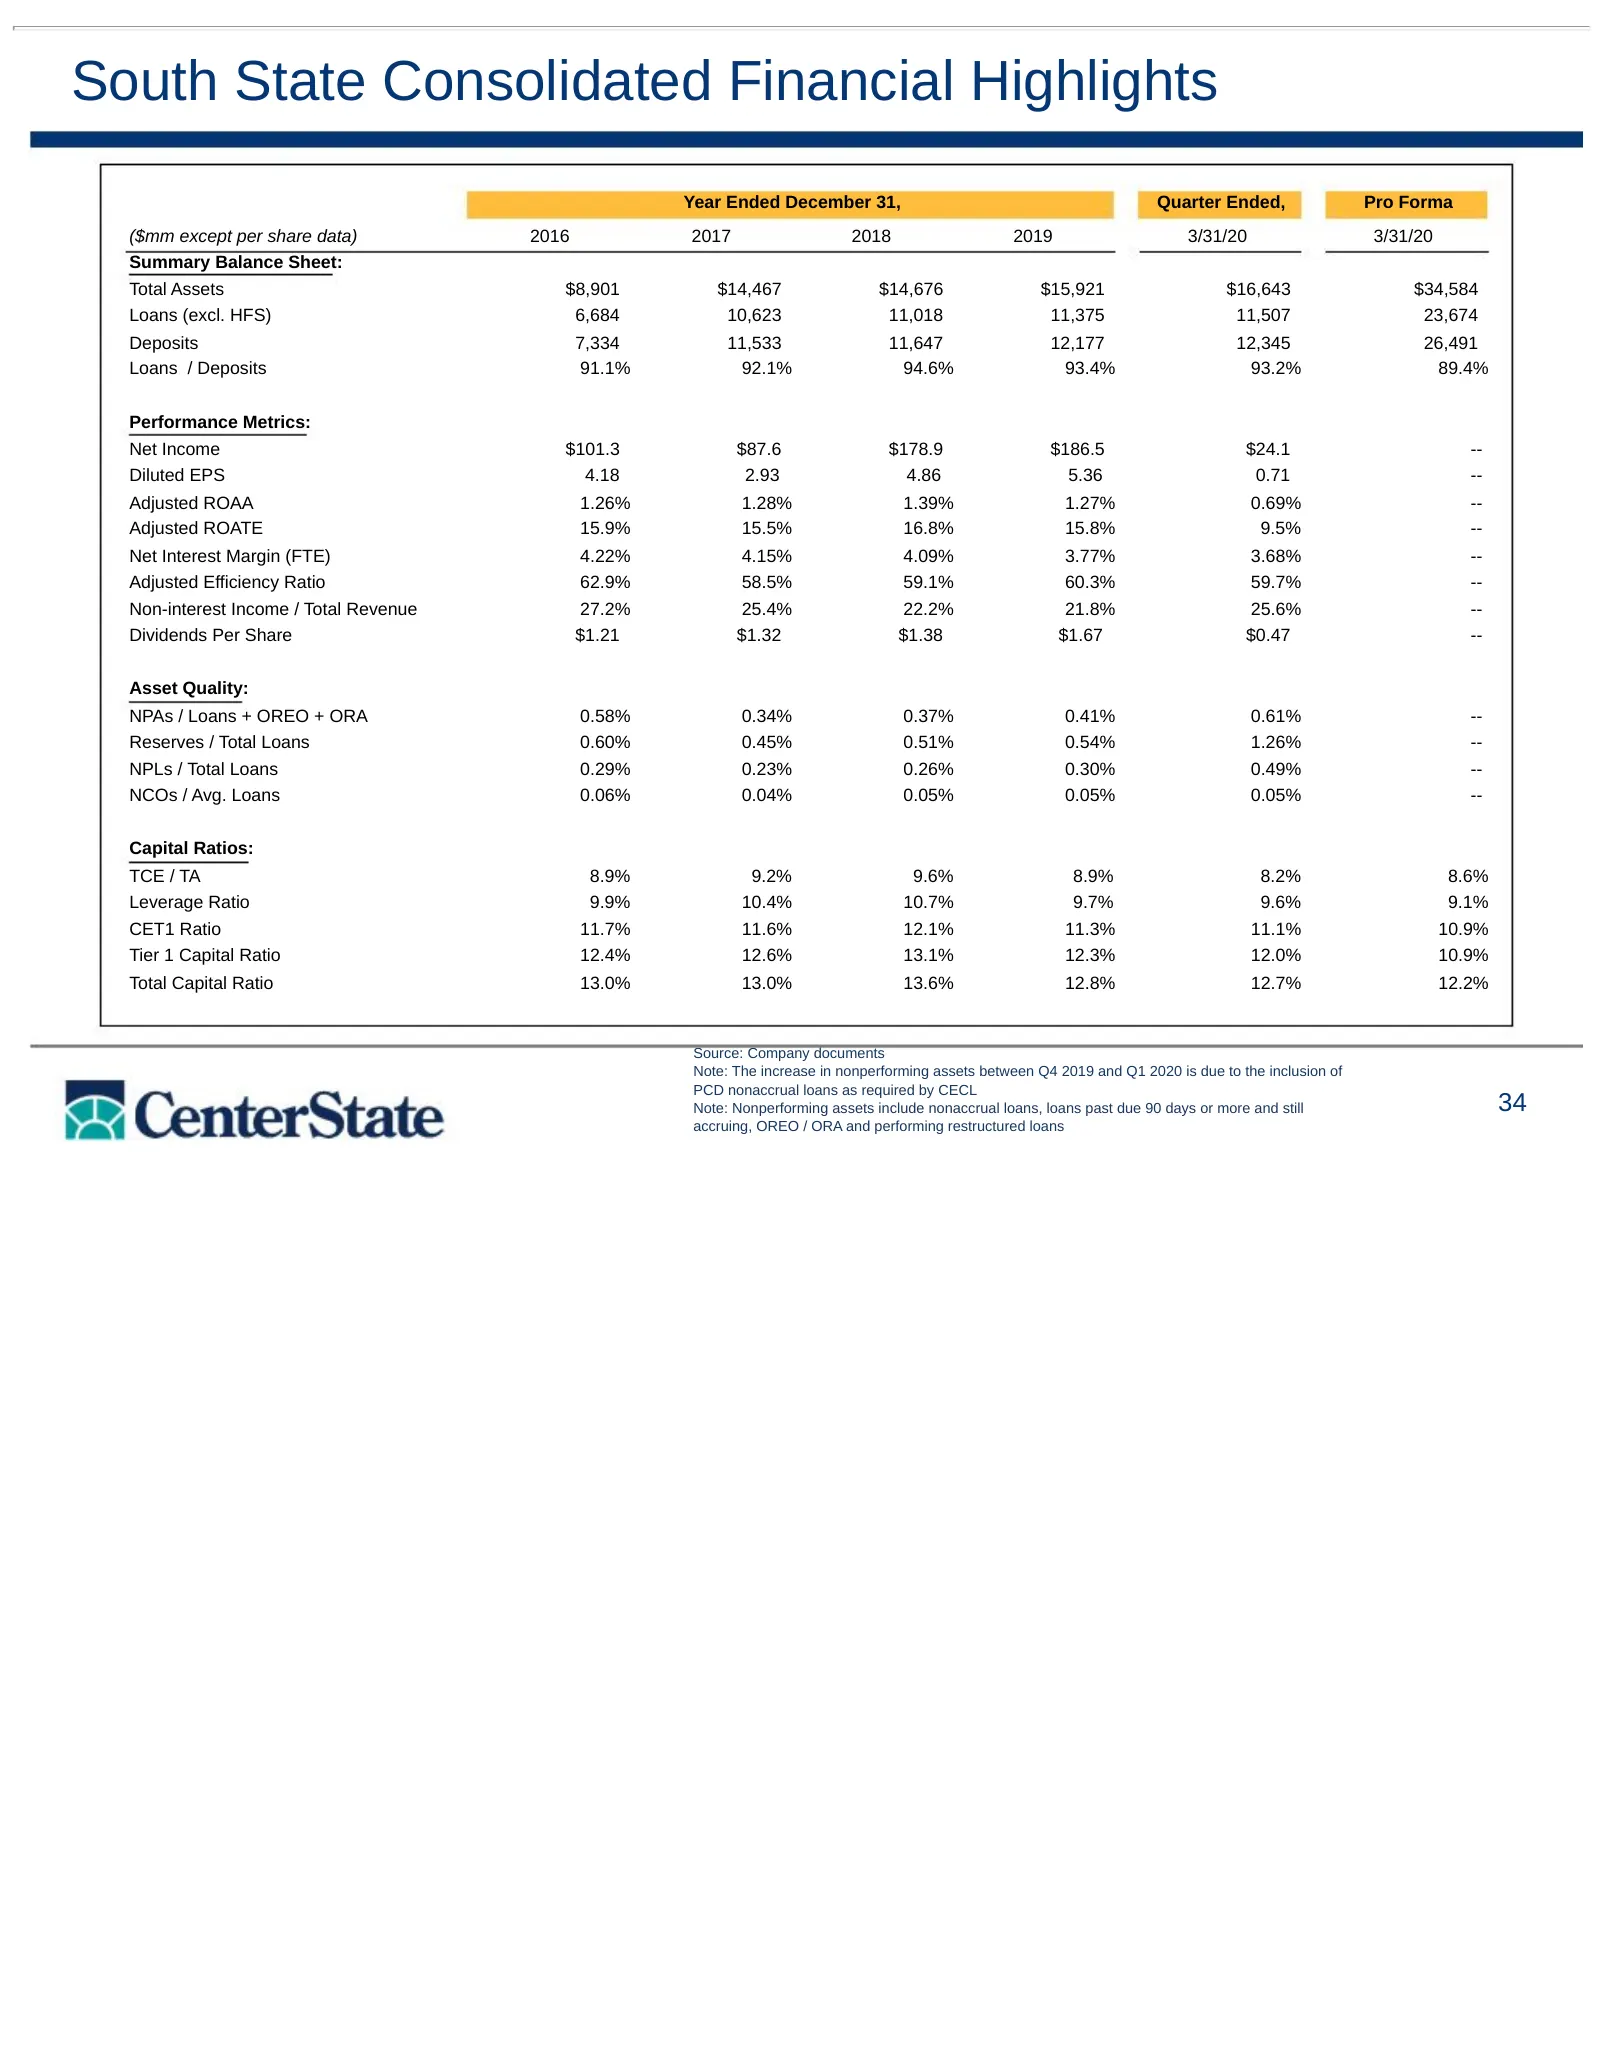
Slide 34: South State Consolidated Financial Highlights
South State Consolidated Financial Highlights Year Ended December 31, Quarter Ended, Pro Forma ($mm except per share data) 2016 2017 2018 2019 3/31/20 3/31/20 Summary Balance Sheet: Total Assets $8,901 $14,467 $14,676 $15,921 $16,643 $34,584 Loans (excl. HFS) 6,684 10,623 11,018 11,375 11,507 23,674
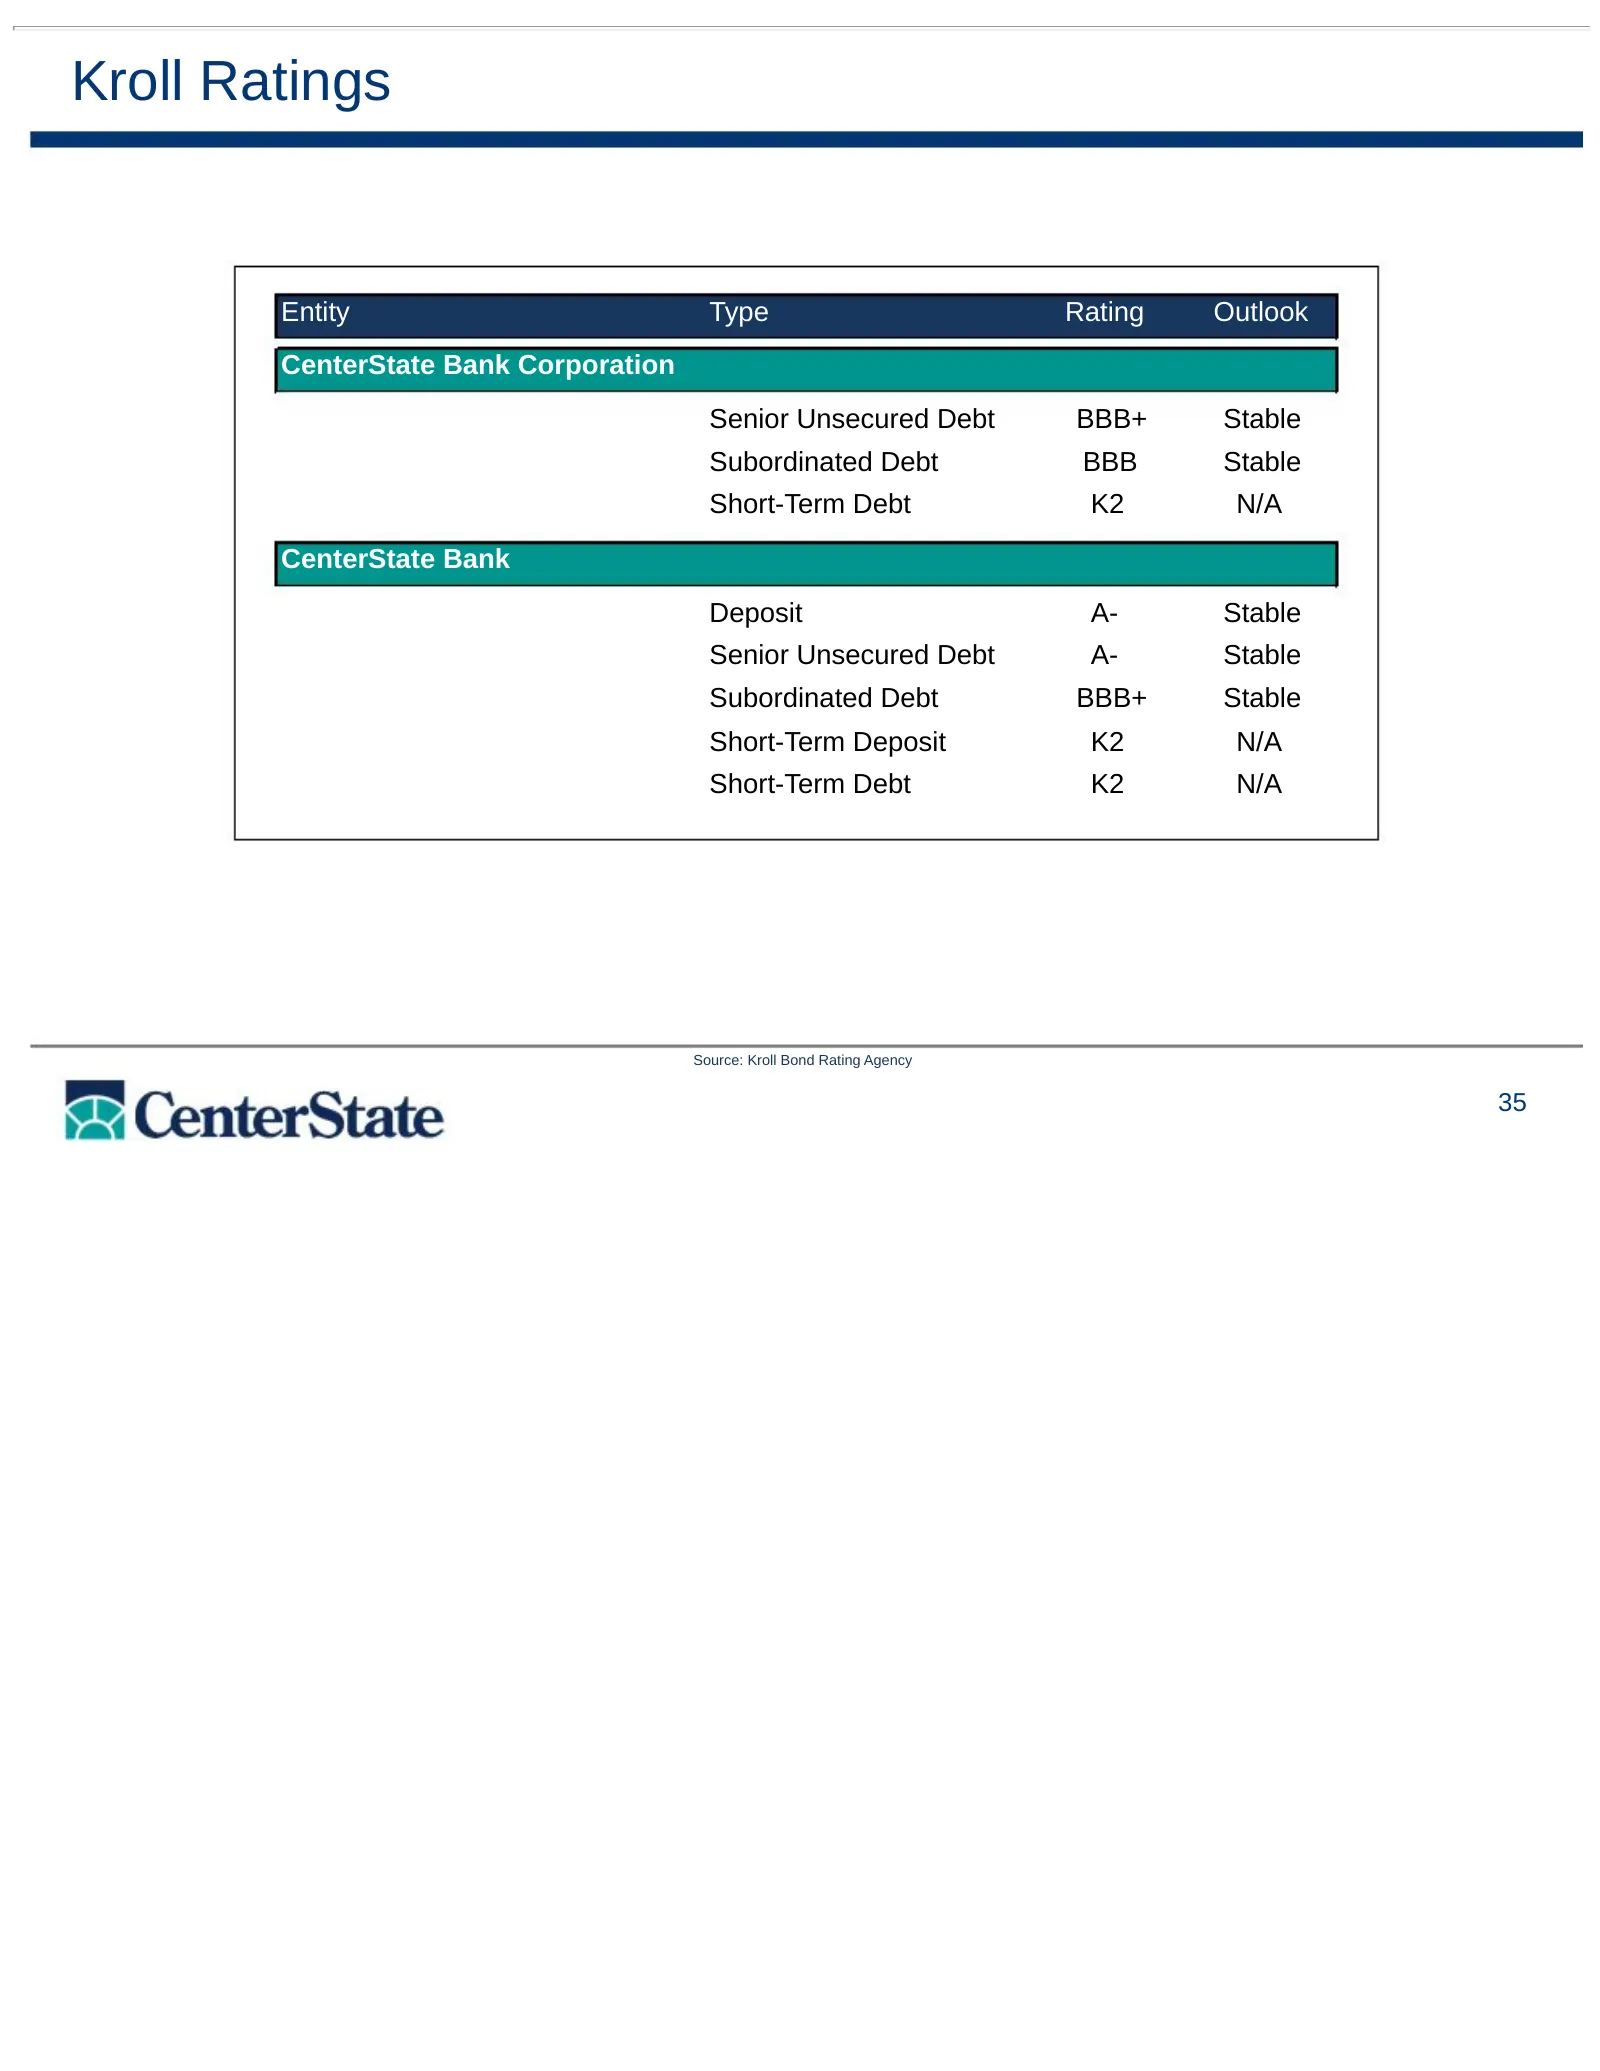
Slide 35: Kroll Ratings
Kroll Ratings Entity Type Rating Outlook CenterState Bank Corporation Senior Unsecured Debt BBB+ Stable Subordinated Debt BBB Stable Short-Term Debt K2 N/A CenterState Bank Deposit A- Stable Senior Unsecured Debt A- Stable Subordinated Debt BBB+ Stable Short-Term Deposit K2 N/A Short-Term Debt K2 N/
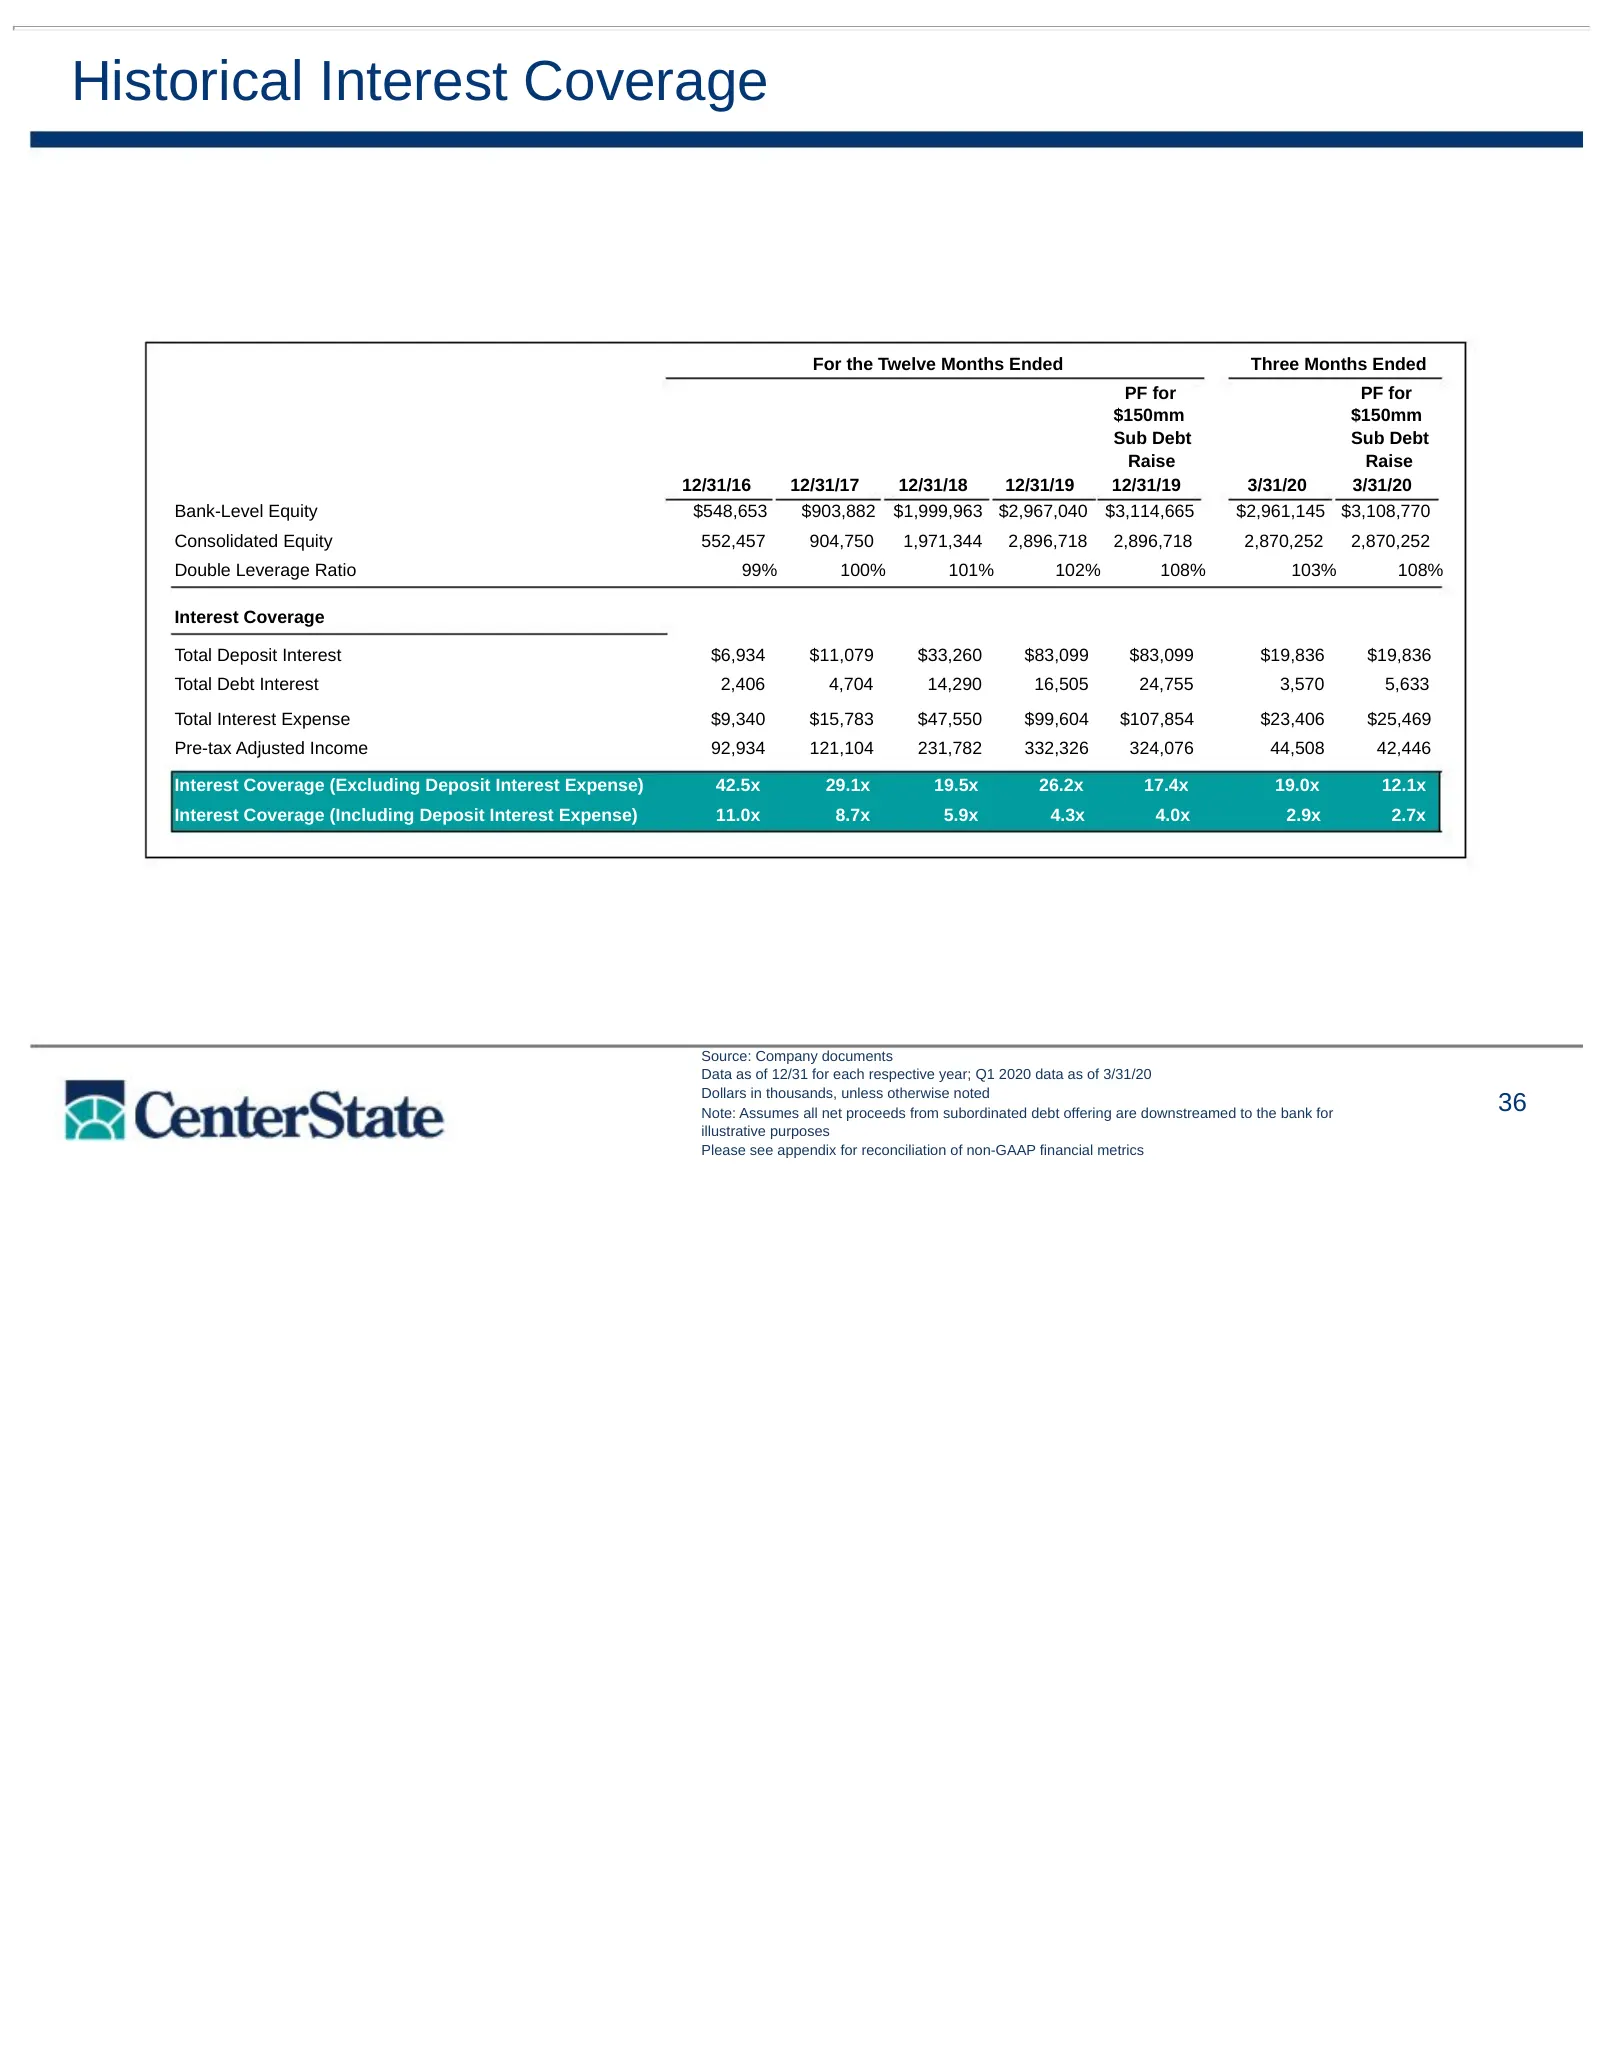
Slide 36: Historical Interest Coverage
Historical Interest Coverage For the Twelve Months Ended Three Months Ended PF for PF for $150mm $150mm Sub Debt Sub Debt Raise Raise 12/31/16 12/31/17 12/31/18 12/31/19 12/31/19 3/31/20 3/31/20 Bank-Level Equity $548,653 $903,882 $1,999,963 $2,967,040 $3,114,665 $2,961,145 $3,108,770 Consolidated E
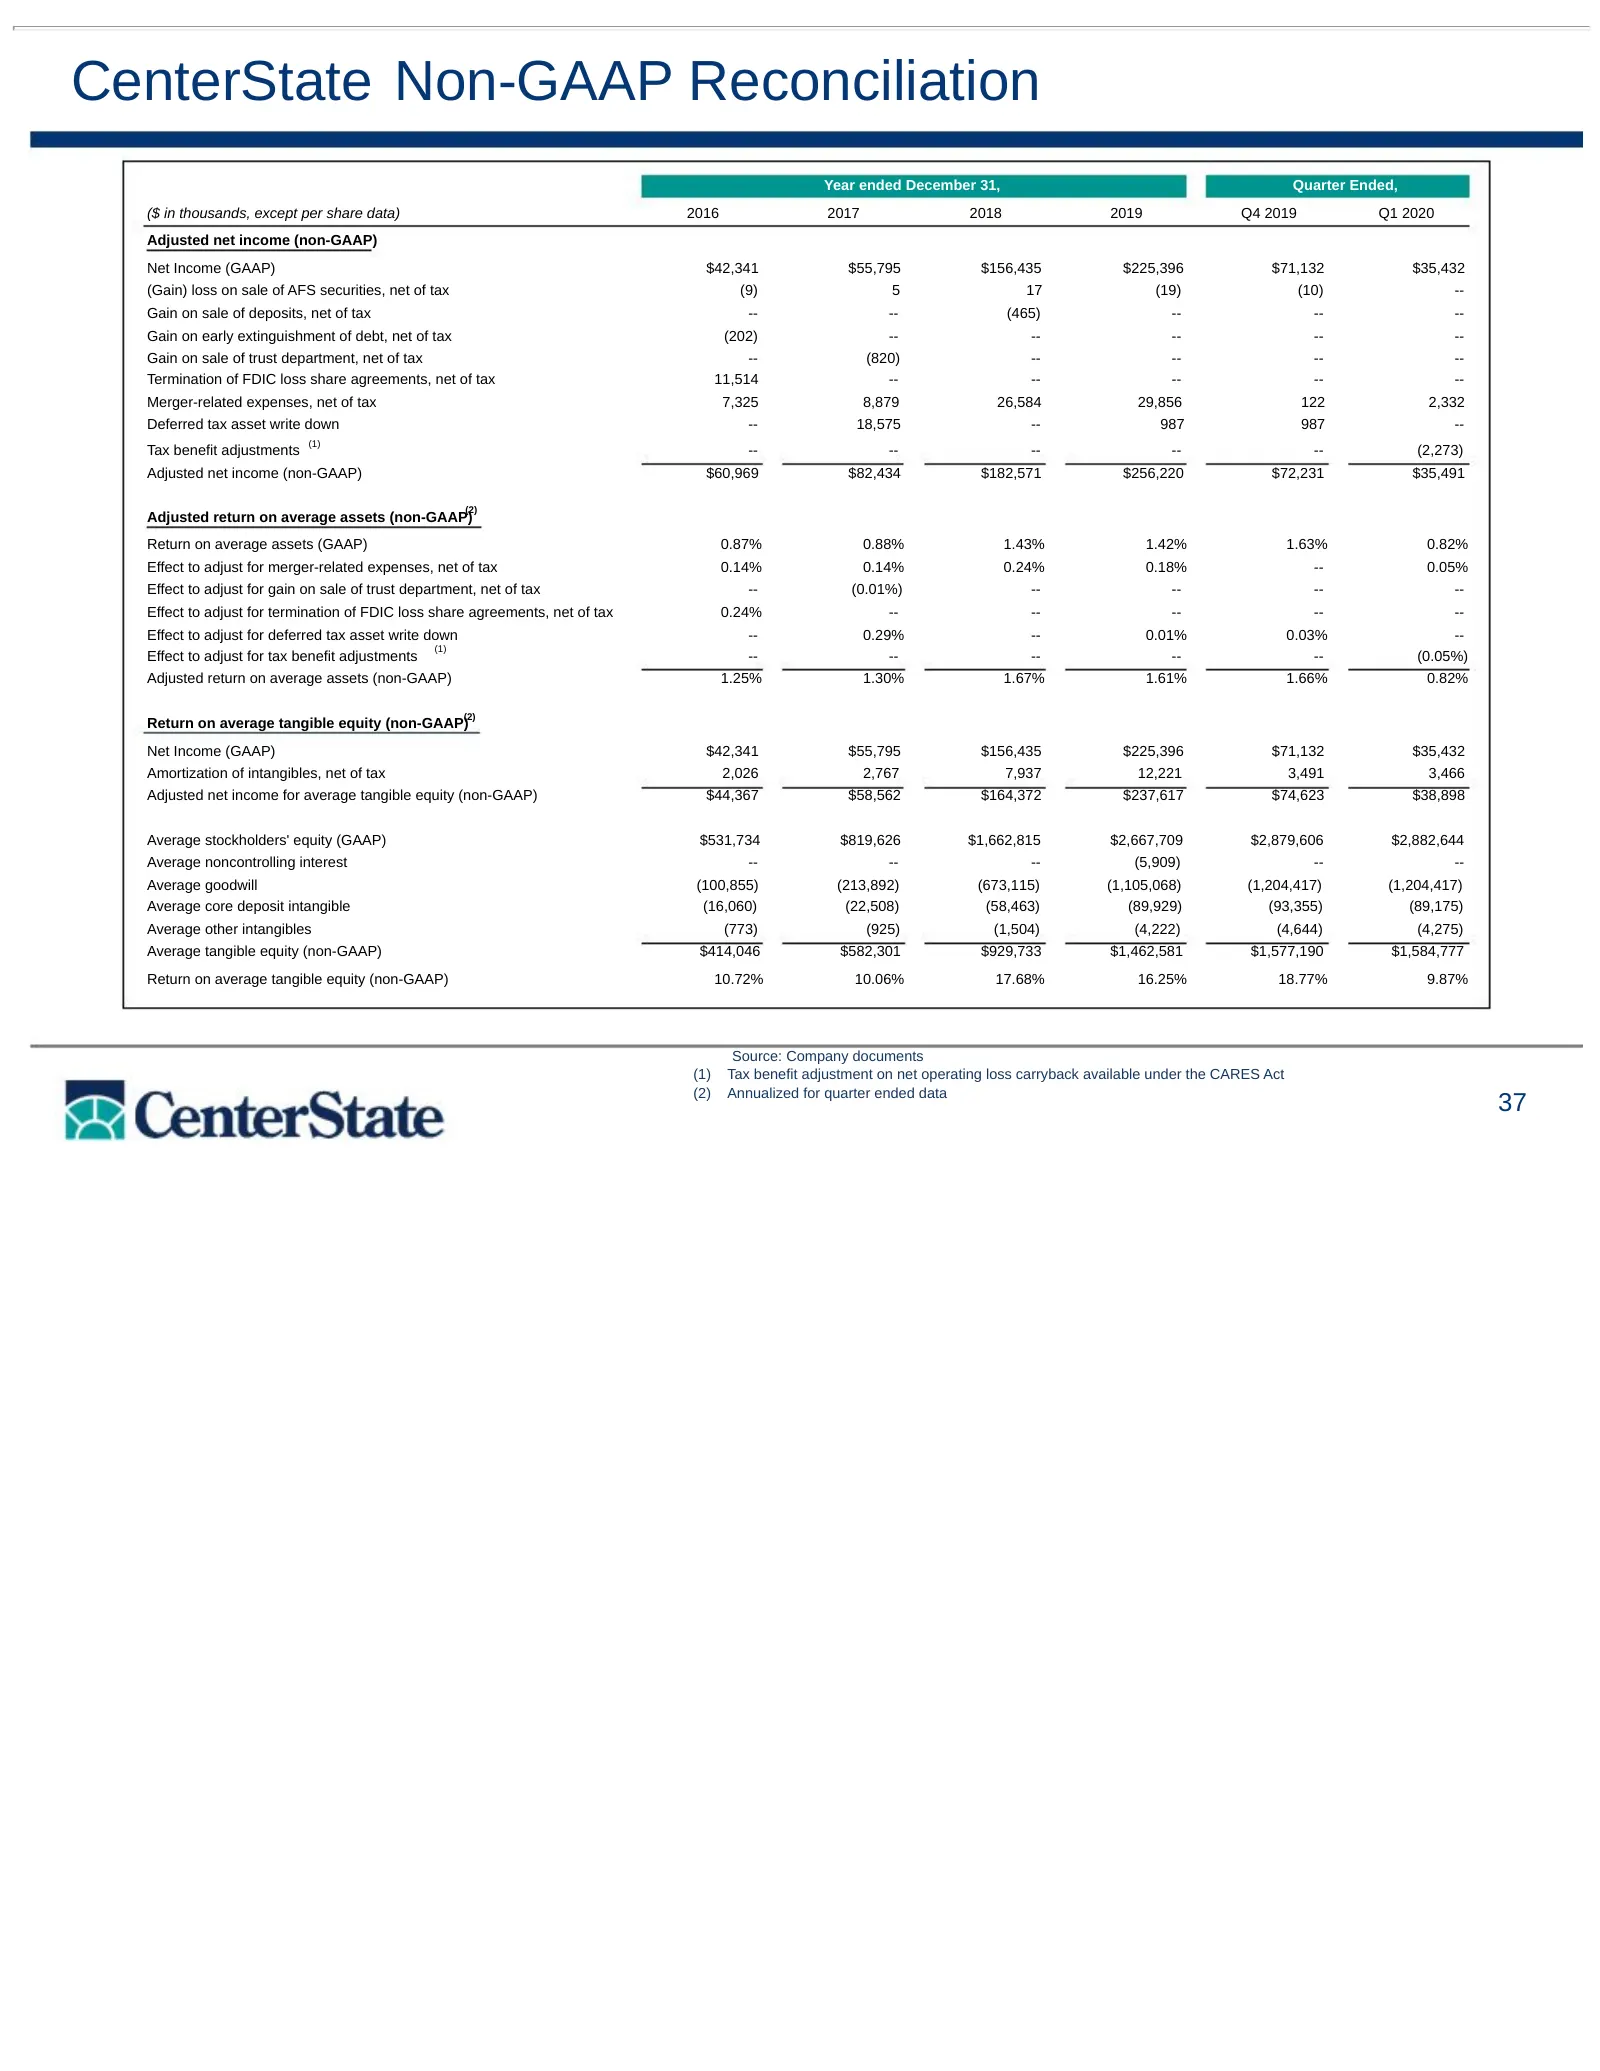
Slide 37: CenterState Non-GAAP Reconciliation
CenterState Non-GAAP Reconciliation Year ended December 31, Quarter Ended, ($ in thousands, except per share data) 2016 2017 2018 2019 Q4 2019 Q1 2020 Adjusted net income (non-GAAP) Net Income (GAAP) $42,341 $55,795 $156,435 $225,396 $71,132 $35,432 (Gain) loss on sale of AFS securities, net of tax
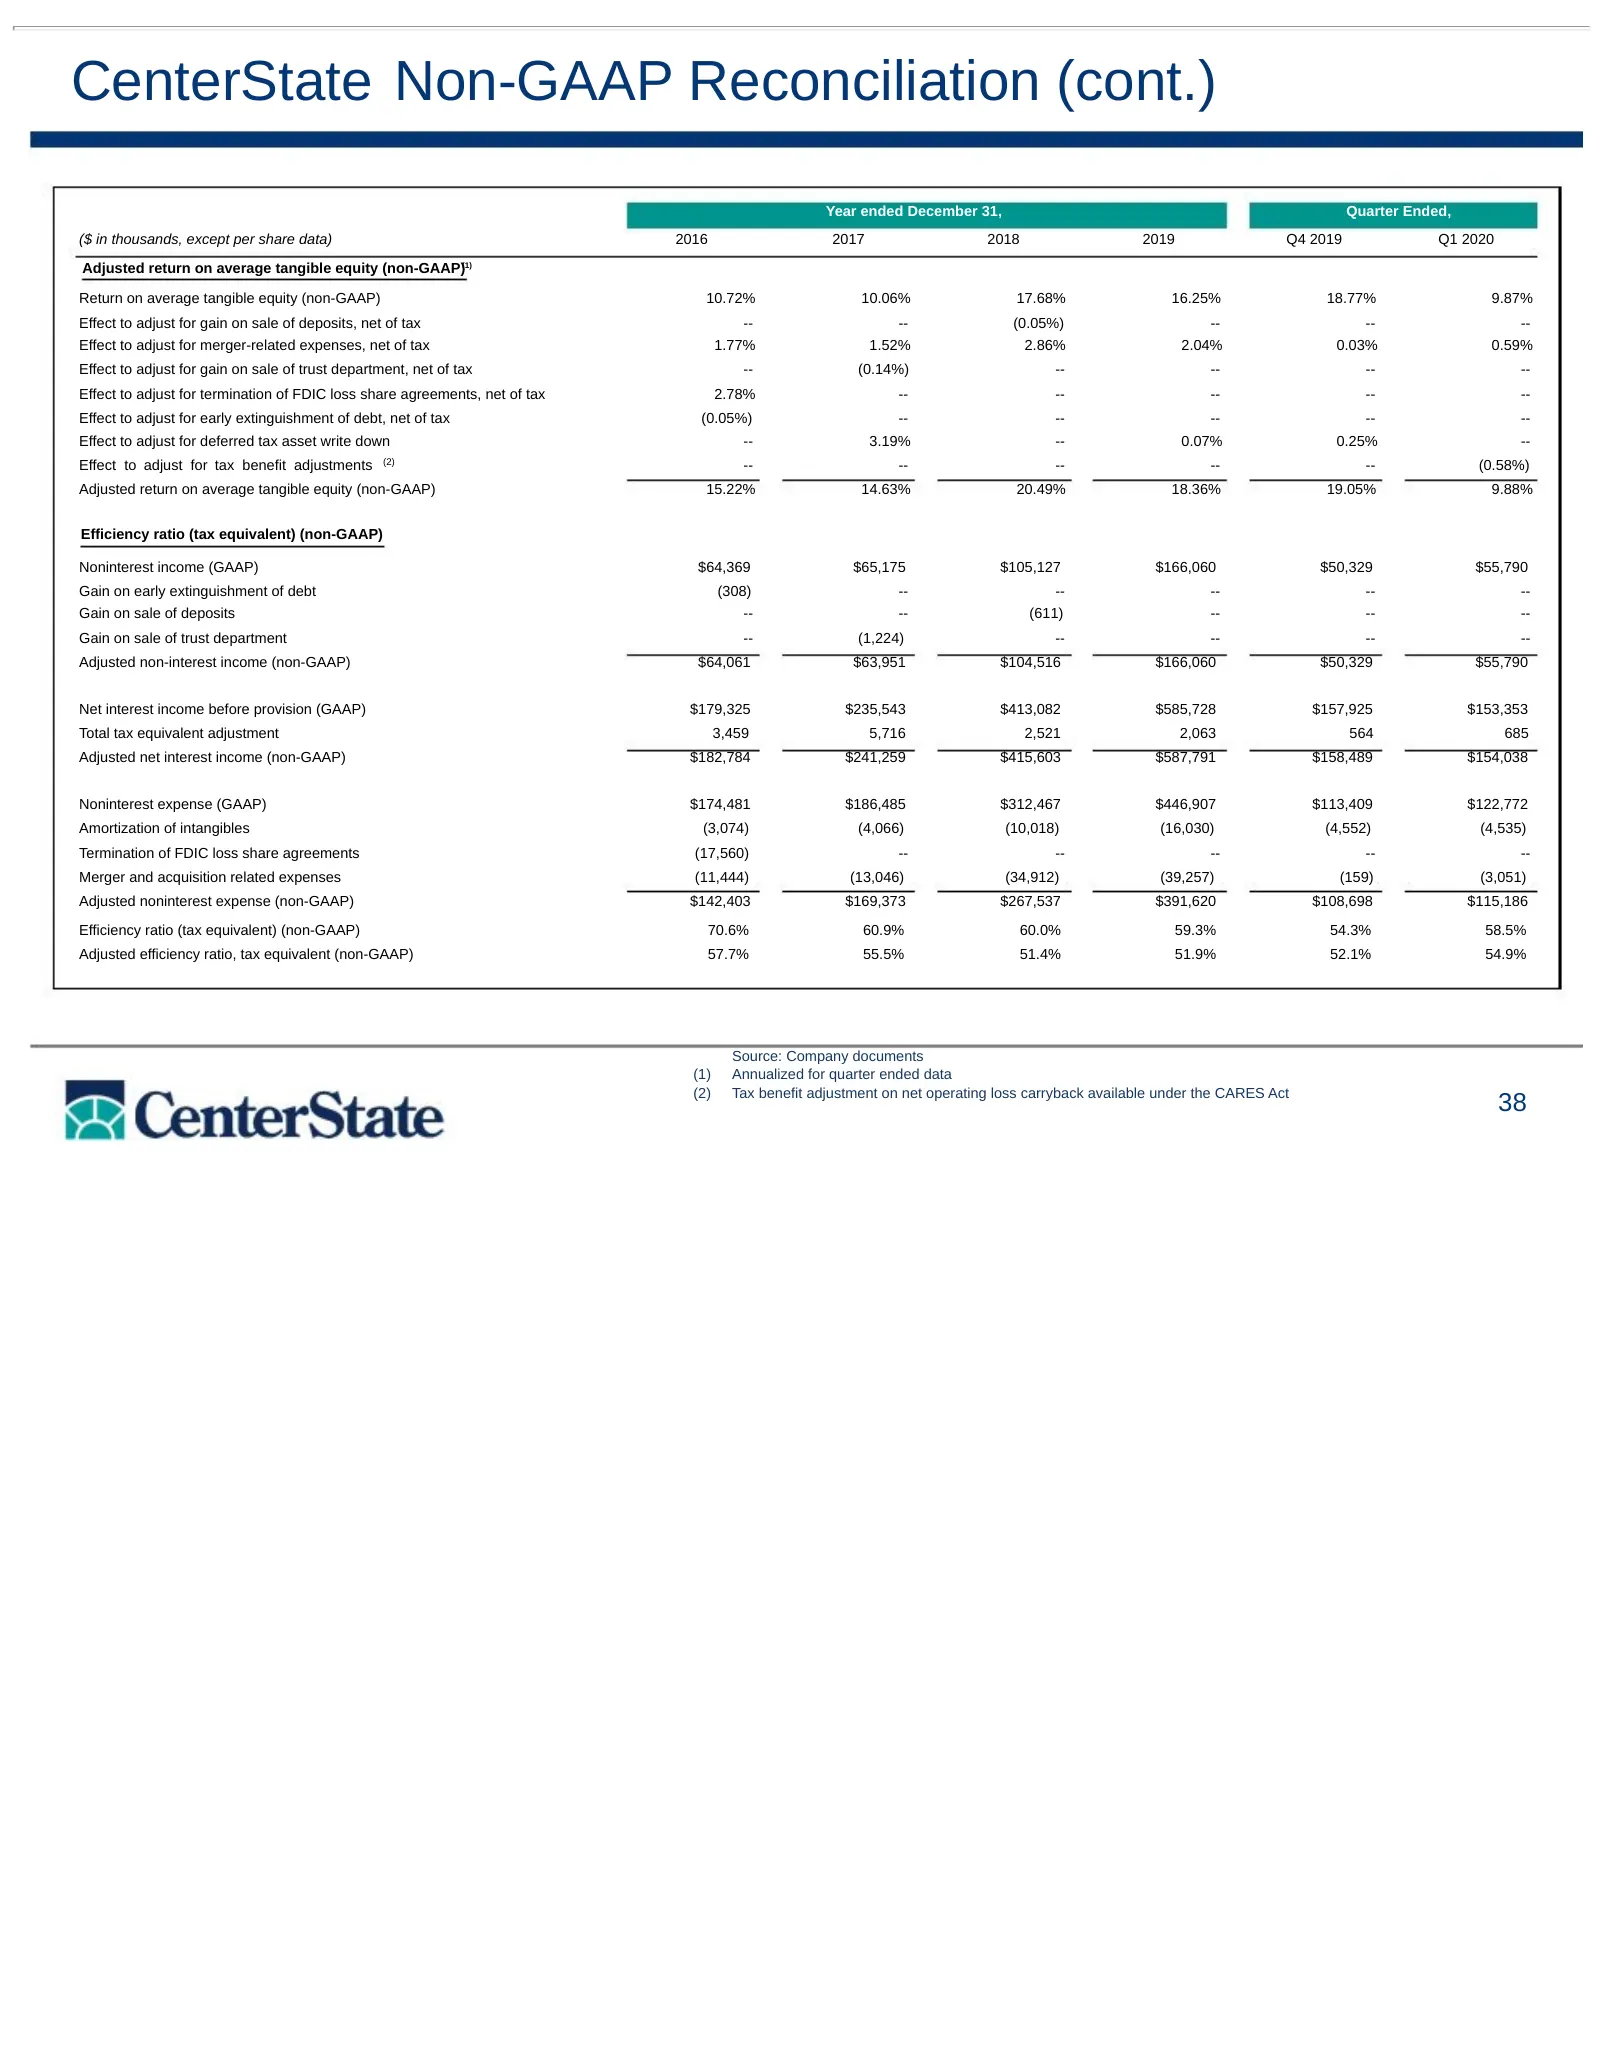
Slide 38: CenterState Non-GAAP Reconciliation (cont.)
CenterState Non-GAAP Reconciliation (cont.) Year ended December 31, Quarter Ended, ($ in thousands, except per share data) 2016 2017 2018 2019 Q4 2019 Q1 2020 Adjusted return on average tangible equity (non-GAAP)(1) Return on average tangible equity (non-GAAP) 10.72% 10.06% 17.68% 16.25% 18.77% 9.87
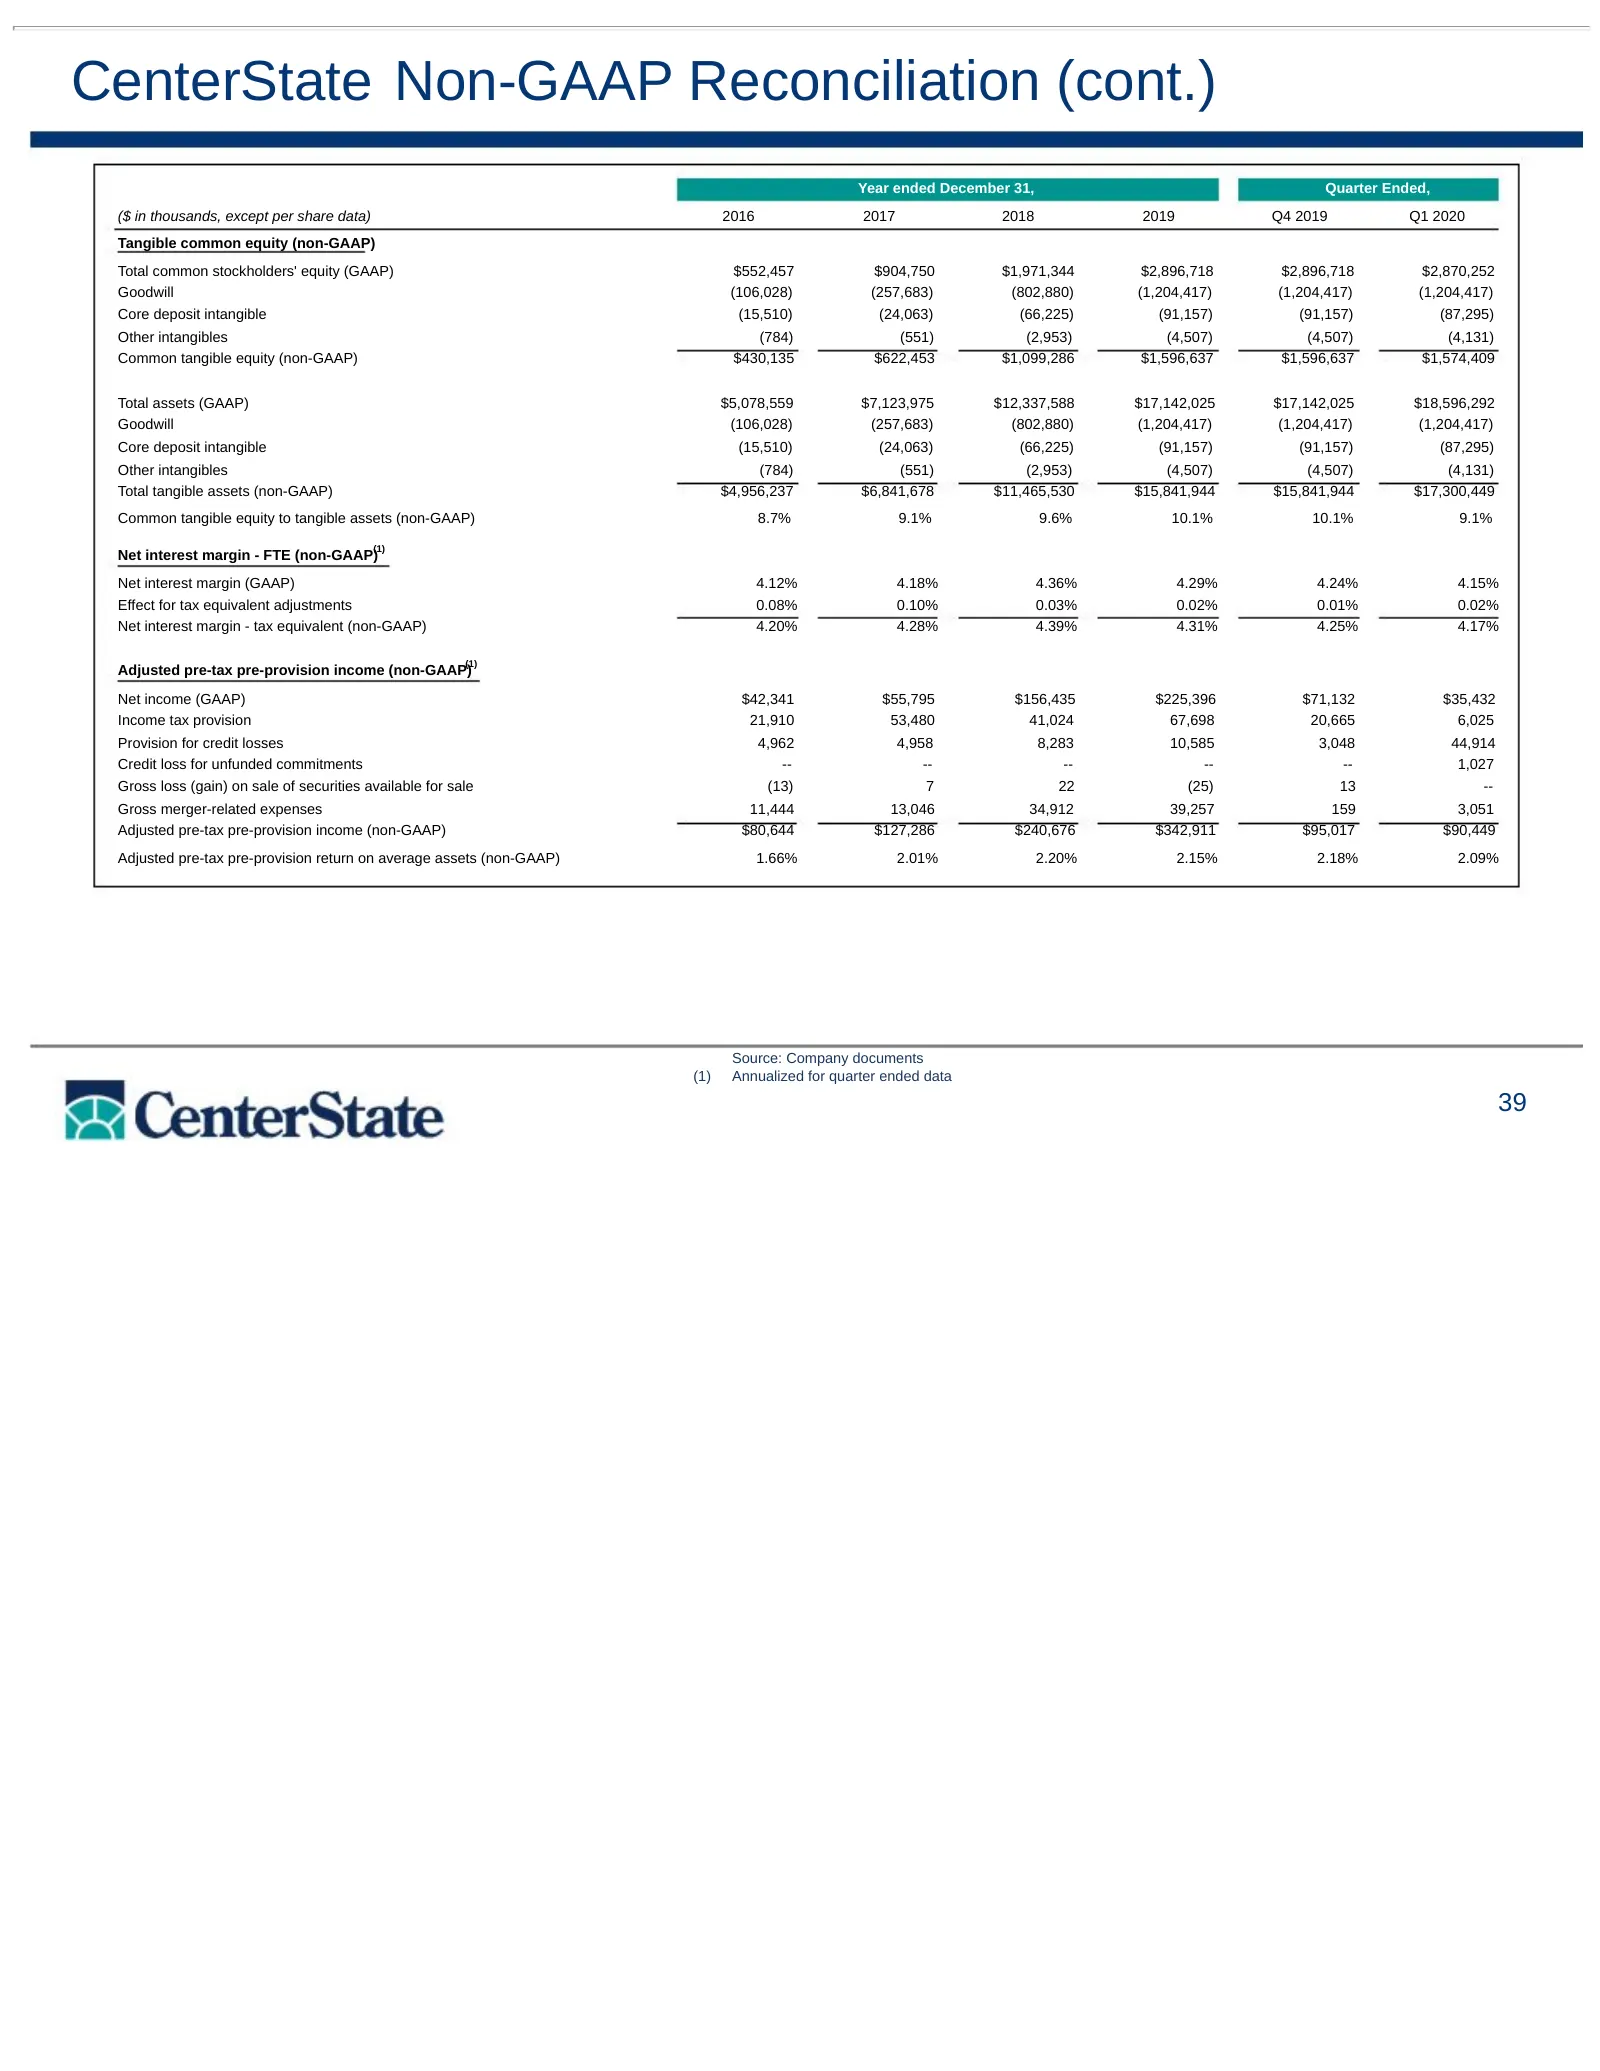
Slide 39: CenterState Non-GAAP Reconciliation (cont.)
CenterState Non-GAAP Reconciliation (cont.) Year ended December 31, Quarter Ended, ($ in thousands, except per share data) 2016 2017 2018 2019 Q4 2019 Q1 2020 Tangible common equity (non-GAAP) Total common stockholders' equity (GAAP) $552,457 $904,750 $1,971,344 $2,896,718 $2,896,718 $2,870,252 Good
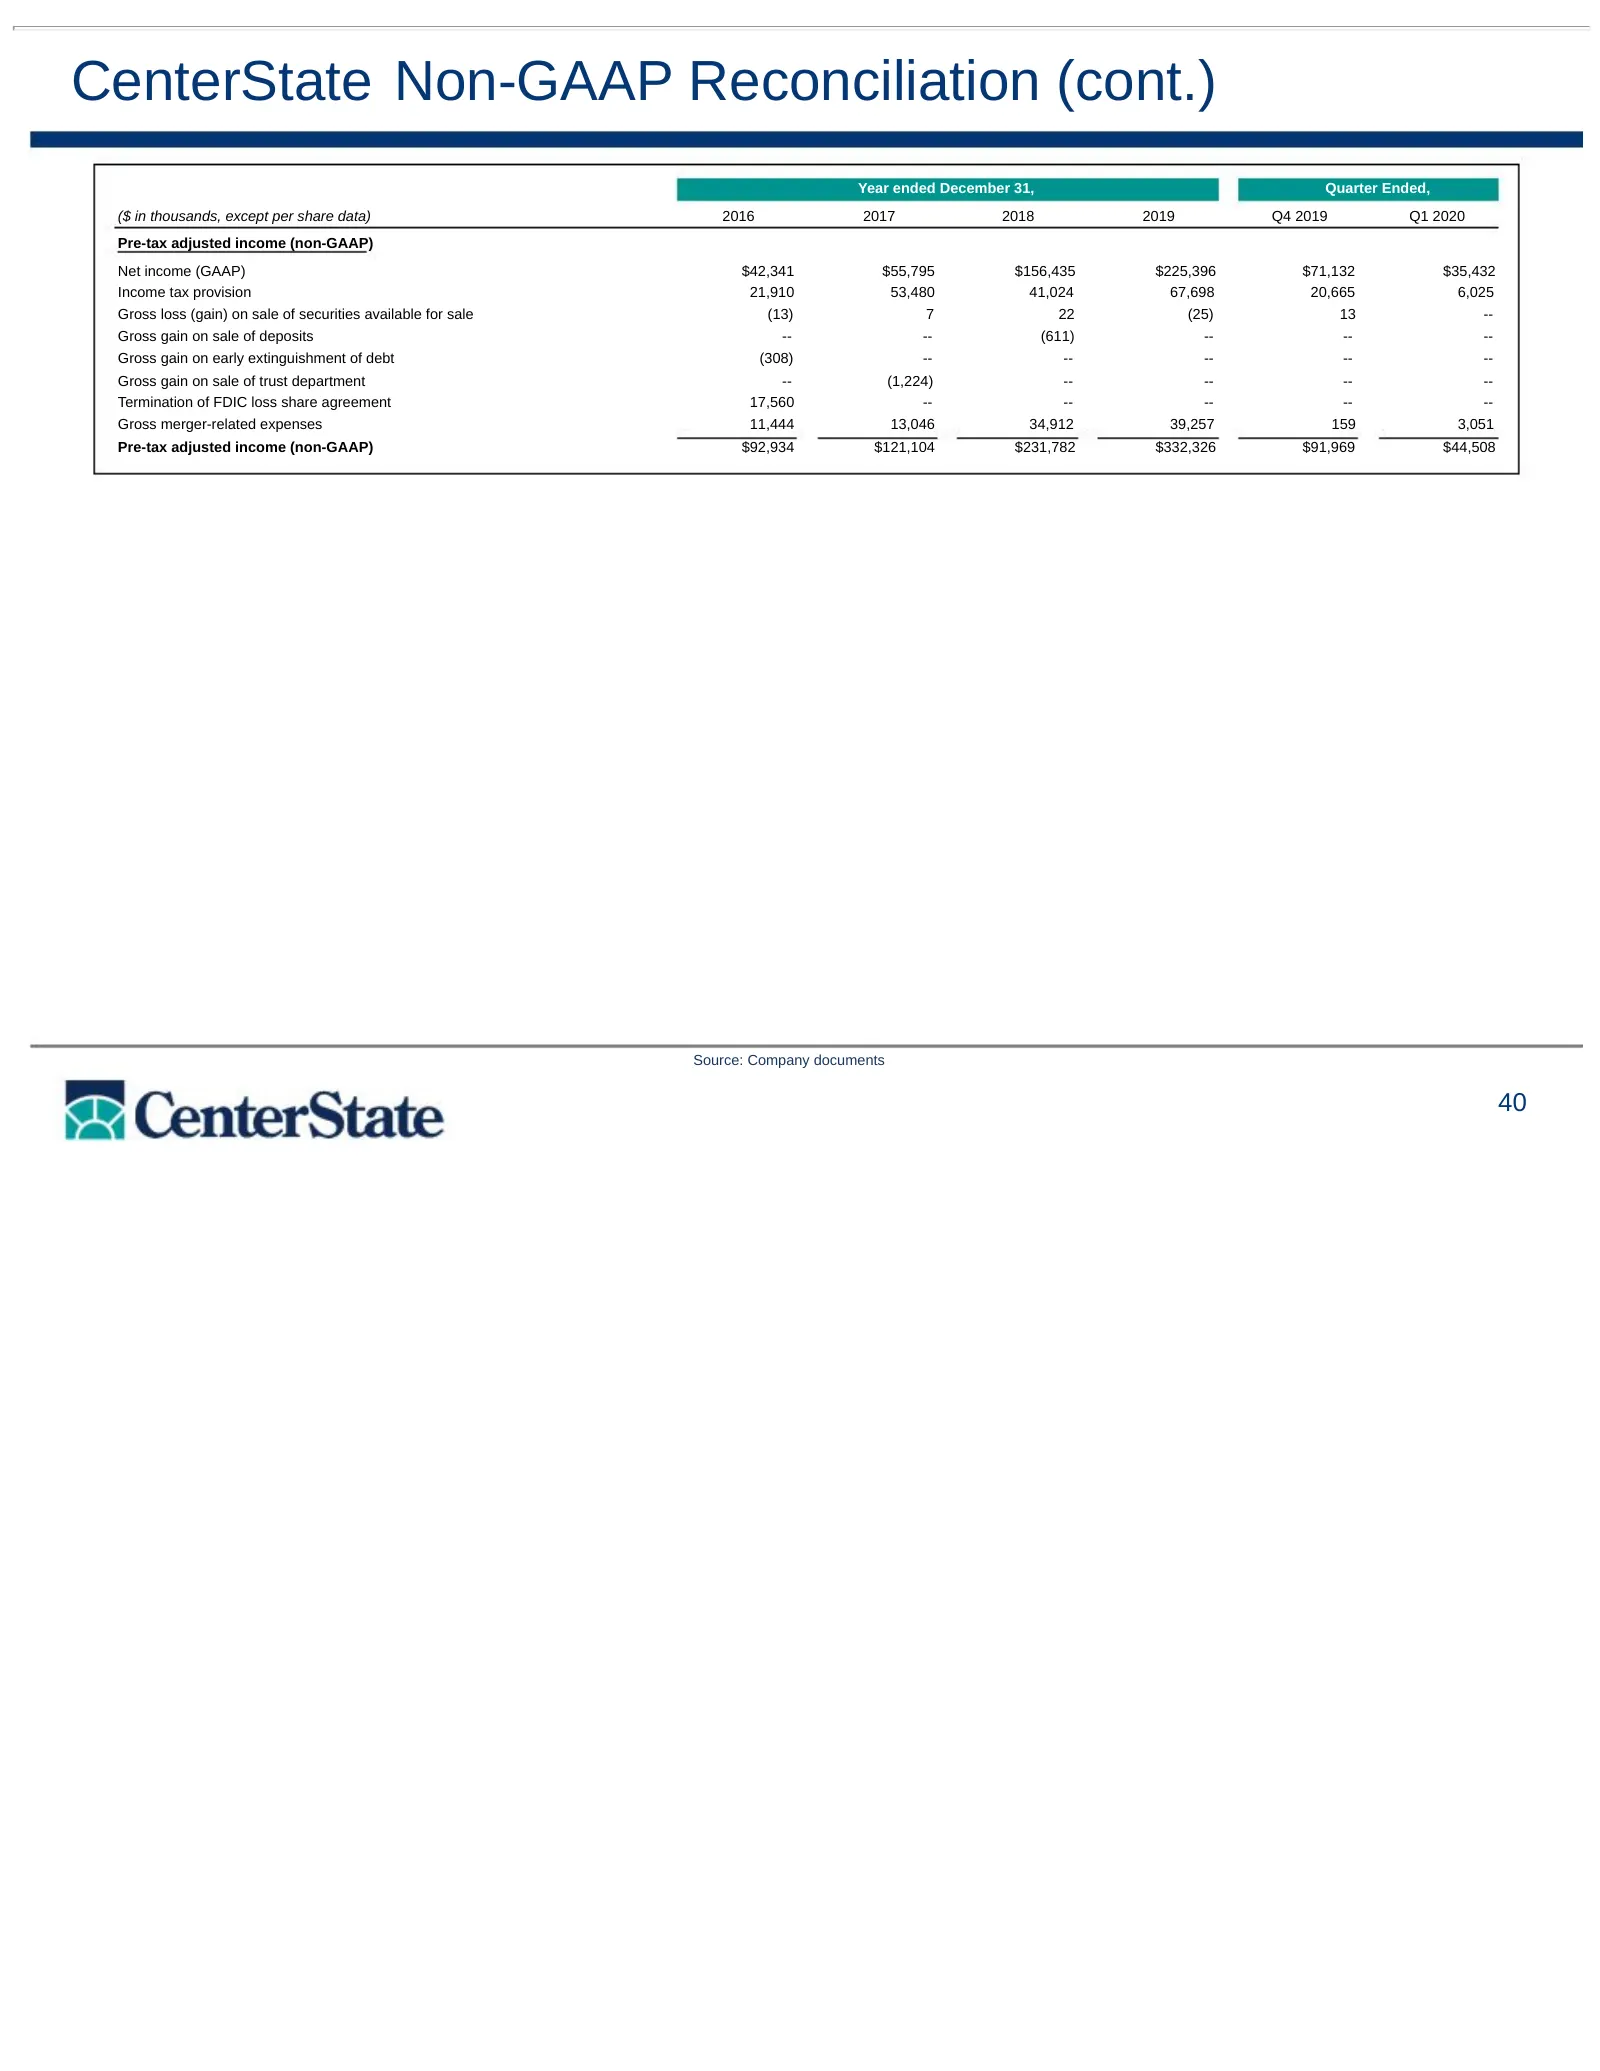
Slide 40: CenterState Non-GAAP Reconciliation (cont.)
CenterState Non-GAAP Reconciliation (cont.) Year ended December 31, Quarter Ended, ($ in thousands, except per share data) 2016 2017 2018 2019 Q4 2019 Q1 2020 Pre-tax adjusted income (non-GAAP) Net income (GAAP) $42,341 $55,795 $156,435 $225,396 $71,132 $35,432 Income tax provision 21,910 53,480 41,
Slide 41: South State Non-GAAP Reconciliation
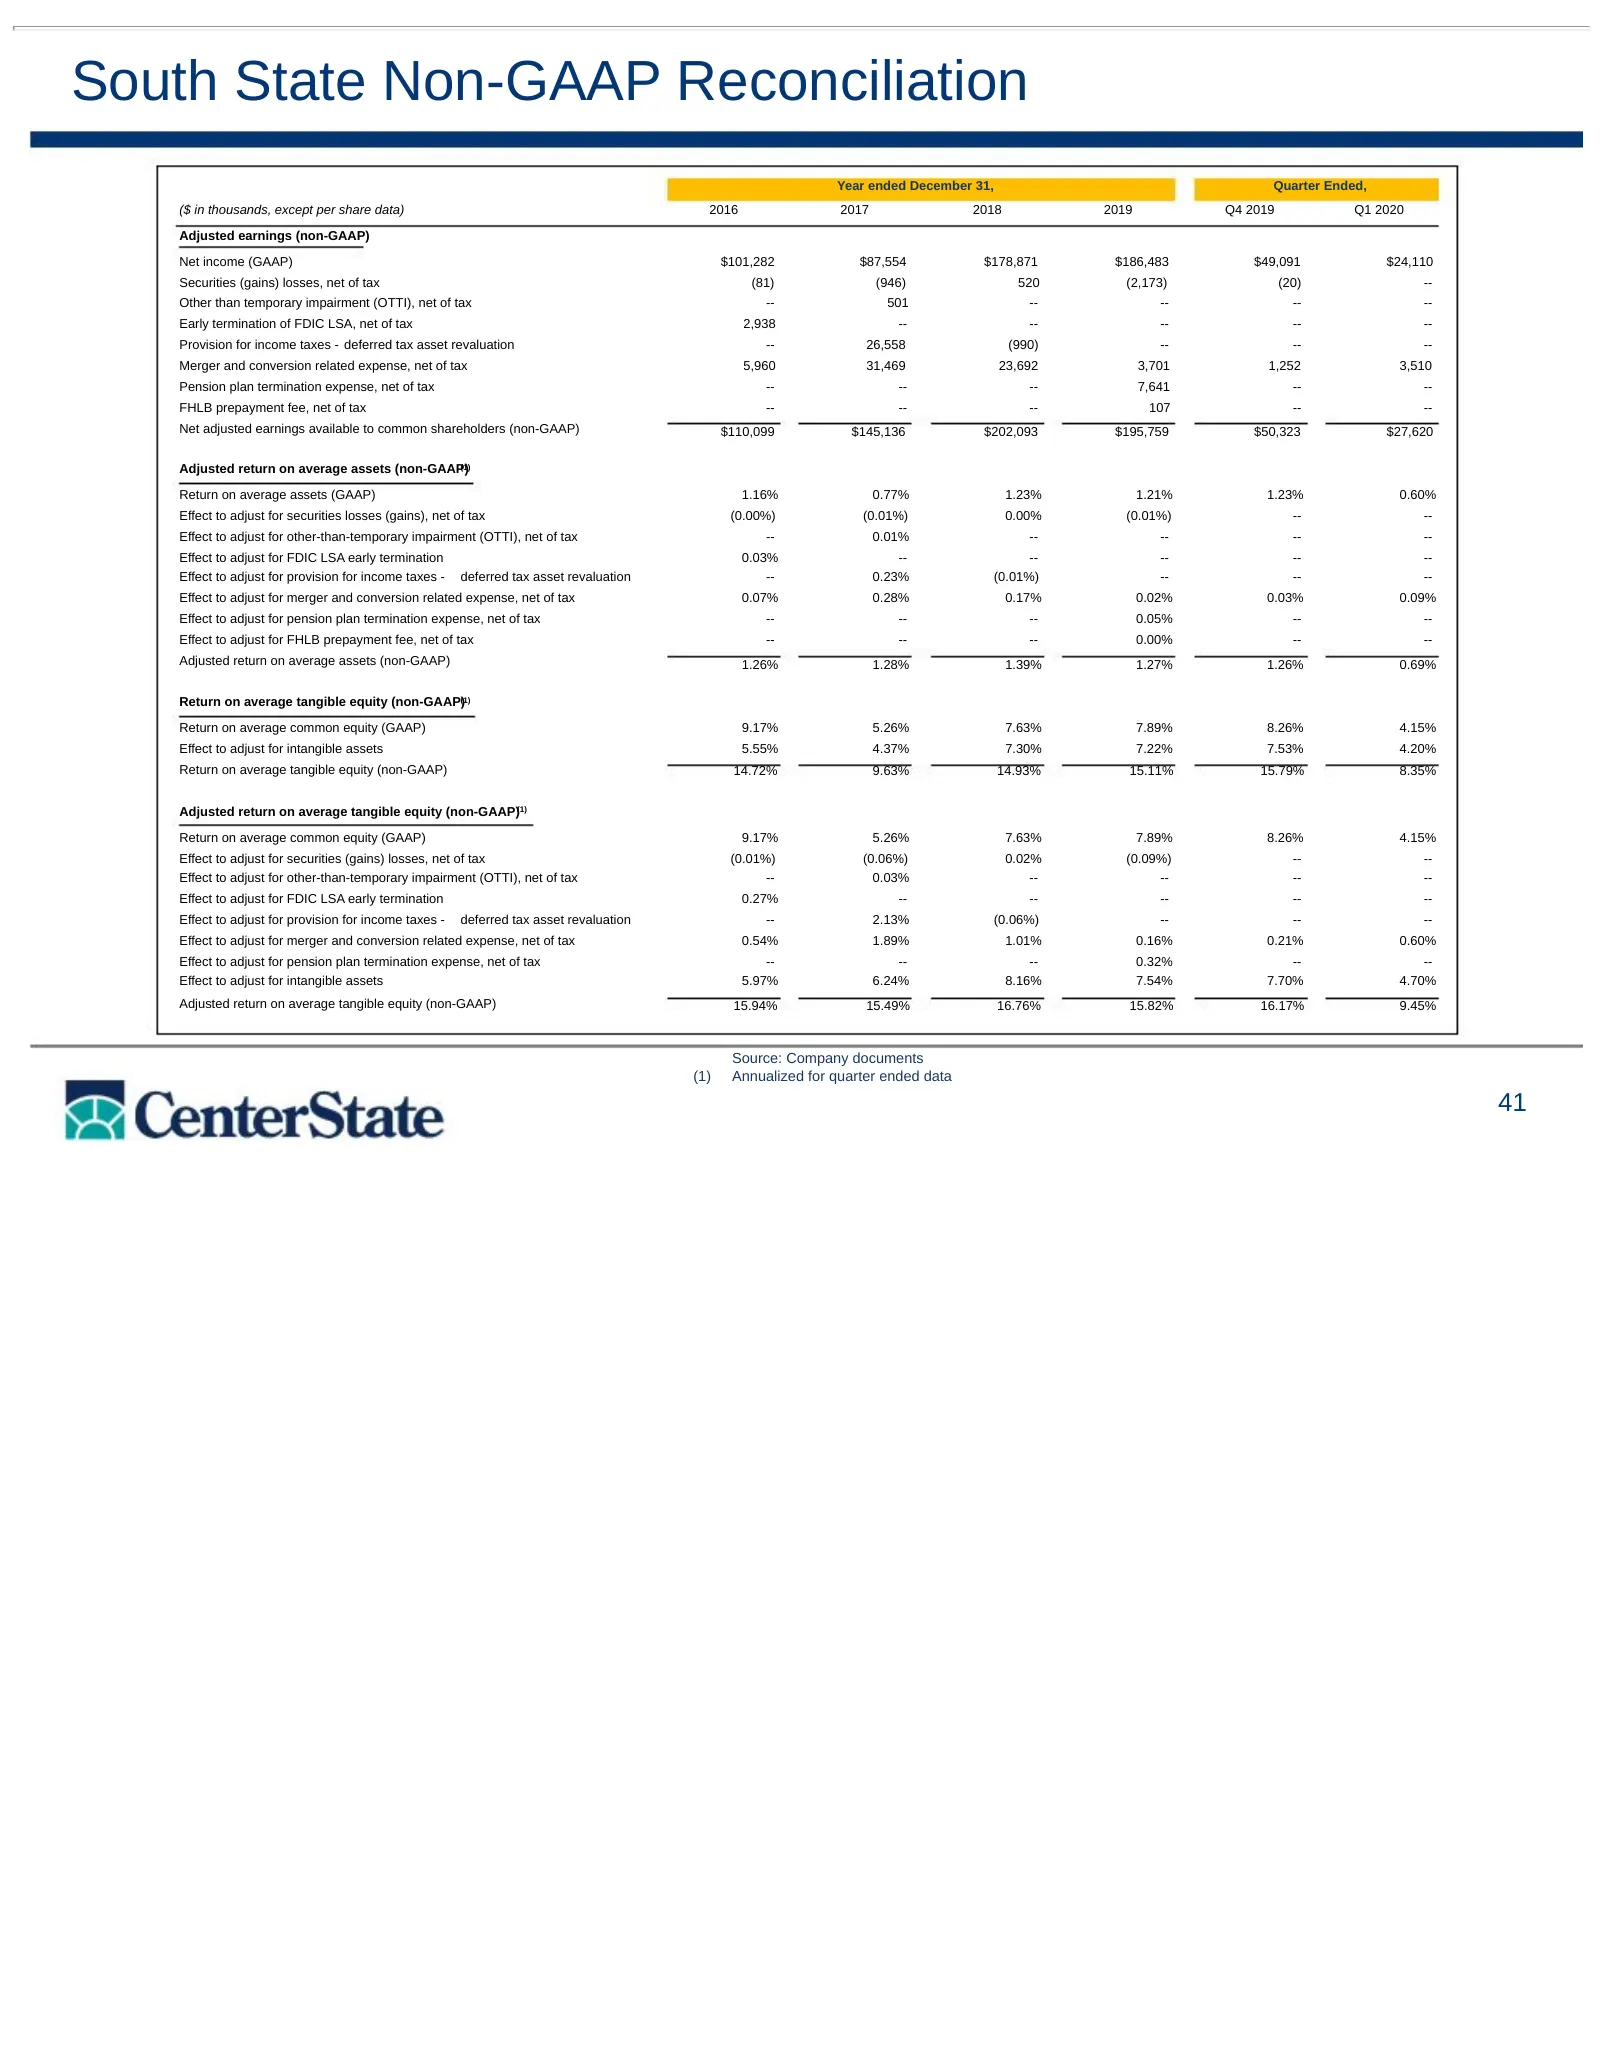
South State Non-GAAP Reconciliation Year ended December 31, Quarter Ended, ($ in thousands, except per share data) 2016 2017 2018 2019 Q4 2019 Q1 2020 Adjusted earnings (non-GAAP) Net income (GAAP) $101,282 $87,554 $178,871 $186,483 $49,091 $24,110 Securities (gains) losses, net of tax (81) (946) 52
Slide 42: South State Non-GAAP Reconciliation (cont.)
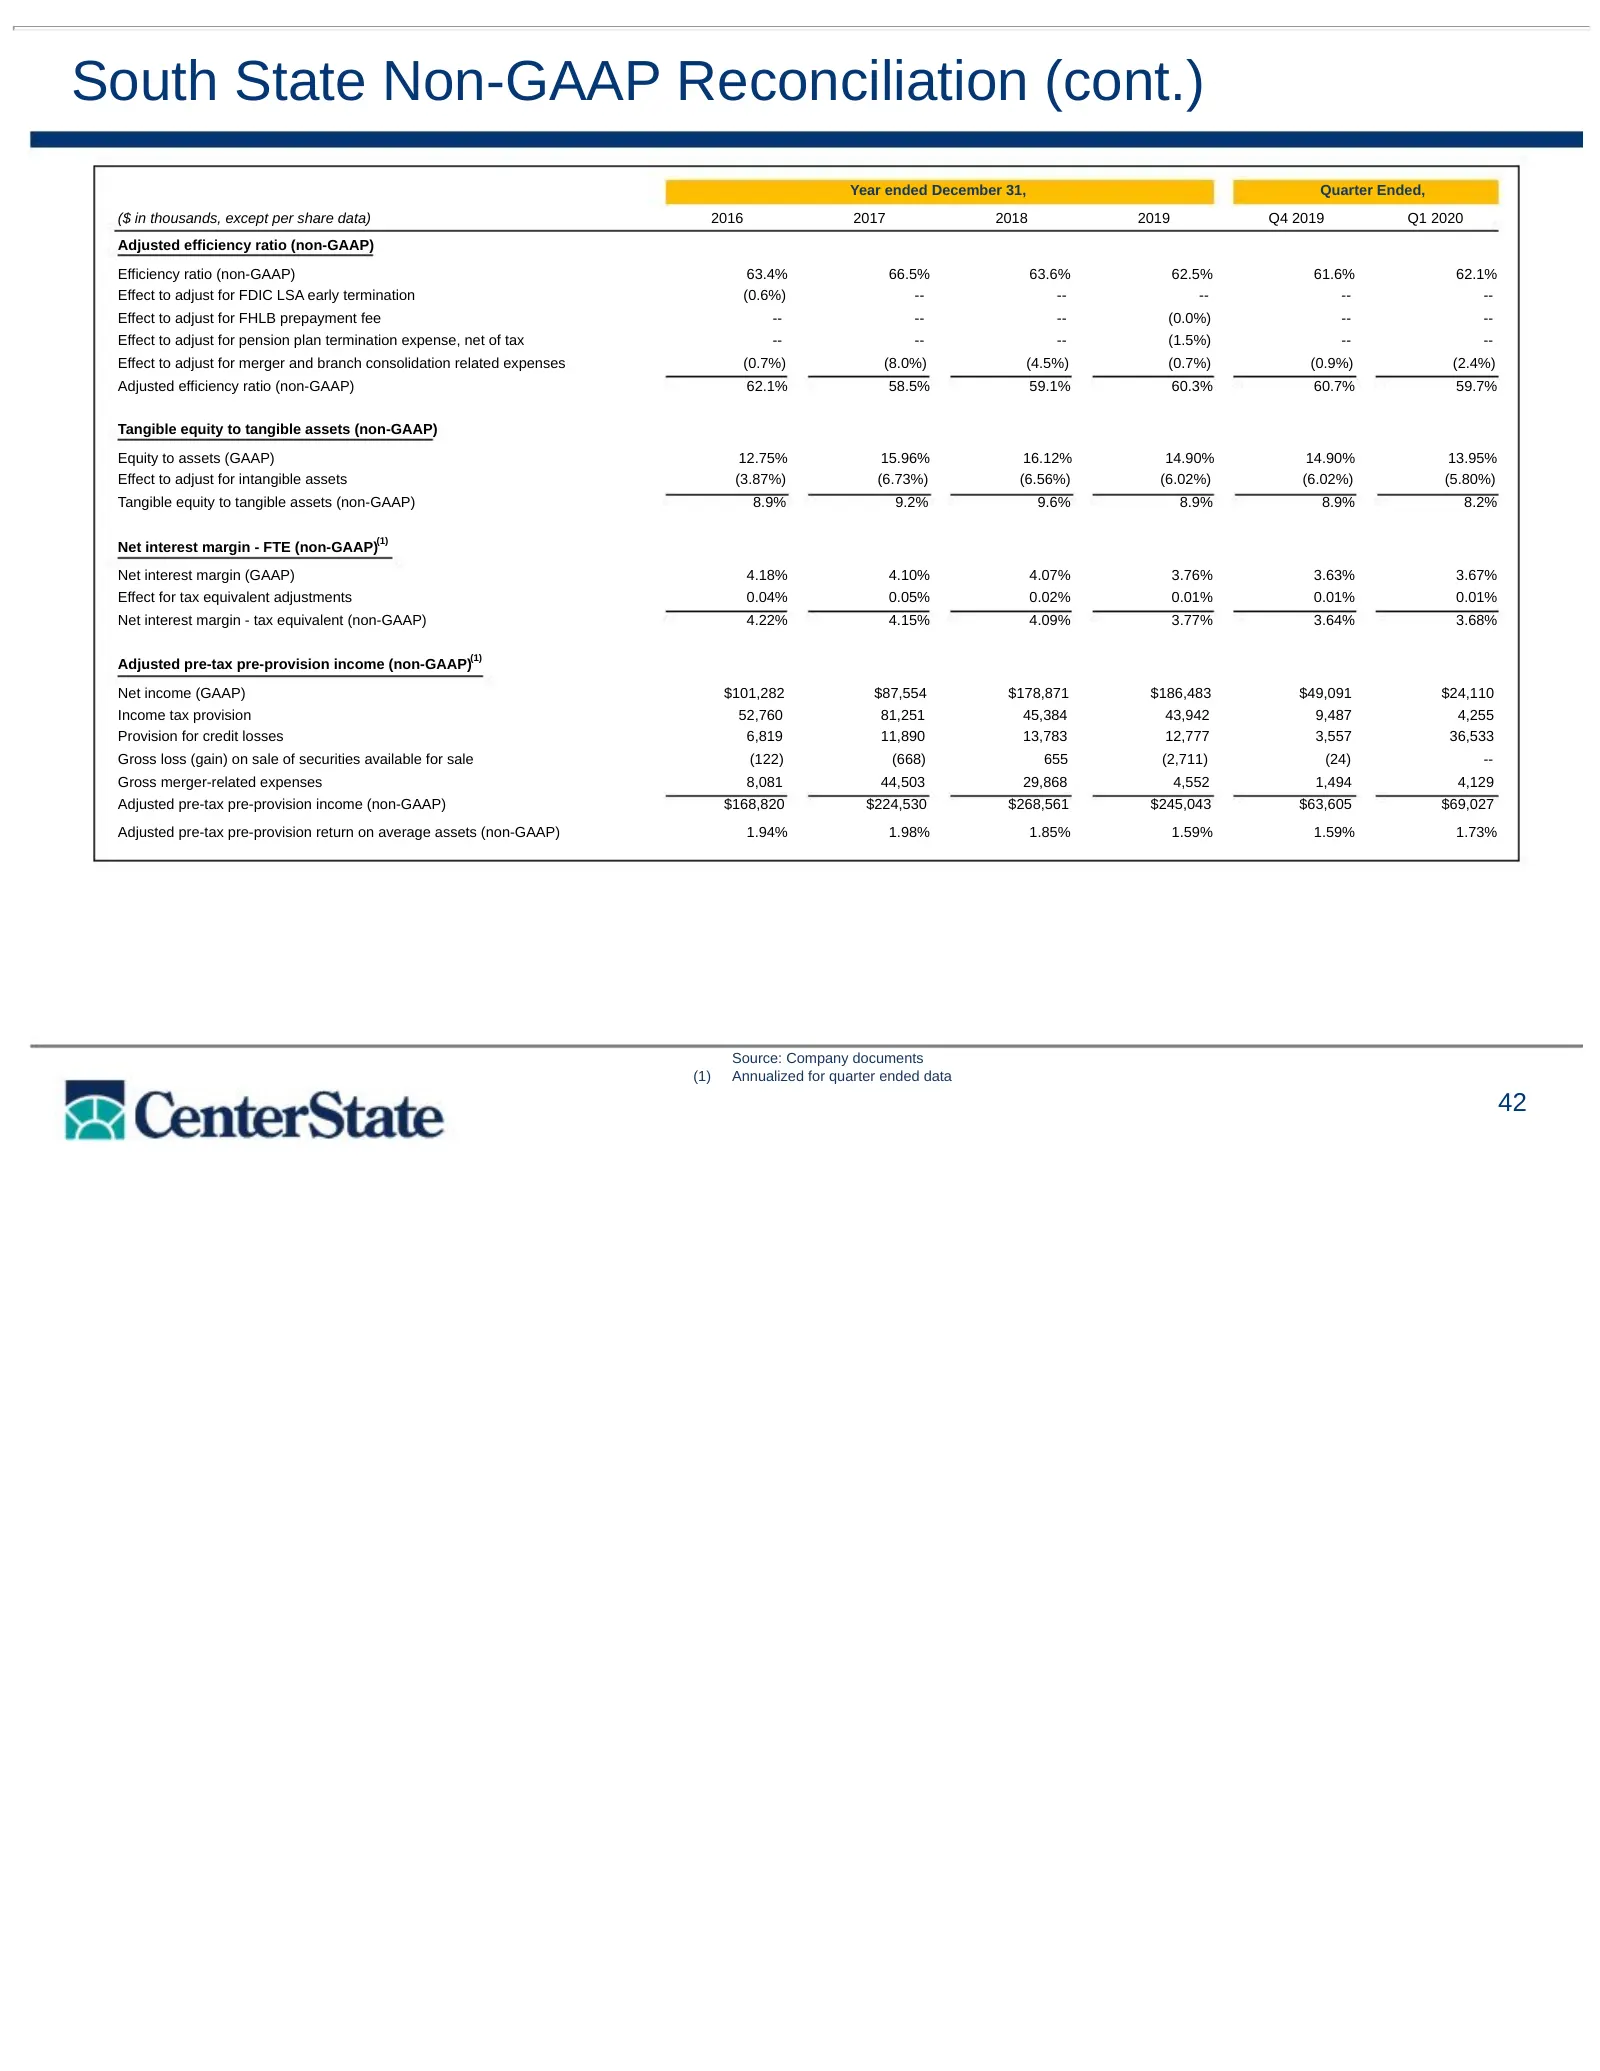
South State Non-GAAP Reconciliation (cont.) Year ended December 31, Quarter Ended, ($ in thousands, except per share data) 2016 2017 2018 2019 Q4 2019 Q1 2020 Adjusted efficiency ratio (non-GAAP) Efficiency ratio (non-GAAP) 63.4% 66.5% 63.6% 62.5% 61.6% 62.1% Effect to adjust for FDIC LSA early term
Source: SEC EDGAR · FWP filed May 21, 2020
More decks from CenterState Bank Corporation
 D.A. Davidson 22nd Annual Financial Institution Virtual Conference (May 2020)25 slides · May 6, 2020
 Q1 2020 Earnings Presentation25 slides · Apr 23, 2020
 Merger or Acquisition (January 2020)24 slides · Jan 27, 2020
 Q3 2019 Earnings Presentation28 slides · Nov 4, 2019
 Investor Presentation (July 2019)28 slides · Jul 30, 2019
 Q1 2019 Earnings Presentation32 slides · Apr 30, 2019