Navistar International Corporation
Navistar International — Investor Presentation (July 2015)
45 slides from Navistar International's investor presentation, Jul 21, 2015

Slide 1: Exhibit 99.1
Exhibit 99.1 International ® is a registered trademark of , Inc.
Slide 2: Safe Harbor Statement
Safe Harbor Statement Information provided and statements contained in this report that are not purely historical are forward-looking statements within the meaning of Section 27A of the Securities Act of 1933, as amended, Section 21E of the Securities Exchange Act of 1934, as amended, and the Privat
Slide 3: Troy Clarke, President & Chief Executive Officer
Troy Clarke President & Chief Executive Officer
Slide 4: Who is Navistar?
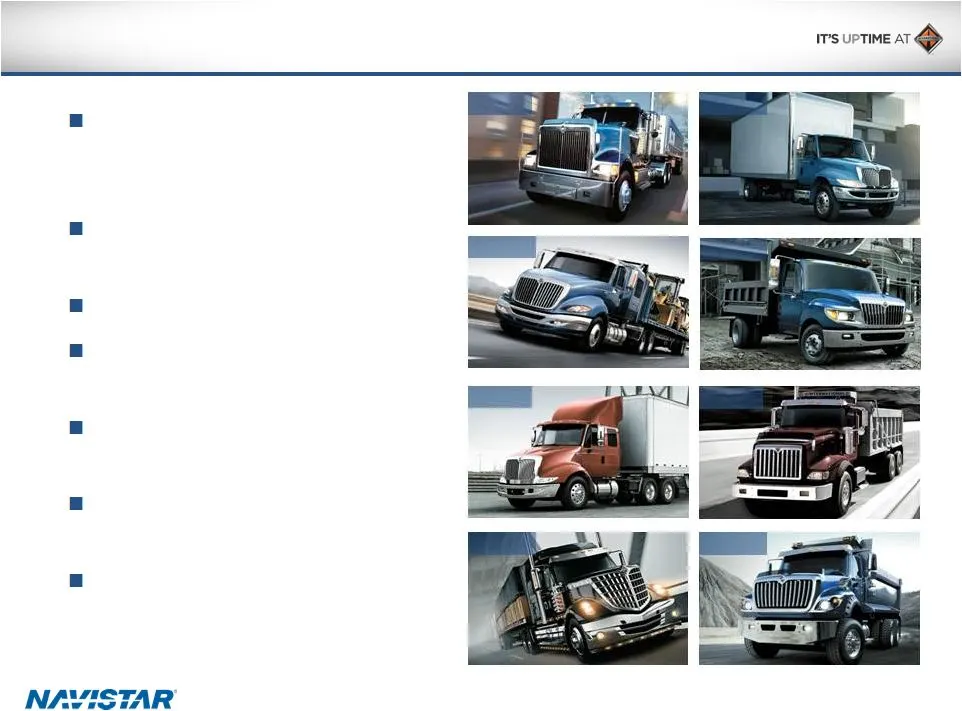
9900i DuraStar ProStar + TranStar PayStar TerraStar WorkStar LoneStar Leading manufacturer of commercial trucks, buses and defense vehicles Number of active employees: ~14,200 2014 revenue: ~$10.8 billion Ranked #276 in 2014 U.S. Fortune 500 Strong and diverse product line- up One of the largest par
Slide 5: 2012-2014 Turnaround Accomplishments
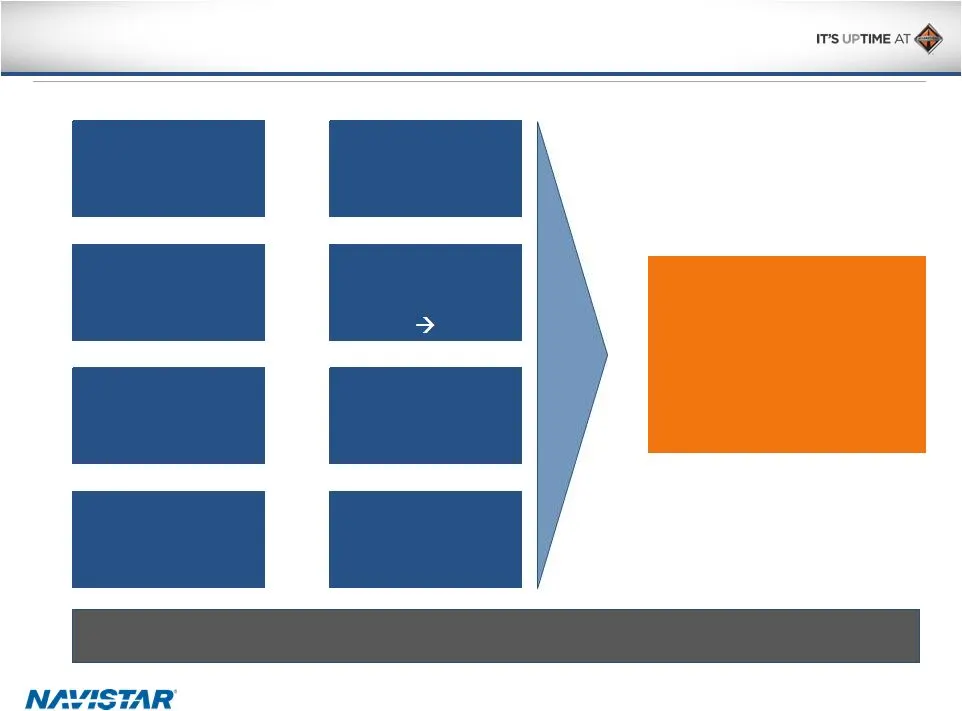
Navistar has completed 10 years of progress in the last 2 years Navistar has completed 10 years of progress in the last 2 years Divested Non-core Businesses and Joint Ventures Consolidated Manufacturing Initiated Lean Practices Lowered Break- Even Point Changed Engine Technology EGR SCR Reduced Warr
Slide 6: Areas of Focus: 2015 & Beyond
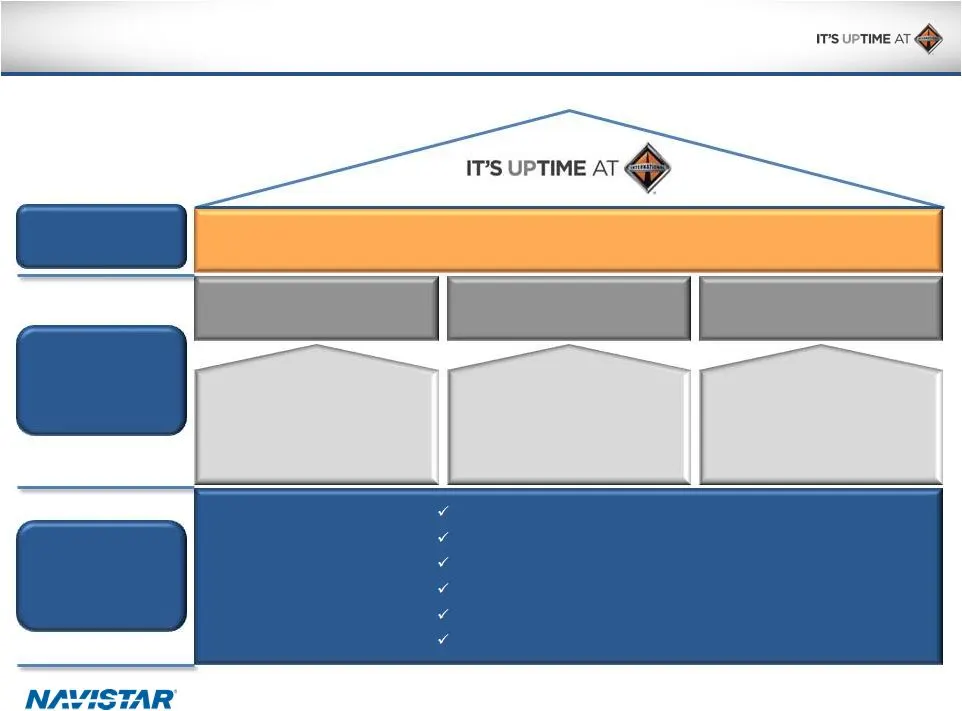
Vision Areas of Focus: 2015 & Beyond Foundation: Drive to Deliver, 2012 – 2014 Excellence in Operations $120 million lower manufacturing cost $640 million in structural cost savings Significant material cost reductions Significant working capital reductions Flawless product launches Product quality
Slide 7: Company Highlights
Company Highlights Overall industry outlook steady heading into 2016 with favorable mix that will benefit the company After the successful execution of our SCR emission program, Navistar is refreshing the product portfolio to focus on quality, driver experience, fuel economy and the connected vehicl
Slide 8: Industry Growth Drivers
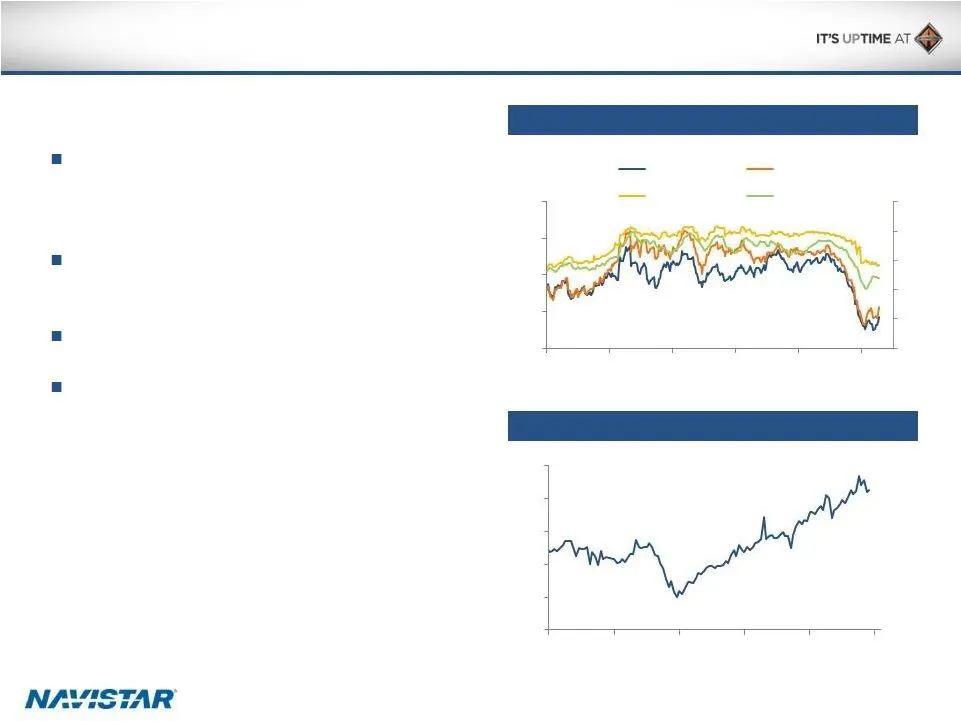
Diesel and Crude Oil Prices ATA Truck Tonnage Index Industry Growth Drivers Purchasing power of truck owners continues to improve due to tonnage increases and decline in fuel prices Truck tonnage index of 132.1 in May 2015, not far from an all-time high of 135.8 Average age of class 8 vehicles above
Slide 9: Segment Leadership, Positioned for Growth
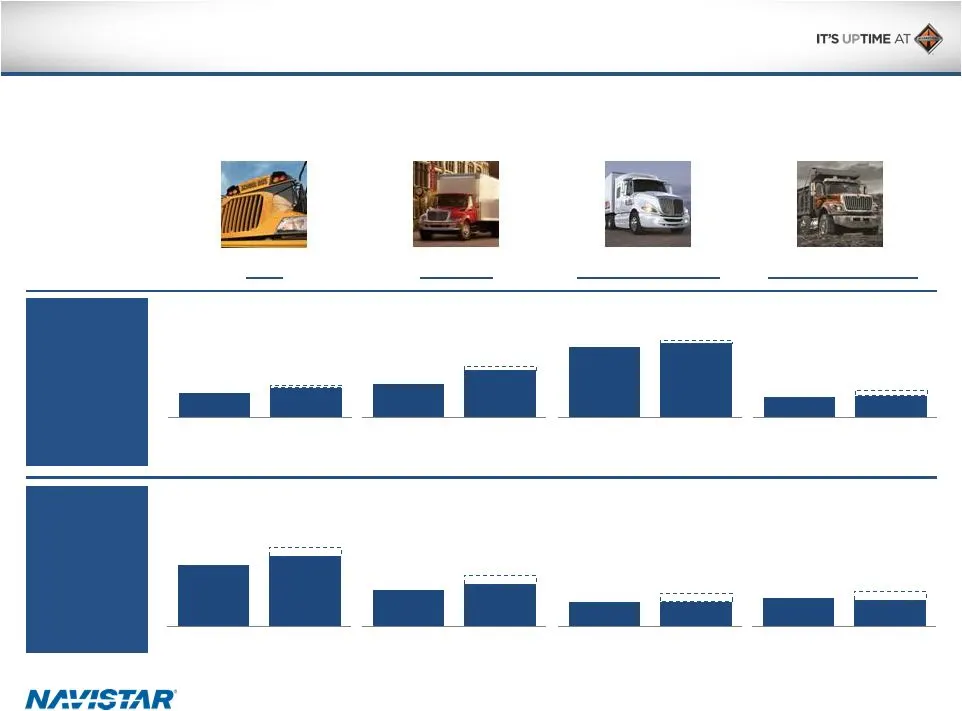
Navistar Volume (units sold) 10,900 Navistar Market Share 19,000 26,800 9,300 40% 24% 14% 15% +750 bps 8.9% 30.0% Segment Leadership, Positioned for Growth Note: Based on market share position determined by brand in U.S. and Canada; growth rates and estimates assume mid-point of range (as per Februa
Slide 10: Navistar's Product Offensive
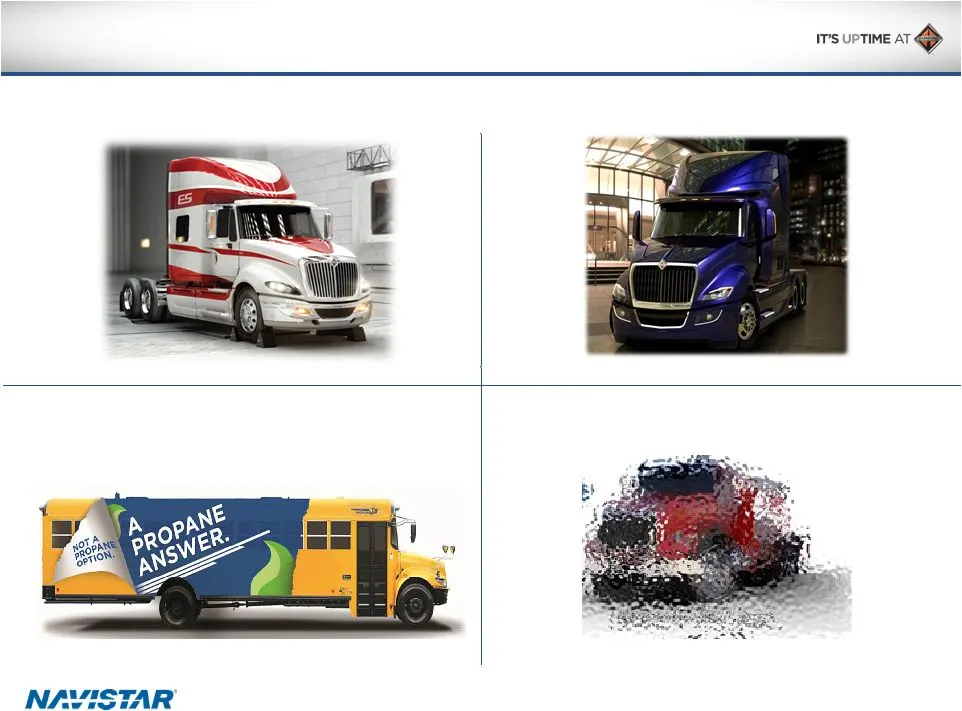
Navistar’s Product Offensive Focused-Spec’d Trucks Project Horizon Alternative Fuels Premium Vocational
Slide 11: Connected Vehicle – Differentiation that Creates Value
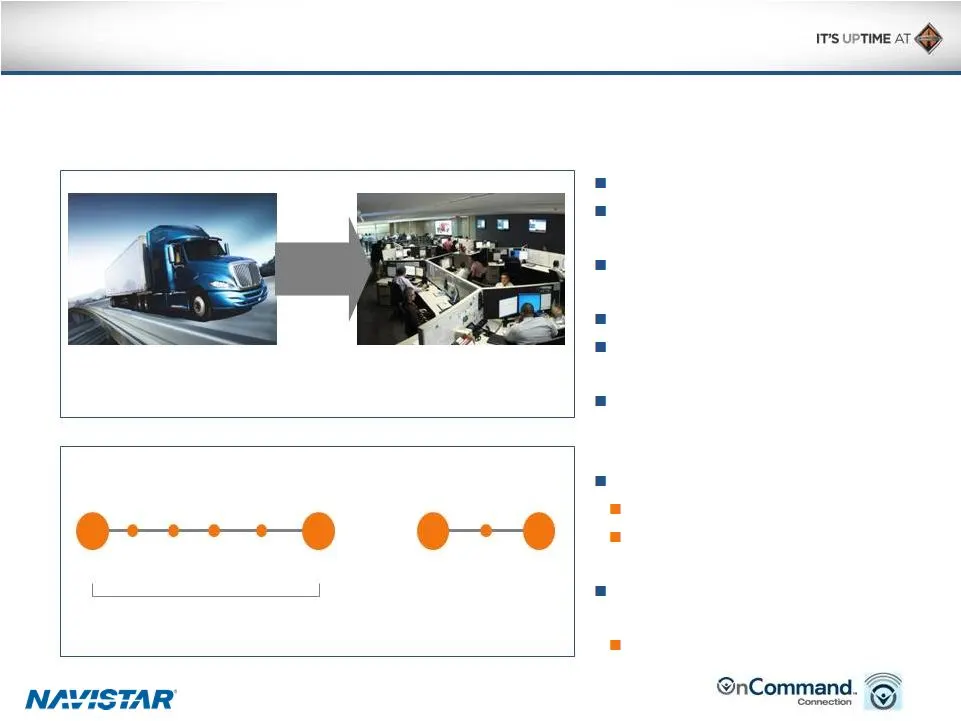
Remote diagnostic and performance monitoring Connected Vehicle – Differentiation that Creates Value Navistar is leading the way with its remote diagnostic tool… OnCommand Connection…to be the industry leader in Uptime! Navistar is leading the way with its remote diagnostic tool… OnCommand Connection
Slide 12: Best-In-Class Integration
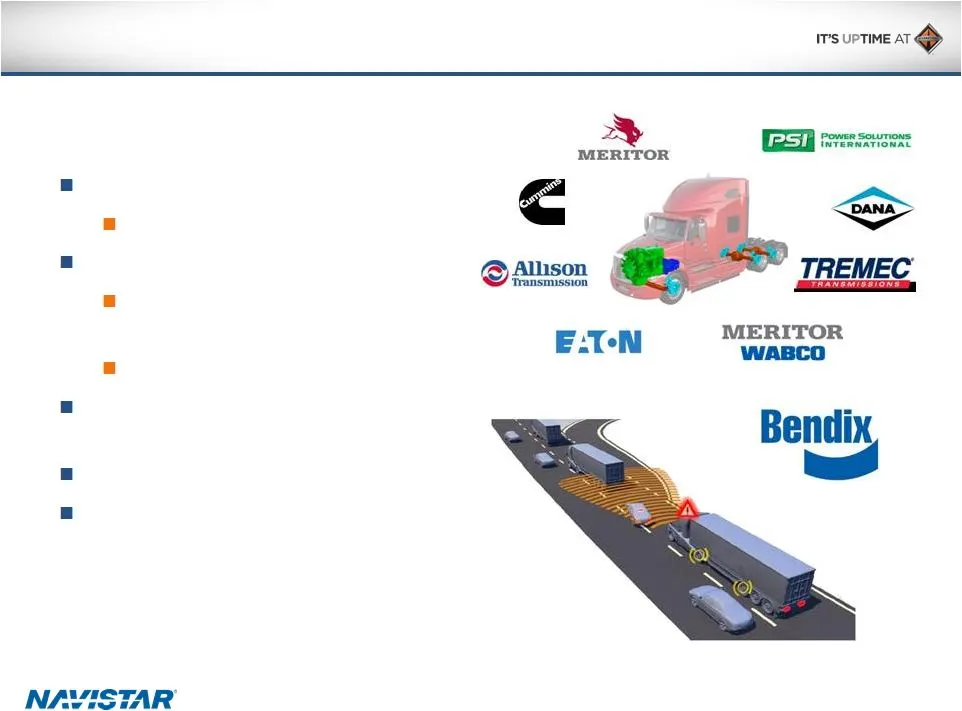
Best-In-Class Integration Leading supplier technology integration allows Navistar to deliver… Leading-edge technology Bendix Wingman Fusion Integrated and validated engineering Eaton Cummins SmartAdvantage AMT PSI Propane engine Customer choice in transmissions, axles, collision mitigation tools, et
Slide 13: Significant Improvements in Product Quality
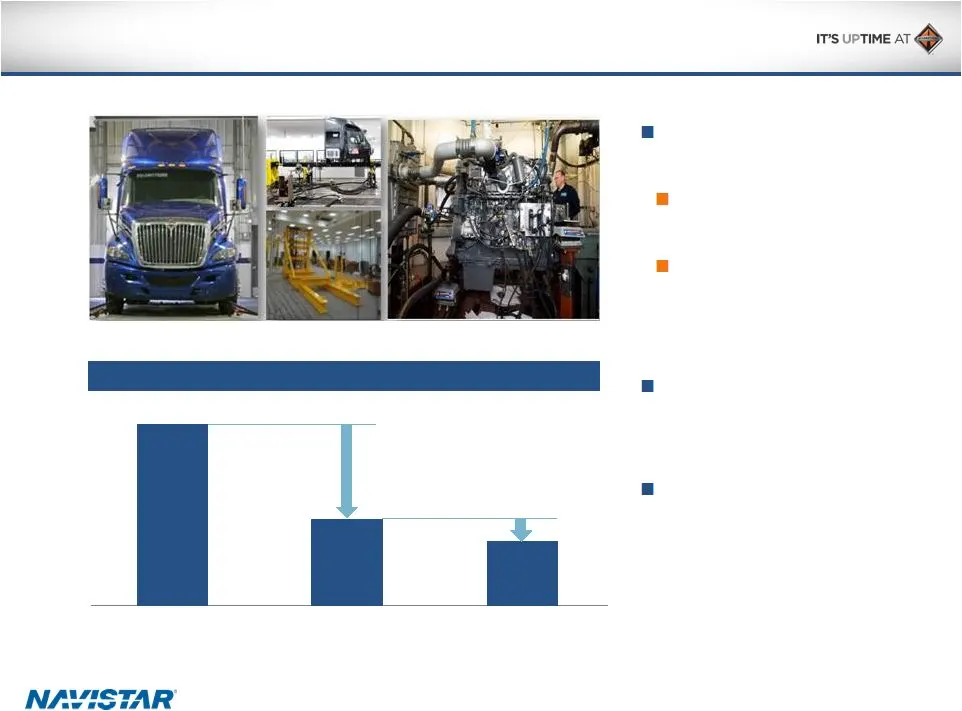
ProStar with Navistar engines: Repair rates ProStar with Navistar engines: Repair rates ProStar w/2010 Emission EGR engine ProStar w/2013 Emission SCR engine 2015 ProStar w/2013 Emission SCR engine Significant Improvements in Product Quality Leaders in engineering validation: 200 validation vehicles
Slide 14: Supporting Customers Through Parts and Service
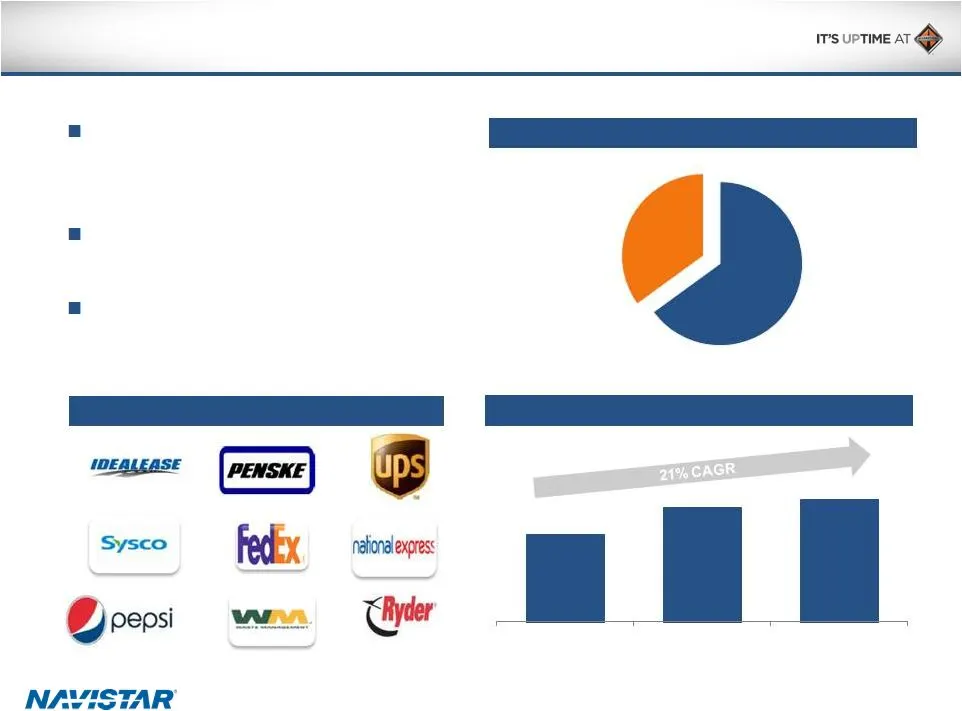
2014 Revenue: $2.5 billion National Account Customers North America Parts Segment Profit Supporting Customers Through Parts and Service North America Parts demonstrates continued growth through the turnaround period Parts remain a key component of profitability and cash generation OnCommand Connecti
Slide 15: Leading Uptime
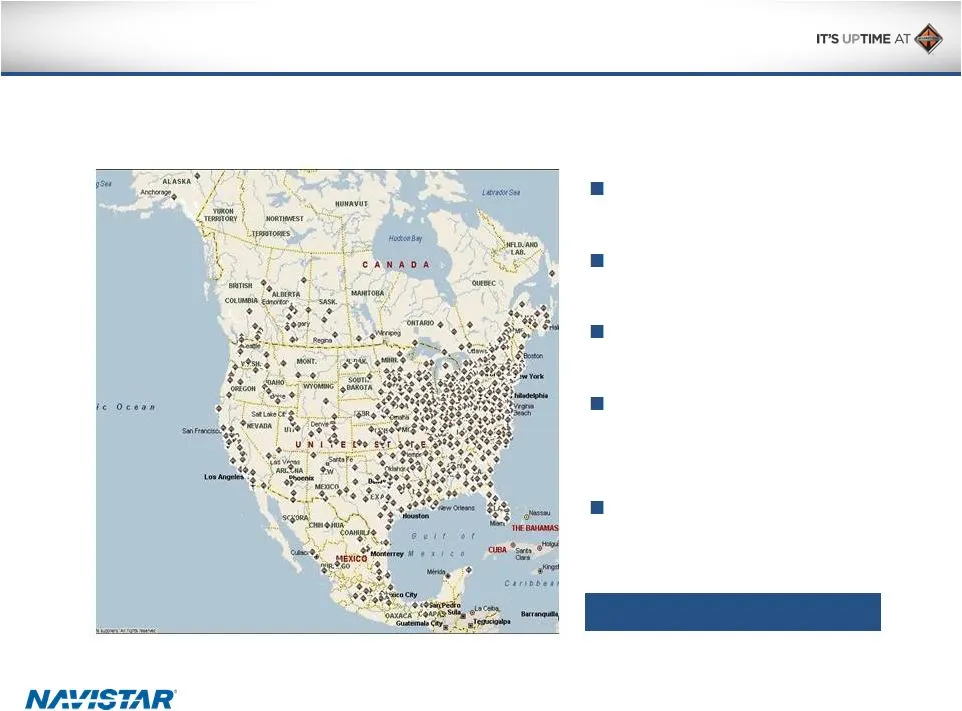
Leading Uptime Parts and Service Supported by the Broadest Dealer Network in the Industry 800+ Dealer Locations 8,000 Service Bays 7,600 Technicians $350 million Parts Inventory Recognized Market Leadership
Slide 16: Walter Borst, Chief Financial Officer
Walter Borst Executive Vice-President and Chief Financial Officer
Slide 17: EBITDA Margin Goals Remain on Track
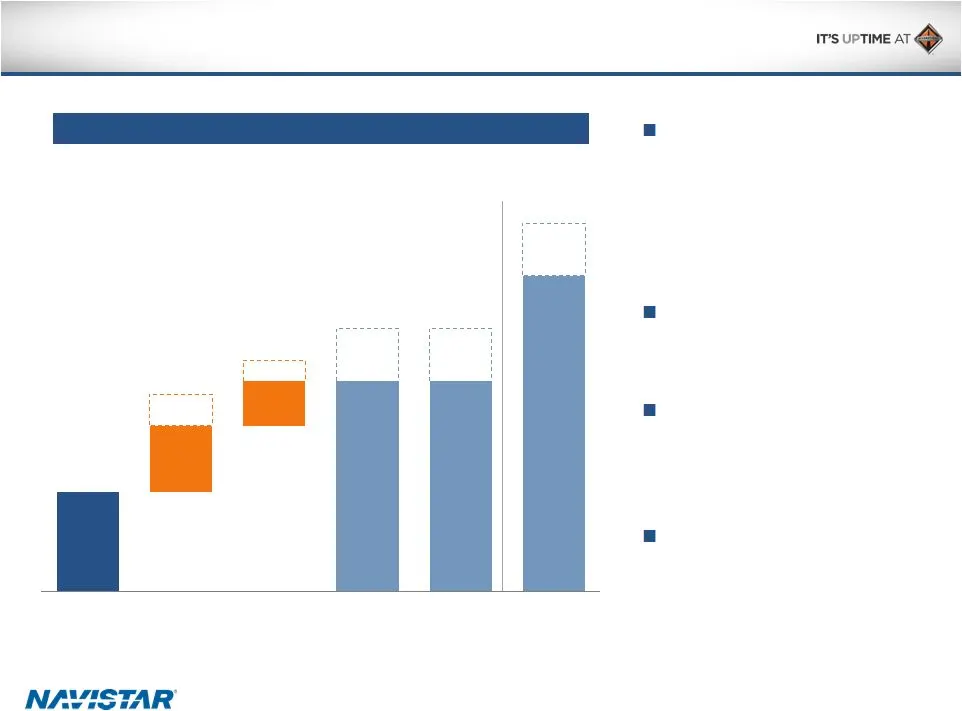
Adjusted EBITDA Margin Adjusted EBITDA Margin 2.5% 1.7% EBITDA Margin Goals Remain on Track 3.8% 1.2% 0.8% 8-10% 8-10% 12-14% Q2 2015 margin Cost improvements Revenue drivers Q4 2015E margin 2016E / 2017E Industry Benchmark Adjusted EBITDA for Q3 within communicated range and solid plans in place to
Slide 18: Growing Core North America Truck Revenue
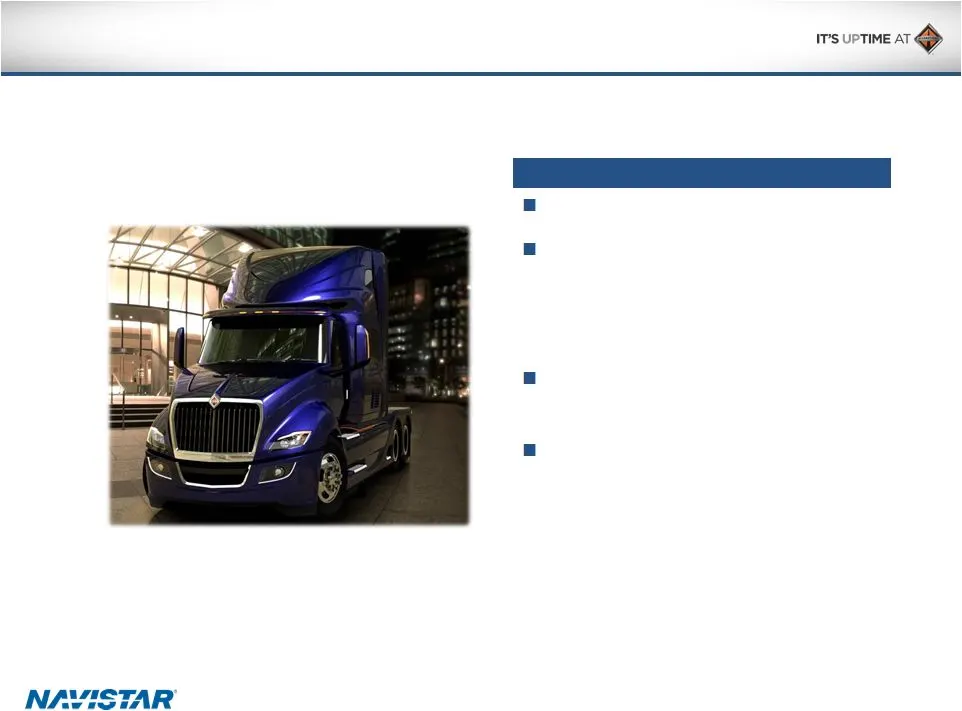
Revenue drivers Revenue drivers Growing Core North America Truck Revenue Increased year-over-year volumes Enhanced value proposition for customer driving sales through improved quality, reliability and technology Shift in mix toward higher margin products and dealer led sales Leading supplier techno

Slide 19: Four Pronged Cost Approach to Improving Returns
Material costs Structural costs Manufacturing costs Warranty costs Lowered break-even point by more than 50% since 2012 Four Pronged Cost Approach to Improving Returns
Slide 20: Material Cost Savings
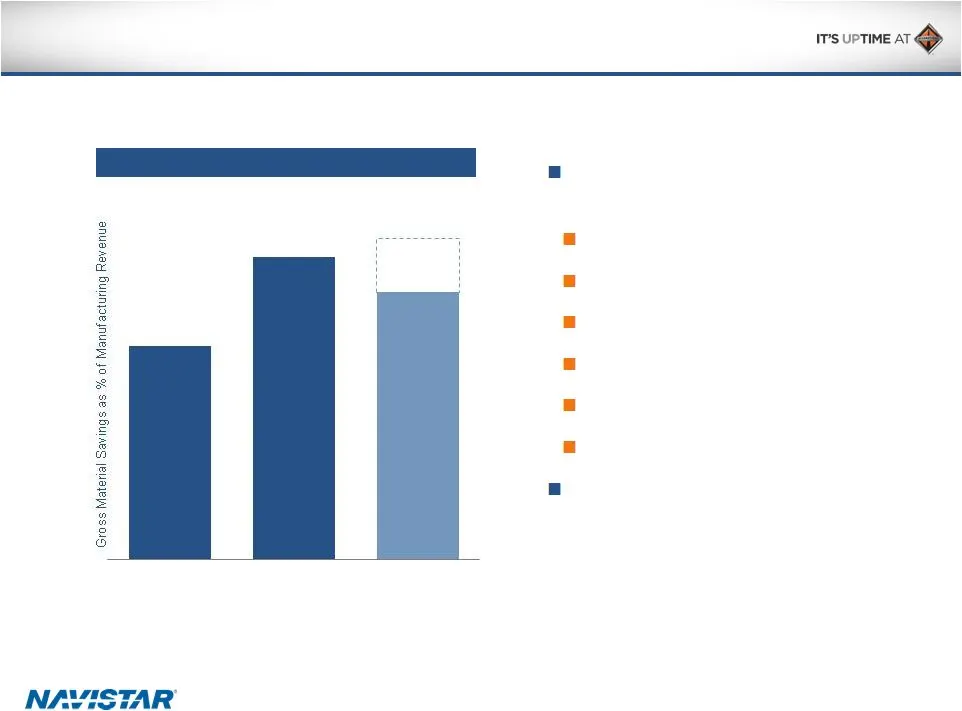
Gross Material Savings (A) Gross Material Savings (A) Material Cost Savings 1.5–1.8% Material and logistics savings driven by: Design cost reductions Supplier consolidation Make vs. buy studies Logistics optimization Optimizing supply footprint Benchmarking material costs 2015 material savings will
Slide 21: Manufacturing Cost Improvements
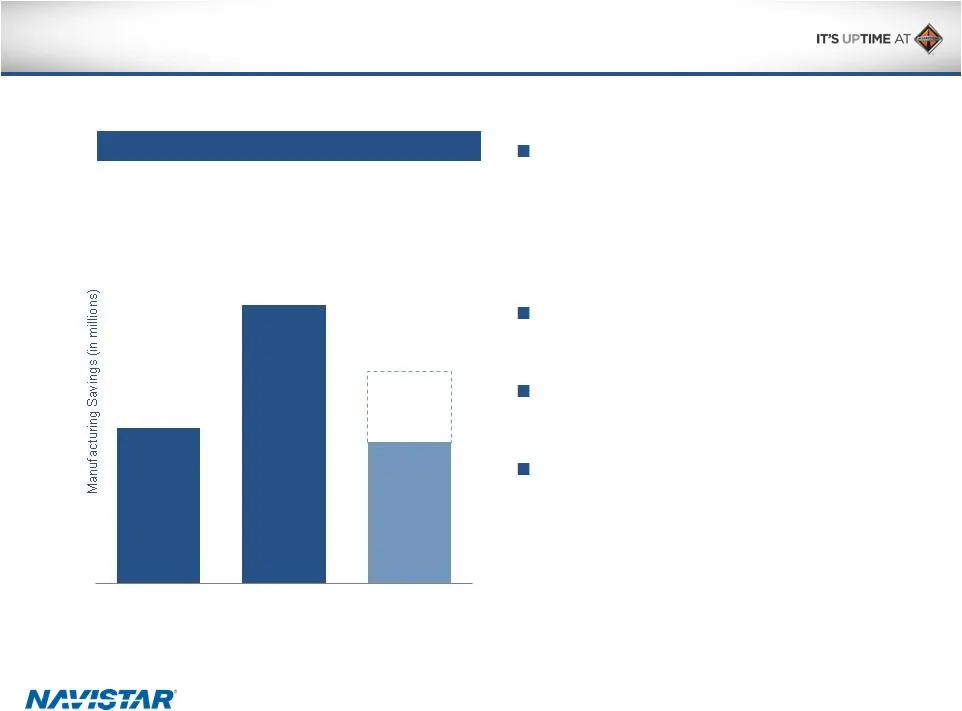
Manufacturing Savings Manufacturing Savings Manufacturing Cost Improvements $40–60 Previously announced consolidation of mid-range engine operations and closure of foundry operations will deliver $35 million of savings Implementation of lean in our plants making significant progress Increasing manuf
Slide 22: Structural Cost Improvements
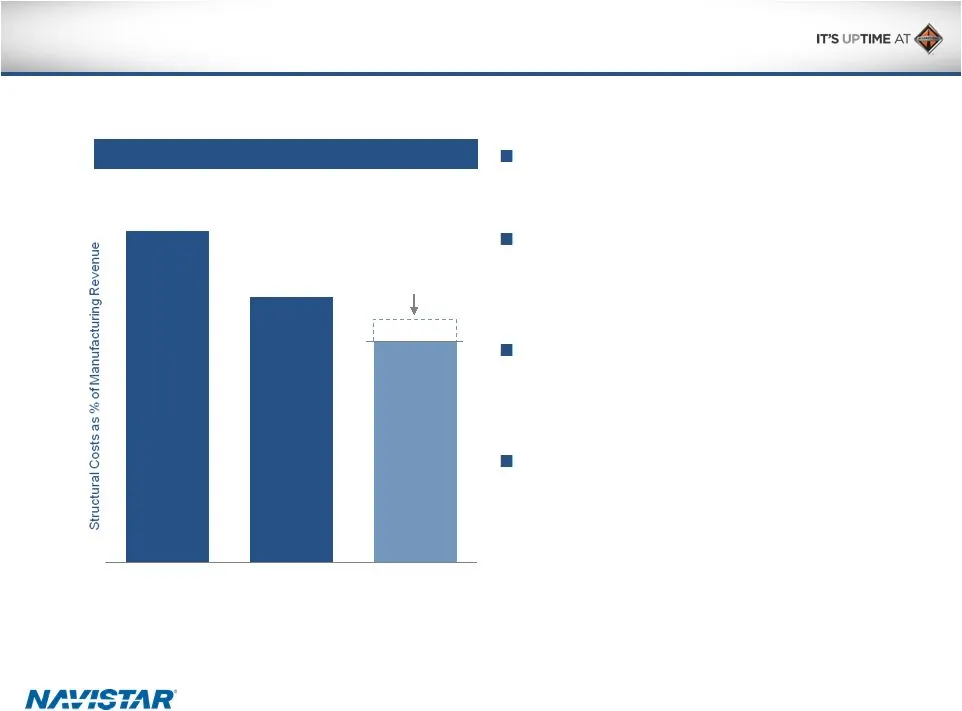
Structural Costs Structural Costs Structural Cost Improvements 15% 12% 2015E 10–11% Target Intense focus to drive SG&A costs towards industry benchmarks Engineering expense projected to decline year-over-year as a result of shift in engine strategy $640 million in cost savings since 2012 have helped
Slide 23: Warranty Cost Improvements
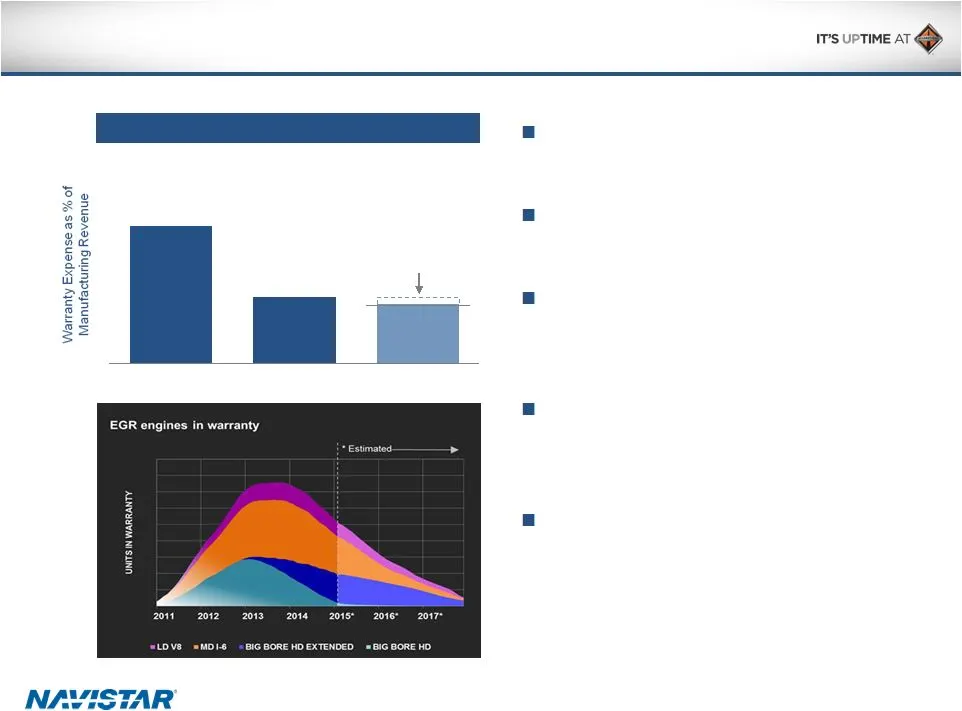
Warranty Expense Warranty Expense Warranty Cost Improvements 7.7% 3.7% 2015E 3.3–3.7% Target 4% point improvement achieved ahead of plan Q1 and Q2 2015 run rates less than 3% of revenue Majority of 13L legacy MaxxForce engines out of standard warranty and extended warranty cycle OnCommand Connection
Slide 24: Improving Balance Sheet Flexibility
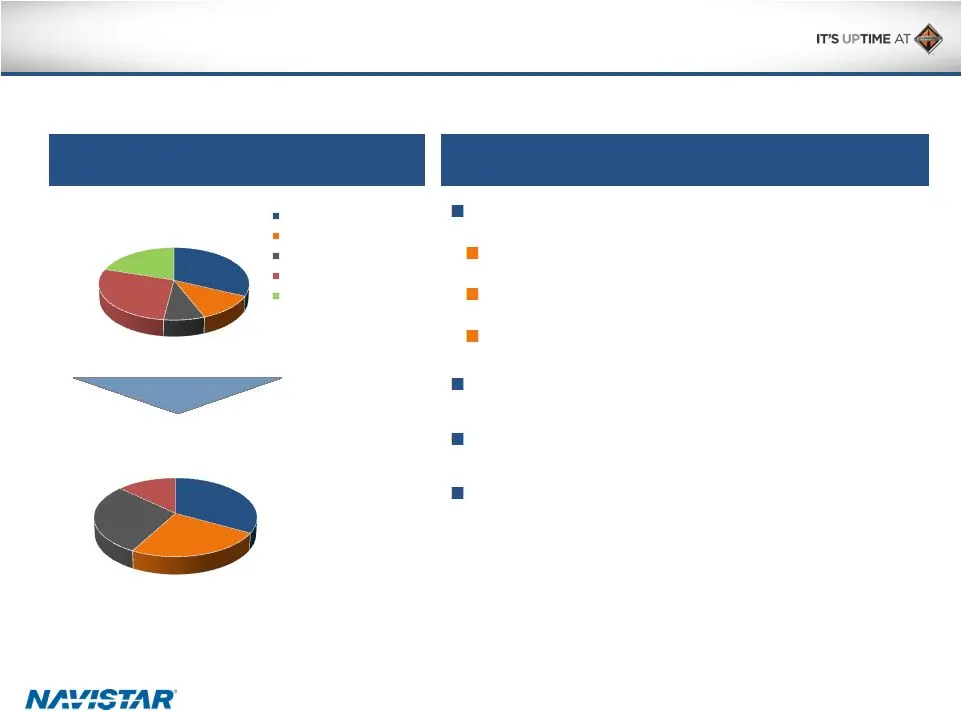
Balance sheet goals Balance sheet goals Manufacturing Cash uses decline significantly by 2017 Manufacturing Cash uses decline significantly by 2017 Improving Balance Sheet Flexibility Further improvement in liquidity Pension & OPEB funding vs. expense Warranty spend vs. expense Lower Used Truck inve
Slide 25: Capital Expenditures
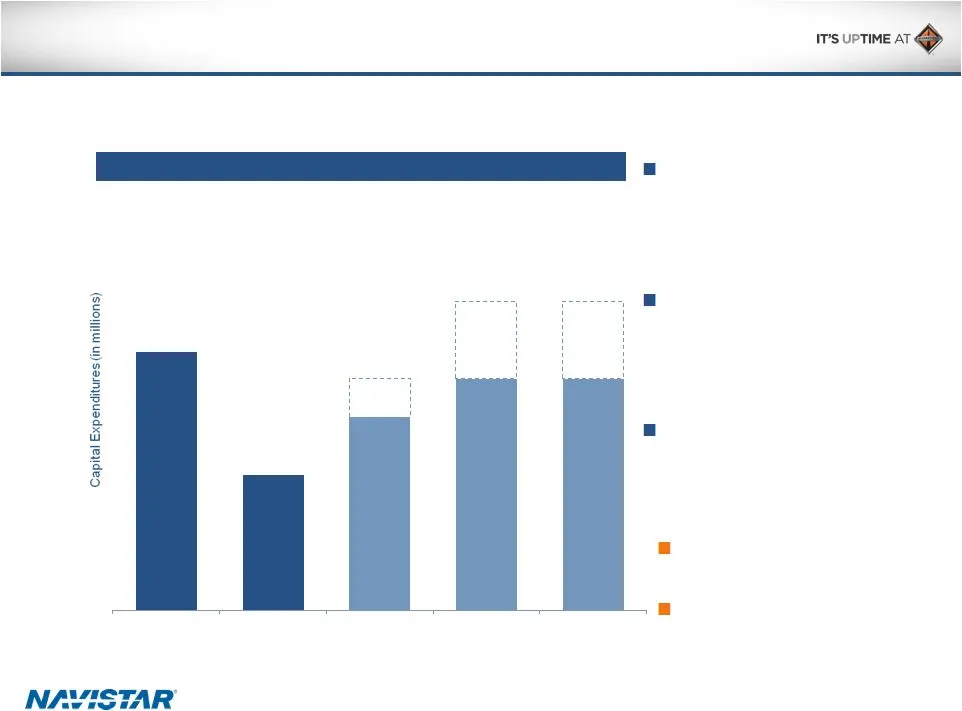
Capital Expenditures Capital Expenditures Capital Spending Not Expected to Return to Historical Levels as We Continue to Partner We continue to invest in our products to solidify our place as a market leader Leveraging our partnerships reduces the need for capital expenditures We anticipate that cap
Slide 26: Used Truck Inventory Elevated in Near-Term Before Declining
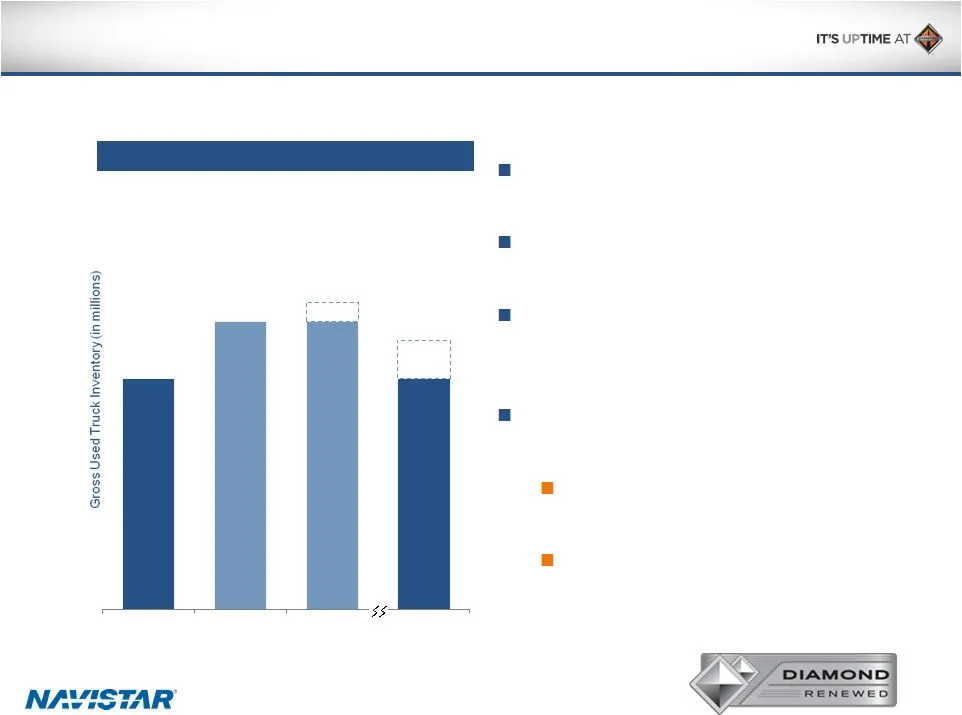
Gross Used Truck Inventory Gross Used Truck Inventory Used Truck Inventory Elevated in Near-Term Before Declining Need to take trades to manage new truck sales Balancing Profit, Residuals and Working Capital requirements Used Truck inventory will improve over time as the amount of EGR units moves th
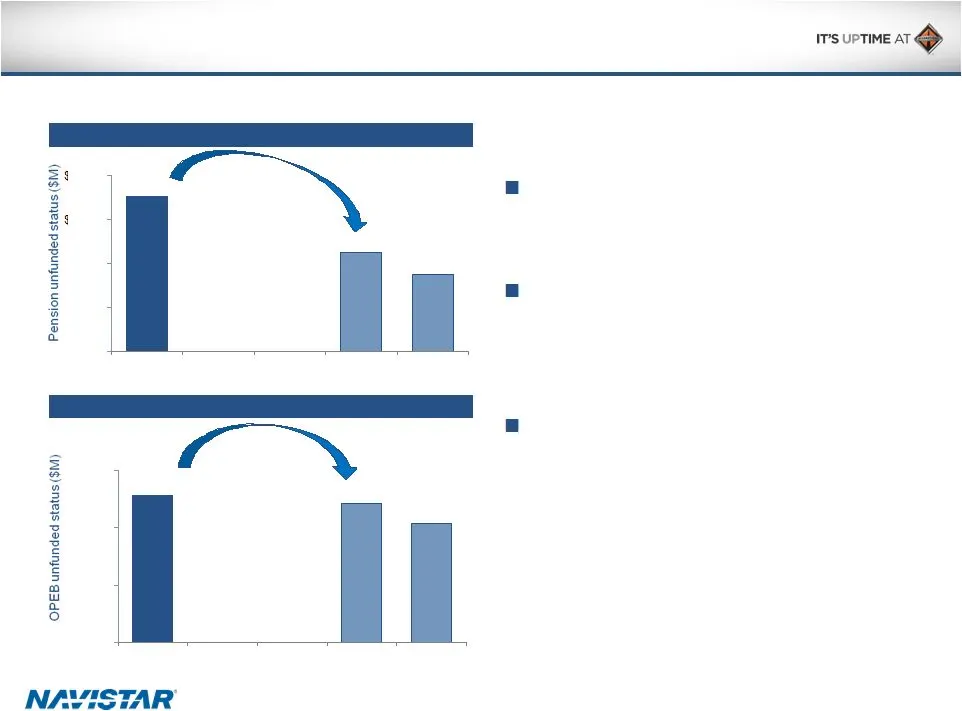
Slide 27: Pension and OPEB Unfunded Status Forecast to Improve
Pension unfunded status Pension unfunded status OPEB unfunded status OPEB unfunded status Pension and OPEB Unfunded Status Forecast to Improve Materially by 2017 $1,414 $900 $700 $0 $400 $800 $1,200 $1,600 2017E 2017E (+100 bps) $1,542 $1,450 $1,250 $0 $600 $1,200 $1,800 2017E 2017E (+100 bps) $3 bi
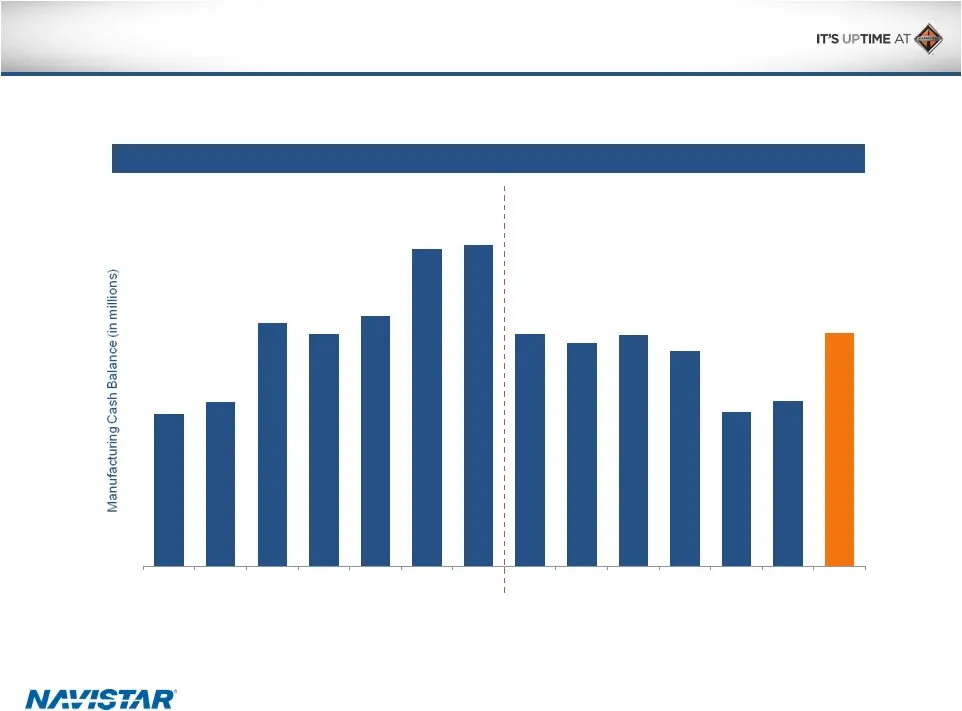
Slide 28: Pro Forma Manufacturing Cash Balance
Manufacturing Cash Balance Manufacturing Cash Balance Pro Forma Manufacturing Cash Balance $722 $777 $1,152 $1,100 $1,186 $1,505 $1,523 $1,099 $1,060 $1,098 $1,018 $733 $784 $1,106 Q1 Q2 Q3 Q4 Q1 Q2 Q2 FY15 Pro Forma Note: This slide contains non-GAAP information; please see the REG G in appendix fo
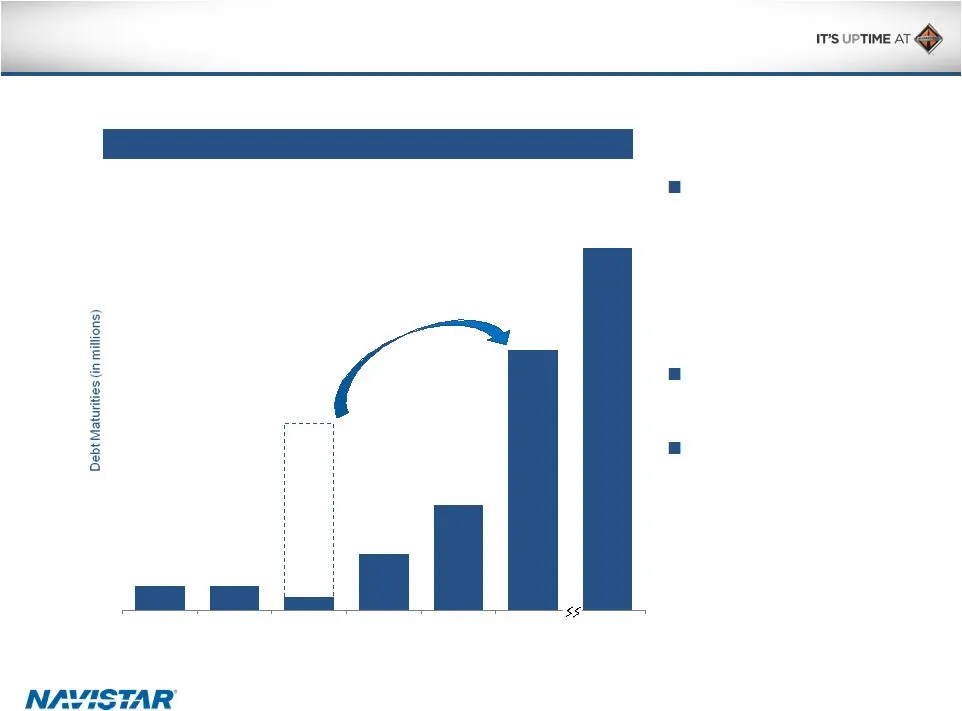
Slide 29: No Material Near-Term Debt Maturities
Debt Maturities Debt Maturities No Material Near-Term Debt Maturities Debt maturity profile significantly extended during 2014 and 2015, providing additional financial flexibility Seeking to reduce leverage over time Pro forma, the refinancing shifts ~$700 million of debt maturing in 2017 to $100 $1
Slide 30: U.S. Environmental Protection Agency (EPA) Lawsuit
U.S. Environmental Protection Agency (“EPA”) Lawsuit In February 2012, Navistar, Inc. received a Notice of Violation ("NOV") from the EPA. The NOV pertained to approximately 7,600 diesel engines which, according to the EPA, were produced by Navistar, Inc. in 2010 and, therefore, should have met the
Slide 31: Company Highlights
Company Highlights Overall industry outlook steady heading into 2016 with favorable mix that will benefit the company After the successful execution of our SCR emission program, Navistar is refreshing the product portfolio to focus on quality, driver experience, fuel economy and the connected vehicl

Slide 32: Appendix
International ® is a registered trademark of , Inc. Appendix
Slide 33: Q2 2015 Financial Results
Q2 2015 Financial Results Generated positive manufacturing cash flow Increased core chargeouts (A) to 18,600 trucks Up 38% from Q1 2015 Up 10% from Q2 2014 Grew adjusted EBITDA Achieving cost reductions Taking actions towards improving capacity utilization Investing in the core business (A) Includes

Slide 34: Q2 2015 Income Statement Summary
Q2 2015 Income Statement Summary Quarters Ended April 30 $ in millions, except per share and units Chargeouts (A) 18,600 16,900 Sales and Revenues $2,693 $2,746 Income (Loss) from Continuing Operations, Net of Tax (B) $(64) ($298) Diluted Income (Loss) Per Share from Continuing Operations (B) ($0.78
Slide 35: Q2 2015 Manufacturing Cash Summary and Guidance
Q2 2015 Manufacturing Cash Summary and Guidance Guidance (A) Actual Q1 Manufacturing Cash Balance (B) $733 $733 Consolidated Adjusted EBITDA (C) $100 - $150 $102 Capex/Cash Interest/Pension & OPEB Funding ($120) - ($110) ($114) Change in Net Working Capital/Debt and Warranty/Other ^ ($13) - $27 $63
Slide 36: Navistar Financial Corporation Highlights
Highlights Highlights Dealer floor plan Retail Notes Bank Facility Navistar Financial Corporation Financial Services Segment profit of $22 million for Q2 2015, $46 million YTD U.S. financing availability of $232 million as of April 30, 2015 Financial Services Debt/Equity Leverage of 3.9:1 Retail acc
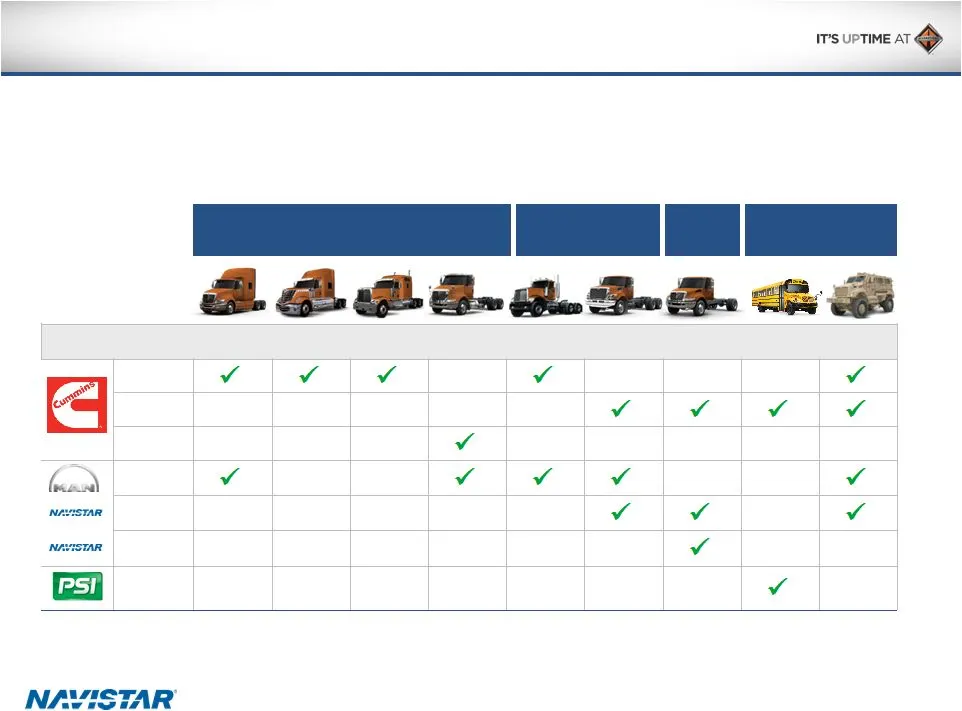
Slide 37: Navistar's Product Line-Up
Class 8 heavy duty on-highway Class 8 heavy duty on-highway 6/7 Med. 6/7 Med. Class 8 severe Class 8 severe Bus and other Bus and other Navistar’s Product Line-Up Our vision is to be the truck maker that customers can count on to help them win…by providing industry-leading Uptime, outstanding fuel e
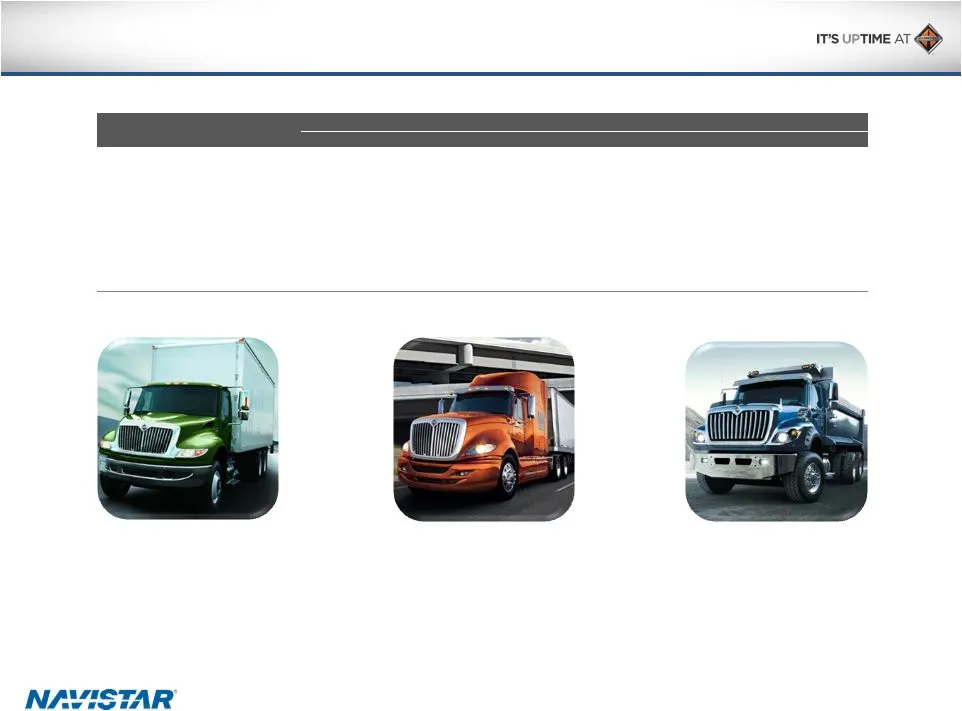
Slide 38: Retail Market Share in Commercial Vehicles
Three Months Ended April 30, 2015 January 31, 2015 October 31, 2014 July 31, 2014 April 30, 2014 Retail Market Share in Commercial Vehicles Core Markets (U.S. and Canada) Class 6 and 7 medium trucks 27% 21% 19% 20% 26% Class 8 heavy trucks 12% 10% 15% 14% 14% Class 8 severe service trucks 15% 14% 14
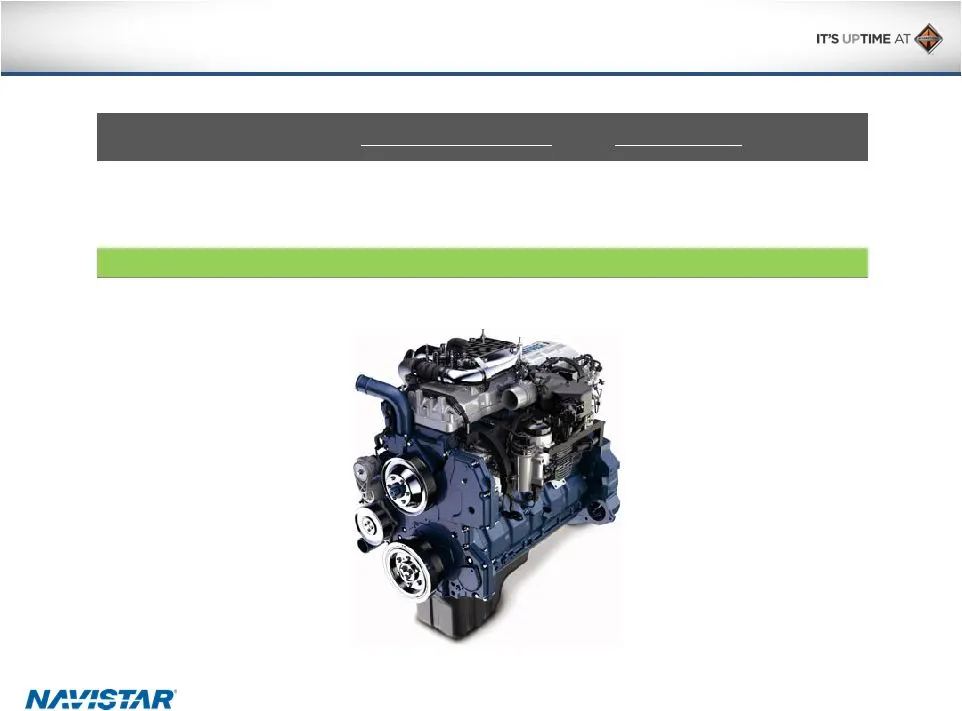
Slide 39: Worldwide Engine Shipments
Three months ended April 30, % Change Six months ended April 30, % Change (in units) 2015 2014 Change 2015 2014 Change Worldwide Engine Shipments OEM sales-South America 11,600 24,500 (12,900) (53)% 27,300 44,900 (17,600) (39)% Intercompany sales 7,000 10,100 3,100) (31)% 13,600 19,600 (6,000) (31)%
Slide 40: SEC Regulation G Non-GAAP Reconciliation
SEC Regulation G Non-GAAP Reconciliation SEC Regulation G Non-GAAP Reconciliation The financial measures presented below are unaudited and not in accordance with, or an alternative for, financial measures presented in accordance with U.S. generally accepted accounting principles ("GAAP"). The non-GA
Slide 41: EBITDA Reconciliation
Earnings (Loss) Before Interest, Taxes, Depreciation, And Amortization ("EBITDA") Reconciliation (A) Manufacturing interest expense is the net interest expense primarily generated for borrowings that support the manufacturing and corporate operations, adjusted to eliminate intercompany interest expe
Slide 42: Adjusted EBITDA Reconciliation
Adjusted EBITDA Reconciliation * For more detail on the items noted, please below footnotes (A),(C),(D),(E) (in millions) Quarter Ended April 30, 2015 EBITDA (reconciled above) $85 Less significant items of: Adjustments to pre-existing warranties* Asset impairment charges* Other restructuring charge
Slide 43: Significant Items
Significant Items (A) Adjustments to pre-existing warranties reflect changes in our estimate of warranty costs for products sold in prior periods. Such adjustments typically occur when claims experience deviates from historic and expected trends. Our warranty liability is generally affected by compo
Slide 44: Manufacturing Segment Cash and Marketable Securities Reconciliation
Manufacturing Segment Cash and Cash Equivalents and Marketable Securities Reconciliation Oct. 31, Oct. 31, Oct. 31, Oct. 31, Oct. 31, Oct. 31, Oct. 31, (in millions) Manufacturing Operations: Cash and cash equivalents $716 $775 $1,152 $534 $488 $1,059 $727 Marketable securities — Manufacturing Cash
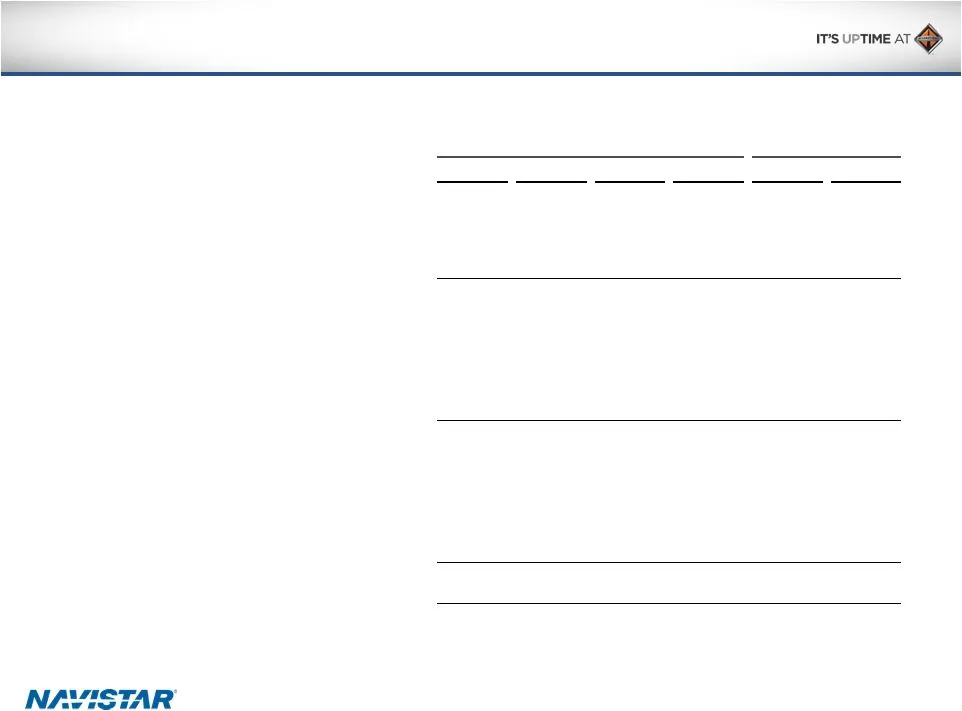
Slide 45: Manufacturing Segment Cash Reconciliation (cont'd)
Manufacturing Segment Cash and Cash Equivalents and Marketable Securities Reconciliation (cont’d) (in millions) Jan. 31, Apr. 30, Jul. 31, Oct. 31, Jan. 31, Apr. 30, Manufacturing Operations: Cash and cash equivalents $503 $563 $517 $440 $583 $536 Marketable securities Manufacturing Cash and cash eq
Source: SEC EDGAR · 8-K filed Jul 21, 2015
More decks from Navistar International Corporation
 Q2 2021 Earnings Presentation20 slides · Jun 8, 2021
 Q1 2021 Earnings Presentation20 slides · Mar 9, 2021
 Q4 2020 Earnings Presentation22 slides · Dec 17, 2020
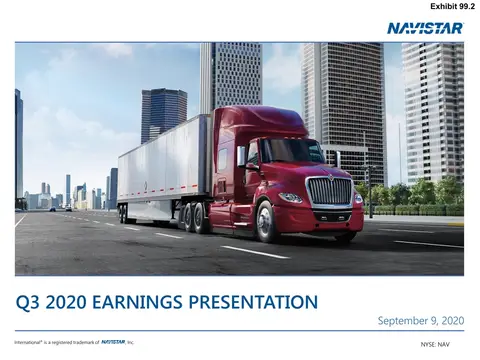 Q3 2020 Earnings Presentation21 slides · Sep 9, 2020
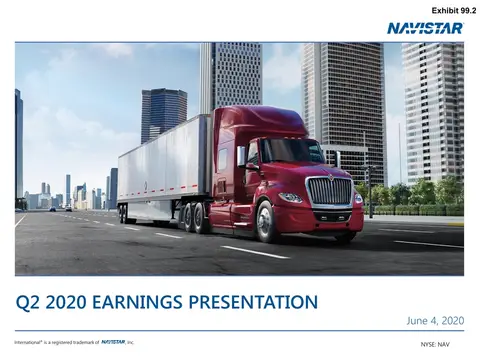 Q2 2020 Earnings Presentation21 slides · Jun 4, 2020
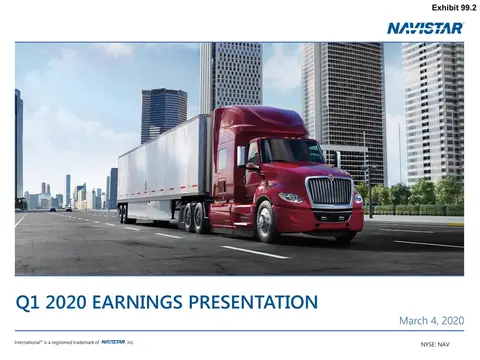 Q1 2020 Earnings Presentation21 slides · Mar 4, 2020