Columbia Property Trust — Investor Presentation (August 2015)
31 slides from Columbia Property Trust's investor presentation, Aug 24, 2015
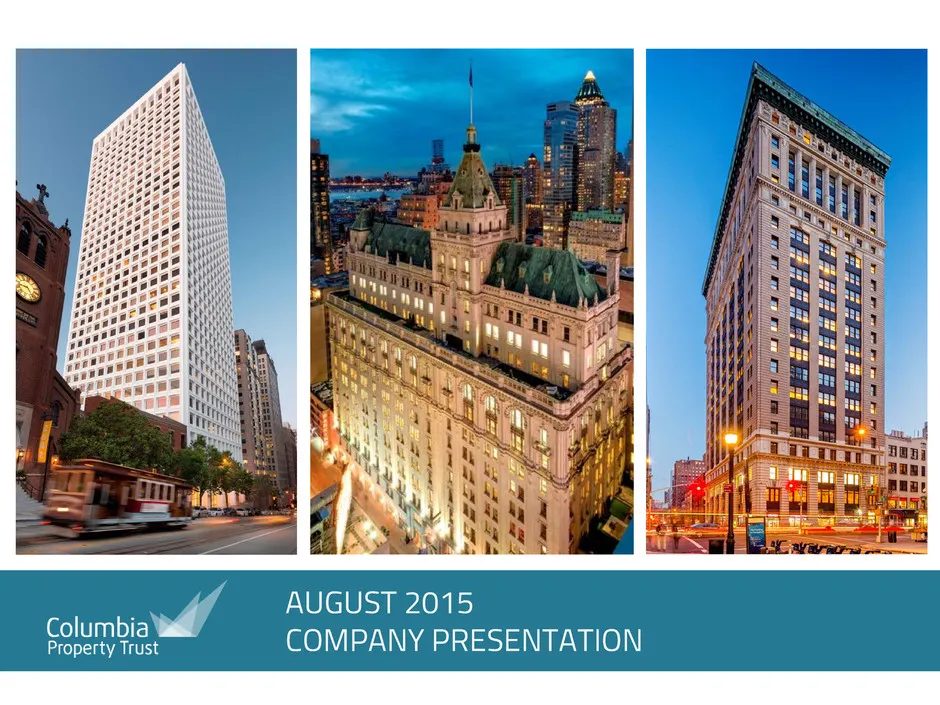
Slide 1: August 2015 Company Presentation
1 AUGUST 2015 COMPANY PRESENTATION
Slide 2: Forward-Looking Statements
2 FORWARD-LOOKING STATEMENTS Certain statements contained in this presentation other than historical facts may be considered forward-looking statements. Such statements include, in particular, statements about our plans, strategies, and prospects, and are subject to certain risks and uncertainties,
Slide 3: Presentation Overview
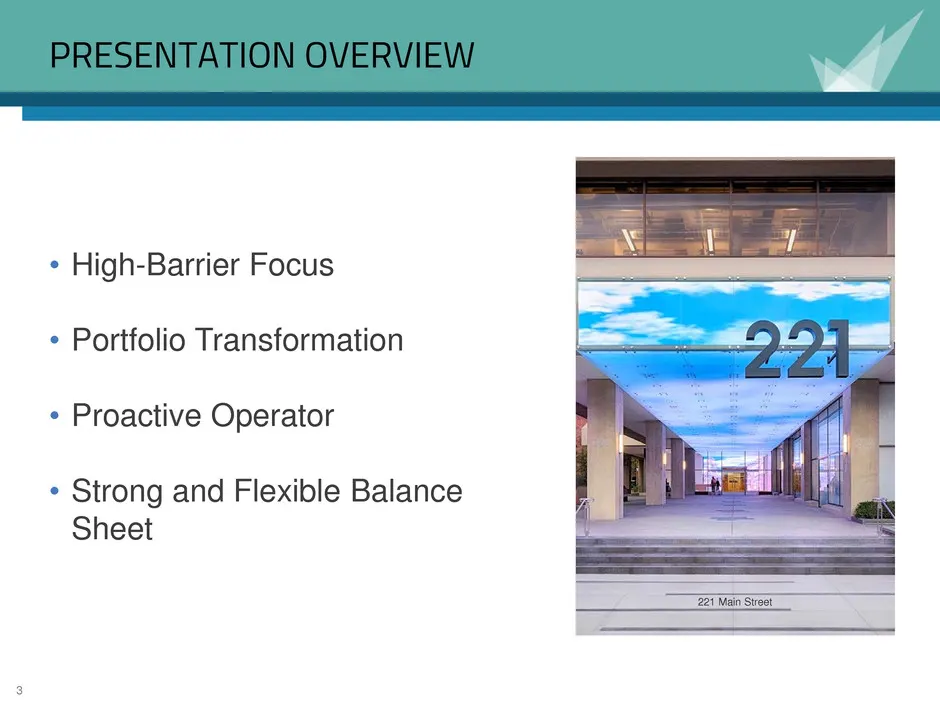
3 PRESENTATION OVERVIEW • High-Barrier Focus • Portfolio Transformation • Proactive Operator • Strong and Flexible Balance Sheet 221 Main Street

Slide 4: High-Barrier Focus
4 HIGH-BARRIER FOCUS View of 333 Market Street, San Francisco
Slide 5: Executing Growth Strategy
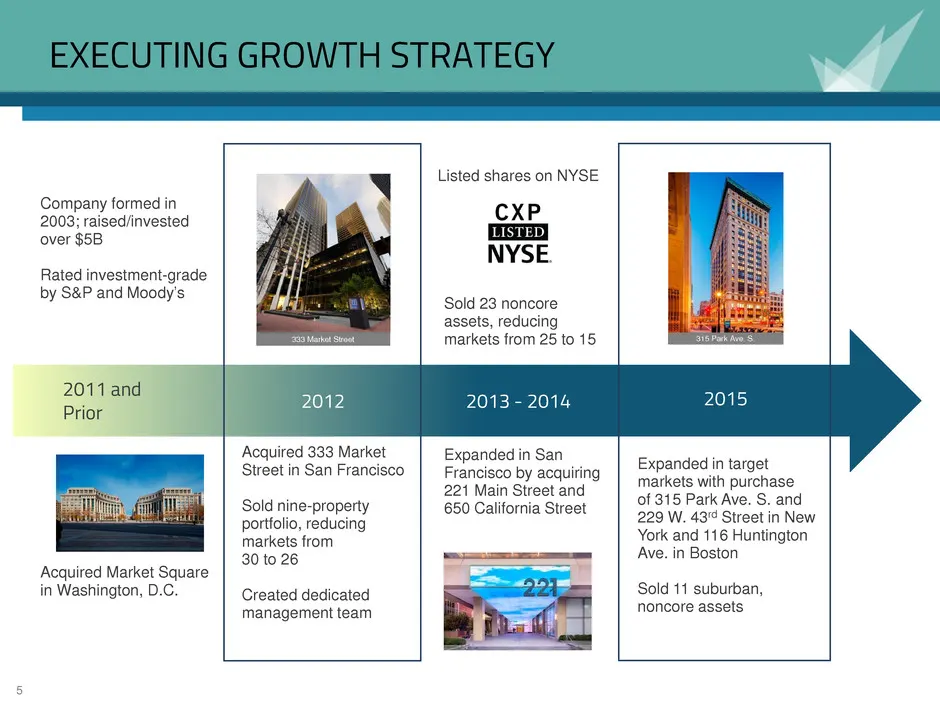
5 EXECUTING GROWTH STRATEGY Company formed in 2003; raised/invested over $5B Rated investment-grade by S&P and Moody’s Acquired Market Square in Washington, D.C. 2011 and Prior Listed shares on NYSE Expanded in San Francisco by acquiring 221 Main Street and 650 California Street Sold 23 noncore asse
Slide 6: Regional Management Platform
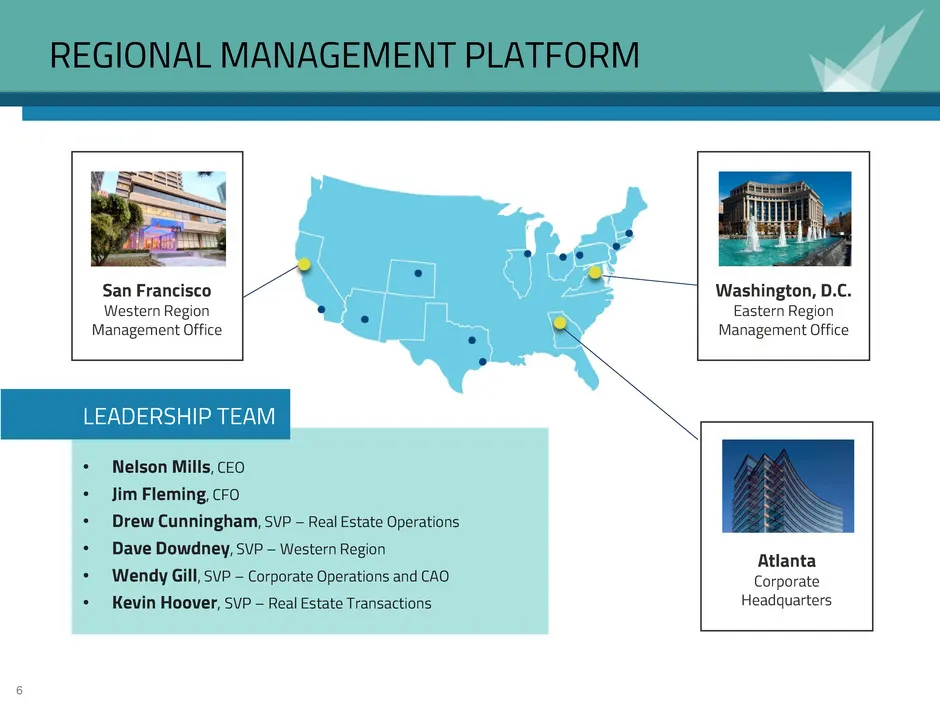
6 REGIONAL MANAGEMENT PLATFORM San Francisco Western Region Management Office Washington, D.C. Eastern Region Management Office Atlanta Corporate Headquarters LEADERSHIP TEAM • Nelson Mills, CEO • Jim Fleming, CFO • Drew Cunningham, SVP – Real Estate Operations • Dave Dowdney, SVP – Western Region •
Slide 7: Competitive Positioning
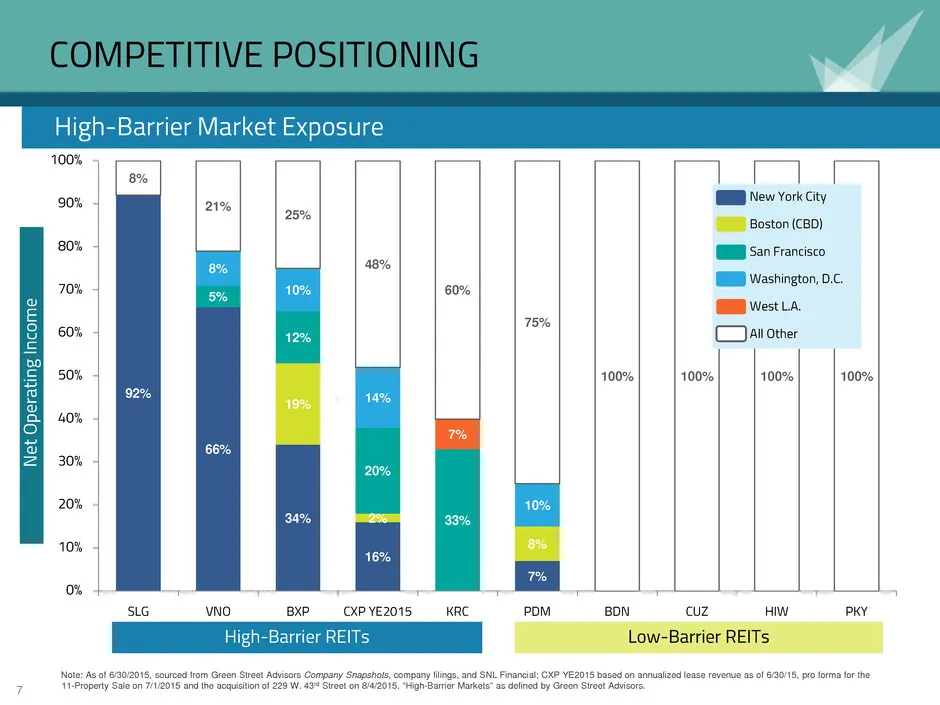
7 COMPETITIVE POSITIONING 92% 66% 34% 16% 7% 19% 2% 8% 5% 12% 20% 33% 8% 10% 14% 10% 7% 8% 21% 25% 48% 60% 75% 100% 100% 100% 100% 0% 10% 20% 30% 40% 50% 60% 70% 80% 90% 100% SLG VNO BXP CXP YE2015 KRC PDM BDN CUZ HIW PKY New York City Boston (CBD) San Francisco Washington, D.C. West L.A. All Other
Slide 8: Competitive Positioning: Net Rent Per Square Foot
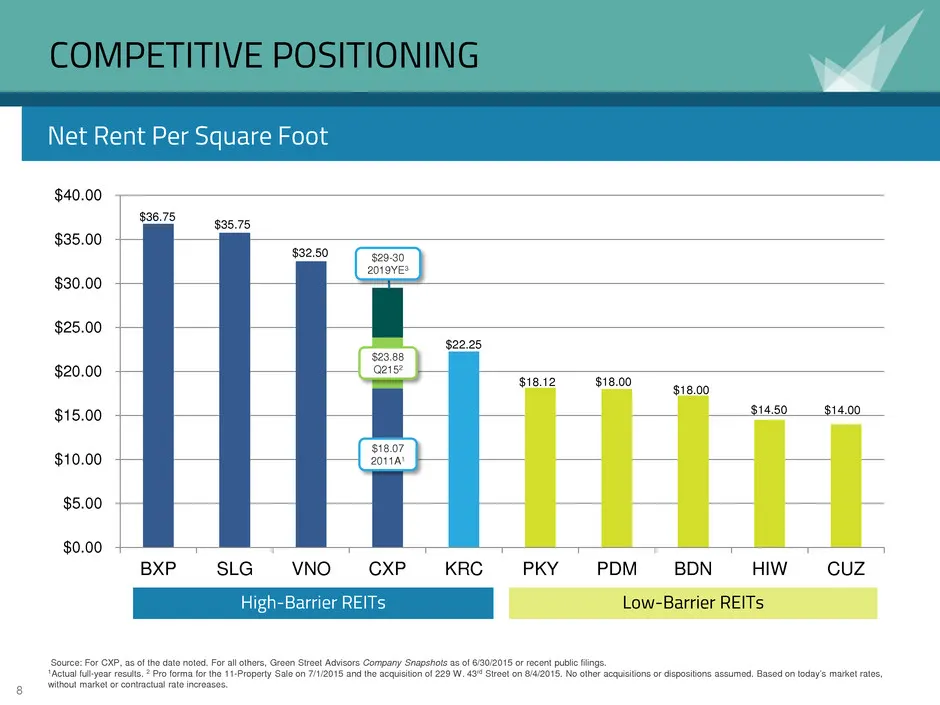
8 $0.00 $5.00 $10.00 $15.00 $20.00 $25.00 $30.00 $35.00 $40.00 BXP SLG VNO CXP KRC PKY PDM BDN HIW CUZ COMPETITIVE POSITIONING High-Barrier REITs Low-Barrier REITs Net Rent Per Square Foot Source: For CXP, as of the date noted. For all others, Green Street Advisors Company Snapshots as of 6/30/2015
Slide 9: 2015 Objectives
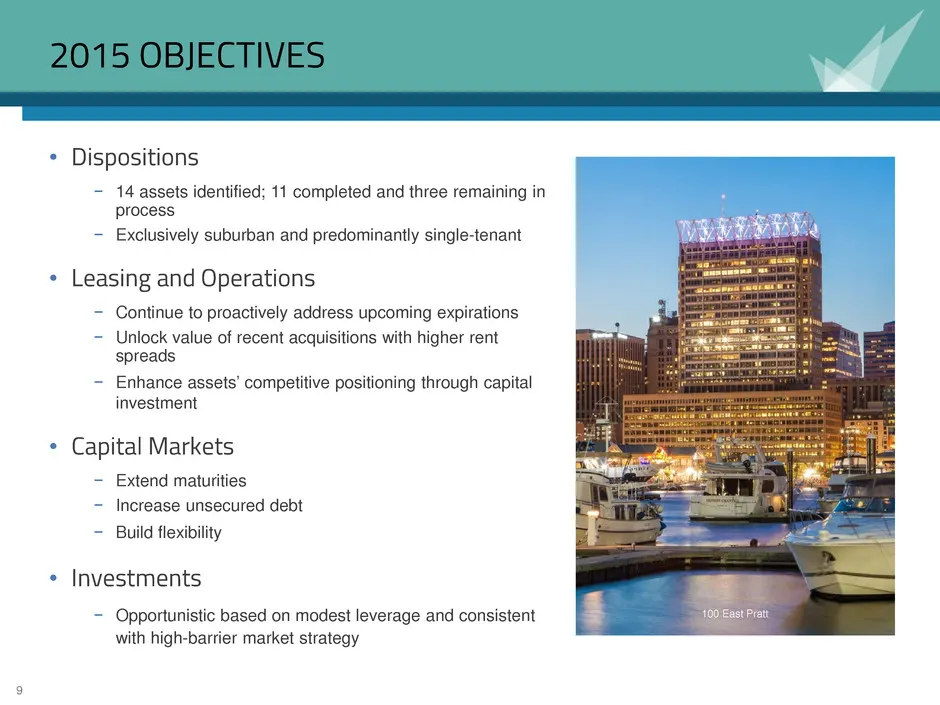
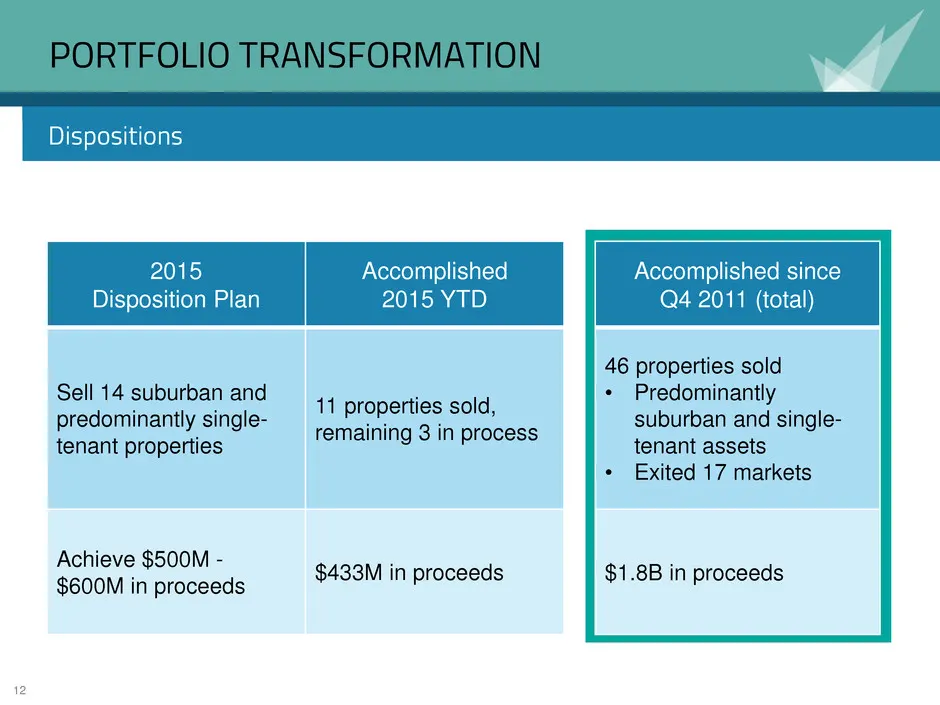
9 2015 OBJECTIVES • Dispositions − 14 assets identified; 11 completed and three remaining in process − Exclusively suburban and predominantly single-tenant • Leasing and Operations − Continue to proactively address upcoming expirations − Unlock value of recent acquisitions with higher rent spreads −
Slide 10: Portfolio Transformation
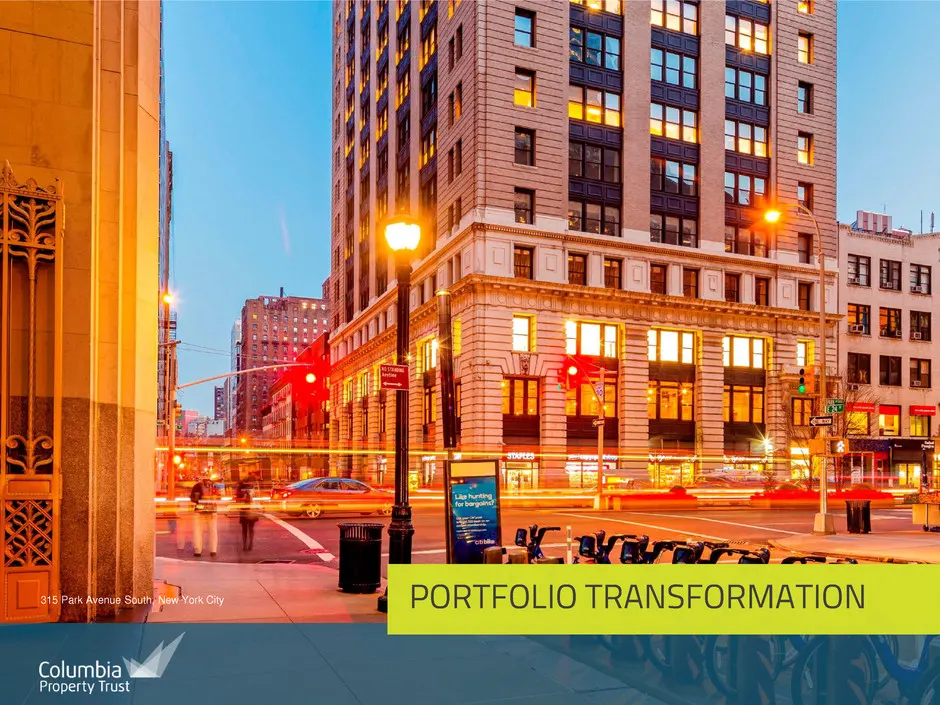
10 315 Park Avenue South, New York City PORTFOLIO TRANSFORMATION
Slide 11: Portfolio Transformation: Target Portfolio Profile
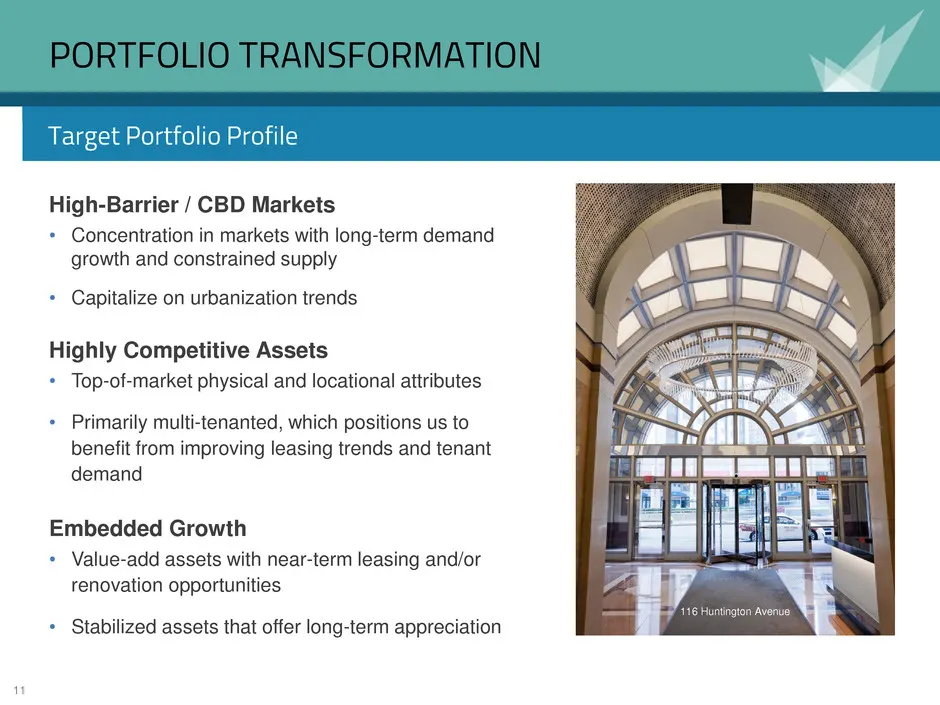
11 PORTFOLIO TRANSFORMATION High-Barrier / CBD Markets • Concentration in markets with long-term demand growth and constrained supply • Capitalize on urbanization trends Highly Competitive Assets • Top-of-market physical and locational attributes • Primarily multi-tenanted, which positions us to ben
Slide 12: Portfolio Transformation: Dispositions
12 PORTFOLIO TRANSFORMATION Dispositions 2015 Disposition Plan Accomplished 2015 YTD Sell 14 suburban and predominantly single- tenant properties 11 properties sold, remaining 3 in process Achieve $500M - $600M in proceeds $433M in proceeds Accomplished since Q4 2011 (total) 46 properties sold • Pre
Slide 13: Portfolio Transformation: Acquisitions
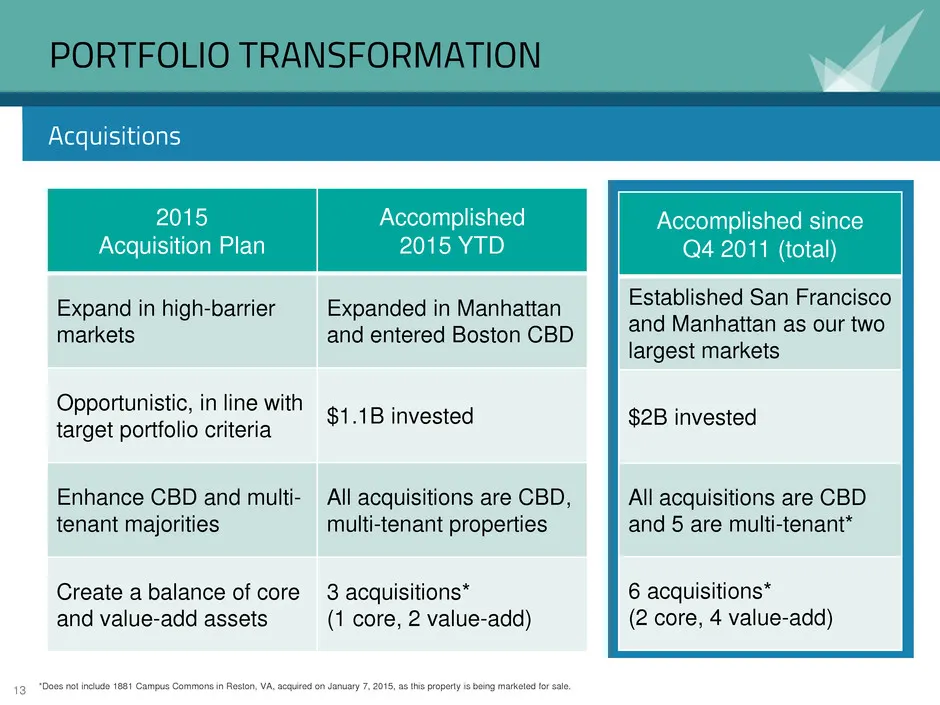
13 PORTFOLIO TRANSFORMATION Acquisitions 2015 Acquisition Plan Accomplished 2015 YTD Expand in high-barrier markets Expanded in Manhattan and entered Boston CBD Opportunistic, in line with target portfolio criteria $1.1B invested Enhance CBD and multi- tenant majorities All acquisitions are CBD, mul
Slide 14: 2014 Acquisitions: San Francisco
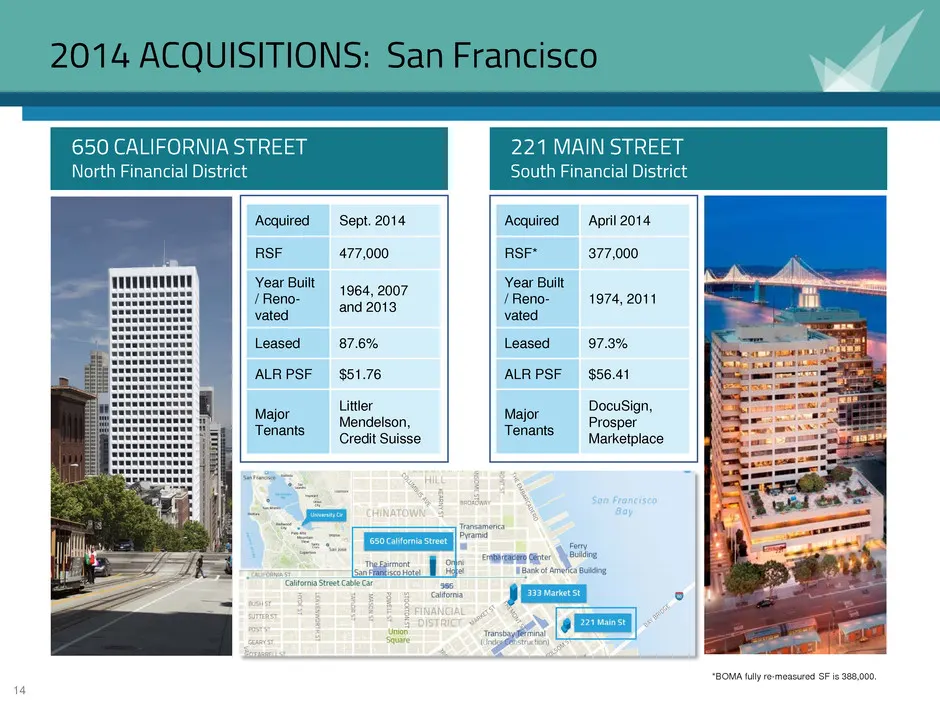
14 Acquired April 2014 RSF* 377,000 Year Built / Reno- vated 1974, 2011 Leased 97.3% ALR PSF $56.41 Major Tenants DocuSign, Prosper Marketplace 2014 ACQUISITIONS: San Francisco 221 MAIN STREET South Financial District 650 CALIFORNIA STREET North Financial District Acquired Sept. 2014 RSF 477,000 Yea
Slide 15: 2015 Acquisitions: Boston Huntington Avenue
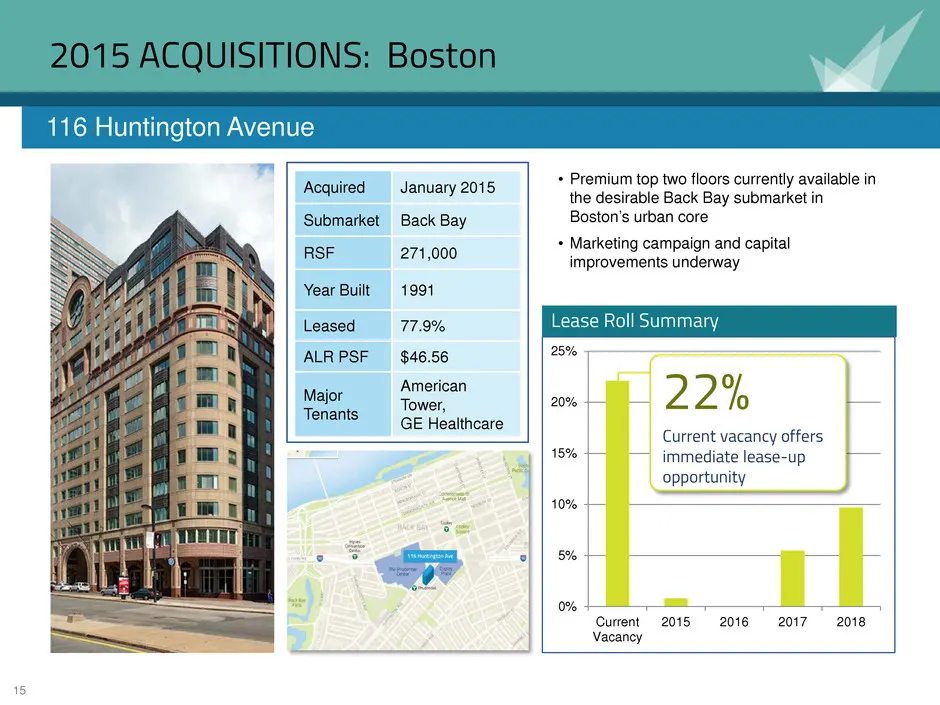
15 2015 ACQUISITIONS: Boston 116 Huntington Avenue Acquired January 2015 Submarket Back Bay RSF 271,000 Year Built 1991 Leased 77.9% ALR PSF $46.56 Major Tenants American Tower, GE Healthcare Lease Roll Summary 0% 5% 10% 15% 20% 25% Current Vacancy 2015 2016 2017 2018 22% Current vacancy offers imme
Slide 16: 2015 Acquisitions: New York City Park Avenue South
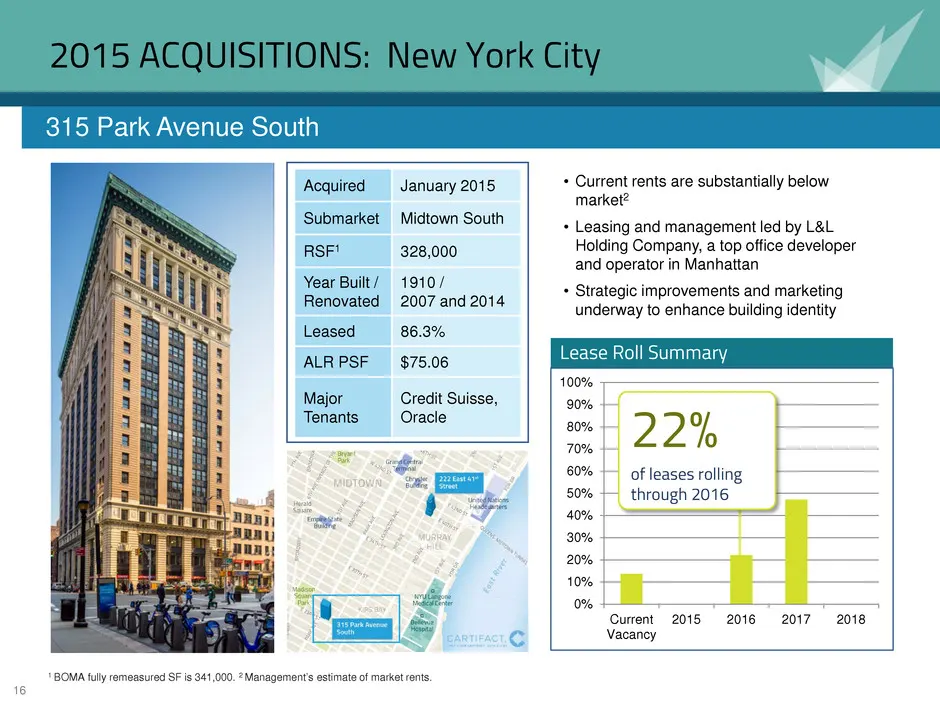
16 2015 ACQUISITIONS: New York City 315 Park Avenue South Acquired January 2015 Submarket Midtown South RSF1 328,000 Year Built / Renovated 1910 / 2007 and 2014 Leased 86.3% ALR PSF $75.06 Major Tenants Credit Suisse, Oracle • Current rents are substantially below market2 • Leasing and management le
Slide 17: 2015 Acquisitions: 229 West 43rd Street
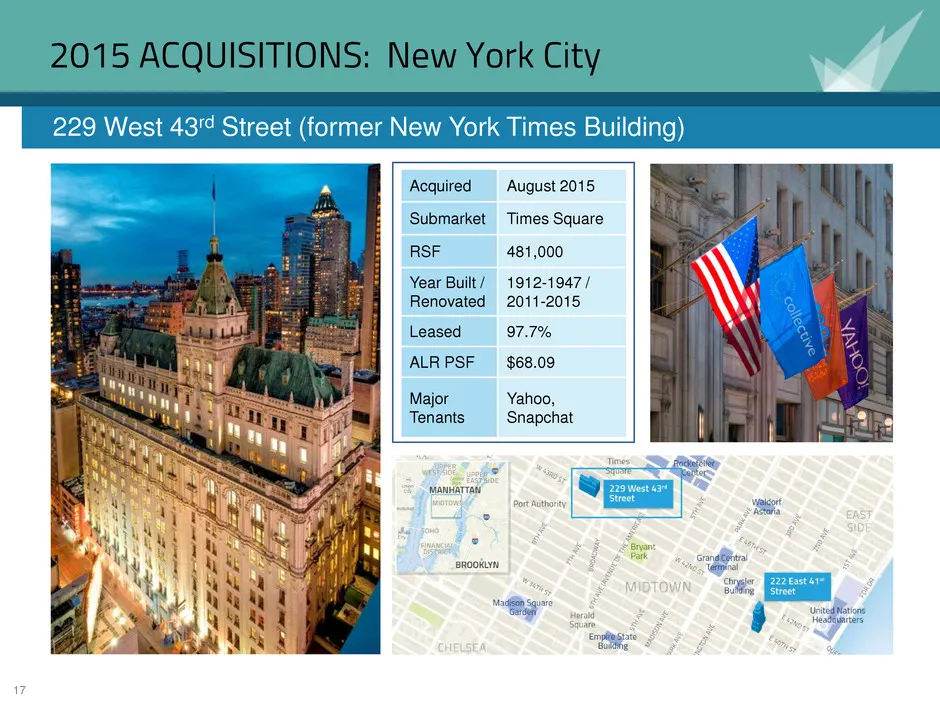
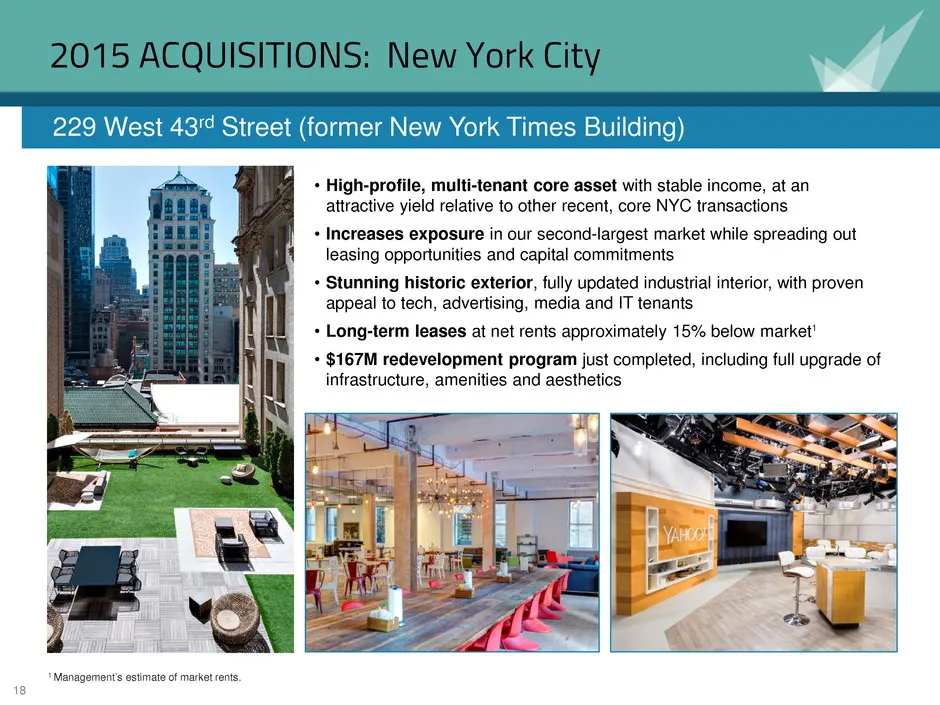
17 Acquired August 2015 Submarket Times Square RSF 481,000 Year Built / Renovated 1912-1947 / 2011-2015 Leased 97.7% ALR PSF $68.09 Major Tenants Yahoo, Snapchat 2015 ACQUISITIONS: New York City 229 West 43rd Street (former New York Times Building)
Slide 18: 2015 Acquisitions: West 43rd Street (former New York Times Building)
18 2015 ACQUISITIONS: New York City 229 West 43rd Street (former New York Times Building) 1 Management’s estimate of market rents. • High-profile, multi-tenant core asset with stable income, at an attractive yield relative to other recent, core NYC transactions • Increases exposure in our second-lar
Slide 19: Portfolio Transformation: Portfolio Profile Today
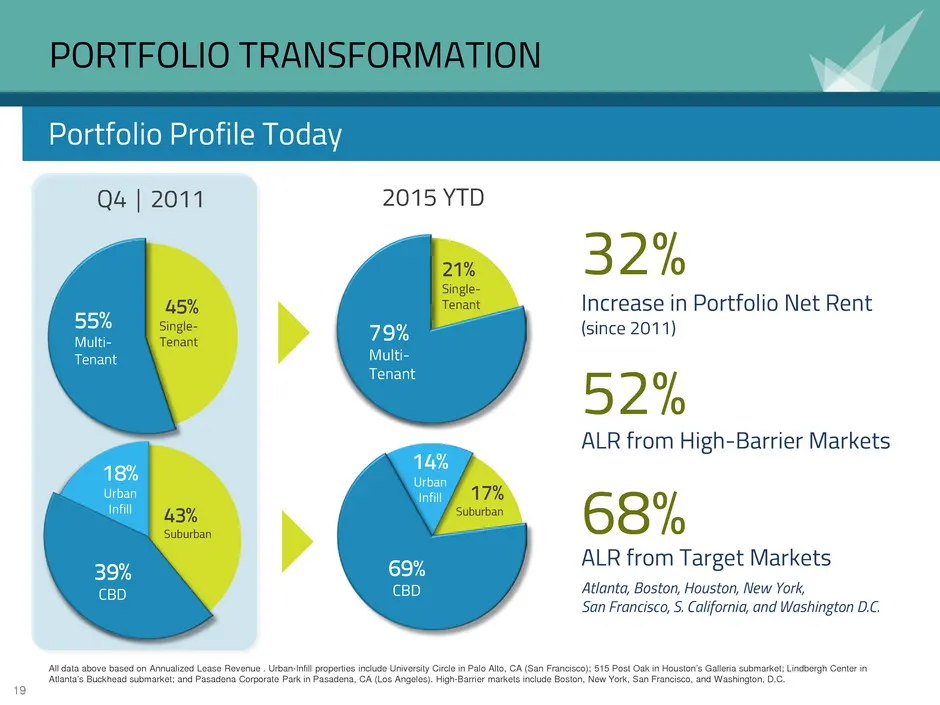
19 PORTFOLIO TRANSFORMATION Portfolio Profile Today All data above based on Annualized Lease Revenue . Urban-Infill properties include University Circle in Palo Alto, CA (San Francisco); 515 Post Oak in Houston’s Galleria submarket; Lindbergh Center in Atlanta’s Buckhead submarket; and Pasadena Corp
Slide 20: Proactive Operator
20 PROACTIVE OPERATOR 221 Main Street, San Francisco
Slide 21: Summary: Key Leasing Accomplishments
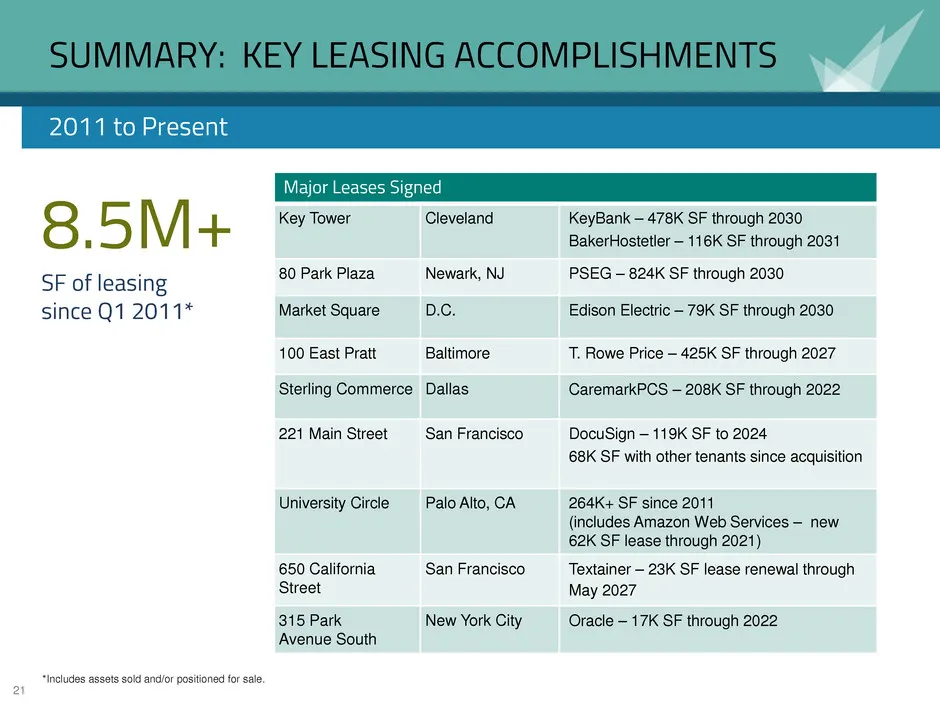
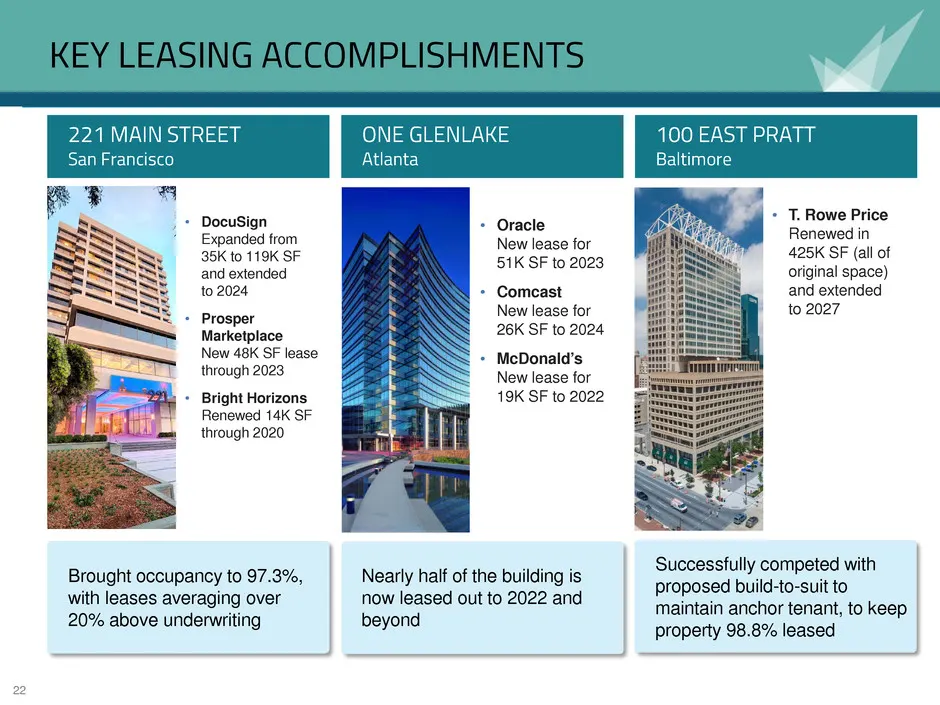
21 SUMMARY: KEY LEASING ACCOMPLISHMENTS 2011 to Present 8.5M+ SF of leasing since Q1 2011* Major Leases Signed Key Tower Cleveland KeyBank – 478K SF through 2030 BakerHostetler – 116K SF through 2031 80 Park Plaza Newark, NJ PSEG – 824K SF through 2030 Market Square D.C. Edison Electric – 79K SF thr
Slide 22: Key Leasing Accomplishments
22 KEY LEASING ACCOMPLISHMENTS ONE GLENLAKE Atlanta • Oracle New lease for 51K SF to 2023 • Comcast New lease for 26K SF to 2024 • McDonald’s New lease for 19K SF to 2022 Nearly half of the building is now leased out to 2022 and beyond 100 EAST PRATT Baltimore • T. Rowe Price Renewed in 425K SF (all
Slide 23: Key Leasing Accomplishments
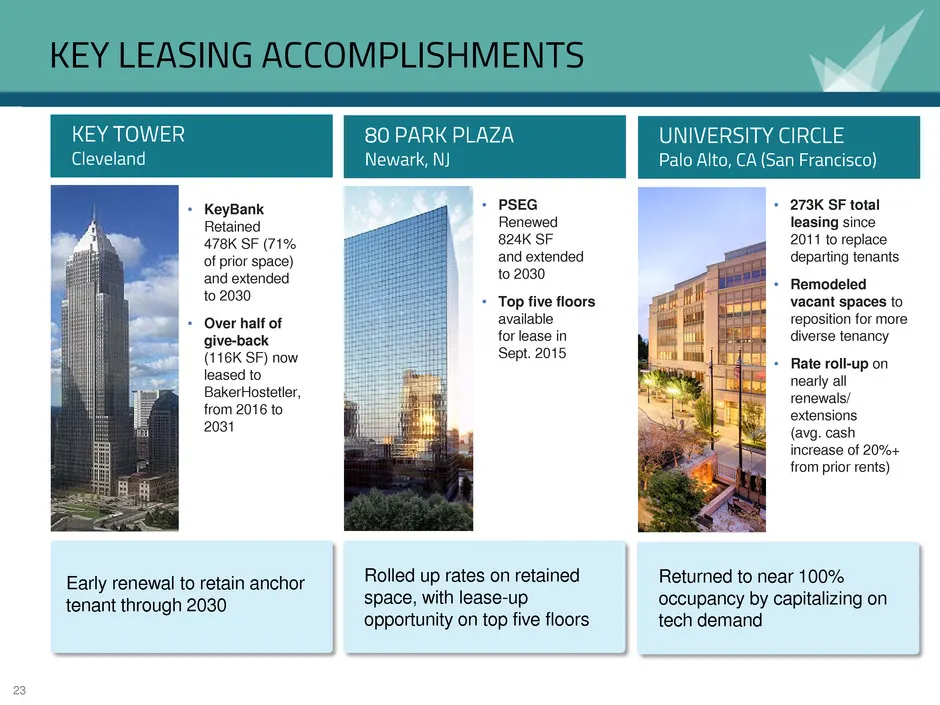
23 KEY LEASING ACCOMPLISHMENTS • KeyBank Retained 478K SF (71% of prior space) and extended to 2030 • Over half of give-back (116K SF) now leased to BakerHostetler, from 2016 to 2031 • PSEG Renewed 824K SF and extended to 2030 • Top five floors available for lease in Sept. 2015 KEY TOWER Cleveland E
Slide 24: Lease Expirations
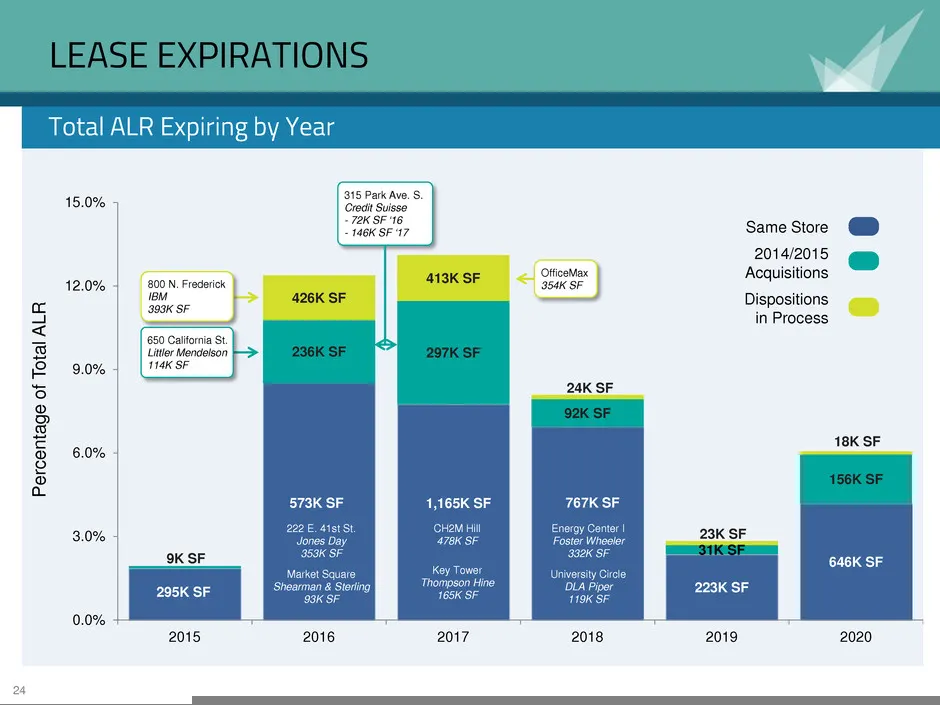
24 295K SF 573K SF 1,165K SF 767K SF 223K SF 646K SF 9K SF 236K SF 297K SF 92K SF 31K SF 156K SF 426K SF 413K SF 24K SF 23K SF 18K SF 0.0% 3.0% 6.0% 9.0% 12.0% 15.0% 2015 2016 2017 2018 2019 2020 CH2M Hill 478K SF Key Tower Thompson Hine 165K SF 222 E. 41st St. Jones Day 353K SF Market Square Shearm
Slide 25: Key Leasing Opportunities
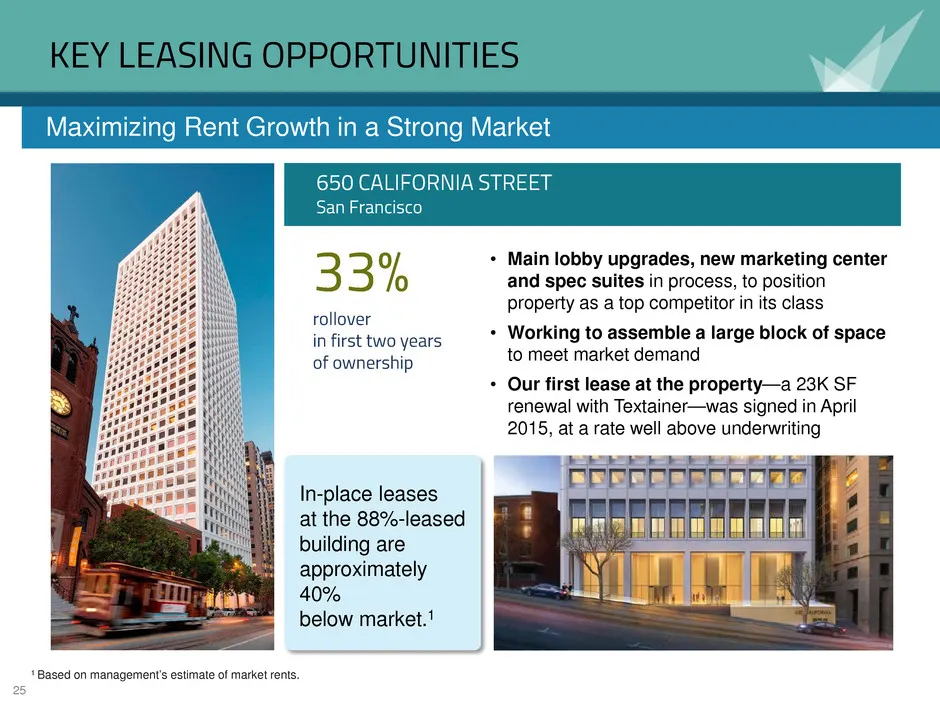
25 KEY LEASING OPPORTUNITIES Maximizing Rent Growth in a Strong Market 650 CALIFORNIA STREET San Francisco In-place leases at the 88%-leased building are approximately 40% below market.1 • Main lobby upgrades, new marketing center and spec suites in process, to position property as a top competitor
Slide 26: Key Leasing Opportunities
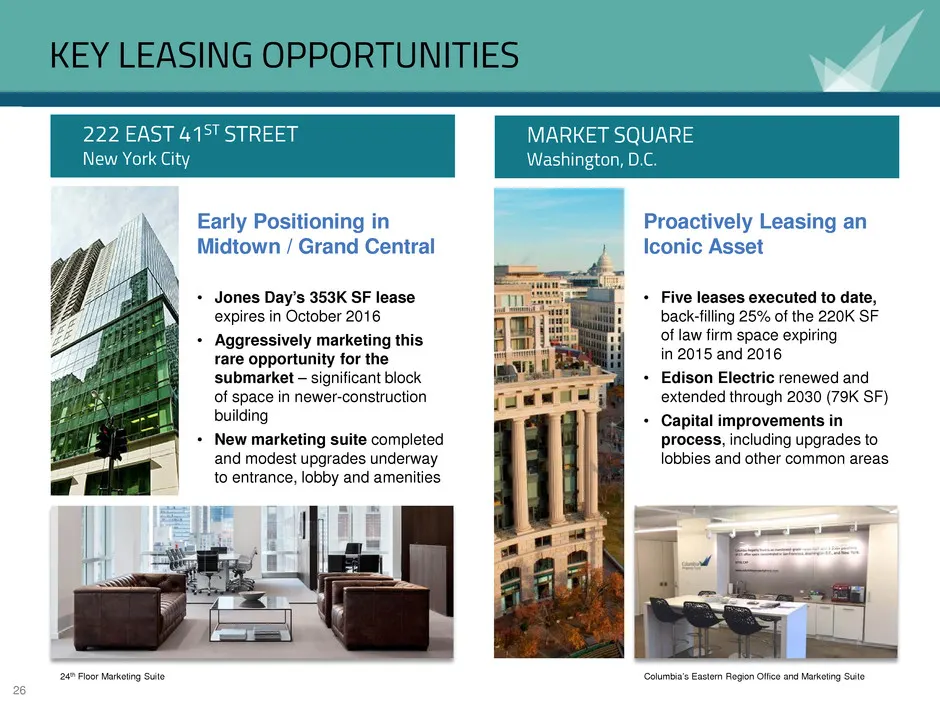
26 KEY LEASING OPPORTUNITIES 222 EAST 41ST STREET New York City MARKET SQUARE Washington, D.C. Early Positioning in Midtown / Grand Central • Jones Day’s 353K SF lease expires in October 2016 • Aggressively marketing this rare opportunity for the submarket – significant block of space in newer-const
Slide 27: Summary: Key Leasing Opportunities
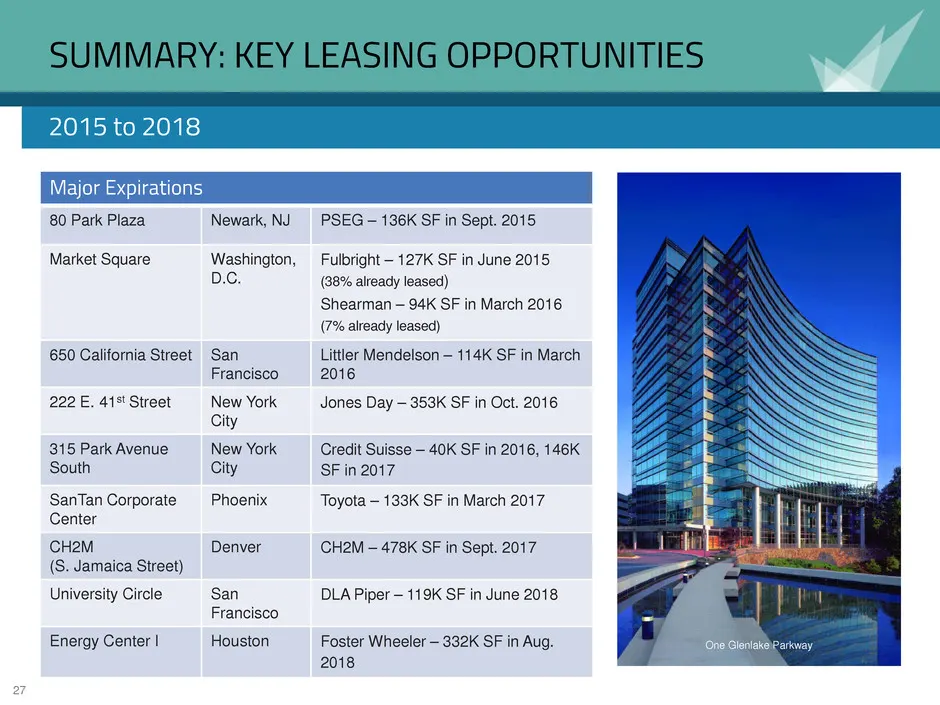
27 SUMMARY: KEY LEASING OPPORTUNITIES Major Expirations 80 Park Plaza Newark, NJ PSEG – 136K SF in Sept. 2015 Market Square Washington, D.C. Fulbright – 127K SF in June 2015 (38% already leased) Shearman – 94K SF in March 2016 (7% already leased) 650 California Street San Francisco Littler Mendelson

Slide 28: Strong and Flexible Balance Sheet
28 650 California Street, San Francisco STRONG AND FLEXIBLE BALANCE SHEET
Slide 29: Capital Profile
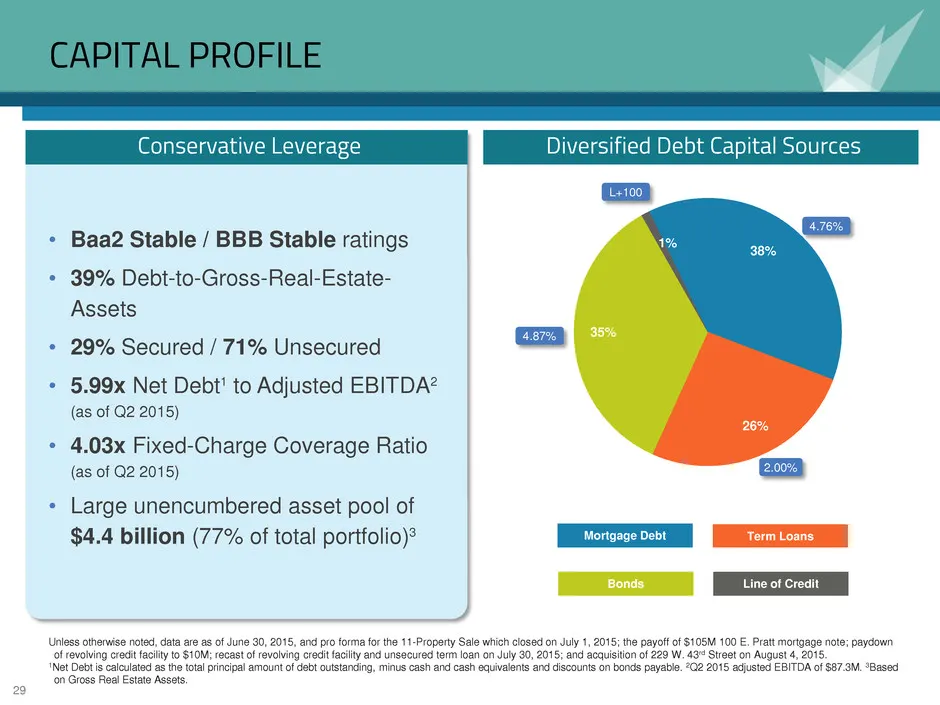
29 CAPITAL PROFILE • Baa2 Stable / BBB Stable ratings • 39% Debt-to-Gross-Real-Estate- Assets • 29% Secured / 71% Unsecured • 5.99x Net Debt1 to Adjusted EBITDA2 (as of Q2 2015) • 4.03x Fixed-Charge Coverage Ratio (as of Q2 2015) • Large unencumbered asset pool of $4.4 billion (77% of total portfoli
Slide 30: Debt Maturities
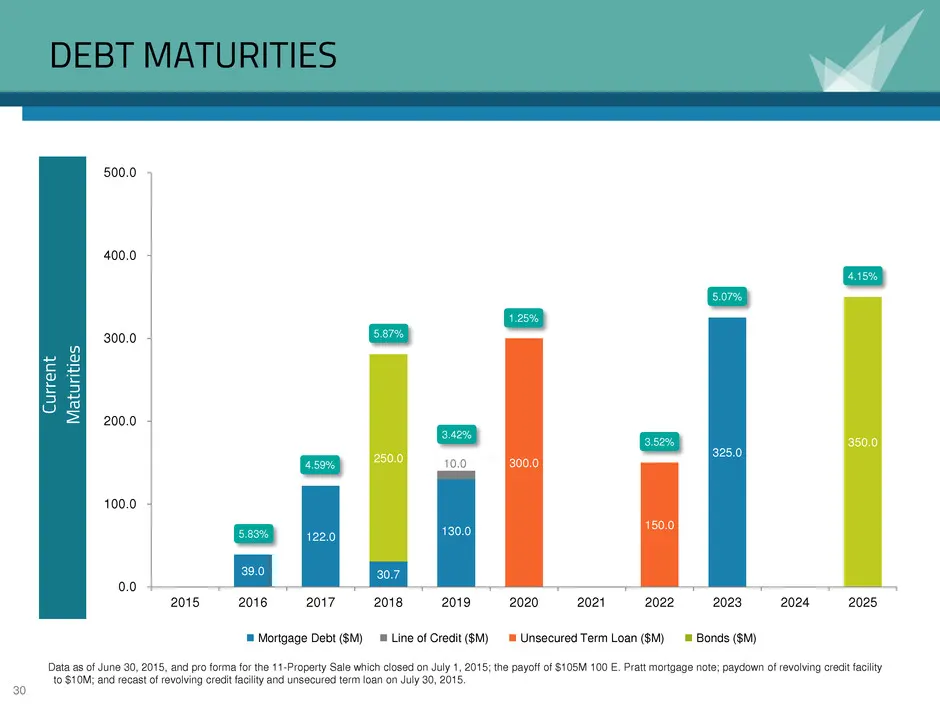
30 DEBT MATURITIES 39.0 122.0 30.7 130.0 325.0 10.0 300.0 150.0 250.0 350.0 0.0 100.0 200.0 300.0 400.0 500.0 2015 2016 2017 2018 2019 2020 2021 2022 2023 2024 2025 Cu rr en t M at ur iti es Mortgage Debt ($M) Line of Credit ($M) Unsecured Term Loan ($M) Bonds ($M) Data as of June 30, 2015,
Slide 31: For More Information
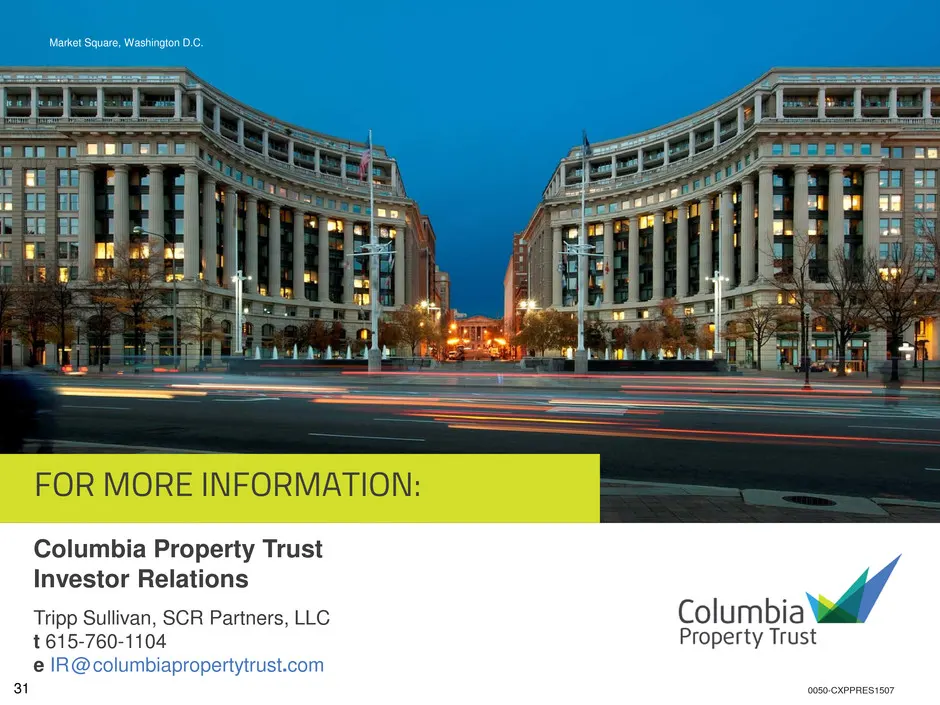
31 FOR MORE INFORMATION: Columbia Property Trust Investor Relations Tripp Sullivan, SCR Partners, LLC t 615-760-1104 e IR @ columbiapropertytrust.com 0050-CXPPRES1507 Market Square, Washington D.C.
Source: SEC EDGAR · 8-K filed Aug 24, 2015
More decks from Columbia Property Trust Inc
 Investor Presentation (November 2020)33 slides · Nov 17, 2020
 Investor Presentation (August 2020)34 slides · Aug 31, 2020
 Investor Presentation (June 2020)34 slides · Jun 1, 2020
 Investor Presentation (February 2020)29 slides · Feb 26, 2020
 Corporate Update (December 2019)12 slides · Dec 3, 2019
 Investor Presentation (November 2019)28 slides · Nov 12, 2019