Amplify Energy Corp. · NYSE:AMPY
Amplify Energy — Investor Presentation (December 2019)
25 slides from Amplify Energy's investor presentation, December 2019
Slide 1: Investor Presentation
Investor Presentation December 2019
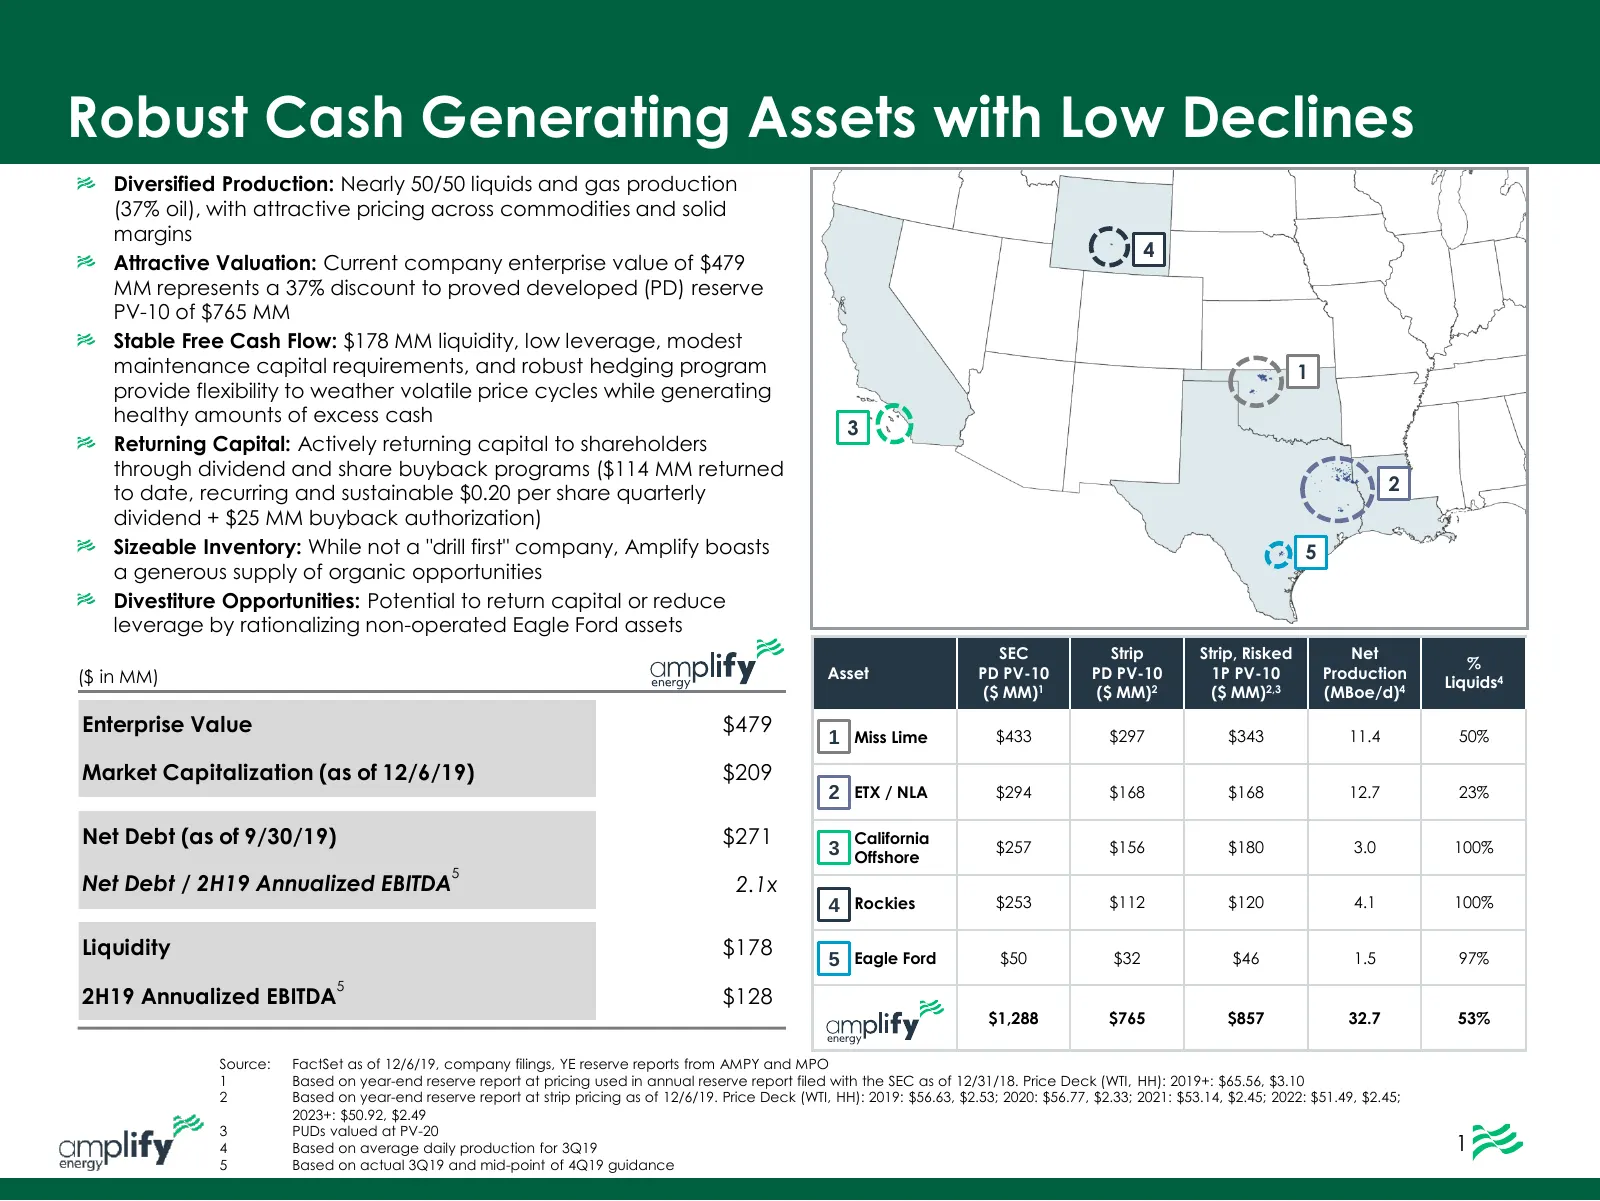
Slide 2: Robust Cash Generating Assets with Low Declines
Robust Cash Generating Assets with Low Declines Diversified Production: Nearly 50/50 liquids and gas production (37% oil), with attractive pricing across commodities and solid margins 4 Attractive Valuation: Current company enterprise value of $479 MM represents a 37% discount to proved developed (P
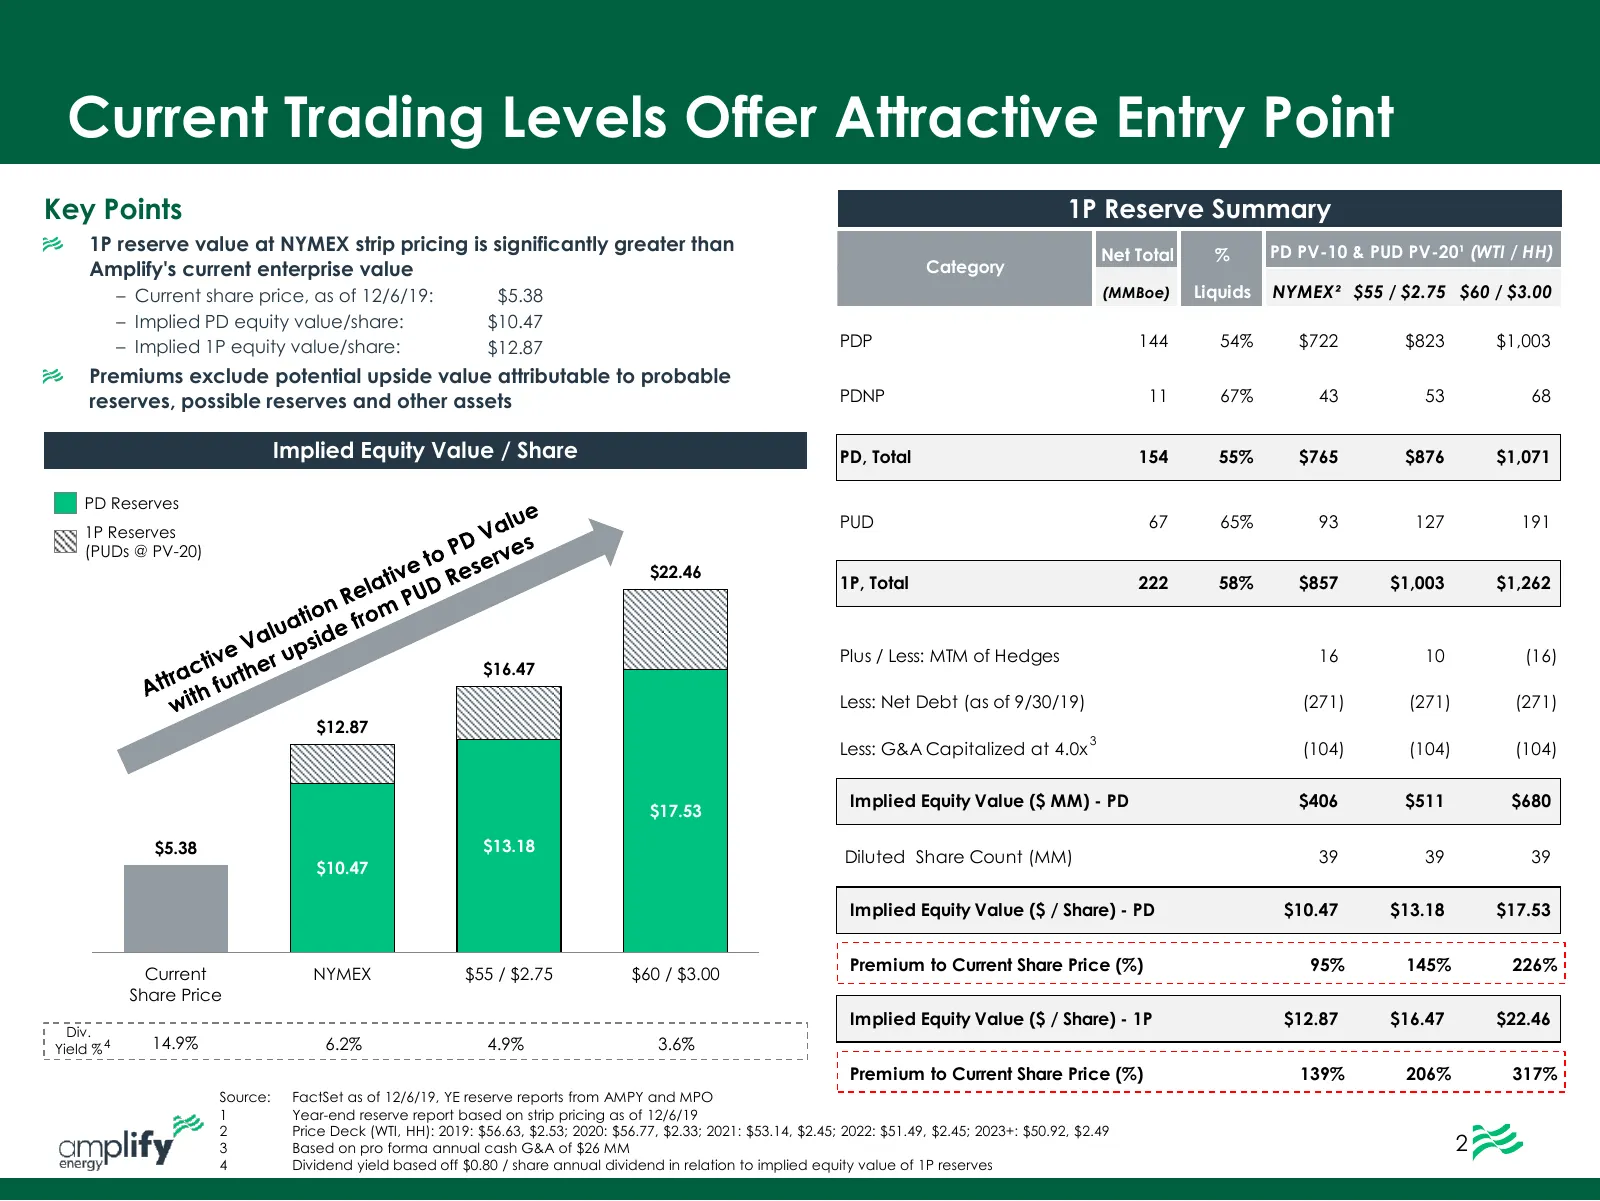
Slide 3: Current Trading Levels Offer Attractive Entry Point
Current Trading Levels Offer Attractive Entry Point Key Points 1P Reserve Summary 1P reserve value at NYMEX strip pricing is significantly greater than Net Total % PD PV-10 & PUD PV-20¹ (WTI / HH) Amplify's current enterprise value Category – Current share price, as of 12/6/19: $5.38 (MMBoe) Liquids
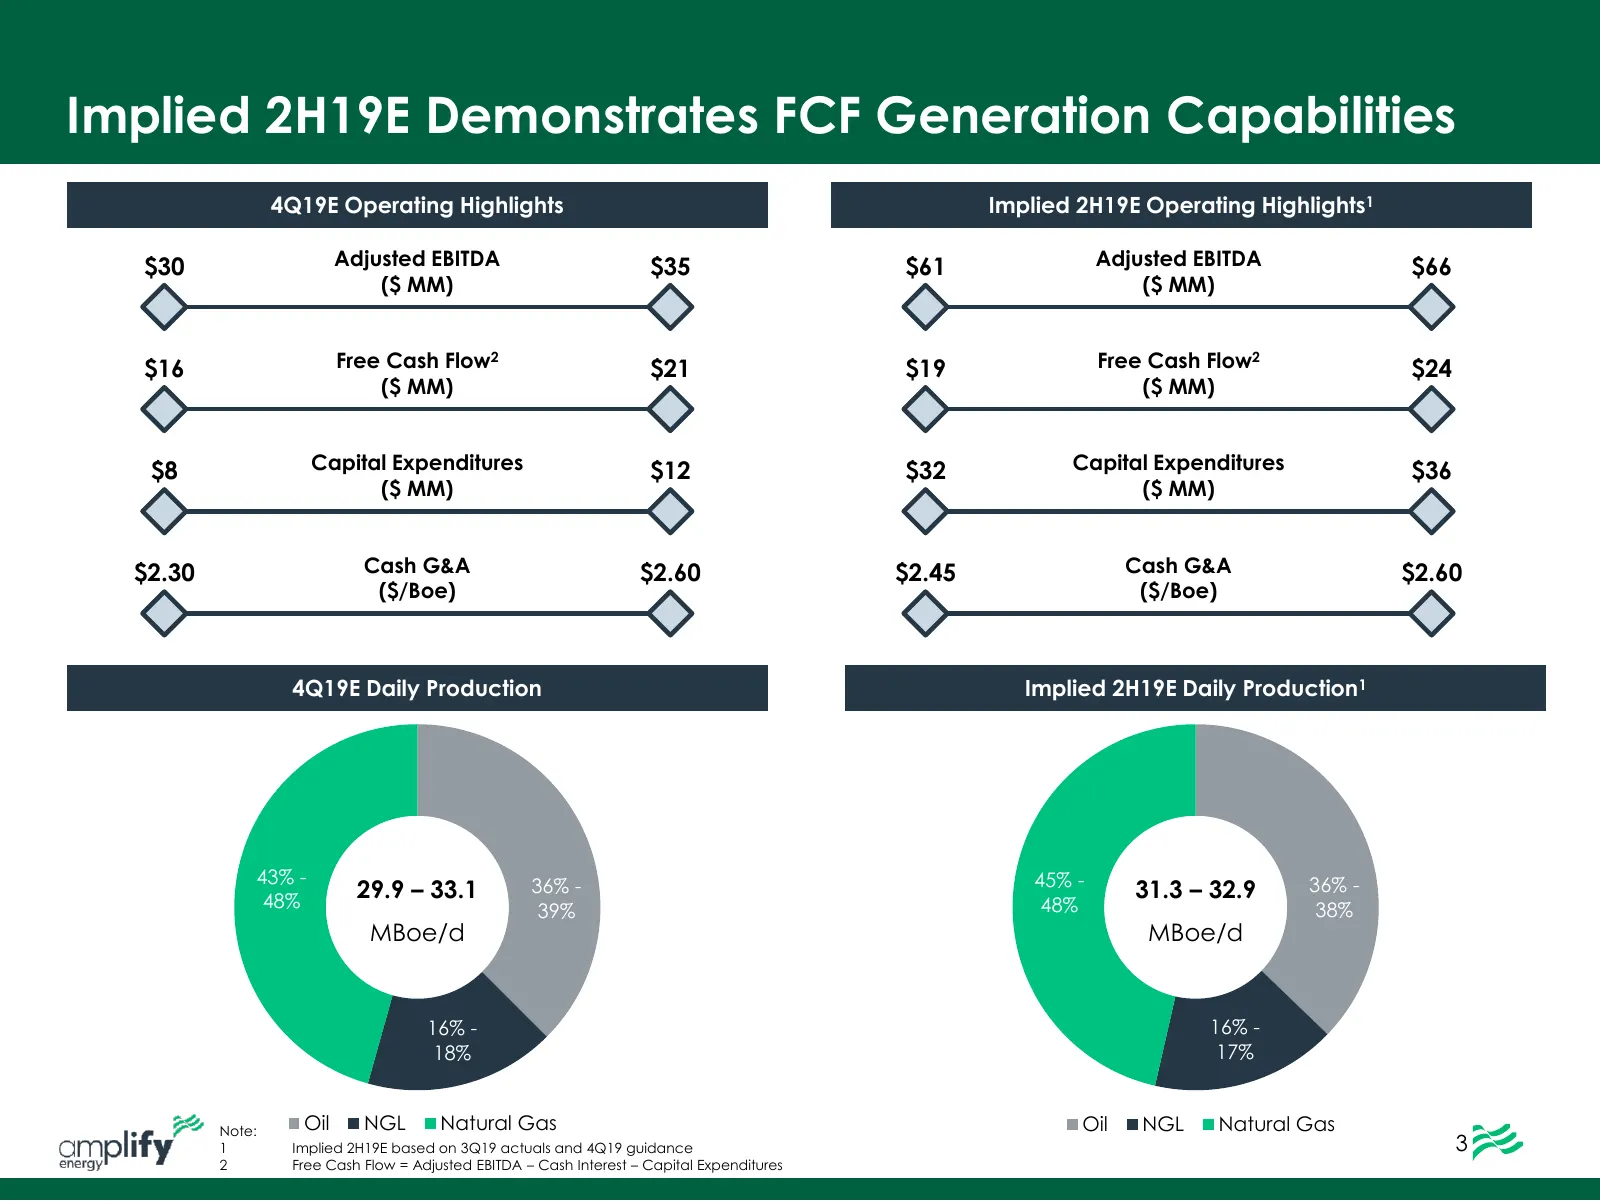
Slide 4: Implied 2H19E Demonstrates FCF Generation Capabilities
Implied 2H19E Demonstrates FCF Generation Capabilities 4Q19E Operating Highlights Implied 2H19E Operating Highlights1 $30 Adjusted EBITDA $35 $61 Adjusted EBITDA $66 ($ MM) ($ MM) $16 Free Cash Flow2 $21 $19 Free Cash Flow2 $24 ($ MM) ($ MM) $8 Capital Expenditures $12 $32 Capital Expenditures $36 (
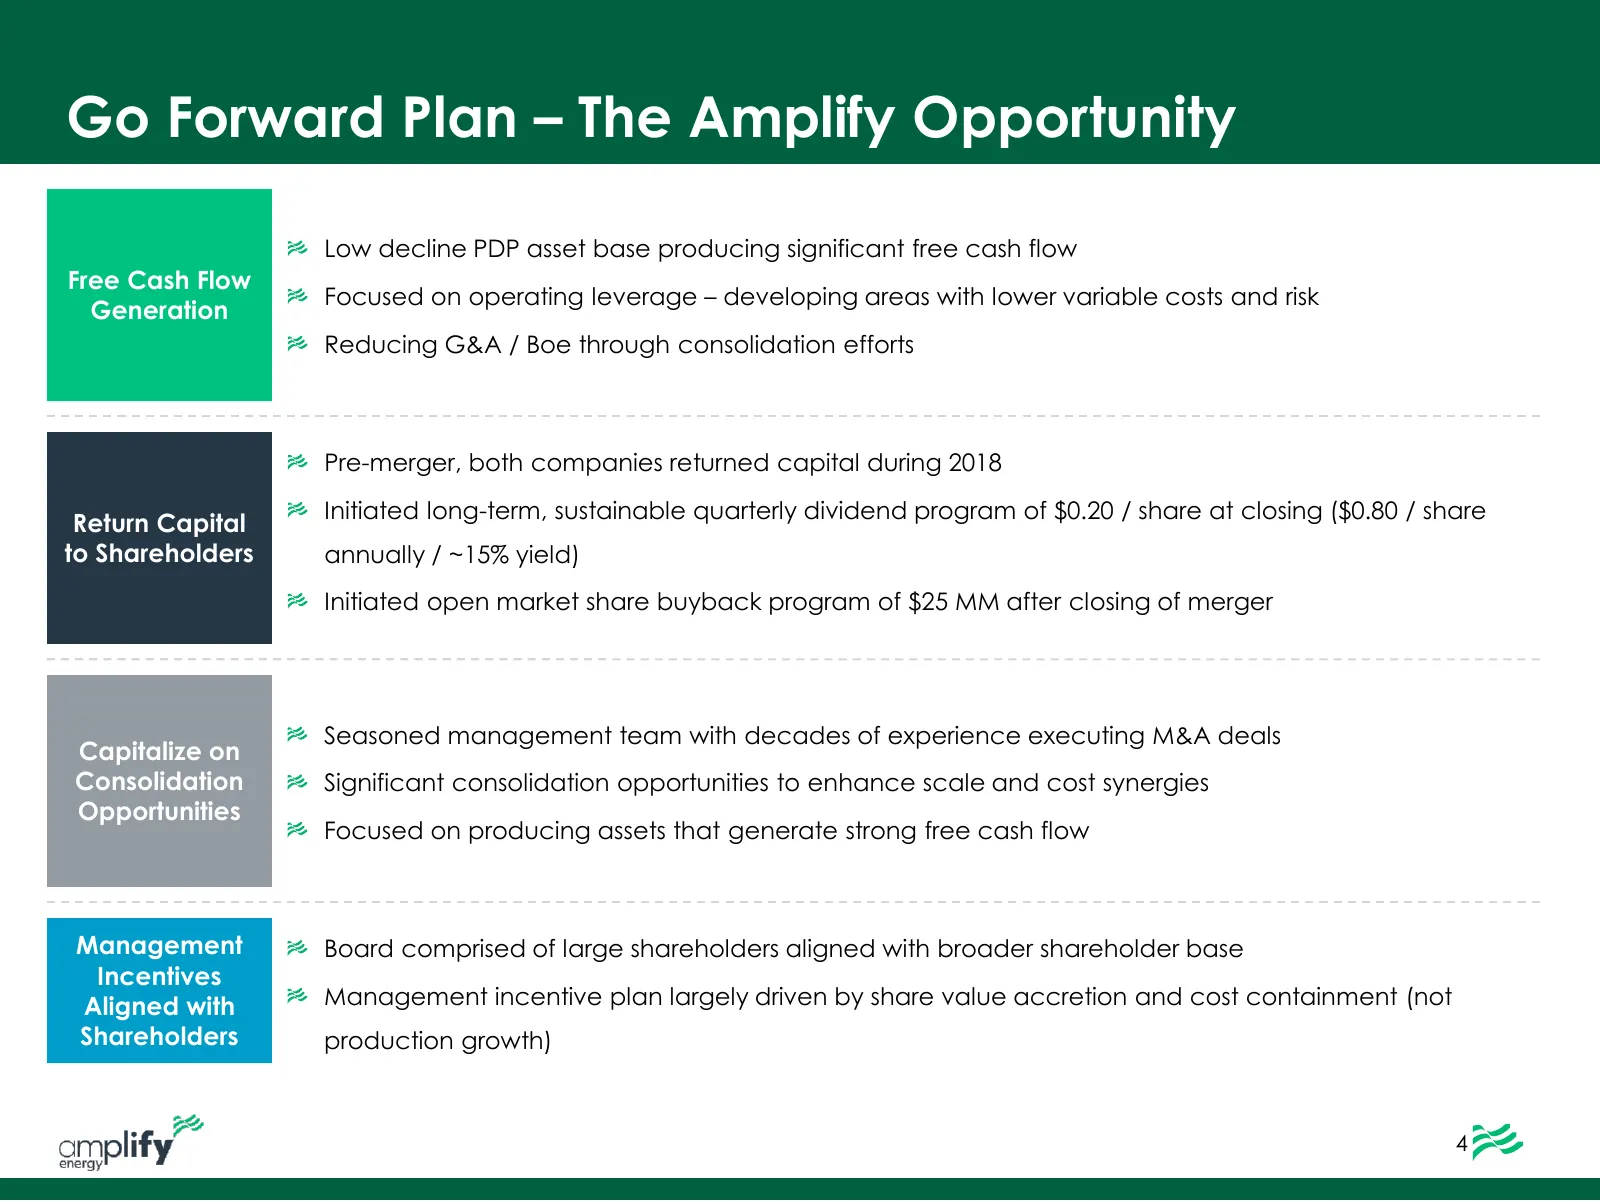
Slide 5: Go Forward Plan – The Amplify Opportunity
Go Forward Plan – The Amplify Opportunity Low decline PDP asset base producing significant free cash flow Free Cash Flow Focused on operating leverage – developing areas with lower variable costs and risk Generation Reducing G&A / Boe through consolidation efforts Pre-merger, both companies returned
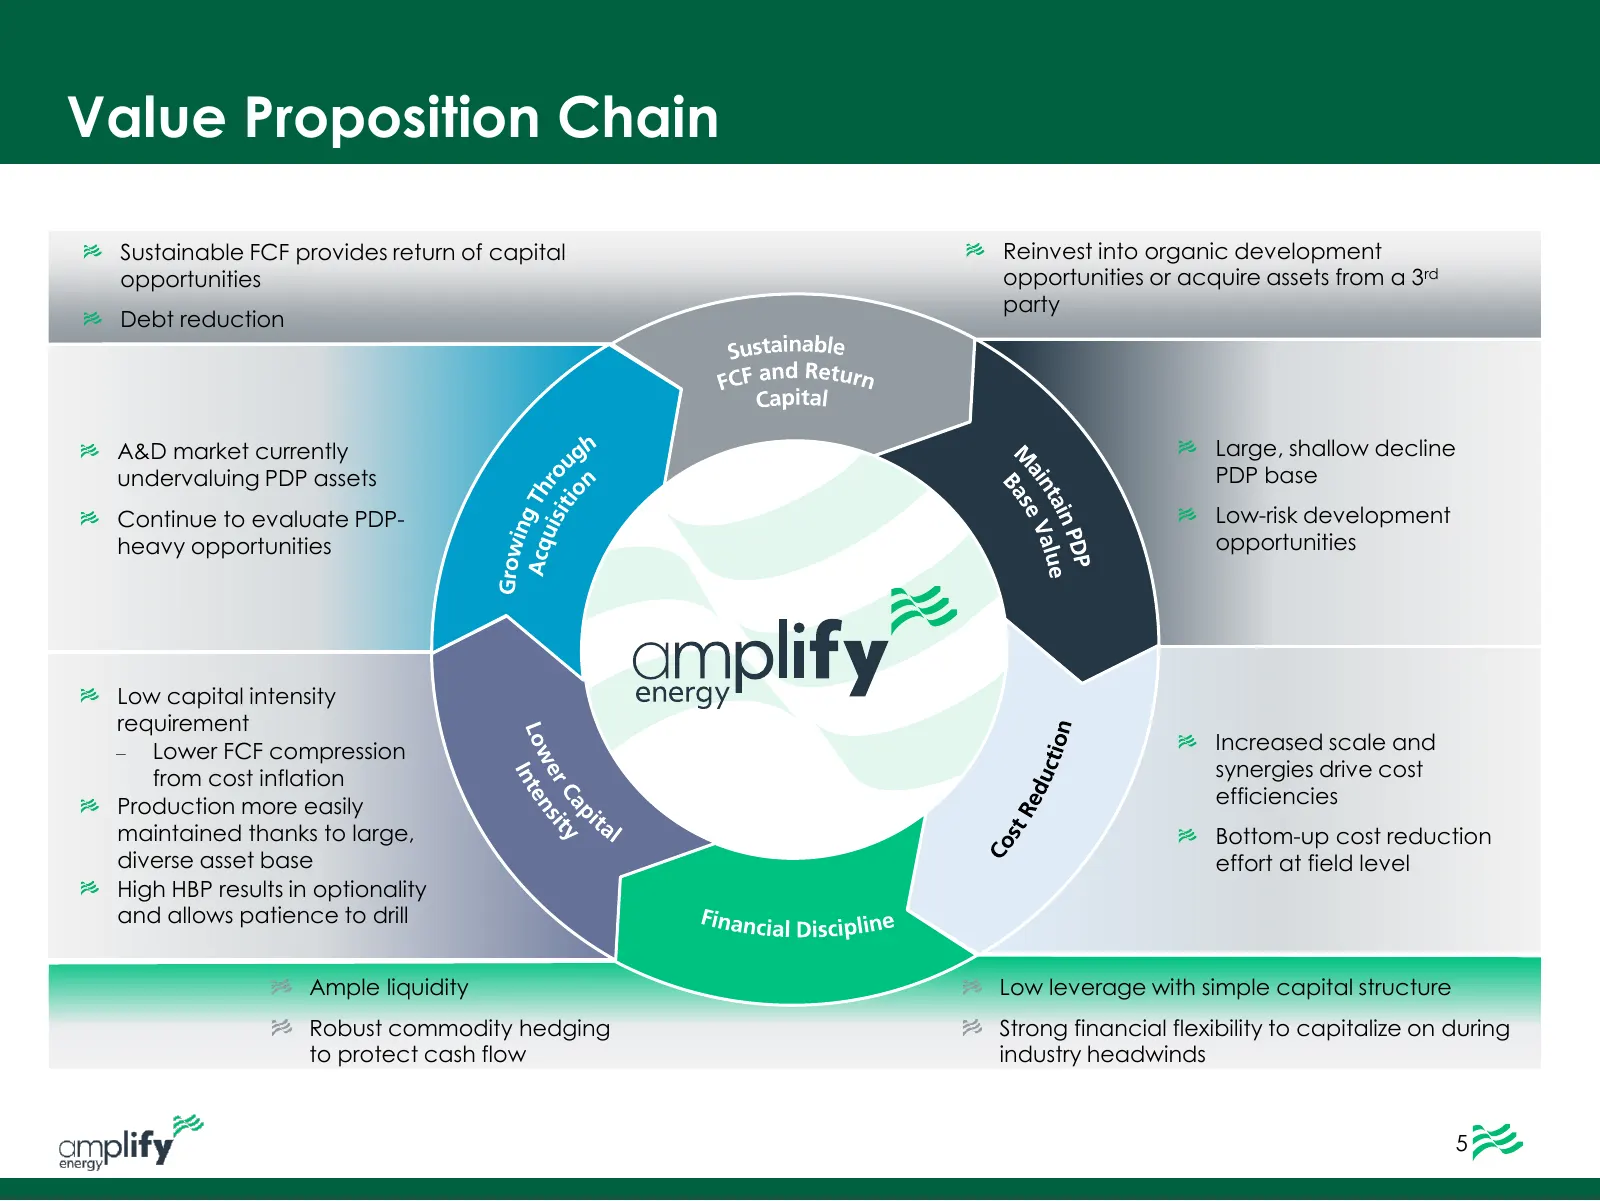
Slide 6: Value Proposition Chain
Value Proposition Chain Sustainable FCF provides return of capital Reinvest into organic development opportunities opportunities or acquire assets from a 3rd party Debt reduction A&D market currently Large, shallow decline undervaluing PDP assets PDP base Continue to evaluate PDP- Low-risk developme
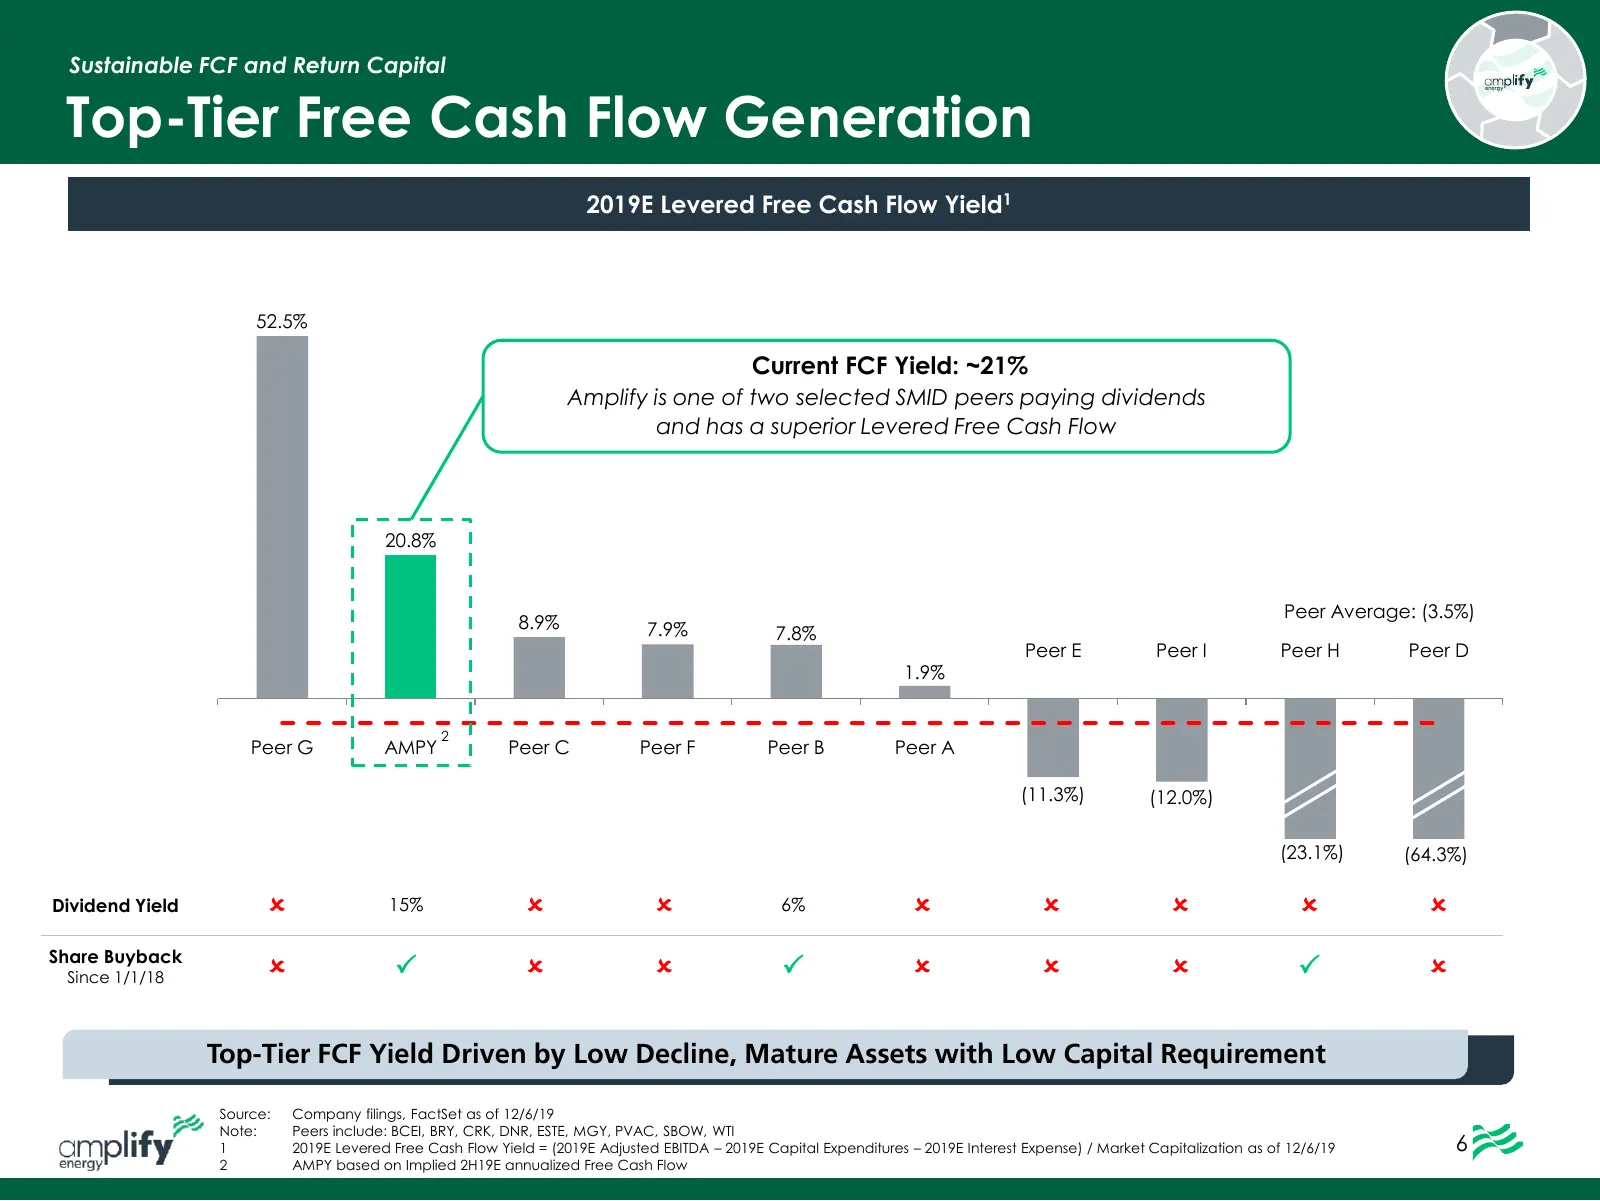
Slide 7: Top-Tier Free Cash Flow Generation
Sustainable FCF and Return Capital Top-Tier Free Cash Flow Generation 2019E Levered Free Cash Flow Yield1 52.5% Current FCF Yield: ~21% Amplify is one of two selected SMID peers paying dividends and has a superior Levered Free Cash Flow 20.8% Peer Average: (3.5%) 8.9% 7.9% 7.8% Peer E Peer I Peer H
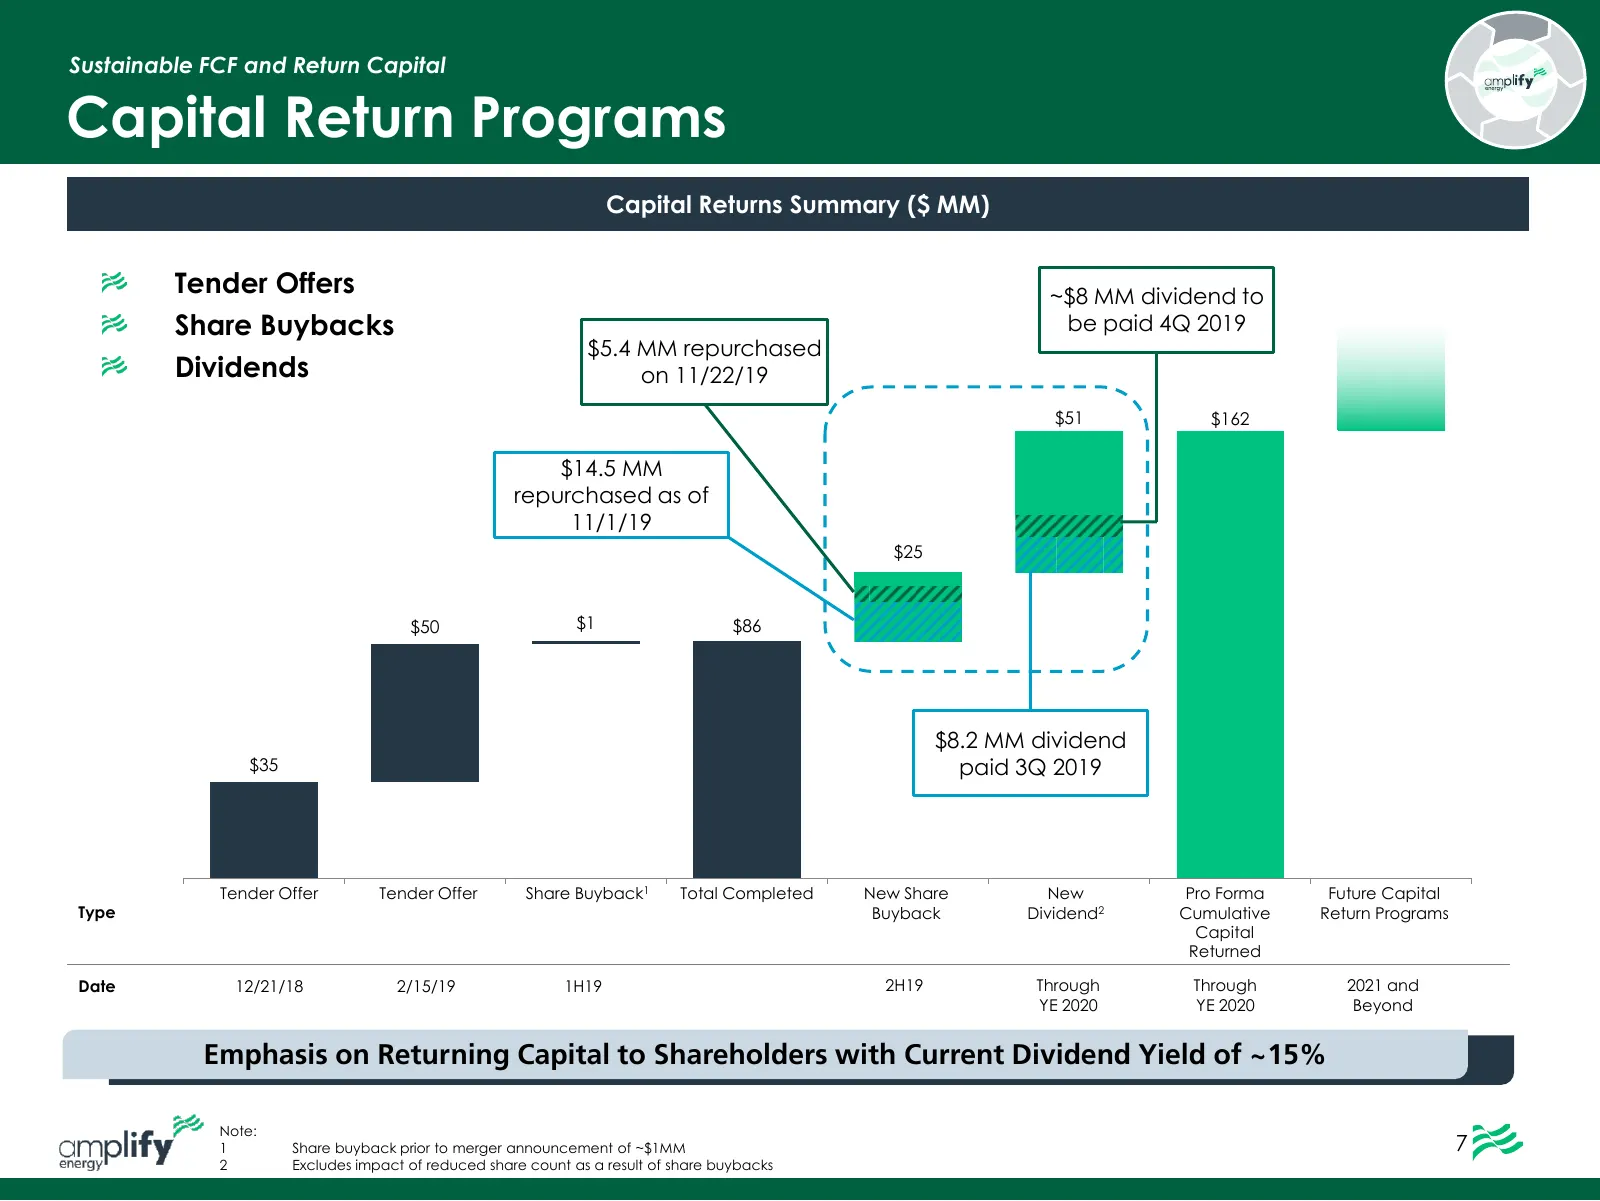
Slide 8: Capital Return Programs
Sustainable FCF and Return Capital Capital Return Programs Capital Returns Summary ($ MM) Tender Offers ~$8 MM dividend to Share Buybacks be paid 4Q 2019 $5.4 MM repurchased Dividends on 11/22/19 $51 $162 $14.5 MM repurchased as of 11/1/19 $25 $50 $1 $86 $8.2 MM dividend $35 paid 3Q 2019 Tender Offe
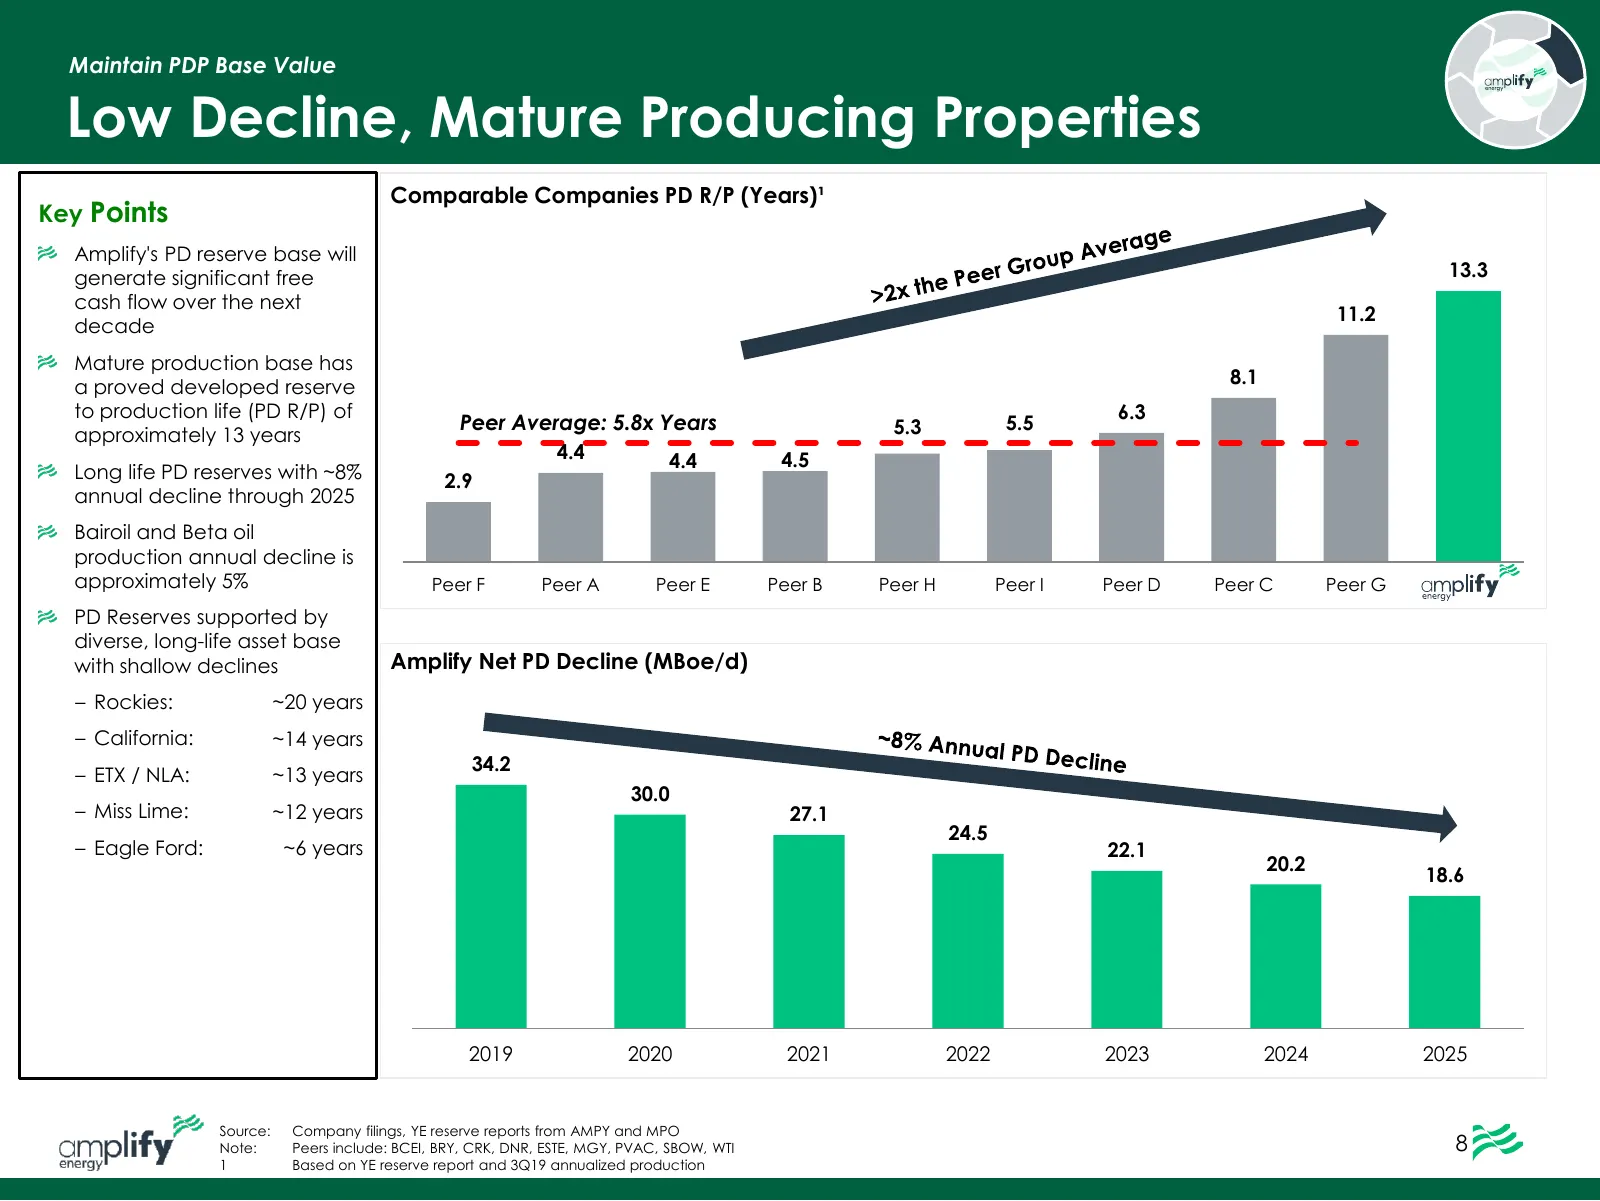
Slide 9: Low Decline, Mature Producing Properties
Maintain PDP Base Value Low Decline, Mature Producing Properties Comparable Companies PD R/P (Years)¹ Key Points Amplify's PD reserve base will generate significant free 13.3 cash flow over the next 11.2 decade Mature production base has a proved developed reserve 8.1 to production life (PD R/P) of
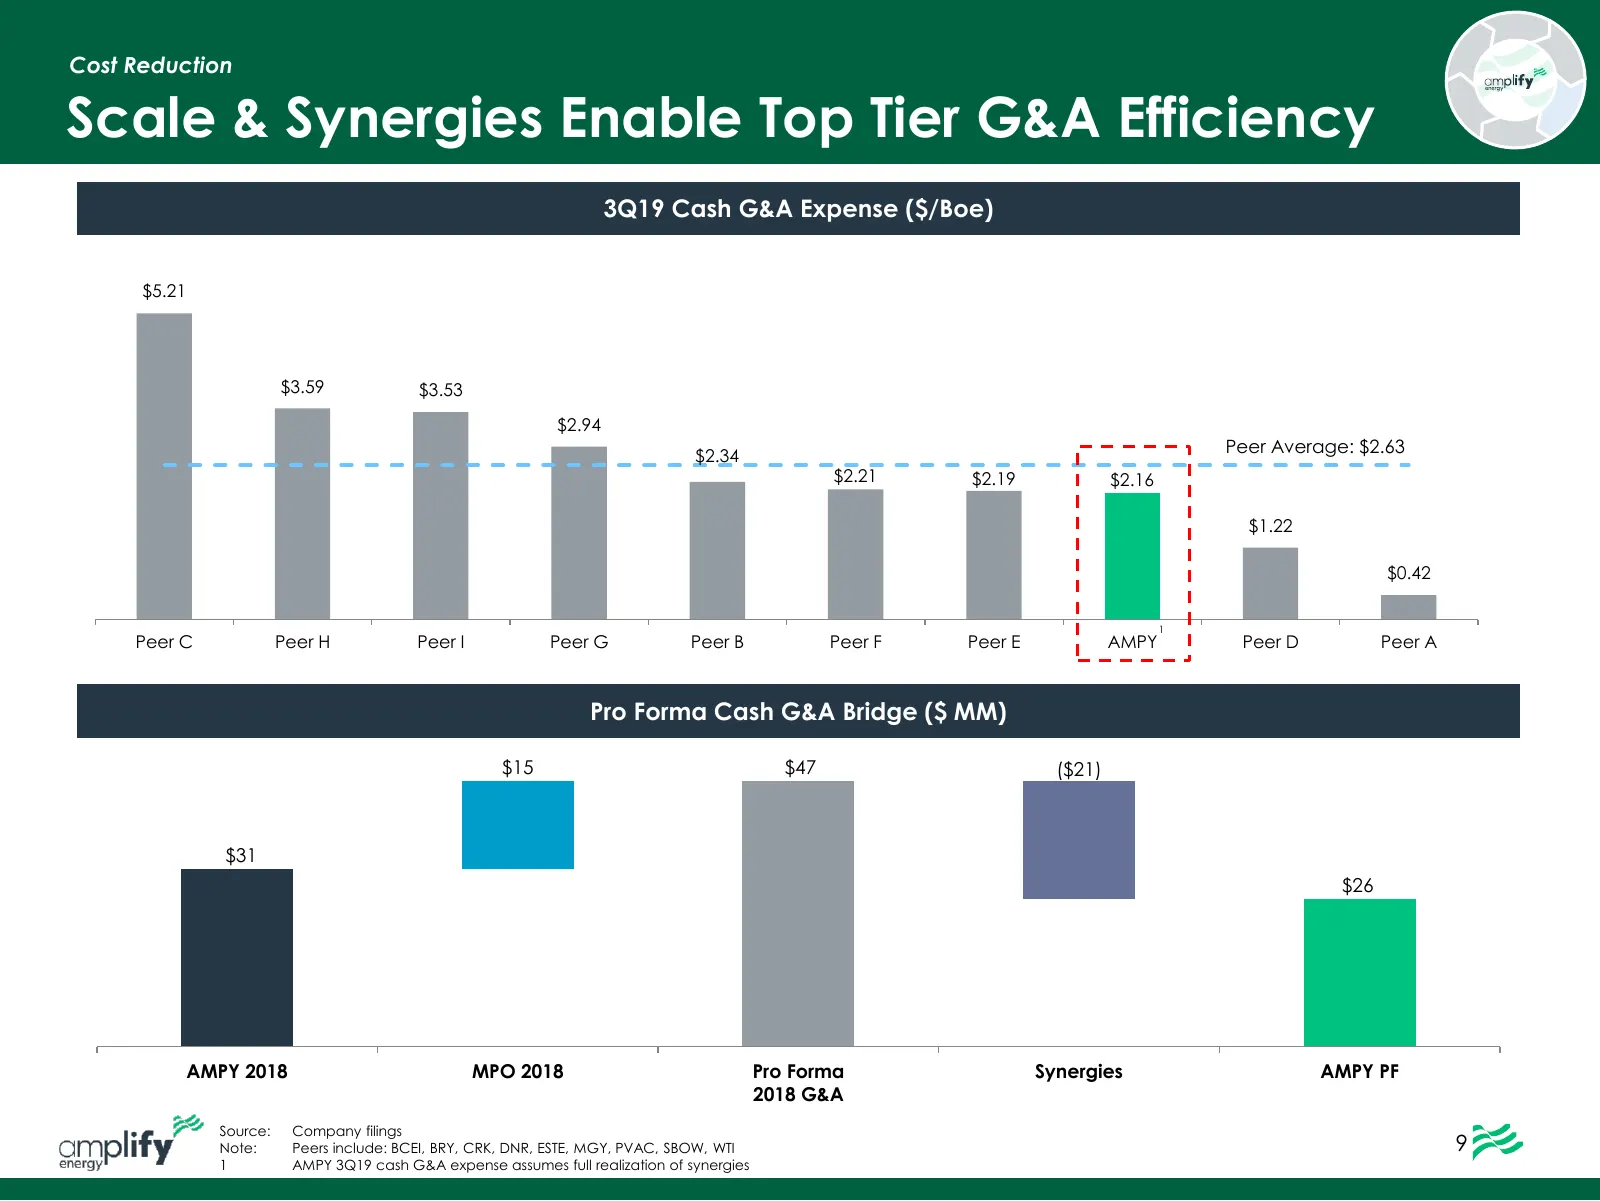
Slide 10: Scale & Synergies Enable Top Tier G&A Efficiency
Cost Reduction Scale & Synergies Enable Top Tier G&A Efficiency 3Q19 Cash G&A Expense ($/Boe) $5.21 $3.59 $3.53 $2.94 $2.34 Peer Average: $2.63 $2.21 $2.19 $2.16 $1.22 $0.42 1 Peer C Peer H Peer I Peer G Peer B Peer F Peer E AMPY Peer D Peer A Pro Forma Cash G&A Bridge ($ MM) $15 $47 ($21) $31 $26 A
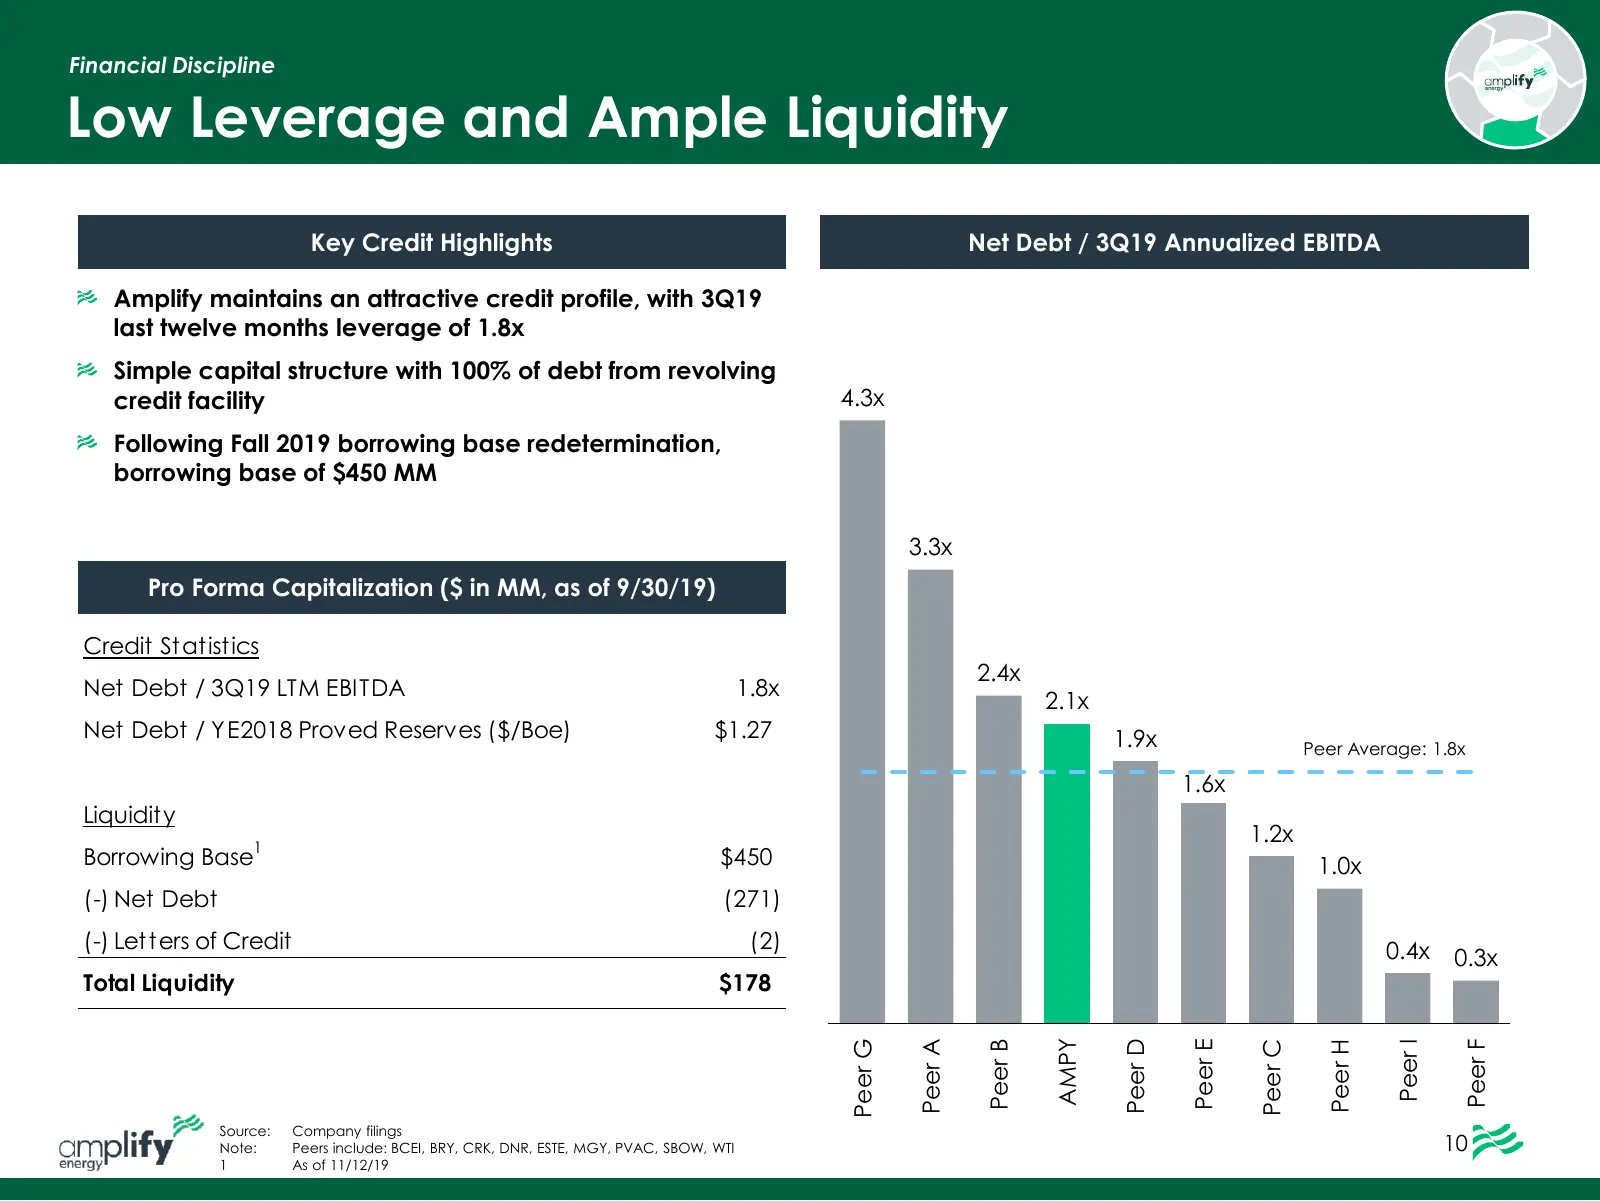
Slide 11: Low Leverage and Ample Liquidity
Financial Discipline Low Leverage and Ample Liquidity Key Credit Highlights Net Debt / 3Q19 Annualized EBITDA Amplify maintains an attractive credit profile, with 3Q19 last twelve months leverage of 1.8x Simple capital structure with 100% of debt from revolving credit facility 4.3x Following Fall 20
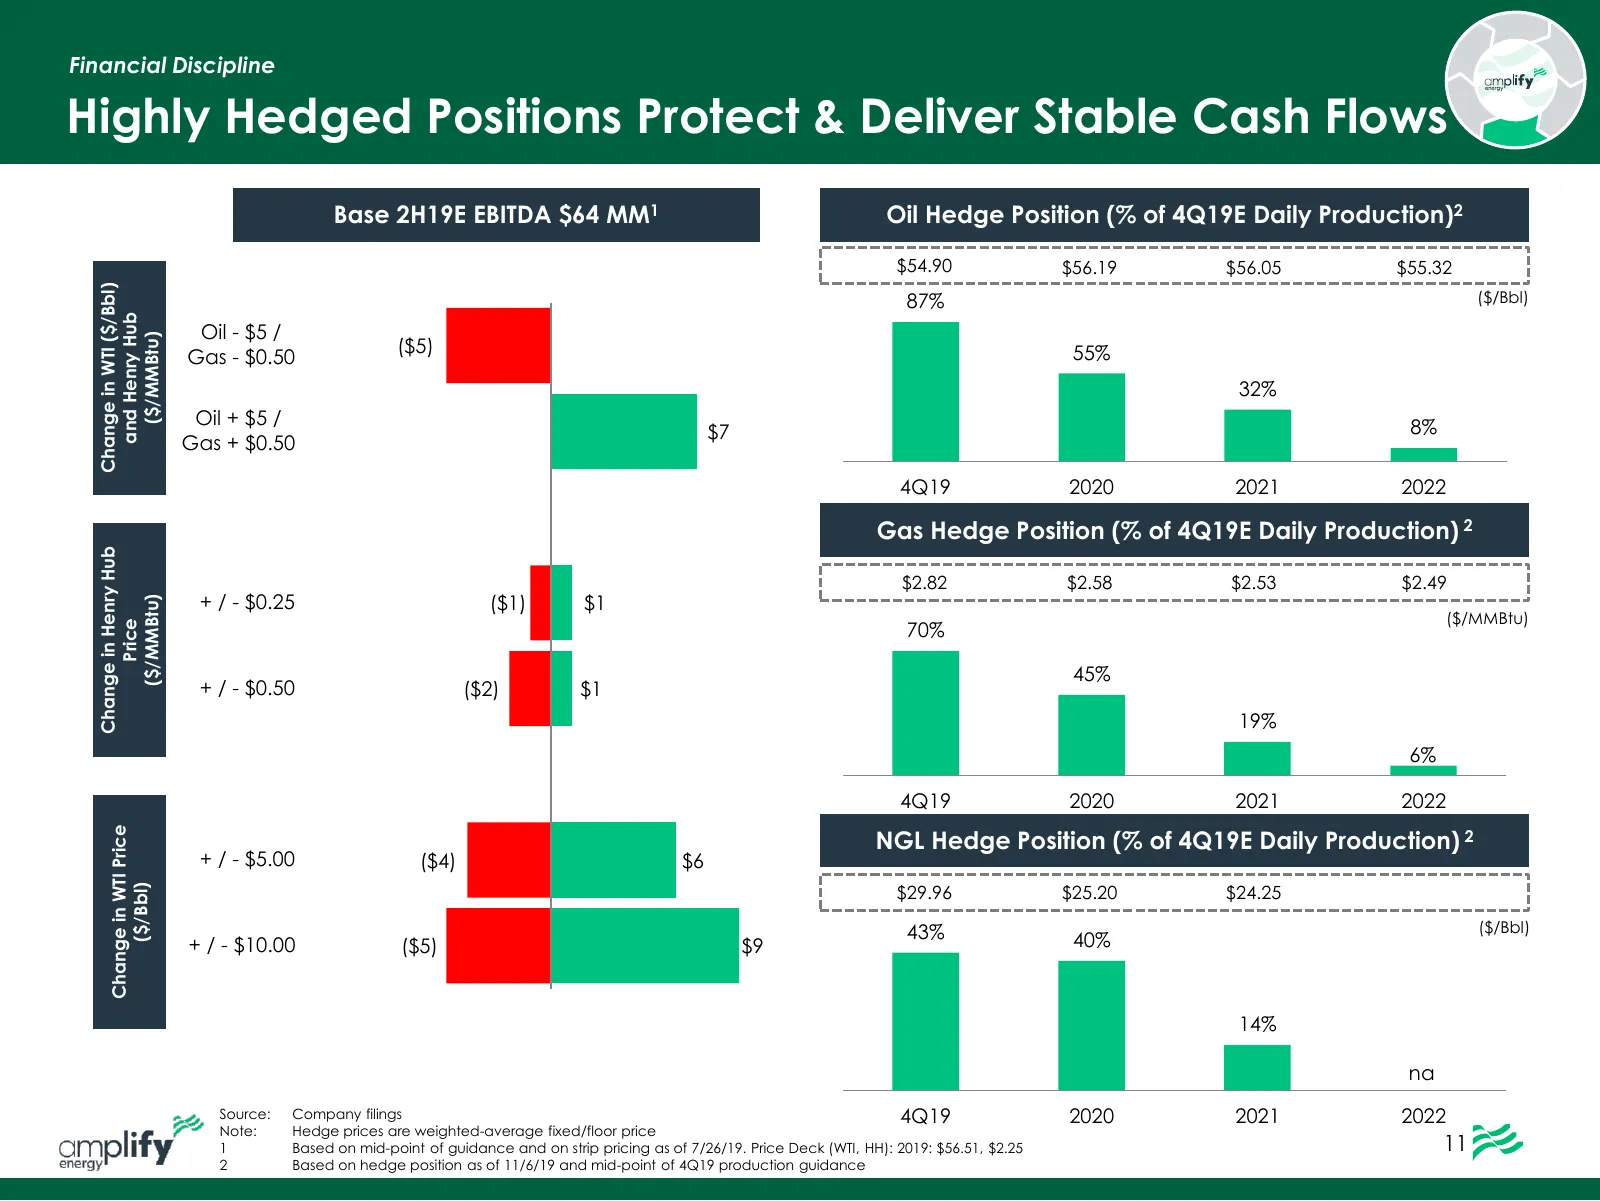
Slide 12: Highly Hedged Positions Protect & Deliver Stable Cash Flows
Financial Discipline Highly Hedged Positions Protect & Deliver Stable Cash Flows Base 2H19E EBITDA $64 MM1 Oil Hedge Position (% of 4Q19E Daily Production)2 $54.90 $56.19 $56.05 $55.32 Change in WTI ($/Bbl) 87% ($/Bbl) and Henry Hub Oil - $5 / ($/MMBtu) ($5) 55% Gas - $0.50 32% Oil + $5 / 8% $7 Gas
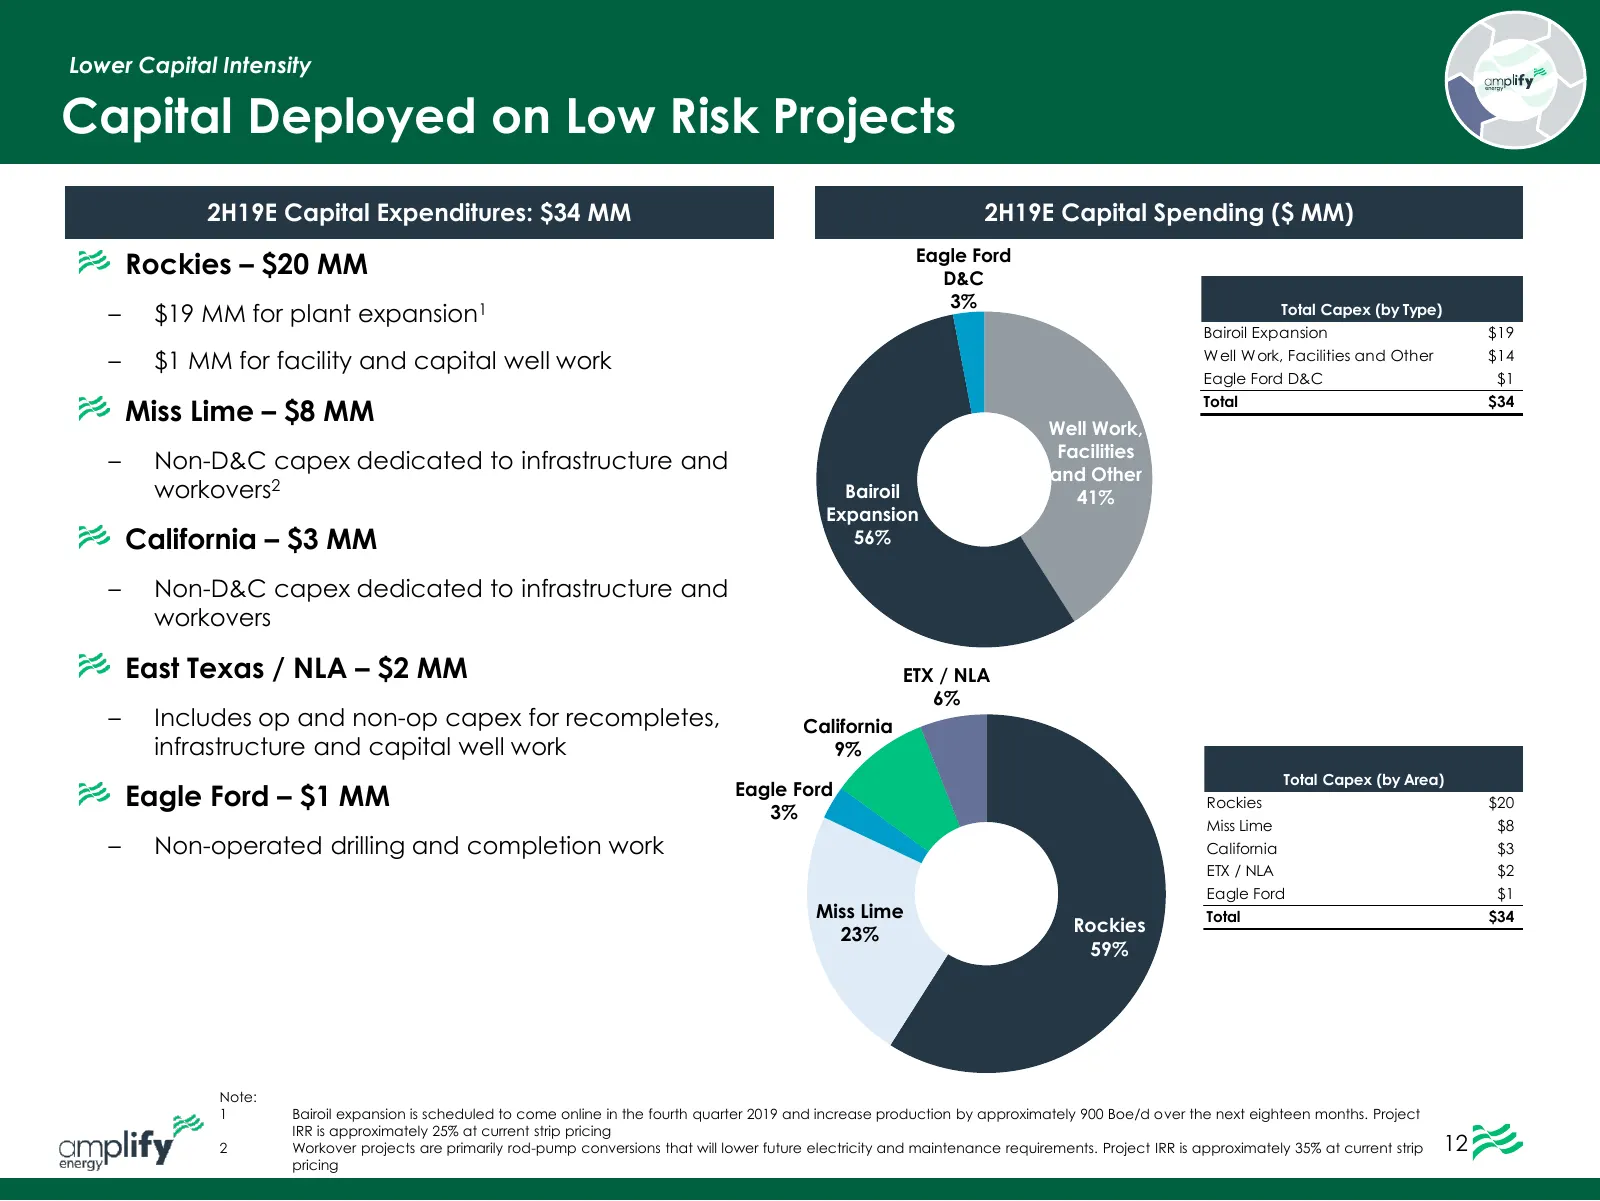
Slide 13: Capital Deployed on Low Risk Projects
Lower Capital Intensity Capital Deployed on Low Risk Projects 2H19E Capital Expenditures: $34 MM 2H19E Capital Spending ($ MM) Eagle Ford Rockies – $20 MM D&C 3% – $19 MM for plant expansion1 Total Capex (by Type) Bairoil Expansion $19 – $1 MM for facility and capital well work W ell W ork, Faciliti
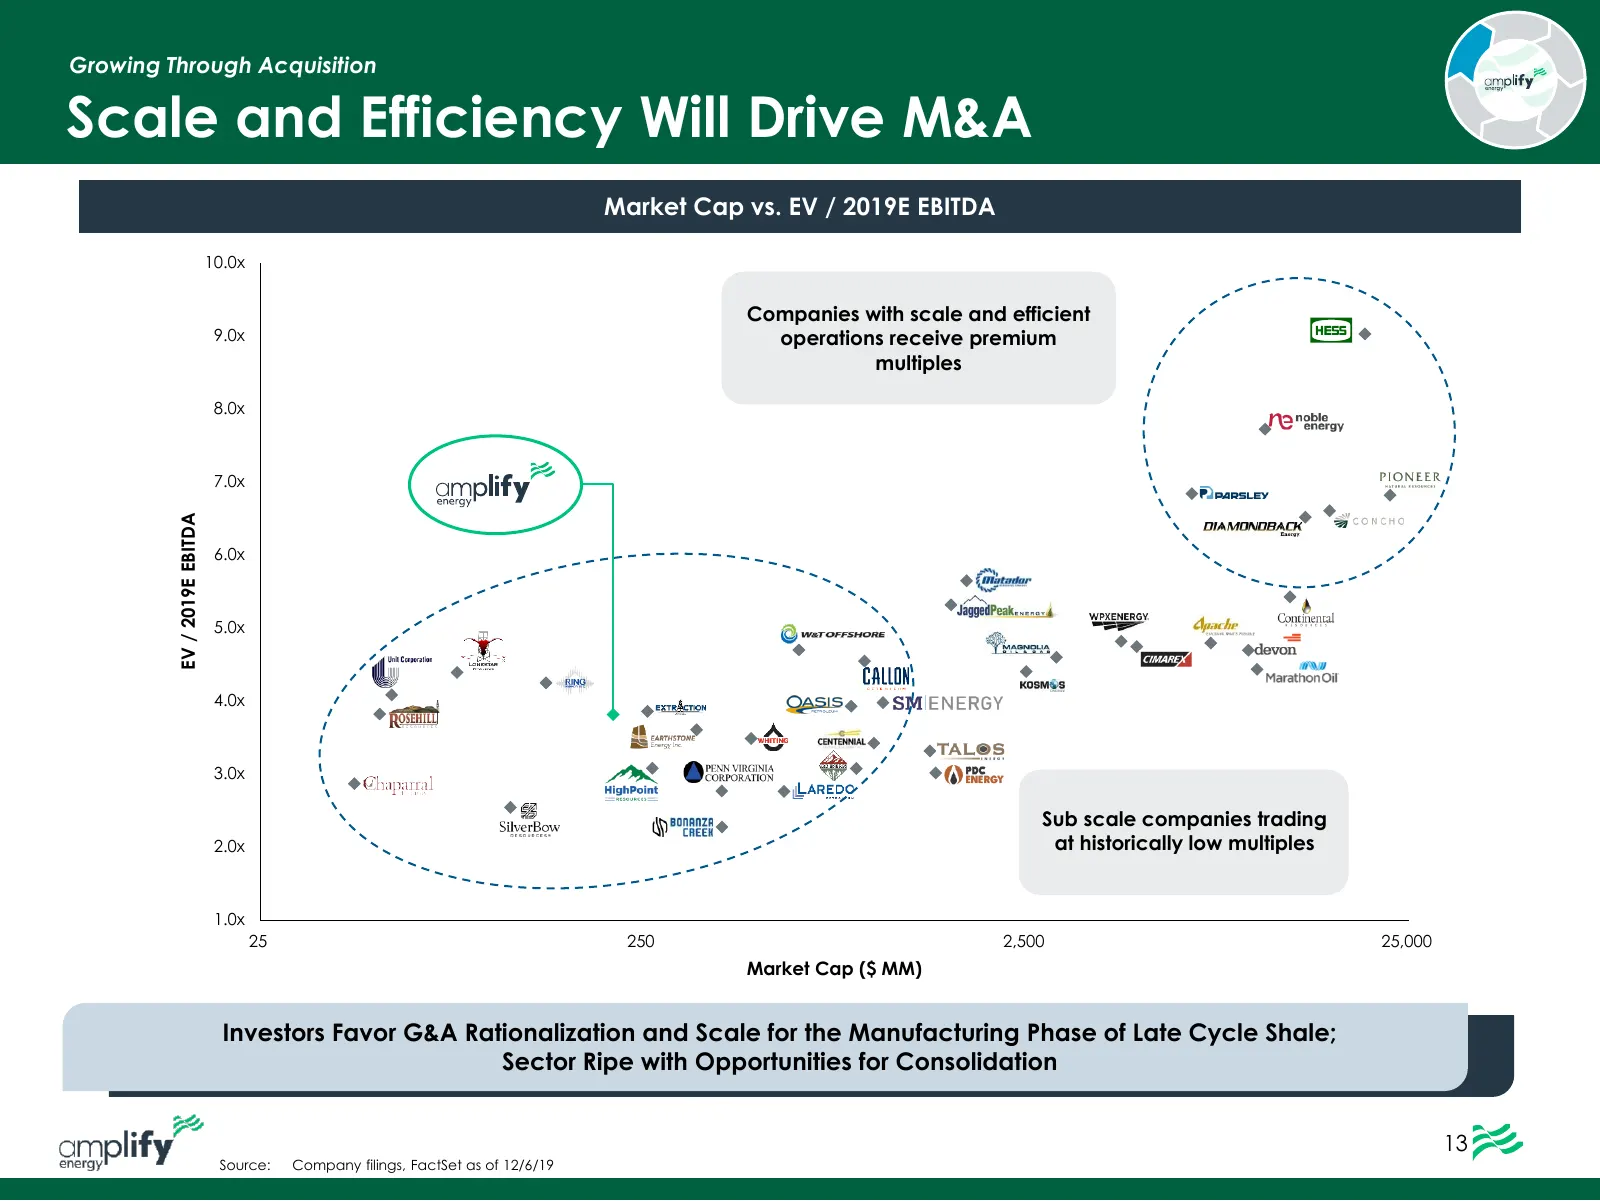
Slide 14: Scale and Efficiency Will Drive M&A
Growing Through Acquisition Scale and Efficiency Will Drive M&A Market Cap vs. EV / 2019E EBITDA 10.0x Companies with scale and efficient 9.0x operations receive premium multiples 8.0x 7.0x EV / 2019E EBITDA 6.0x 5.0x 4.0x 3.0x Sub scale companies trading 2.0x at historically low multiples 1.0x 25 2
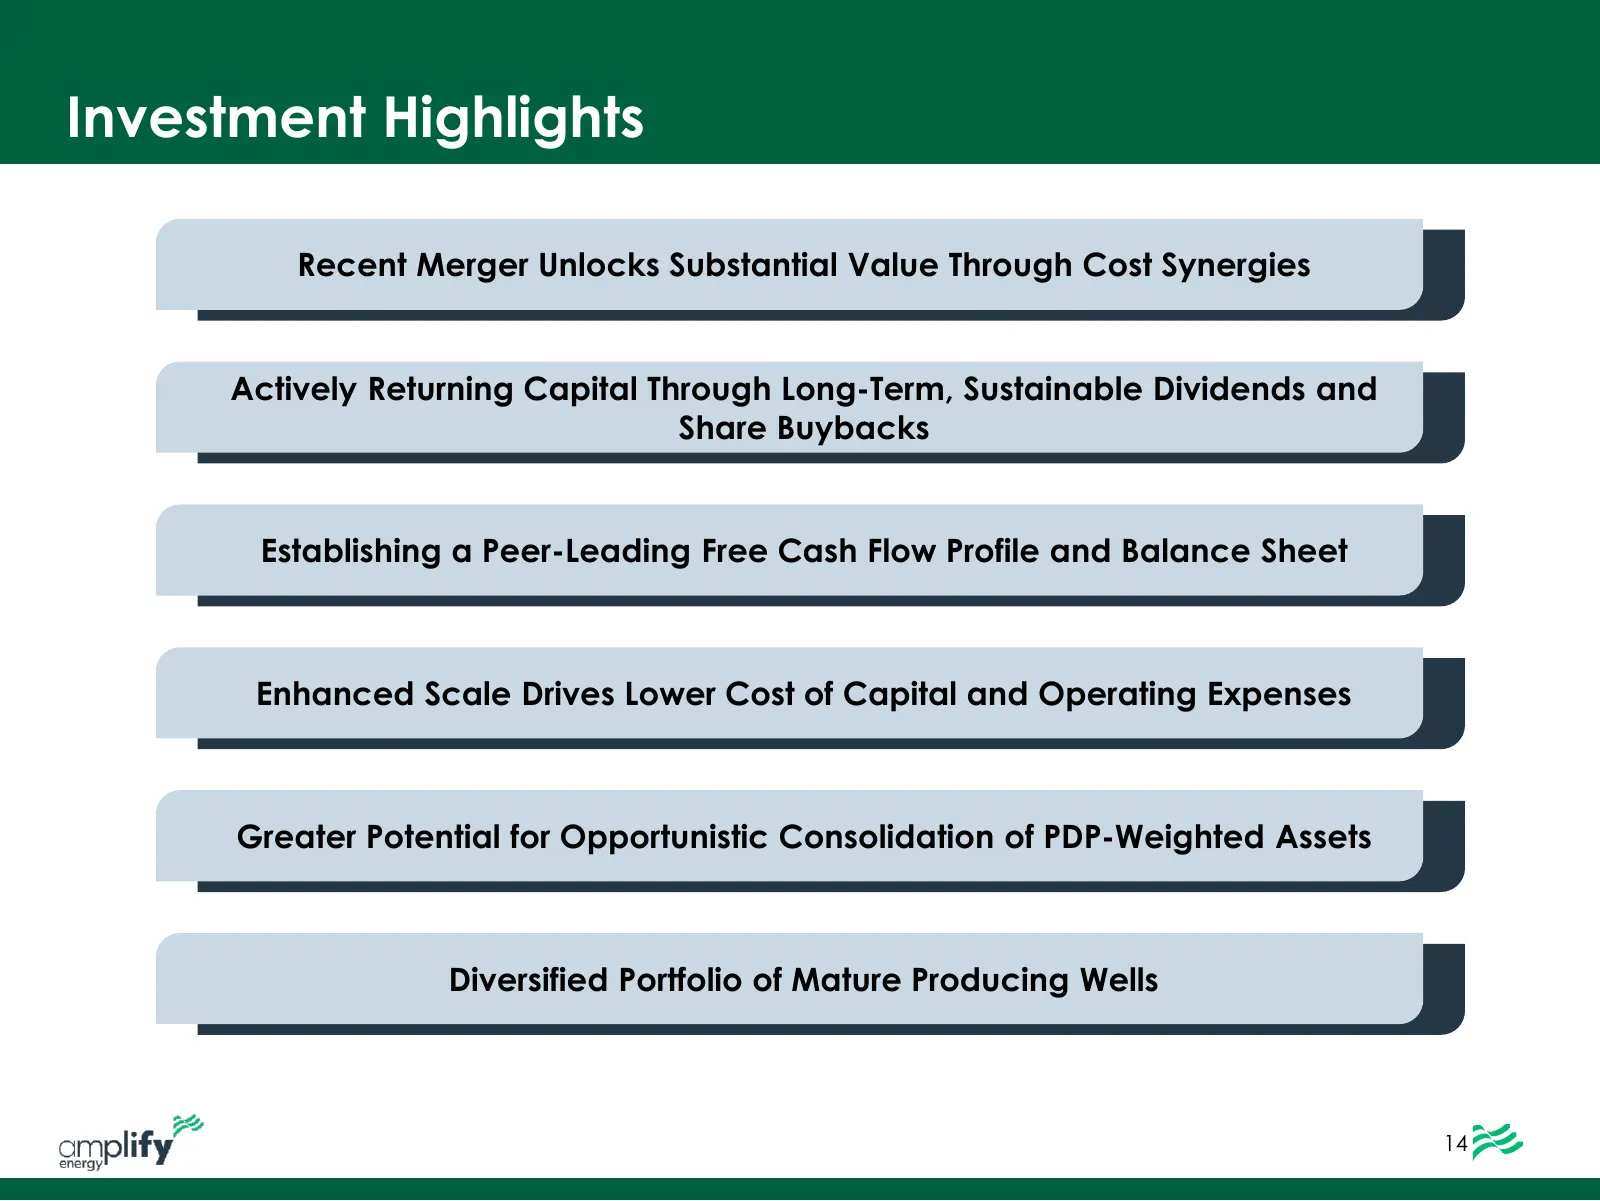
Slide 15: Investment Highlights
Investment Highlights Recent Merger Unlocks Substantial Value Through Cost Synergies Actively Returning Capital Through Long-Term, Sustainable Dividends and Share Buybacks Establishing a Peer-Leading Free Cash Flow Profile and Balance Sheet Enhanced Scale Drives Lower Cost of Capital and Operating E
Slide 16: Appendix
amplify” energy Appendix
Slide 17: Experienced Management Team
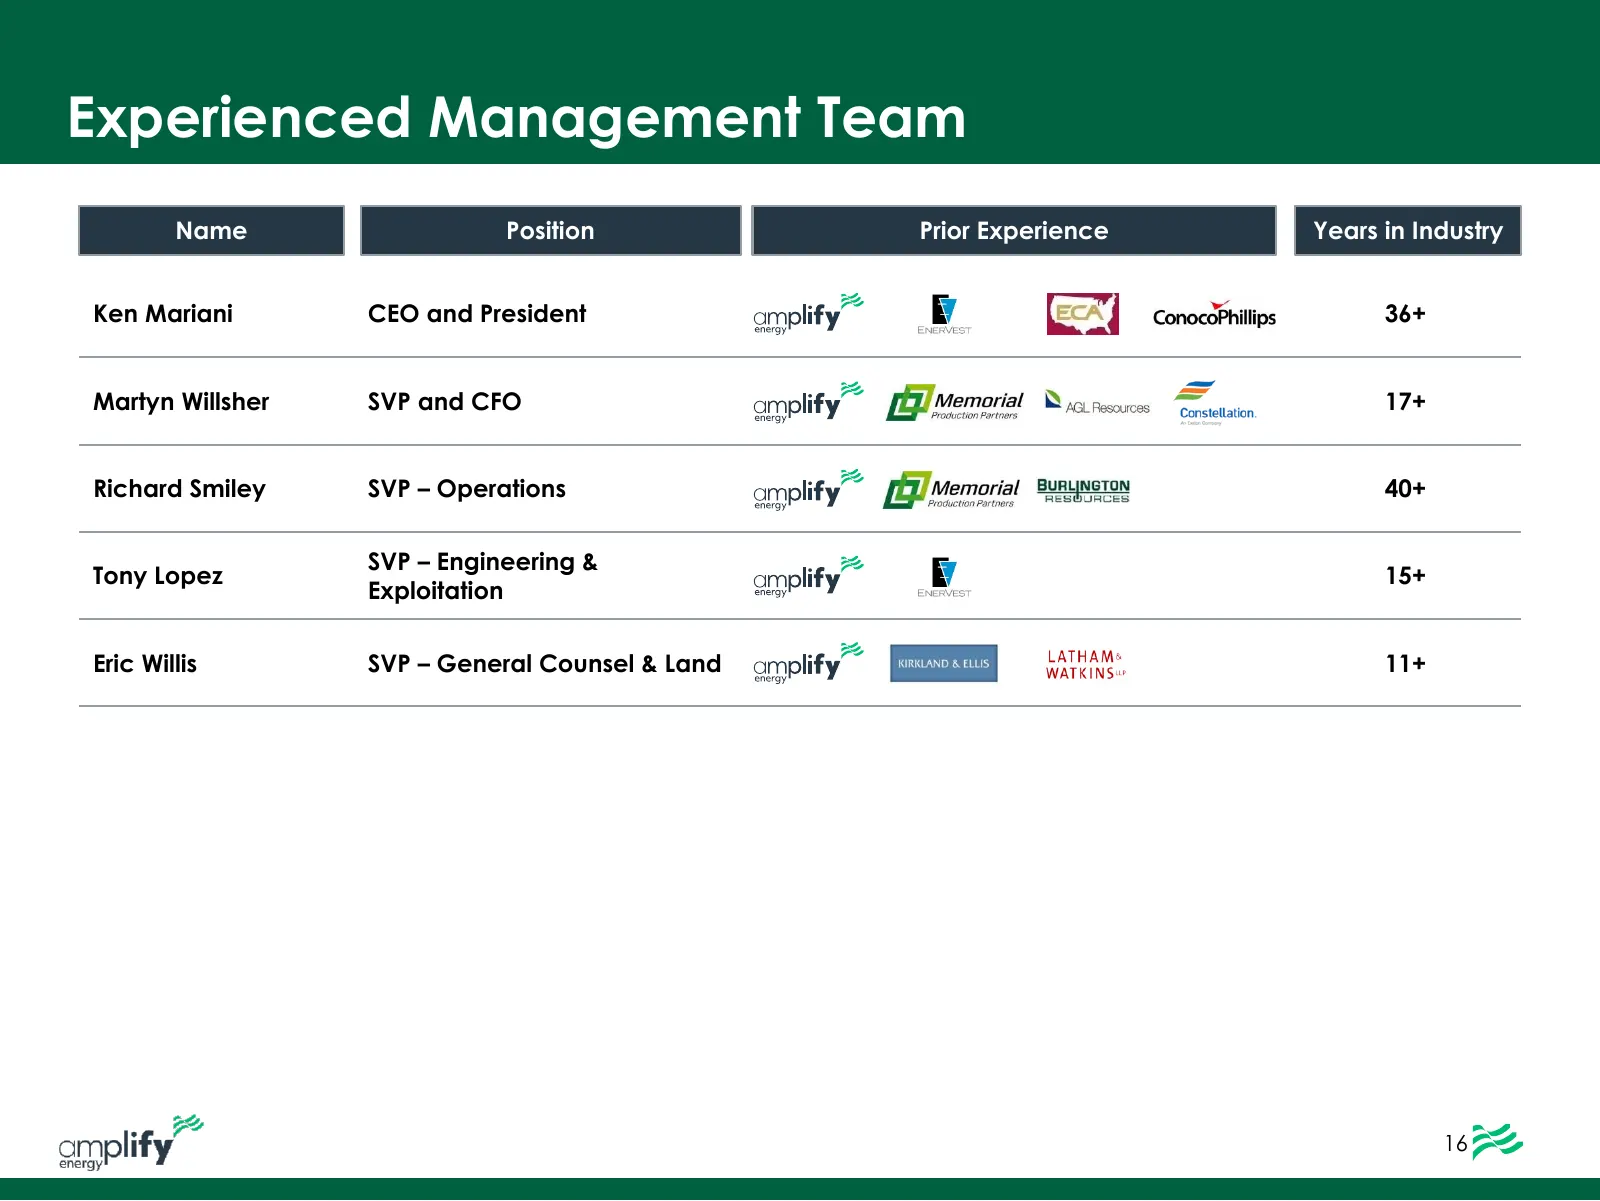
Experienced Management Team Name Position Prior Experience Years in Industry Ken Mariani CEO and President 36+ Martyn Willsher SVP and CFO 17+ Richard Smiley SVP – Operations 40+ SVP – Engineering & Tony Lopez 15+ Exploitation Eric Willis SVP – General Counsel & Land 11+ 16
Slide 18: Recent Milestones
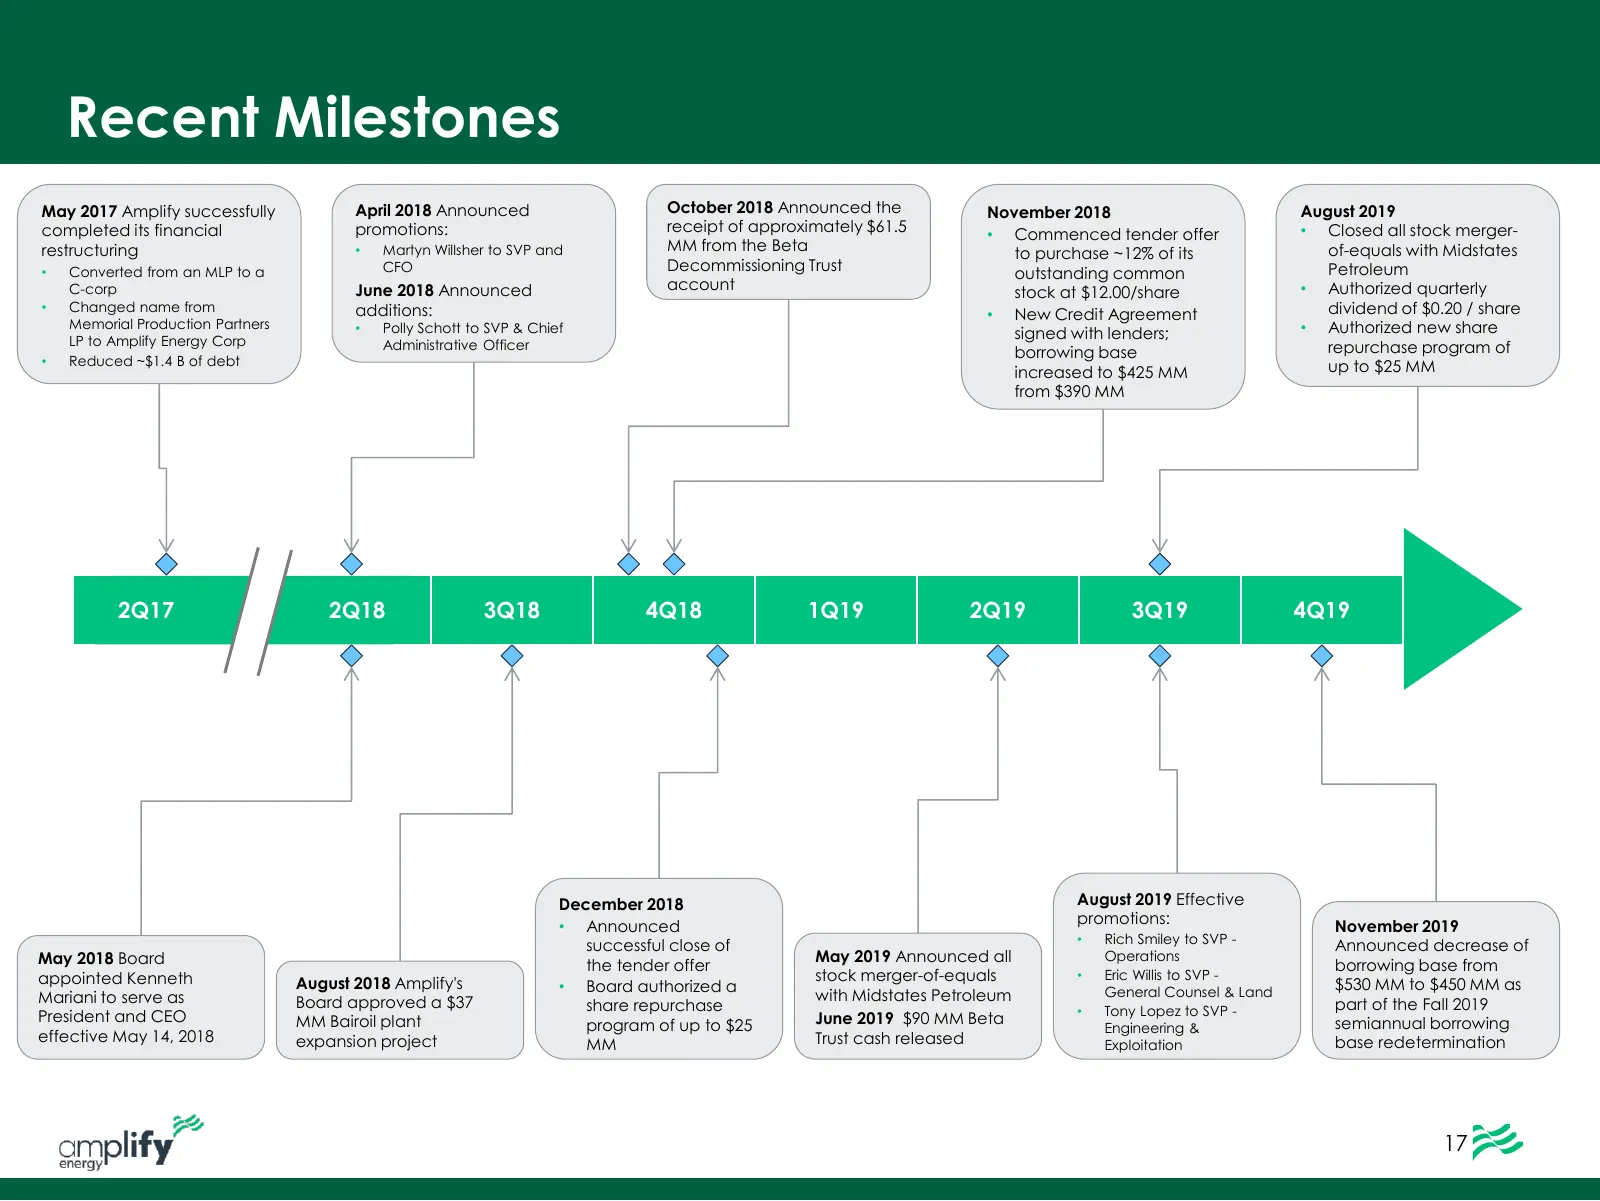
Recent Milestones May 2017 Amplify successfully April 2018 Announced October 2018 Announced the November 2018 August 2019 completed its financial promotions: receipt of approximately $61.5 • Commenced tender offer • Closed all stock merger- restructuring • Martyn Willsher to SVP and MM from the Beta
Slide 19: 4Q19 Guidance Details
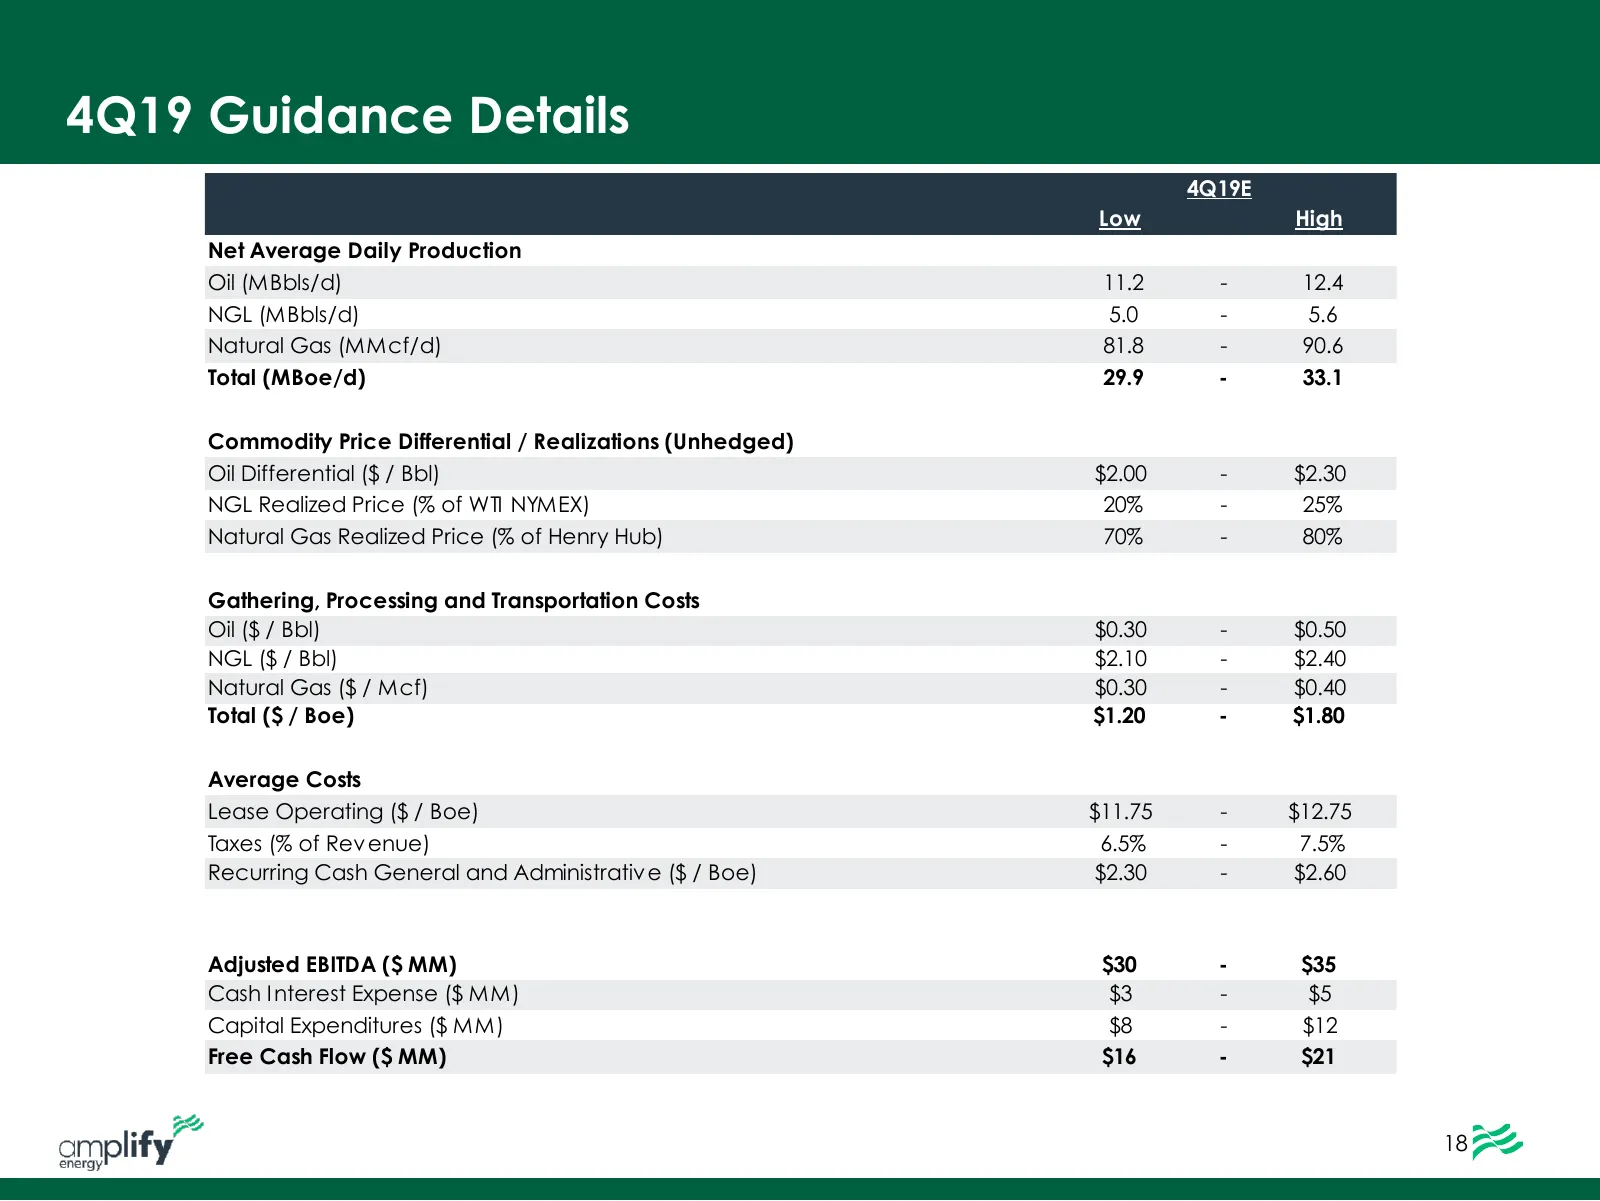
4Q19 Guidance Details 4Q19E 2H19E Low High Net Average Daily Production Oil (MBbls/d) 11.2 - 12.4 NGL (MBbls/d) 5.0 - 5.6 Natural Gas (MMcf/d) 81.8 - 90.6 Total (MBoe/d) 29.9 - 33.1 Commodity Price Differential / Realizations (Unhedged) Oil Differential ($ / Bbl) $2.00 - $2.30 NGL Realized Price (%
Slide 20: Miss Lime Asset Overview
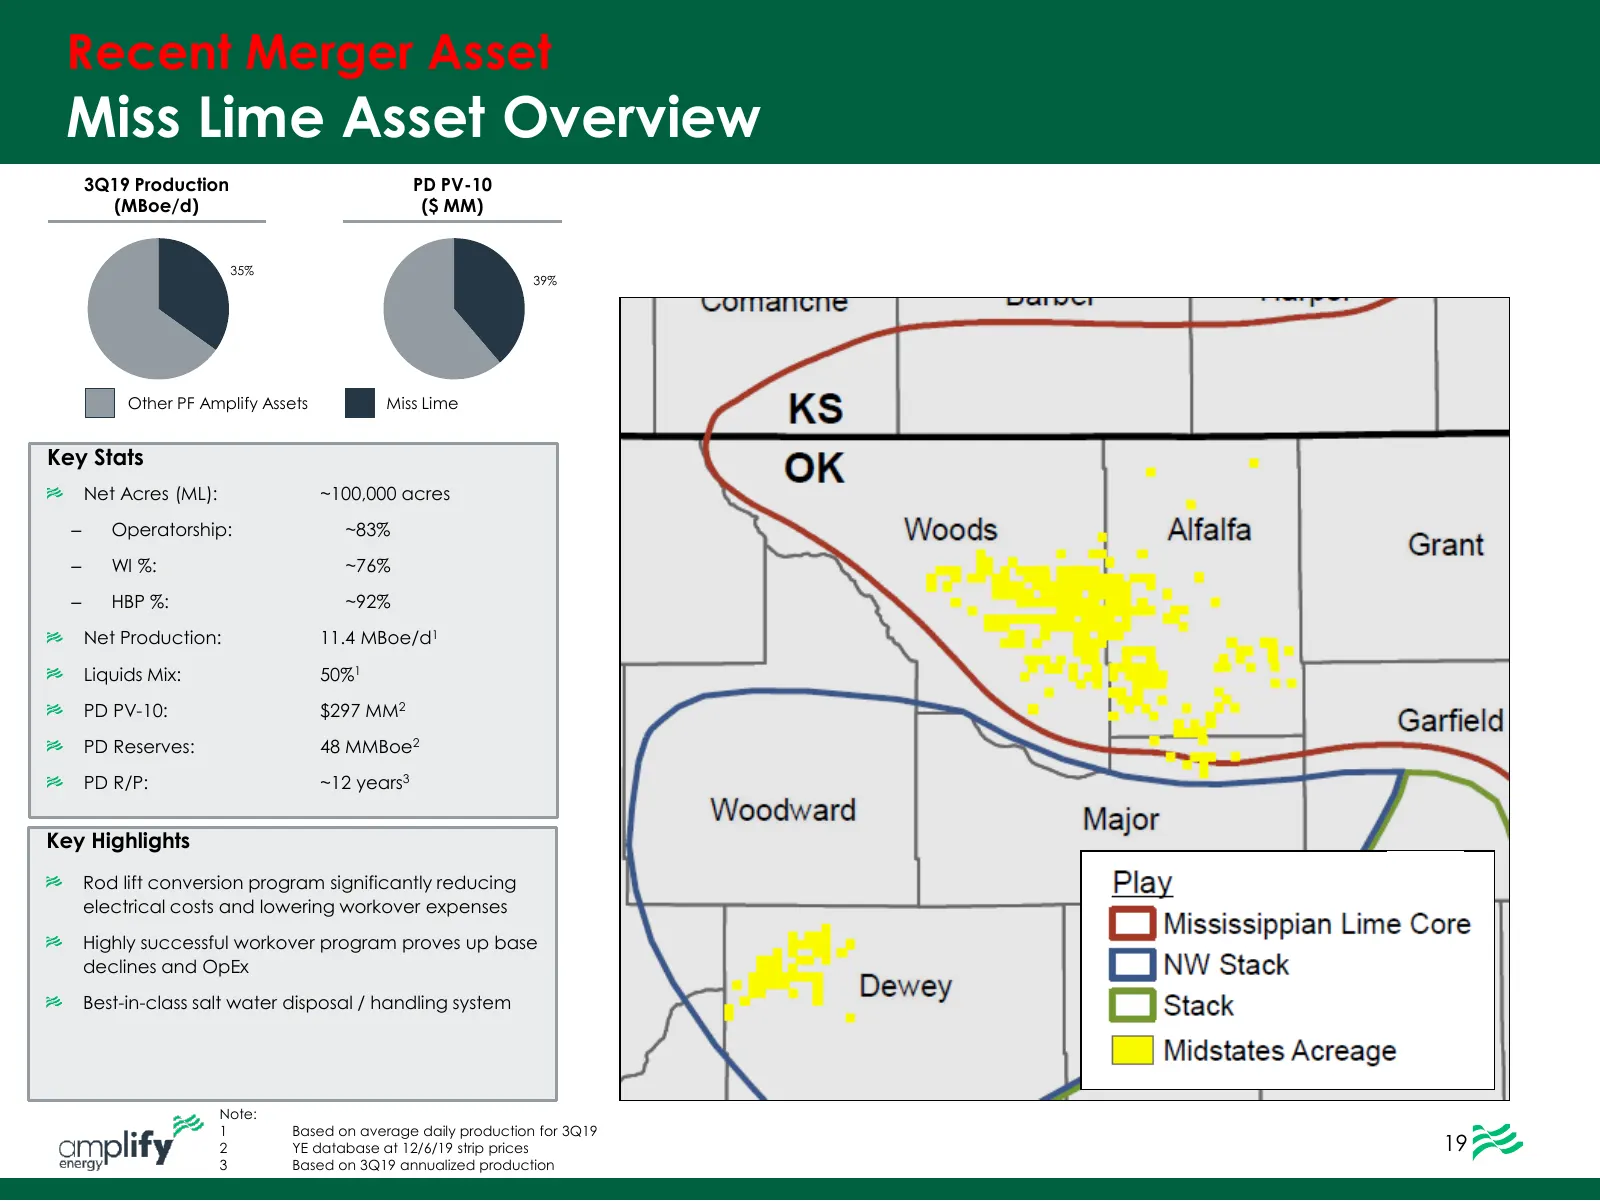
Recent Merger Asset Miss Lime Asset Overview 3Q19 Production PD PV-10 (MBoe/d) ($ MM) 35% 39% Other PF Amplify Assets Miss Lime Key Stats Net Acres (ML): ~100,000 acres ‒ Operatorship: ~83% ‒ WI %: ~76% ‒ HBP %: ~92% Net Production: 11.4 MBoe/d1 Liquids Mix: 50%1 PD PV-10: $297 MM2 PD Reserves: 48 M
Slide 21: East Texas / North Louisiana Asset Overview
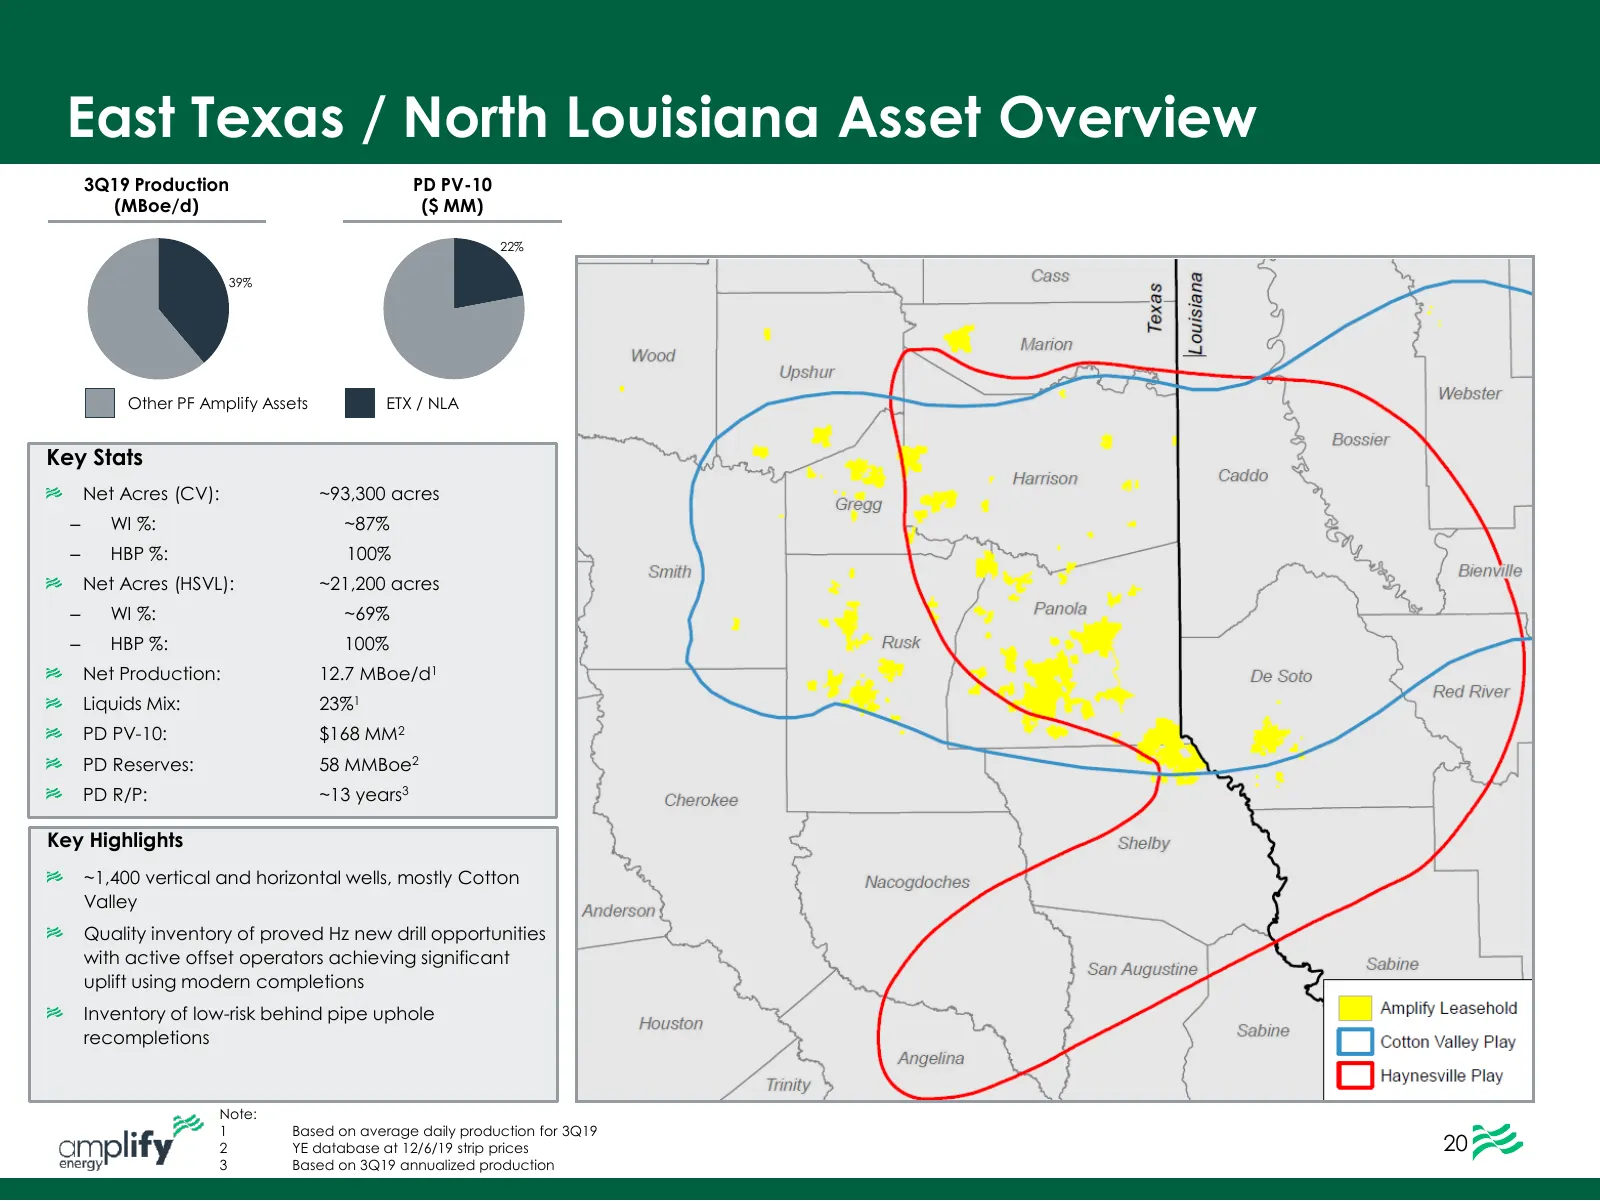
East Texas / North Louisiana Asset Overview 3Q19 Production PD PV-10 (MBoe/d) ($ MM) 22% 39% Other PF Amplify Assets ETX / NLA Key Stats Net Acres (CV): ~93,300 acres ‒ WI %: ~87% ‒ HBP %: 100% Net Acres (HSVL): ~21,200 acres ‒ WI %: ~69% ‒ HBP %: 100% Net Production: 12.7 MBoe/d1 Liquids Mix: 23%1
Slide 22: Beta Field Asset Overview (Federal Waters)
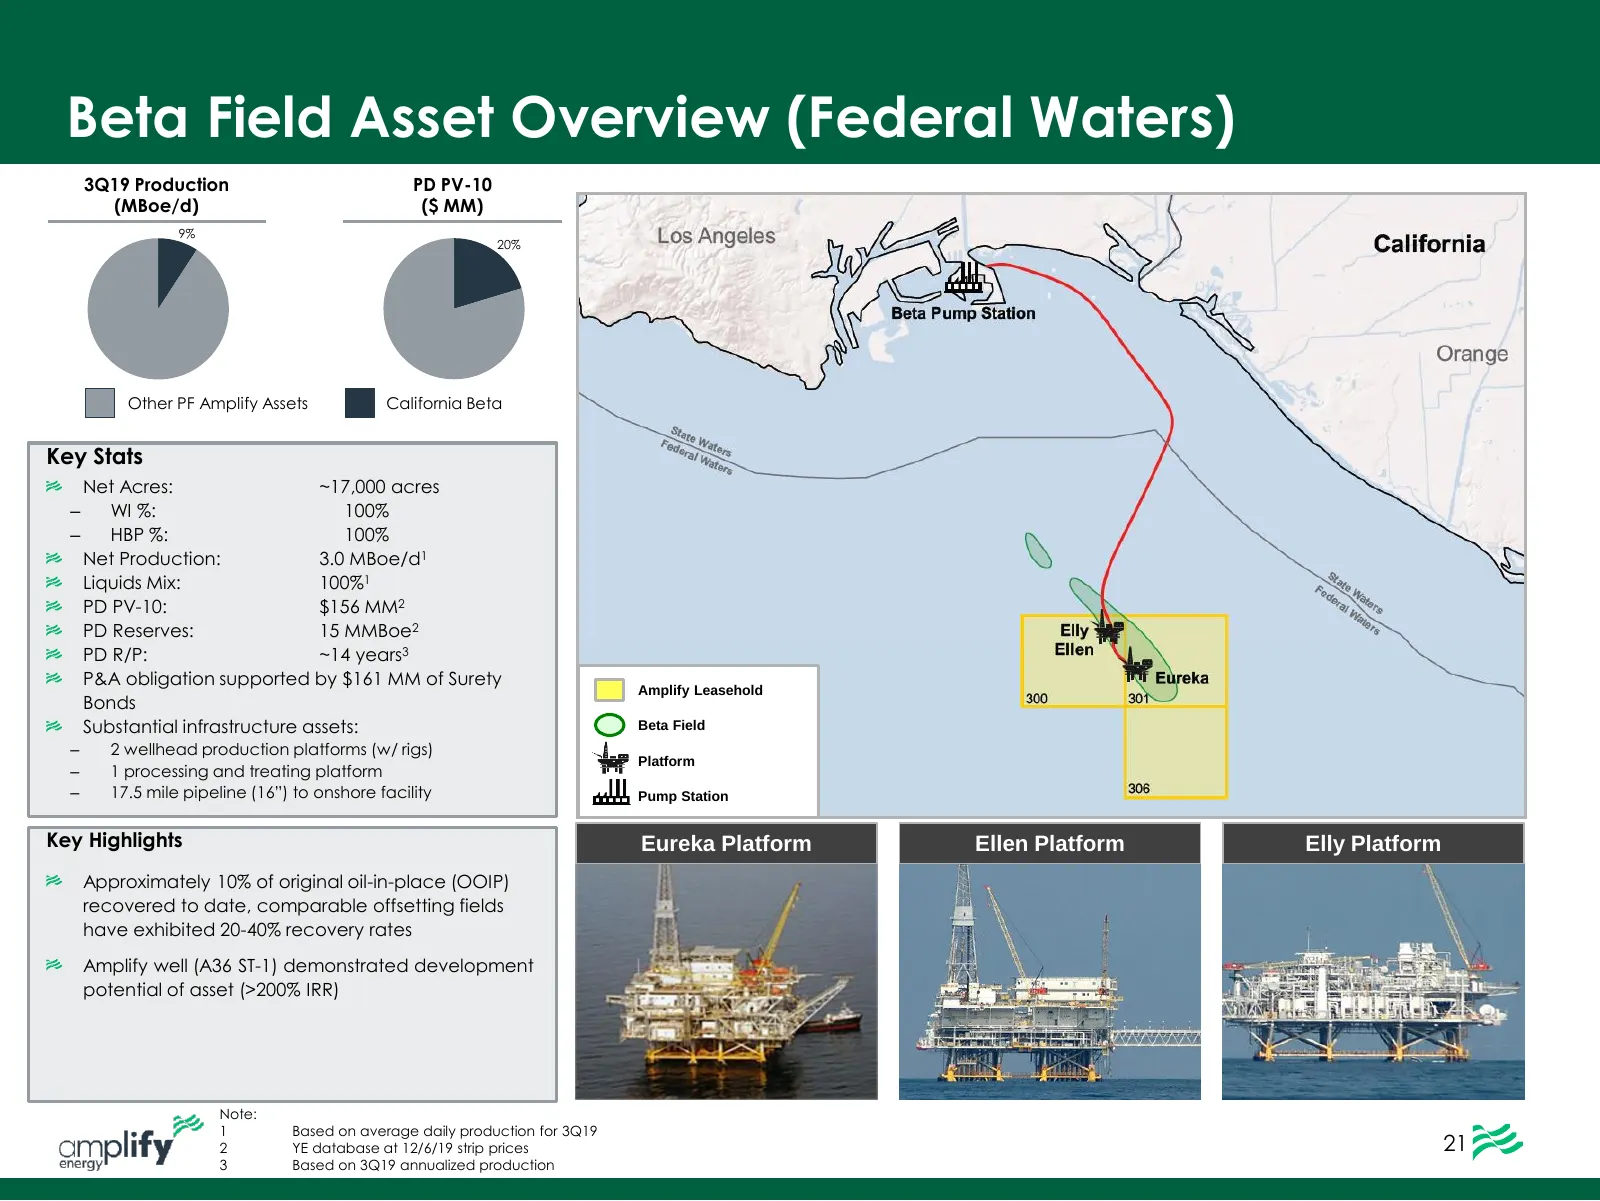
Beta Field Asset Overview (Federal Waters) 3Q19 Production PD PV-10 (MBoe/d) ($ MM) 9% 20% Other PF Amplify Assets California Beta Key Stats Net Acres: ~17,000 acres ‒ WI %: 100% ‒ HBP %: 100% Net Production: 3.0 MBoe/d1 Liquids Mix: 100%1 PD PV-10: $156 MM2 PD Reserves: 15 MMBoe2 PD R/P: ~14 years3
Slide 23: Rockies Asset Overview
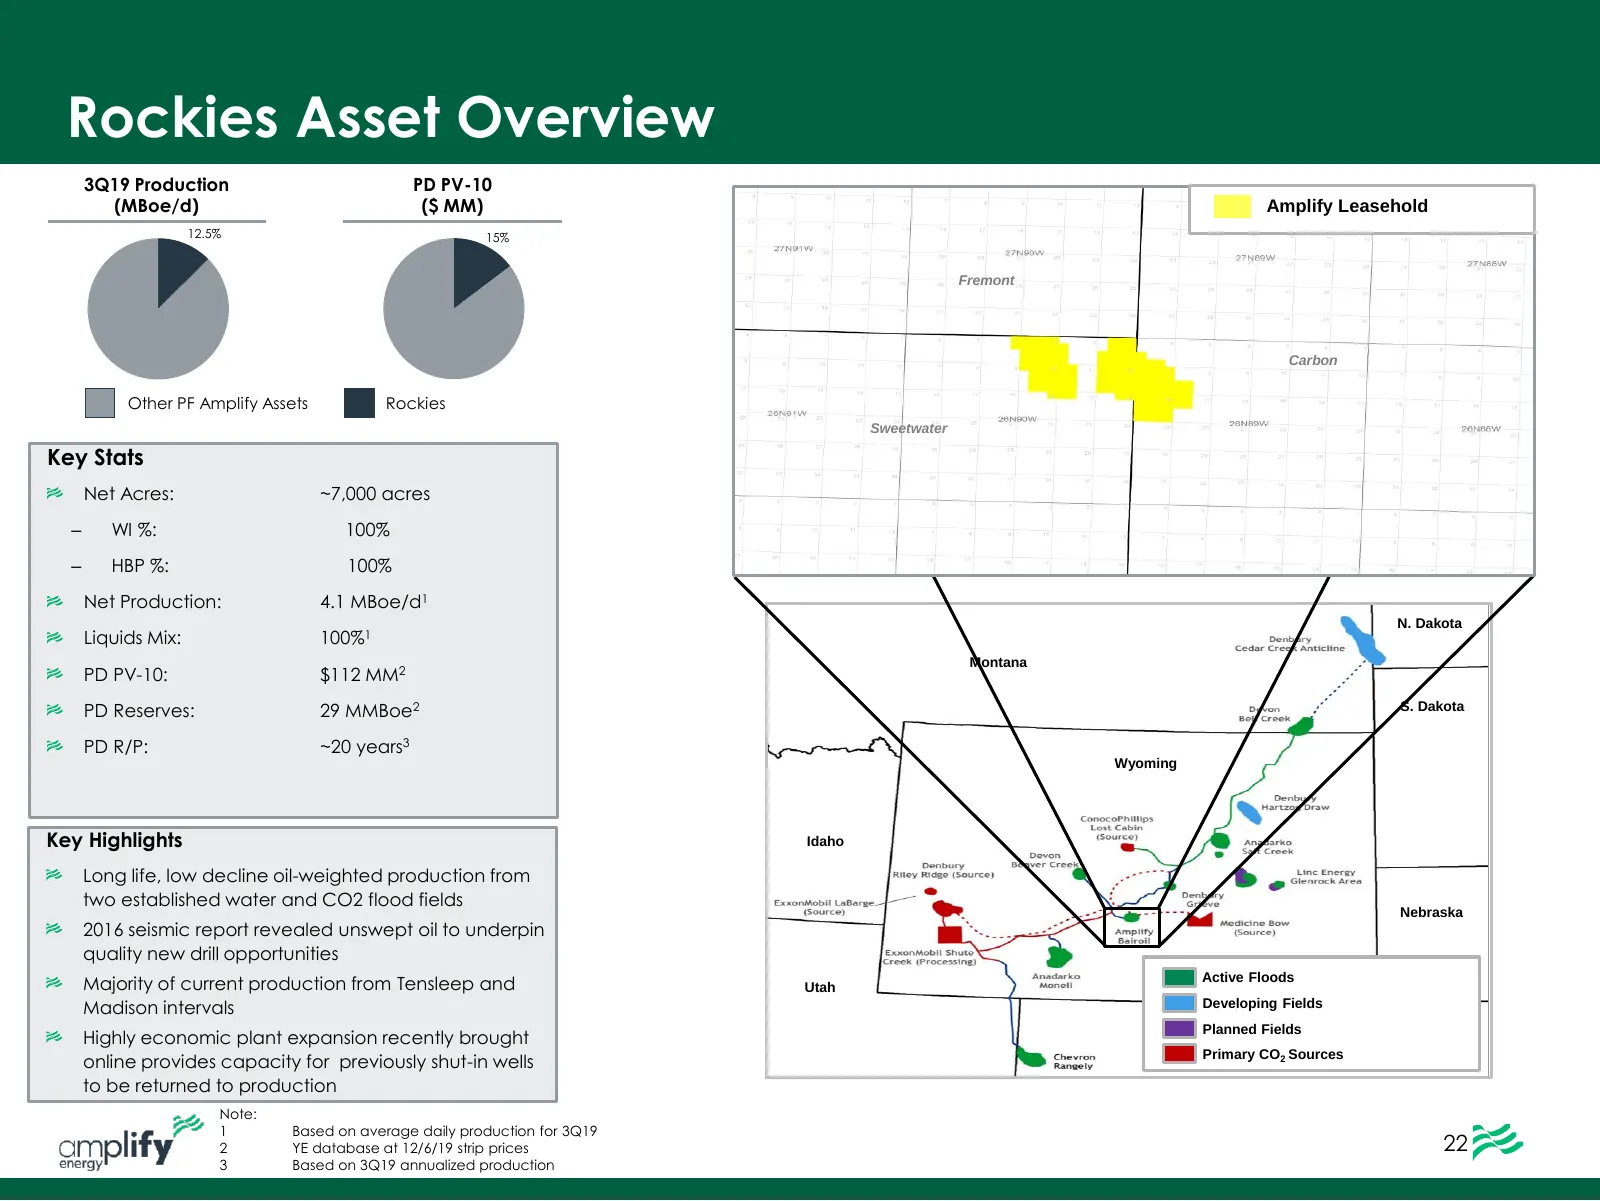
Rockies Asset Overview 3Q19 Production PD PV-10 (MBoe/d) ($ MM) Amplify Leasehold 12.5% 15% Fremont Carbon Other PF Amplify Assets Rockies Sweetwater Key Stats Net Acres: ~7,000 acres ‒ WI %: 100% ‒ HBP %: 100% Net Production: 4.1 MBoe/d1 N. Dakota Liquids Mix: 100%1 Montana PD PV-10: $112 MM2 PD Re
Slide 24: Eagle Ford Asset Overview
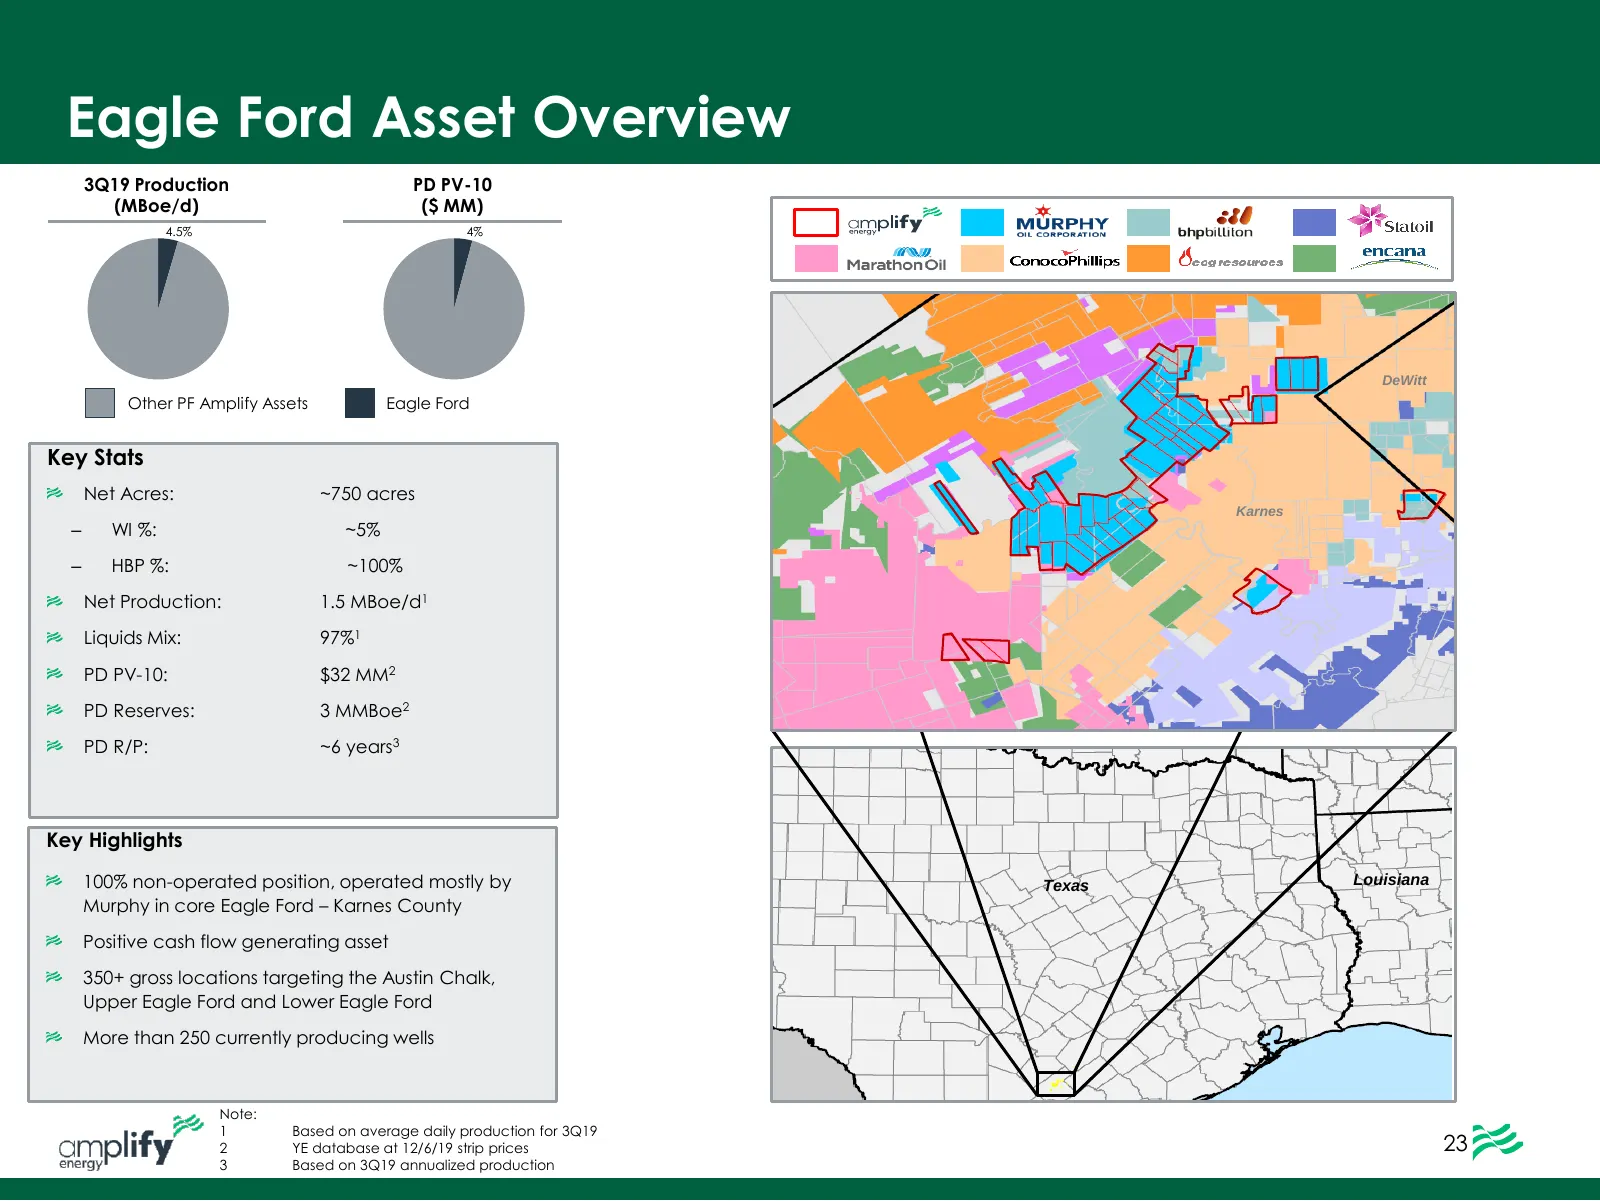
Eagle Ford Asset Overview 3Q19 Production PD PV-10 (MBoe/d) ($ MM) 4.5% 4% DeWitt Other PF Amplify Assets Eagle Ford Key Stats Net Acres: ~750 acres Karnes ‒ WI %: ~5% ‒ HBP %: ~100% Net Production: 1.5 MBoe/d1 Liquids Mix: 97%1 PD PV-10: $32 MM2 PD Reserves: 3 MMBoe2 PD R/P: ~6 years3 Key Highlight
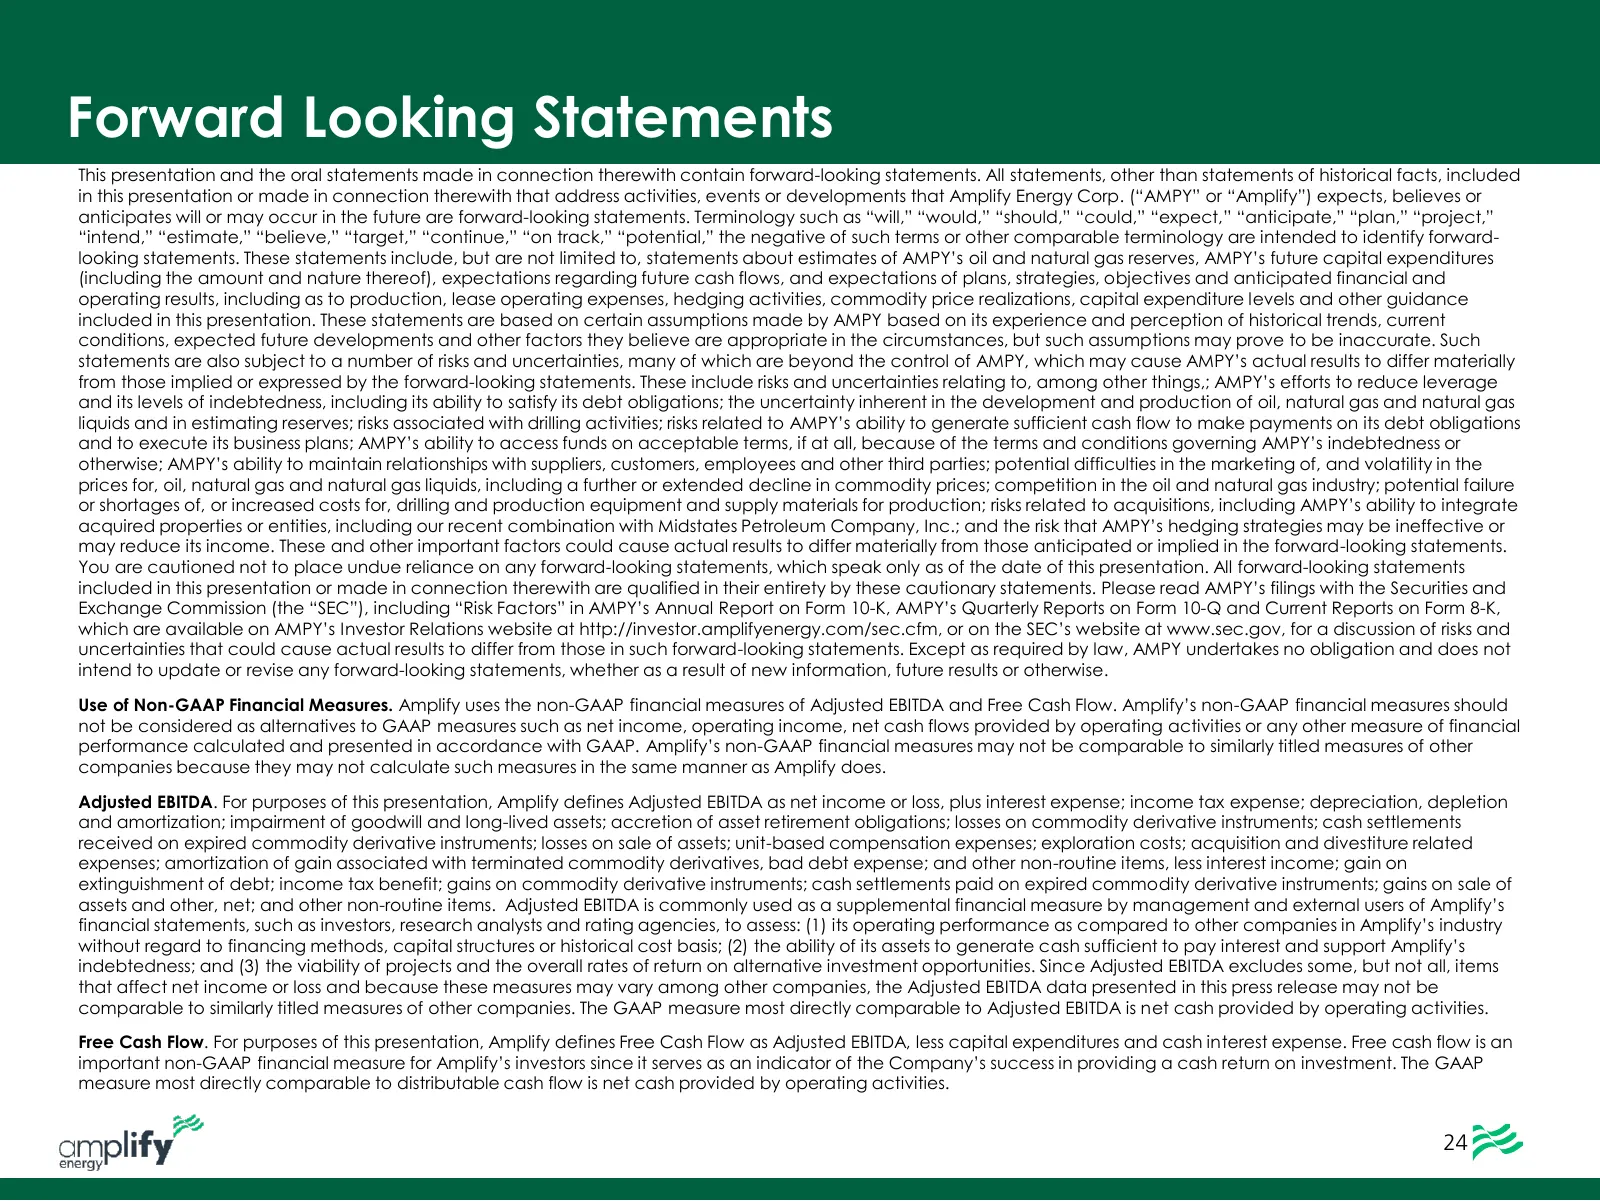
Slide 25: Forward Looking Statements
Forward Looking Statements This presentation and the oral statements made in connection therewith contain forward-looking statements. All statements, other than statements of historical facts, included in this presentation or made in connection therewith that address activities, events or developmen
Source: Internet Archive copy of s24.q4cdn.com
More decks from Amplify Energy Corp.
 Q3 2026 Earnings Presentation31 slides · Nov 9, 2026
 Q2 2026 Earnings Presentation31 slides · Aug 10, 2026
 Investor Presentation (May 2026)30 slides · May 11, 2026
 Investor Presentation (March 2026)28 slides · Mar 9, 2026
 Investor Presentation (August 2025)28 slides · Aug 6, 2025
 Q1 2025 Earnings Presentation33 slides · May 13, 2025