Superior Well Services — EnerCom The 2009 Oil & Gas Conference
25 slides from Superior Well Services's conference presentation, Aug 10, 2009
Slide 1: EnerCom The 2009 Oil & Gas Conference
EnerCom The 2009 Oil & Gas Conference
Slide 2: Forward-Looking Statements
2 Forward-Looking Statements This presentation includes "forward-looking statements" within the meaning of Section 27A of the Securities Act of 1933, as amended, and Section 21E of the Securities Act of 1934, as amended. All statements, other than statements of historical facts, included in this pre
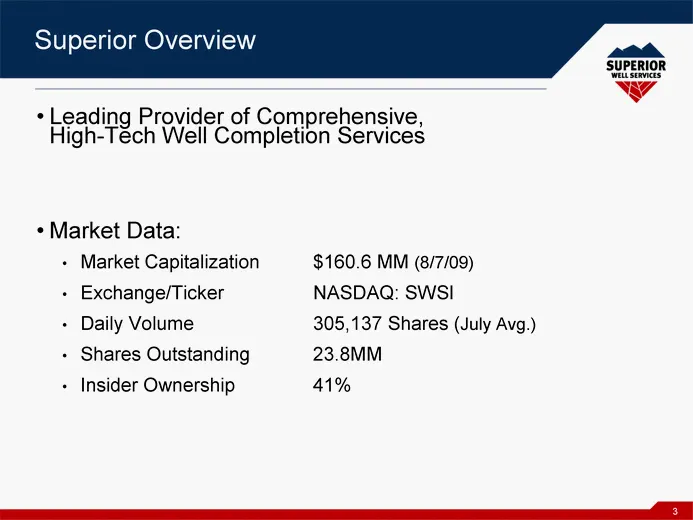
Slide 3: Superior Overview
3 Superior Overview Leading Provider of Comprehensive, High-Tech Well Completion Services Market Data: Market Capitalization $160.6 MM (8/7/09) Exchange/Ticker NASDAQ: SWSI Daily Volume 305,137 Shares (July Avg.) Shares Outstanding 23.8MM Insider Ownership 41%
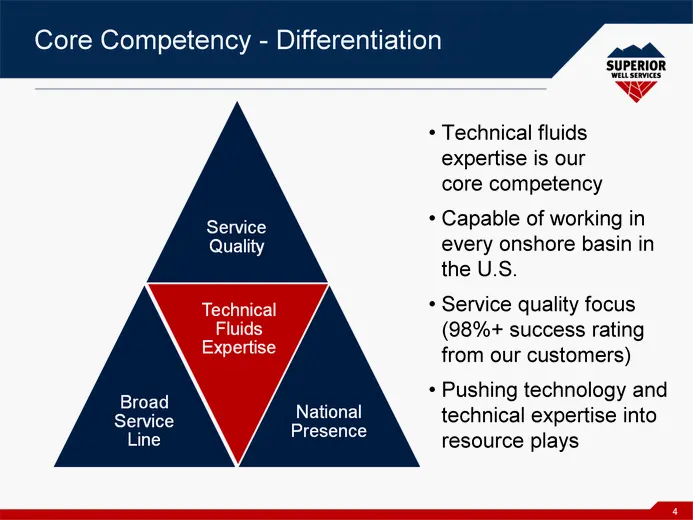
Slide 4: Core Competency - Differentiation
4 Core Competency - Differentiation Technical fluids expertise is our core competency Capable of working in every onshore basin in the U.S. Service quality focus (98%+ success rating from our customers) Pushing technology and technical expertise into resource plays
Slide 5: Technology Leadership
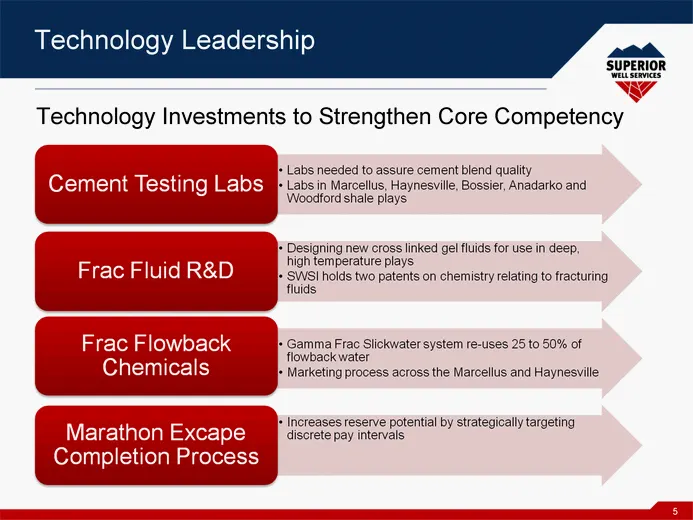
5 Technology Leadership Technology Leadership Technology Investments to Strengthen Core Competency
Slide 6: U.S. Onshore Rig Count Overview
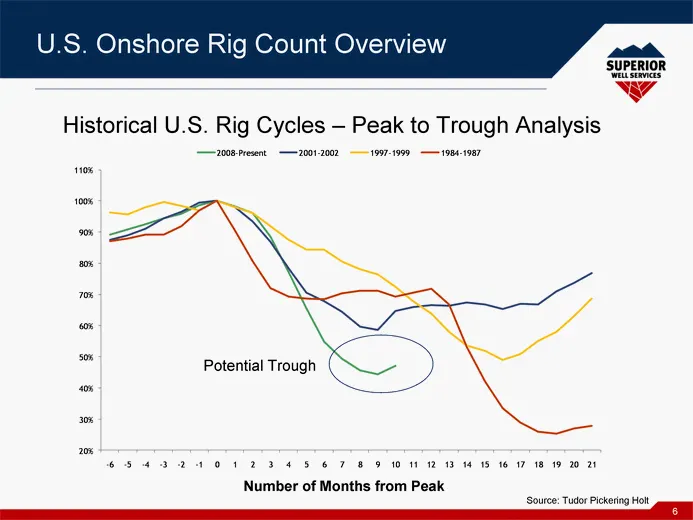
6 U.S. Onshore Rig Count Overview Historical U.S. Rig Cycles - Peak to Trough Analysis Number of Months from Peak Potential Trough Source: Tudor Pickering Holt
Slide 7: N.A. Pressure Pumping Capacity
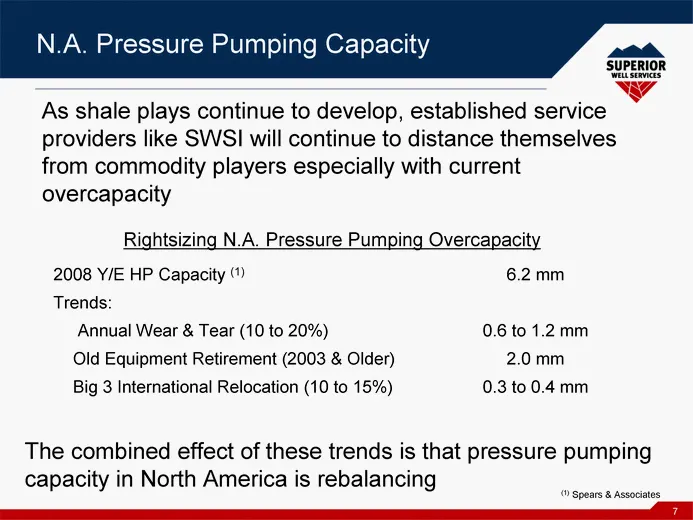
7 N.A. Pressure Pumping Capacity As shale plays continue to develop, established service providers like SWSI will continue to distance themselves from commodity players especially with current overcapacity Rightsizing N.A. Pressure Pumping Overcapacity 2008 Y/E HP Capacity (1) 6.2 mm Trends: Annual
Slide 8: 2008 N.A. Pressure Pumping Capacity
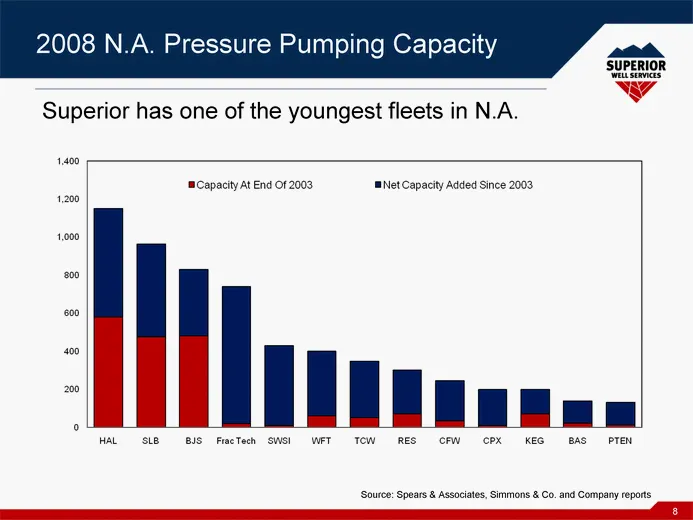
8 2008 N.A. Pressure Pumping Capacity Superior has one of the youngest fleets in N.A. Source: Spears & Associates, Simmons & Co. and Company reports
Slide 9: Broad Geographic Footprint
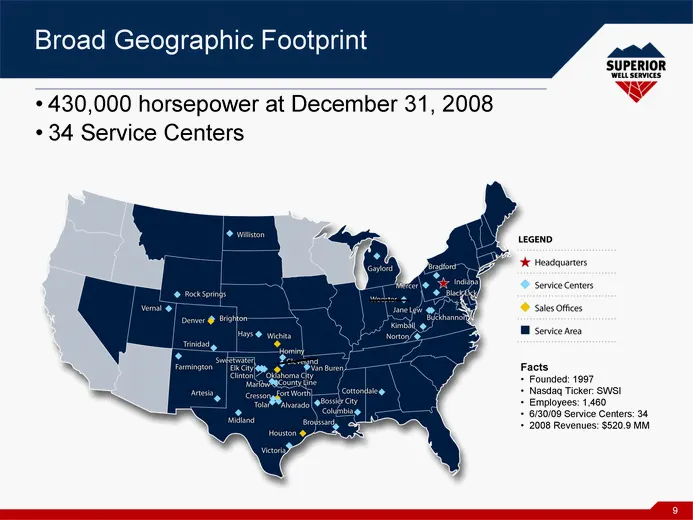
Broad Geographic Footprint 430,000 horsepower at December 31, 2008 34 Service Centers Facts Founded: 1997 Nasdaq Ticker: SWSI Employees: 1,460 6/30/09 Service Centers: 34 2008 Revenues: $520.9 MM 9
Slide 10: Located in Shale Drilling Basins
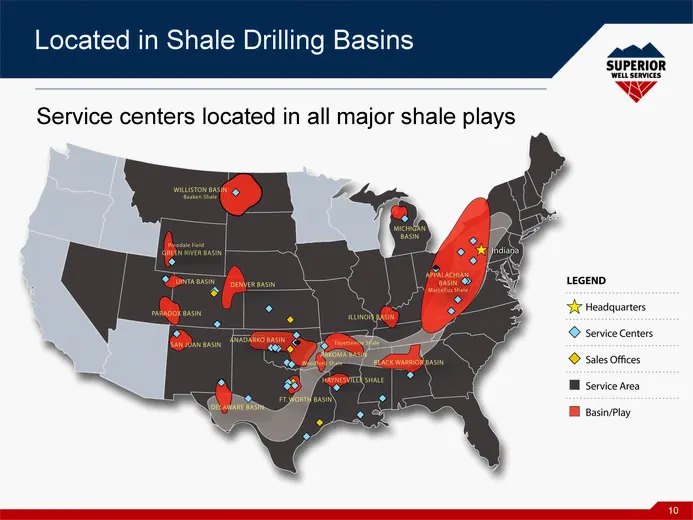
Located in Shale Drilling Basins Service centers located in all major shale plays 10
Slide 11: Workforce Reductions
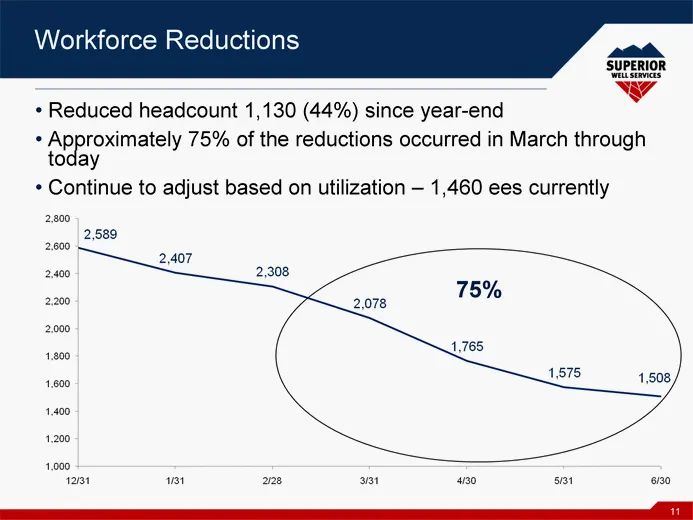
Workforce Reductions Reduced headcount 1,130 (44%) since year-end Approximately 75% of the reductions occurred in March through today Continue to adjust based on utilization - 1,460 ees currently 11 75%
Slide 12: Payroll and Benefits Initiatives
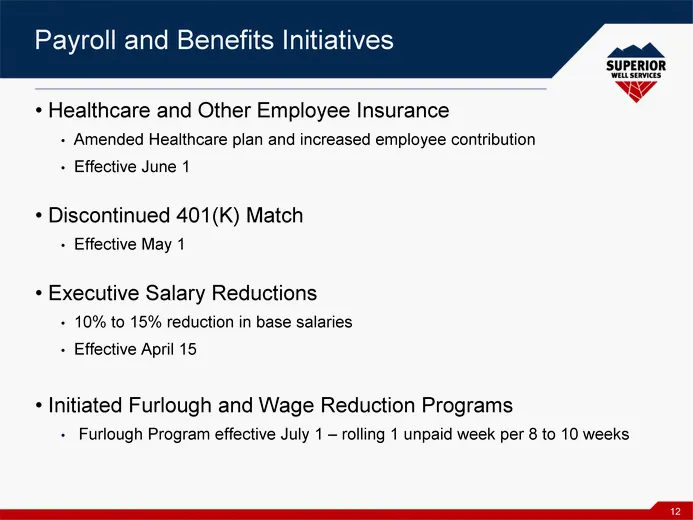
Payroll and Benefits Initiatives Healthcare and Other Employee Insurance Amended Healthcare plan and increased employee contribution Effective June 1 Discontinued 401(K) Match Effective May 1 Executive Salary Reductions 10% to 15% reduction in base salaries Effective April 15 Initiated Furlough and
Slide 13: Material, Fuel and Repair Initiatives
Material, Fuel and Repair Initiatives Established Cost Initiative Teams for Major Material, Fuel and Repair Items Maintaining Discretionary Spending Discipline $17.8 million cash capex during six months ended June 2009 Reducing Inventory Levels 13
Slide 14: Operations Overview
tn SUPERIOR WELL SERVICES Operations Overview
Slide 15: Diversified Revenue Stream - Q2 '09
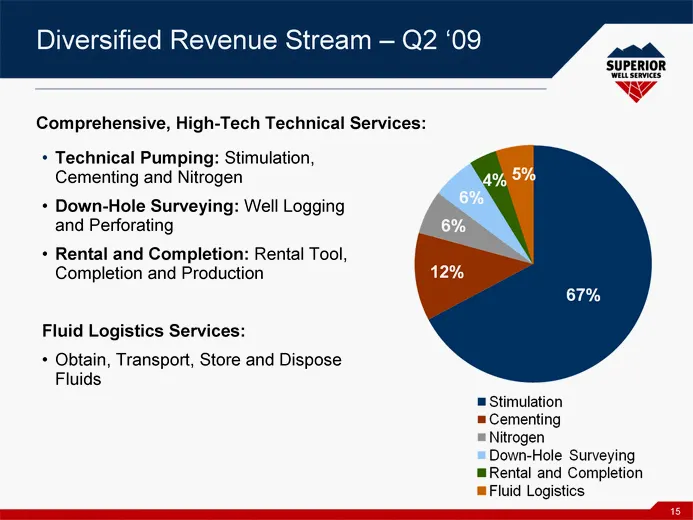
15 Diversified Revenue Stream - Q2 '09 Technical Pumping: Stimulation, Cementing and Nitrogen Down-Hole Surveying: Well Logging and Perforating Rental and Completion: Rental Tool, Completion and Production Fluid Logistics Services: Obtain, Transport, Store and Dispose Fluids Comprehensive, High-Tech
Slide 16: Cementing - Technical Pumping
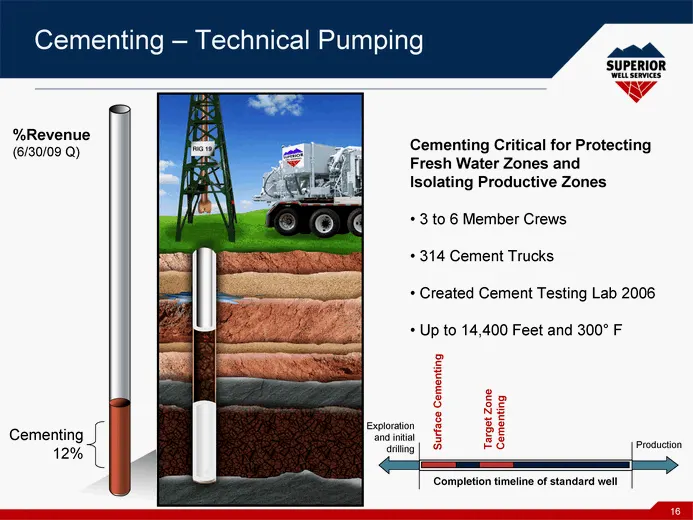
16 Cementing - Technical Pumping Cementing Critical for Protecting Fresh Water Zones and Isolating Productive Zones 3 to 6 Member Crews 314 Cement Trucks Created Cement Testing Lab 2006 Up to 14,400 Feet and 300° F Exploration and initial drilling Production Completion timeline of standard well Surf
Slide 17: Logging - Down-Hole Surveying
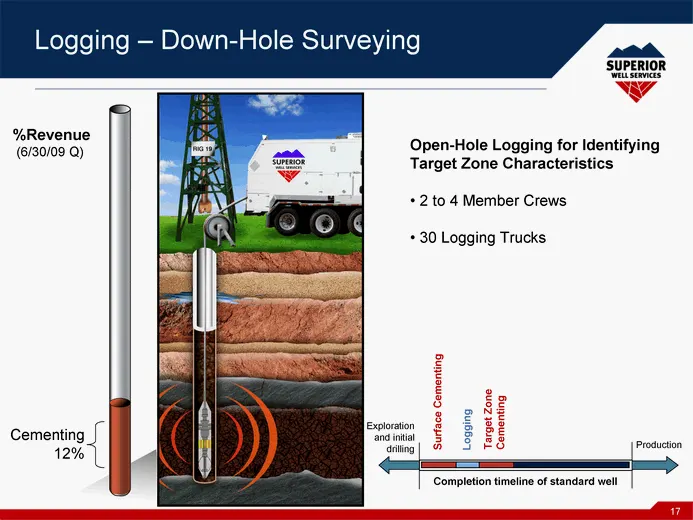
17 Logging - Down-Hole Surveying Open-Hole Logging for Identifying Target Zone Characteristics 2 to 4 Member Crews 30 Logging Trucks Exploration and initial drilling Production Completion timeline of standard well Surface Cementing Target Zone Cementing Logging %Revenue (6/30/09 Q) Cementing 12%
Slide 18: Perforating - Down-Hole Surveying
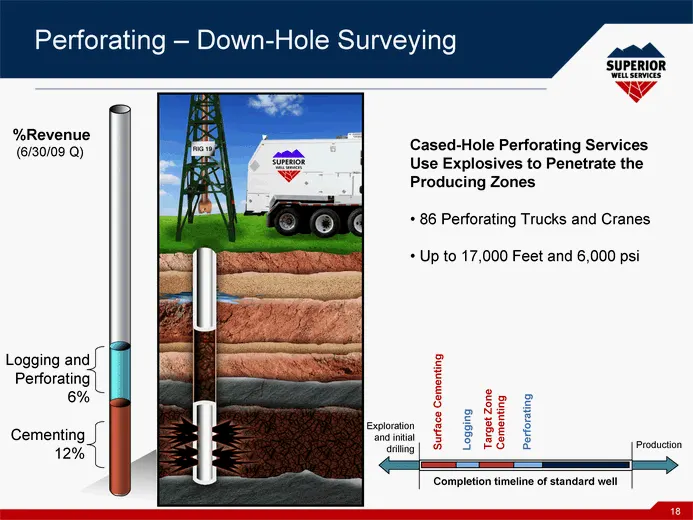
18 Perforating - Down-Hole Surveying Cased-Hole Perforating Services Use Explosives to Penetrate the Producing Zones 86 Perforating Trucks and Cranes Up to 17,000 Feet and 6,000 psi Exploration and initial drilling Production Completion timeline of standard well Surface Cementing Target Zone Cementi
Slide 19: Nitrogen - Technical Pumping
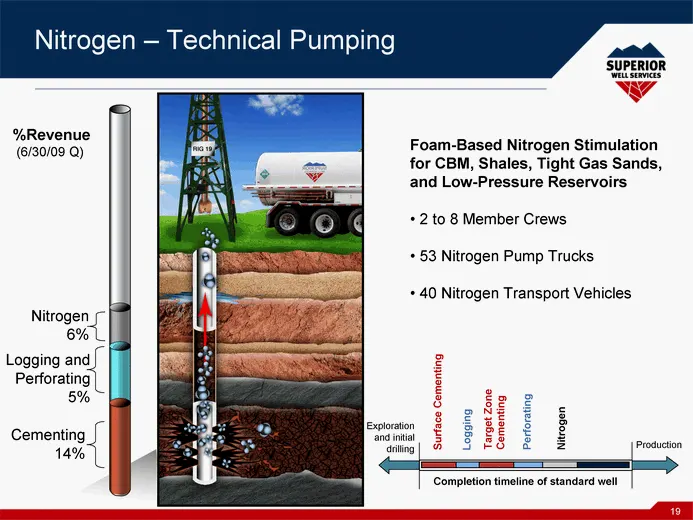
19 Nitrogen - Technical Pumping Foam-Based Nitrogen Stimulation for CBM, Shales, Tight Gas Sands, and Low-Pressure Reservoirs 2 to 8 Member Crews 53 Nitrogen Pump Trucks 40 Nitrogen Transport Vehicles Exploration and initial drilling Production Completion timeline of standard well Surface Cementing
Slide 20: Stimulation & Completion - Technical Pumping
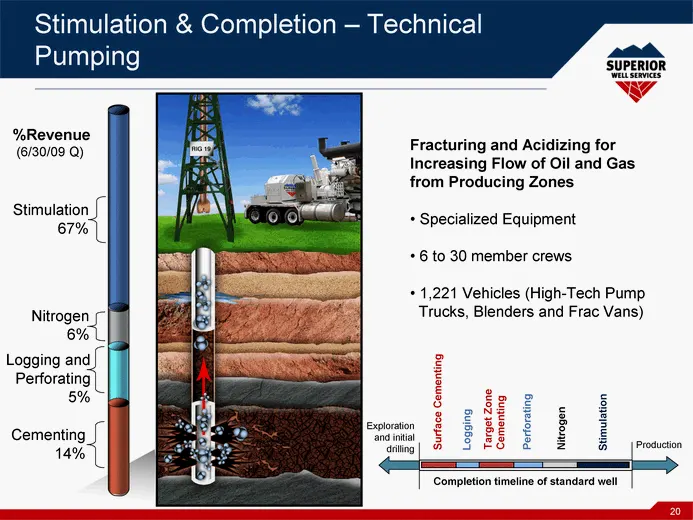
20 Stimulation Stimulation & Completion - Technical Pumping Fracturing and Acidizing for Increasing Flow of Oil and Gas from Producing Zones Specialized Equipment 6 to 30 member crews 1,221 Vehicles (High-Tech Pump Trucks, Blenders and Frac Vans) Exploration and initial drilling Production Completio
Slide 21: Horizontal Stimulation & Completion
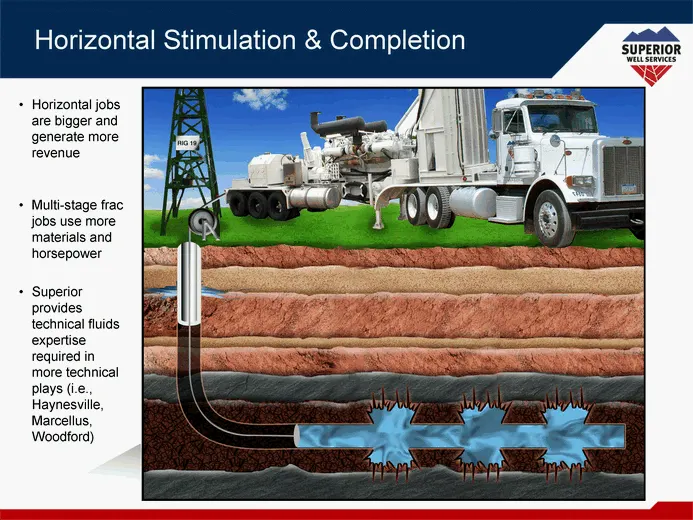
Horizontal Stimulation & Completion Horizontal jobs are bigger and generate more revenue Multi-stage frac jobs use more materials and horsepower Superior provides technical fluids expertise required in more technical plays (i.e., Haynesville, Marcellus, Woodford)
Slide 22: Financial Overview
SUPERIOR WELL SERVICES WW Financial Overview
Slide 23: Significant Working Capital & Liquidity
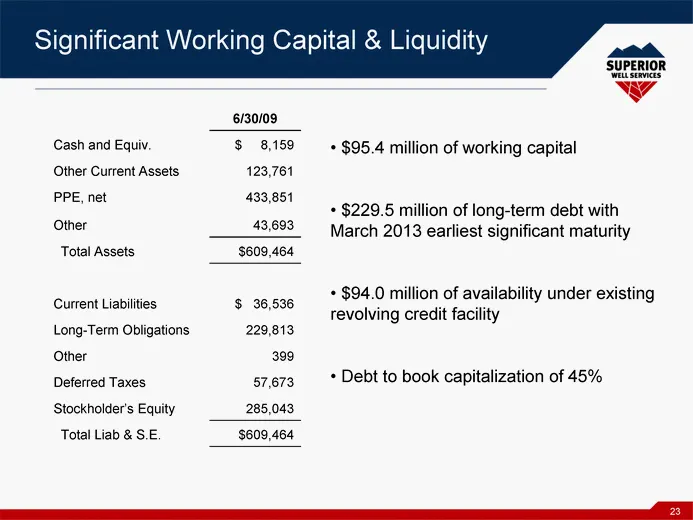
23 Significant Working Capital & Liquidity 6/30/09 Cash and Equiv. $ 8,159 Other Current Assets 123,761 PPE, net 433,851 Other 43,693 Total Assets $609,464 Current Liabilities $ 36,536 Long-Term Obligations 229,813 Other 399 Deferred Taxes 57,673 Stockholder's Equity 285,043 Total Liab & S.E. $609,4
Slide 24: Investments for Service Quality
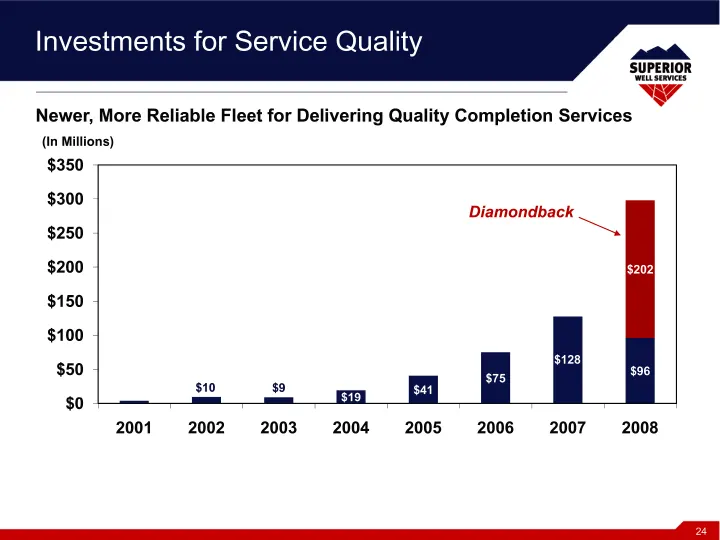
Investments for Service Quality pwn Supenion Newer, More Reliable Fleet for Delivering Quality Completion Services (In Millions) $350 $300 Diamondback $250 ™. $200 $150 $100 $128} $50 - . ; $96 $0 ss 2001 2002 2003 2004 2005 2006 2007 2008 $202}
Slide 25: Company Highlights
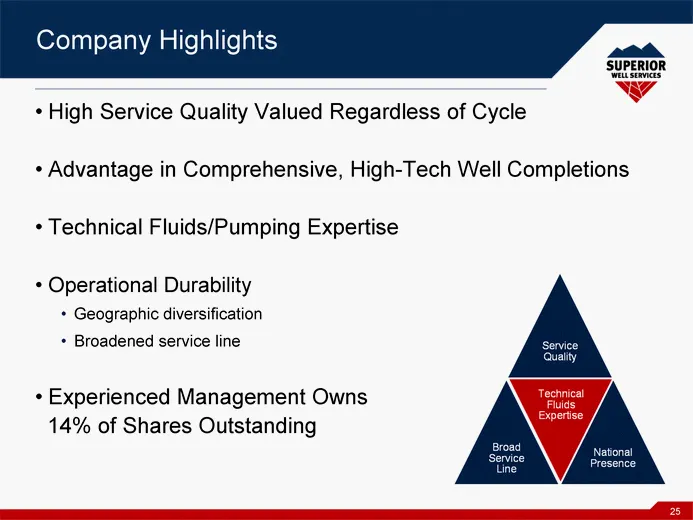
25 Company Highlights High Service Quality Valued Regardless of Cycle Advantage in Comprehensive, High-Tech Well Completions Technical Fluids/Pumping Expertise Operational Durability Geographic diversification Broadened service line Experienced Management Owns 14% of Shares Outstanding
Source: SEC EDGAR · 8-K filed Aug 10, 2009
More decks from Superior Well Services INC
 Investor Presentation (June 2010)28 slides · Jun 7, 2010
 Pritchard Capital Conference 201044 slides · May 19, 2010
 Investor Presentation (May 2010)28 slides · May 13, 2010
 Investor Presentation (March 2010)28 slides · Mar 16, 2010
 Pritchard Capital Partners Energize 201031 slides · Jan 5, 2010
 Pritchard Capital Partners Boston Appalachia Forum 200931 slides · Nov 13, 2009