BSP · RUS:BSPB
BSP — Bank Saint Petersburg — Q1 2025 Earnings Presentation
18 slides from BSP's earnings presentation, May 16, 2025
Slide 1: 1Q 2025 IFRS Financial Results
1Q 2025 IFRS FINANCIAL RESULTS May 16, 2025
Slide 2: Disclaimer
DISCLAIMER This presentation contains forward-looking statements regarding future events and financial performance of PJSC “Bank Saint Petersburg" (hereinafter - the “Bank"). Such forward-looking statements are based on the current expectations and assumptions of the Bank's management, are made in g
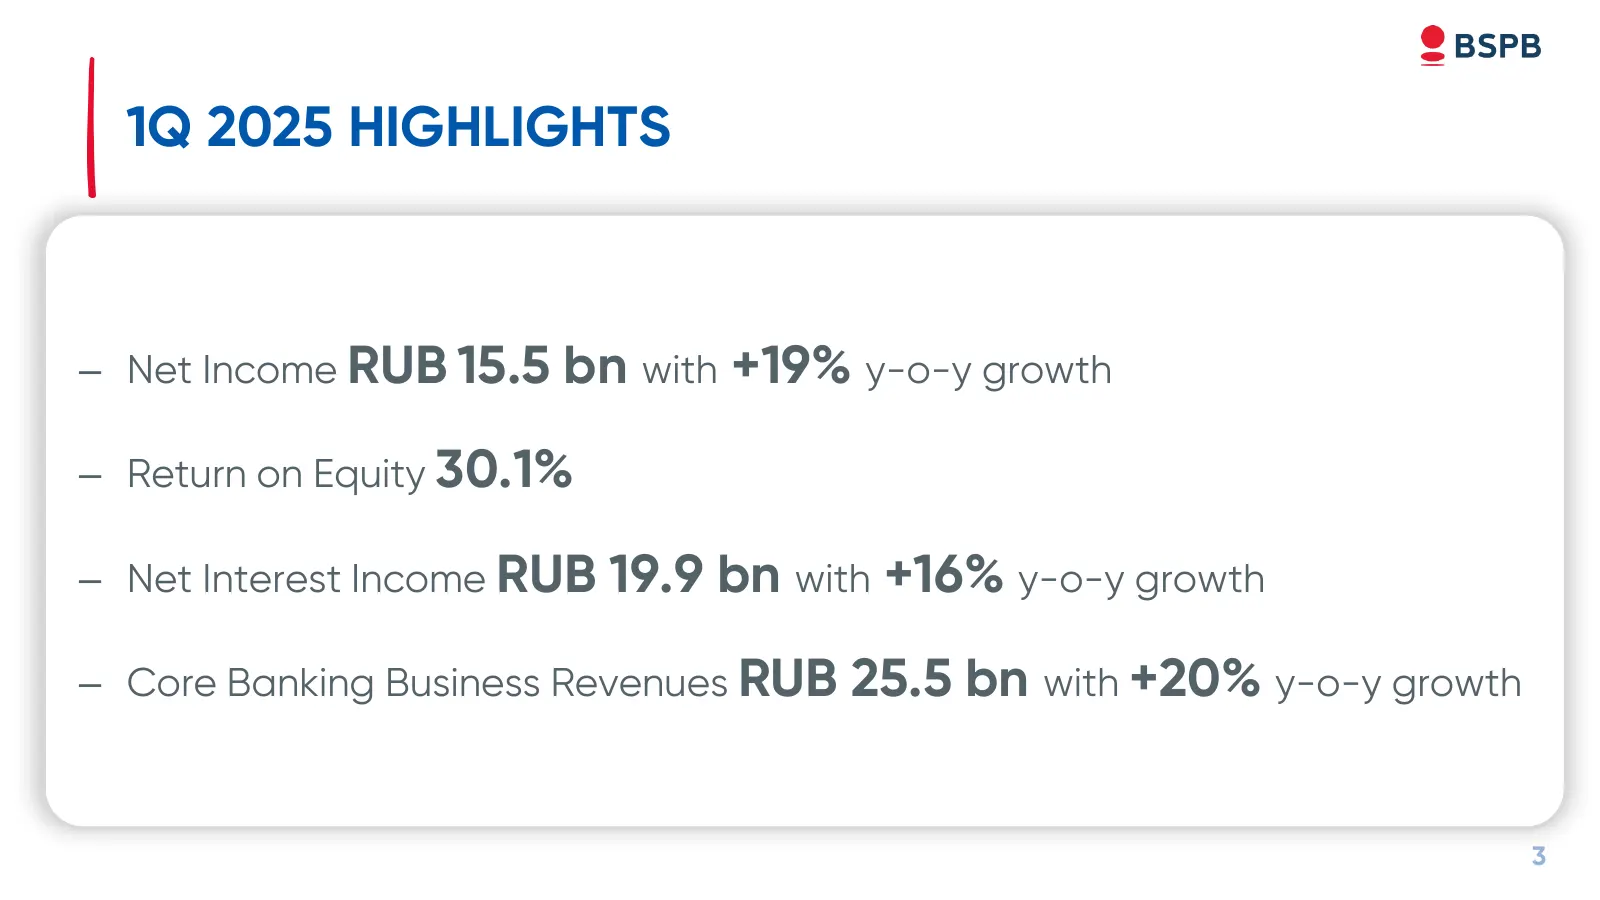
Slide 3: 1Q 2025 Highlights
1Q 2025 HIGHLIGHTS – Net Income RUB 15.5 bn with +19% y-o-y growth – Return on Equity 30.1% – Net Interest Income RUB 19.9 bn with +16% y-o-y growth – Core Banking Business Revenues RUB 25.5 bn with +20% y-o-y growth 3
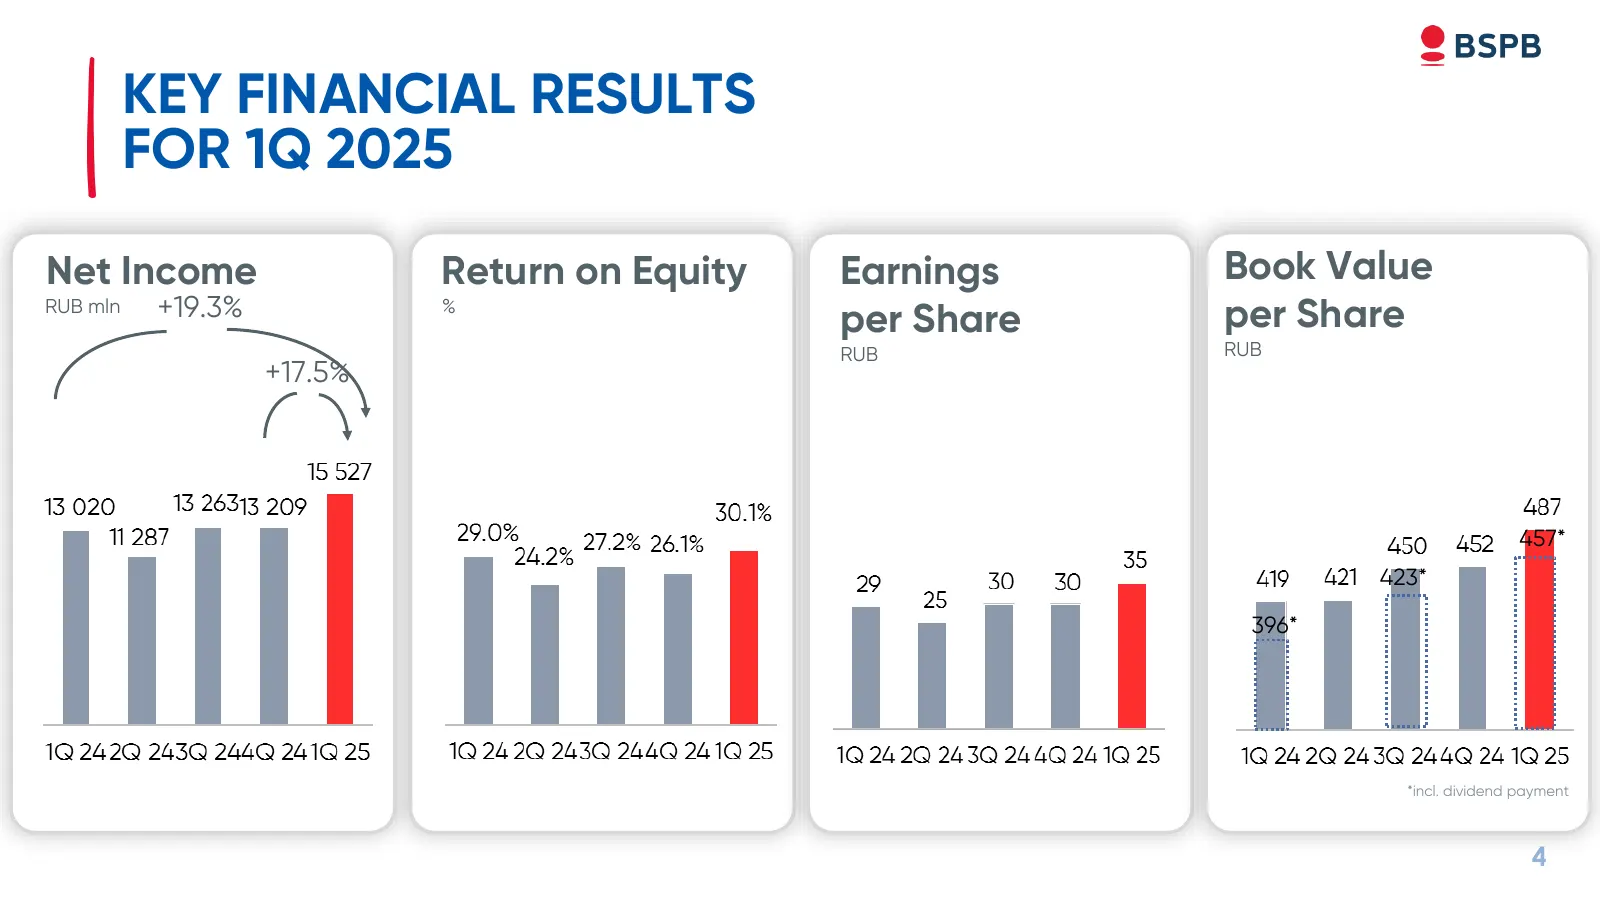
Slide 4: Key Financial Results for 1Q 2025
KEY FINANCIAL RESULTS FOR 1Q 2025 Net Income Return on Equity Earnings Book Value RUB mln +19.3% % per Share per Share RUB RUB +17.5% 457* 423* 396* *incl. dividend payment 4
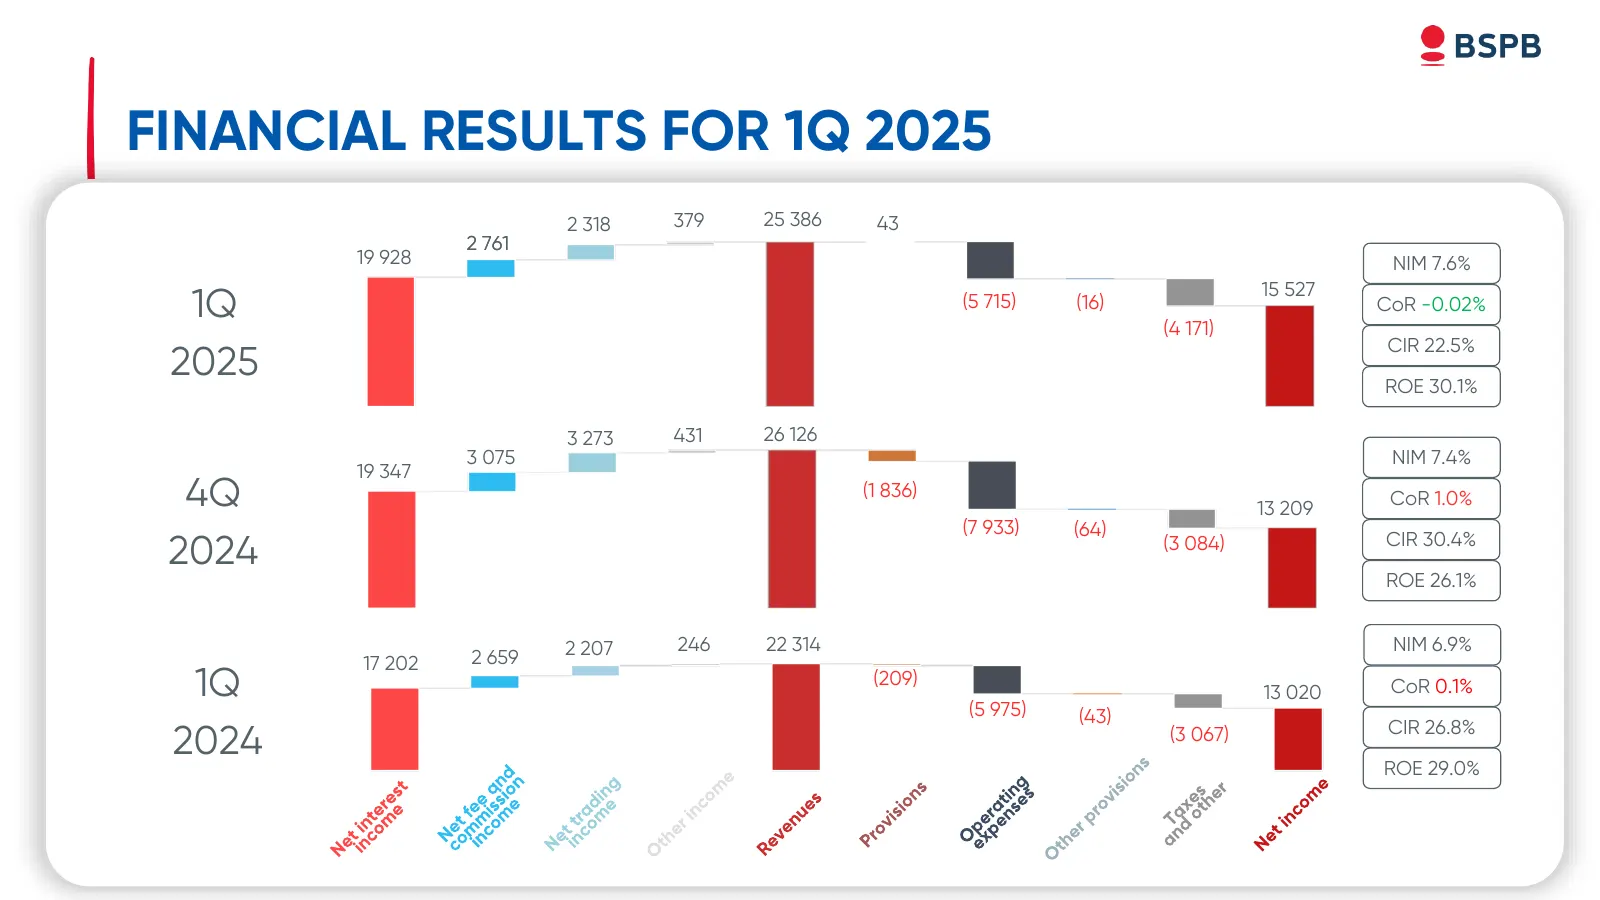
Slide 5: Financial Results for 1Q 2025
FINANCIAL RESULTS FOR 1Q 2025 2 318 379 25 386 43 2 761 19 928 NIM 7.6% 15 527 1Q (5 715) (16) (4 171) CoR -0.02% CIR 22.5% 2025 ROE 30.1% 3 273 431 26 126 3 075 NIM 7.4% 19 347 4Q (1 836) 13 209 CoR 1.0% (7 933) (64) CIR 30.4% 2024 (3 084) ROE 26.1% 2 207 246 22 314 NIM 6.9% 17 202 2 659 1Q (209) 1
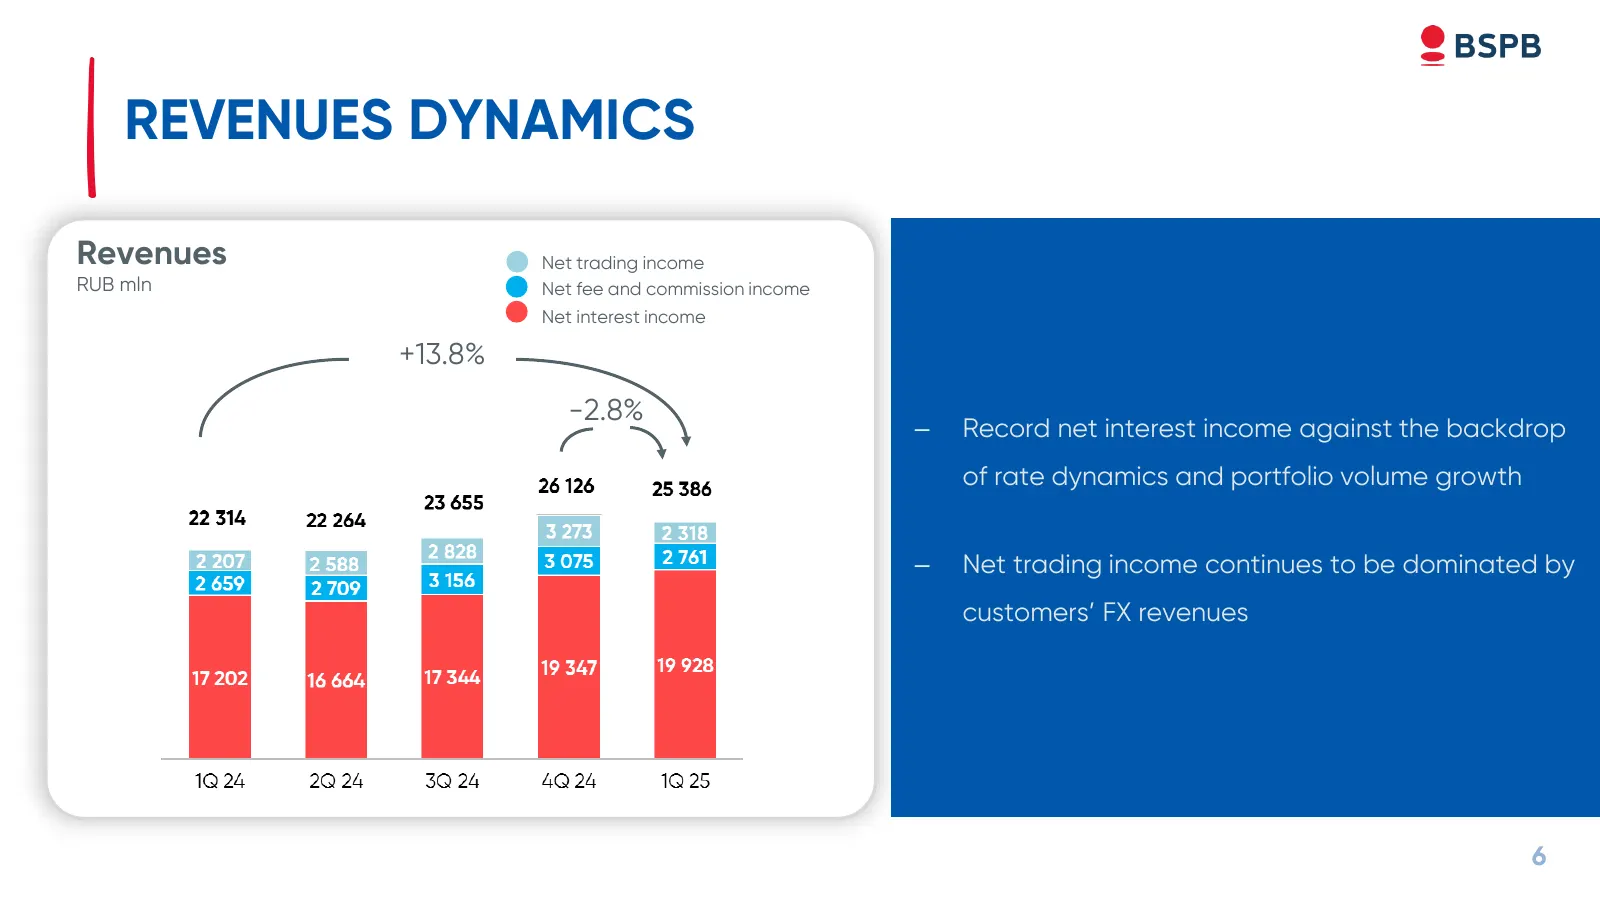
Slide 6: Revenues Dynamics
REVENUES DYNAMICS Revenues Net trading income RUB mln Net fee and commission income Net interest income +13.8% -2.8% – Record net interest income against the backdrop of rate dynamics and portfolio volume growth – Net trading income continues to be dominated by customers’ FX revenues 6
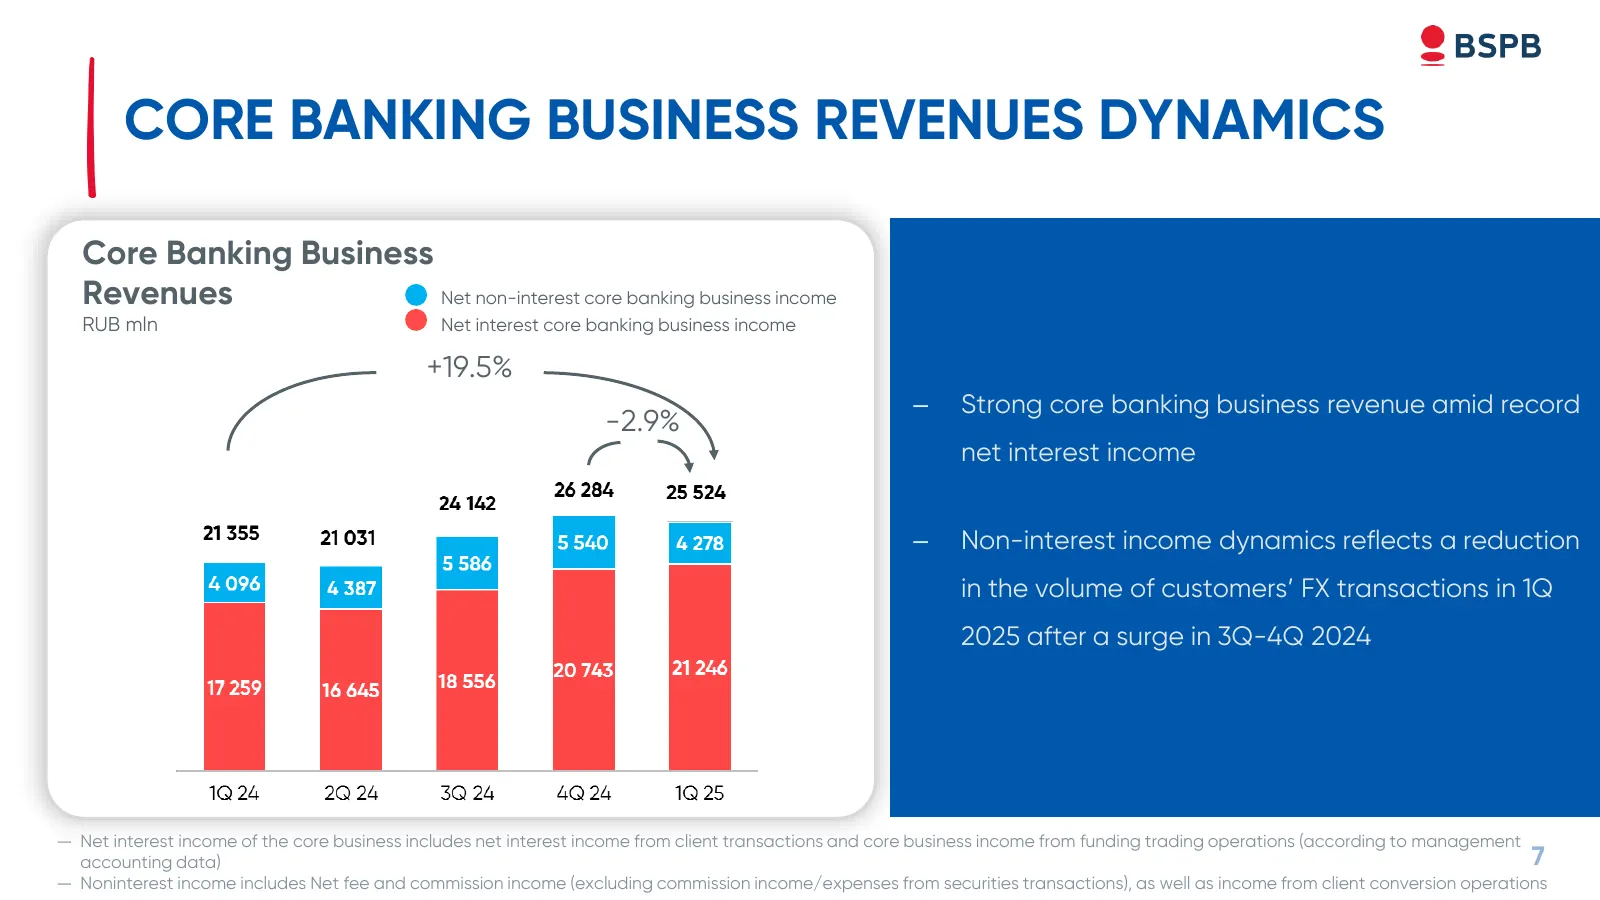
Slide 7: Core Banking Business Revenues Dynamics
CORE BANKING BUSINESS REVENUES DYNAMICS Core Banking Business Revenues Net non-interest core banking business income RUB mln Net interest core banking business income +19.5% – Strong core banking business revenue amid record -2.9% net interest income – Non-interest income dynamics reflects a reducti
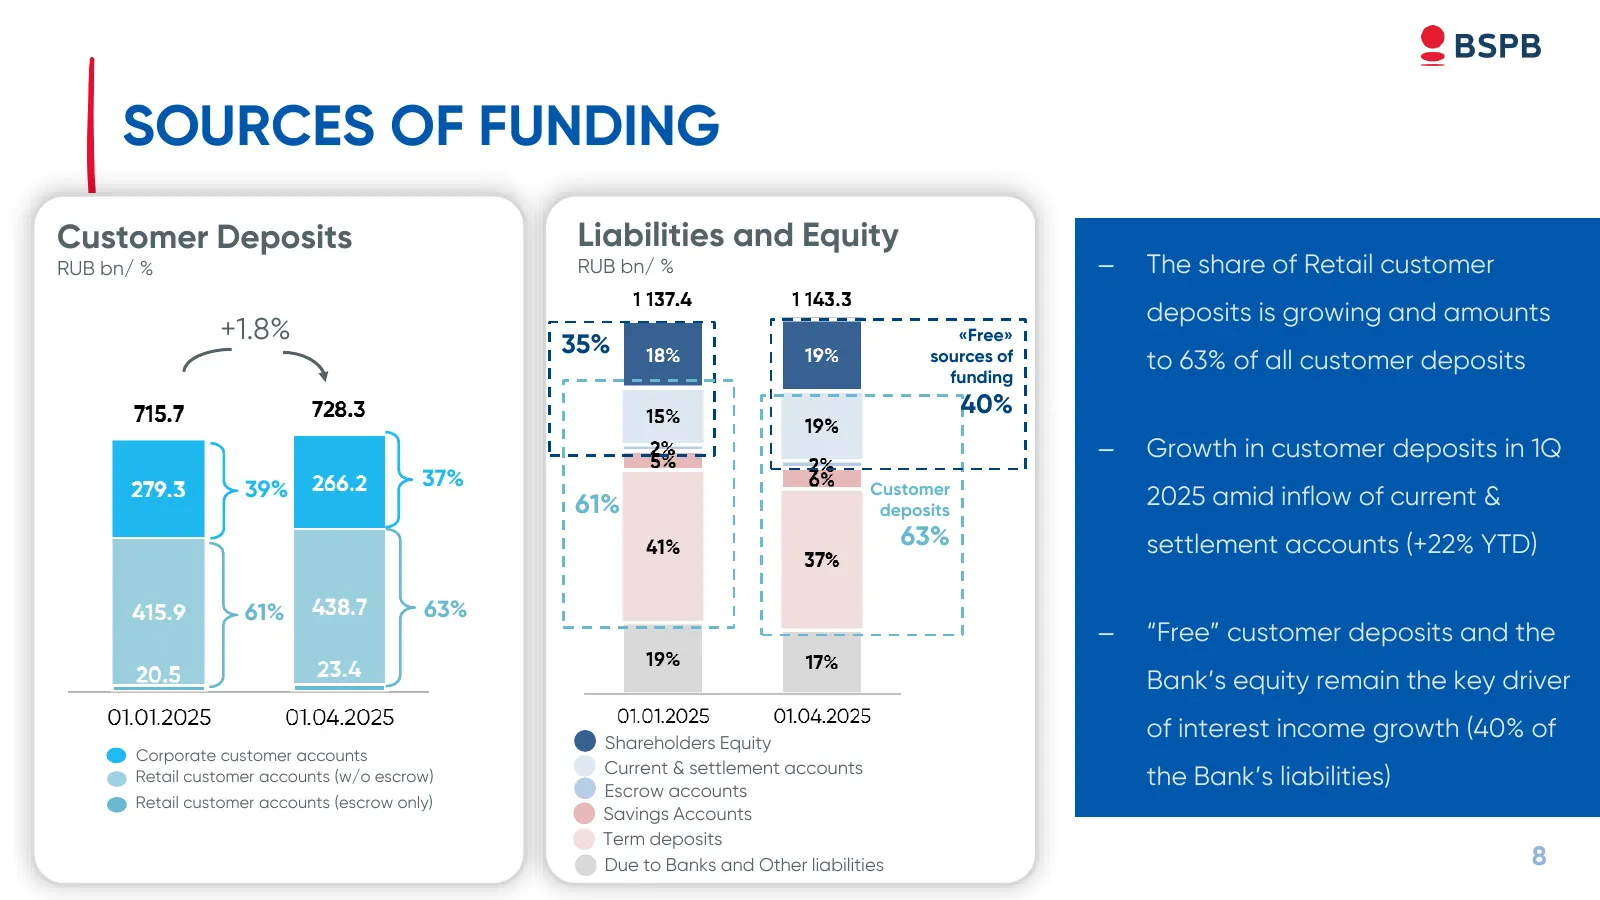
Slide 8: Sources of Funding
SOURCES OF FUNDING Customer Deposits Liabilities and Equity RUB bn/ % RUB bn/ % – The share of Retail customer deposits is growing and amounts +1.8% 35% «Free» sources of to 63% of all customer deposits funding 40% – Growth in customer deposits in 1Q 39% 37% Customer 61% deposits 2025 amid inflow of
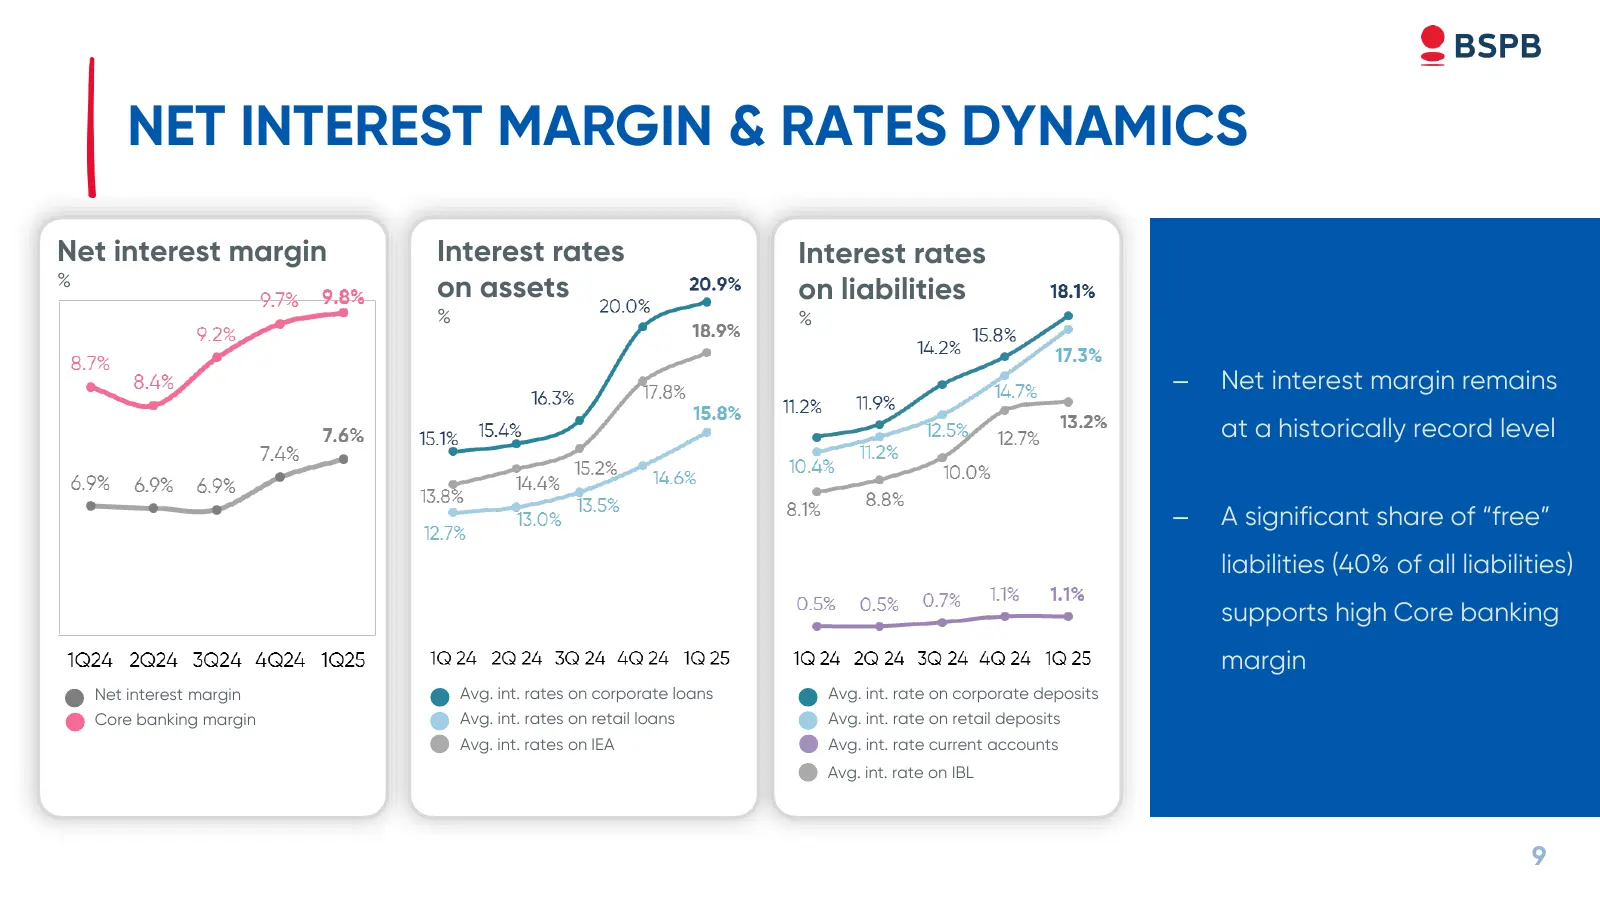
Slide 9: Net Interest Margin & Rates Dynamics
NET INTEREST MARGIN & RATES DYNAMICS Net interest margin Interest rates Interest rates % on assets on liabilities % % – Net interest margin remains at a historically record level – A significant share of “free” liabilities (40% of all liabilities) supports high Core banking margin Net interest margi
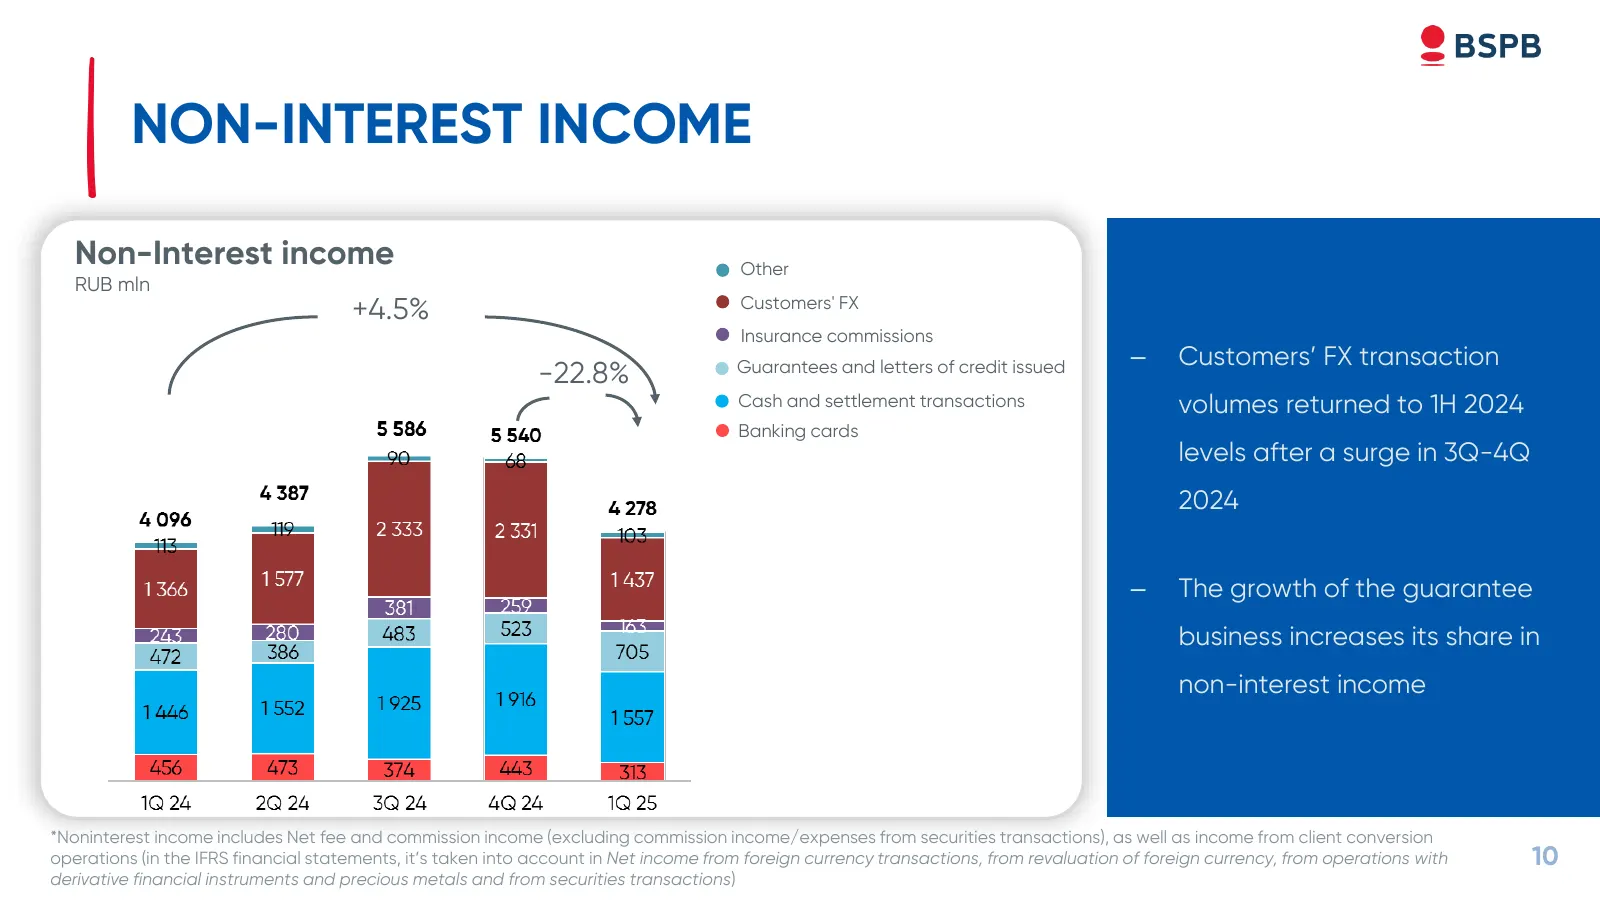
Slide 10: Non-Interest Income
NON-INTEREST INCOME Non-Interest income Other RUB mln Customers' FX +4.5% Insurance commissions Guarantees and letters of credit issued – Customers’ FX transaction -22.8% Cash and settlement transactions volumes returned to 1H 2024 Banking cards levels after a surge in 3Q-4Q 2024 – The growth of the
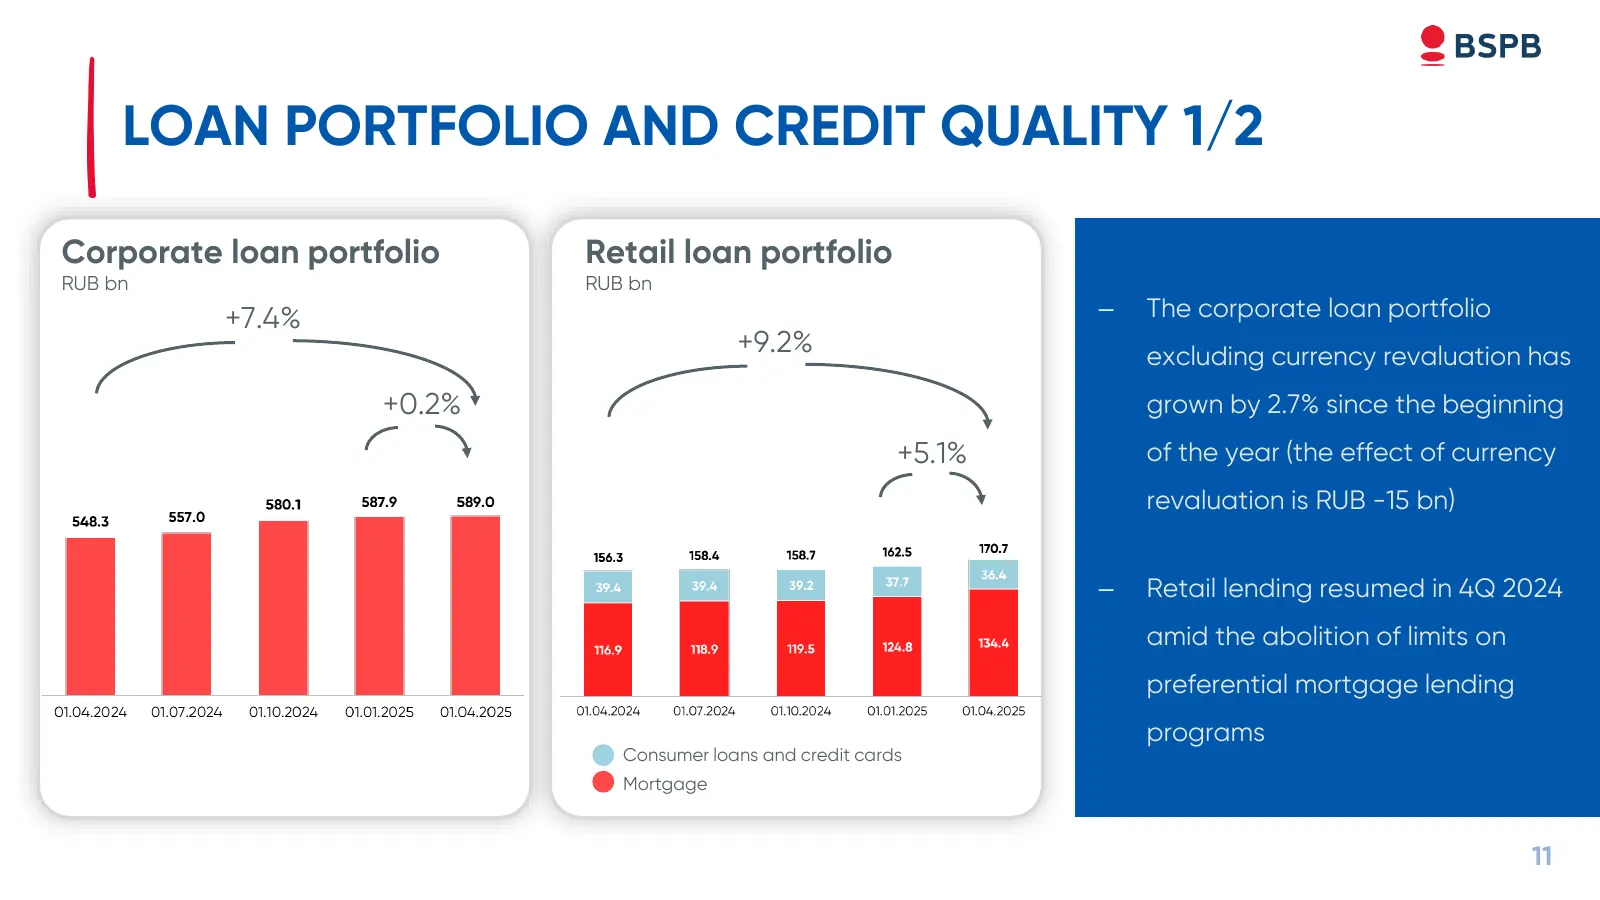
Slide 11: Loan Portfolio and Credit Quality 1/2
LOAN PORTFOLIO AND CREDIT QUALITY 1/2 Corporate loan portfolio Retail loan portfolio RUB bn RUB bn +7.4% – The corporate loan portfolio +9.2% excluding currency revaluation has +0.2% grown by 2.7% since the beginning +5.1% of the year (the effect of currency revaluation is RUB -15 bn) – Retail lendi
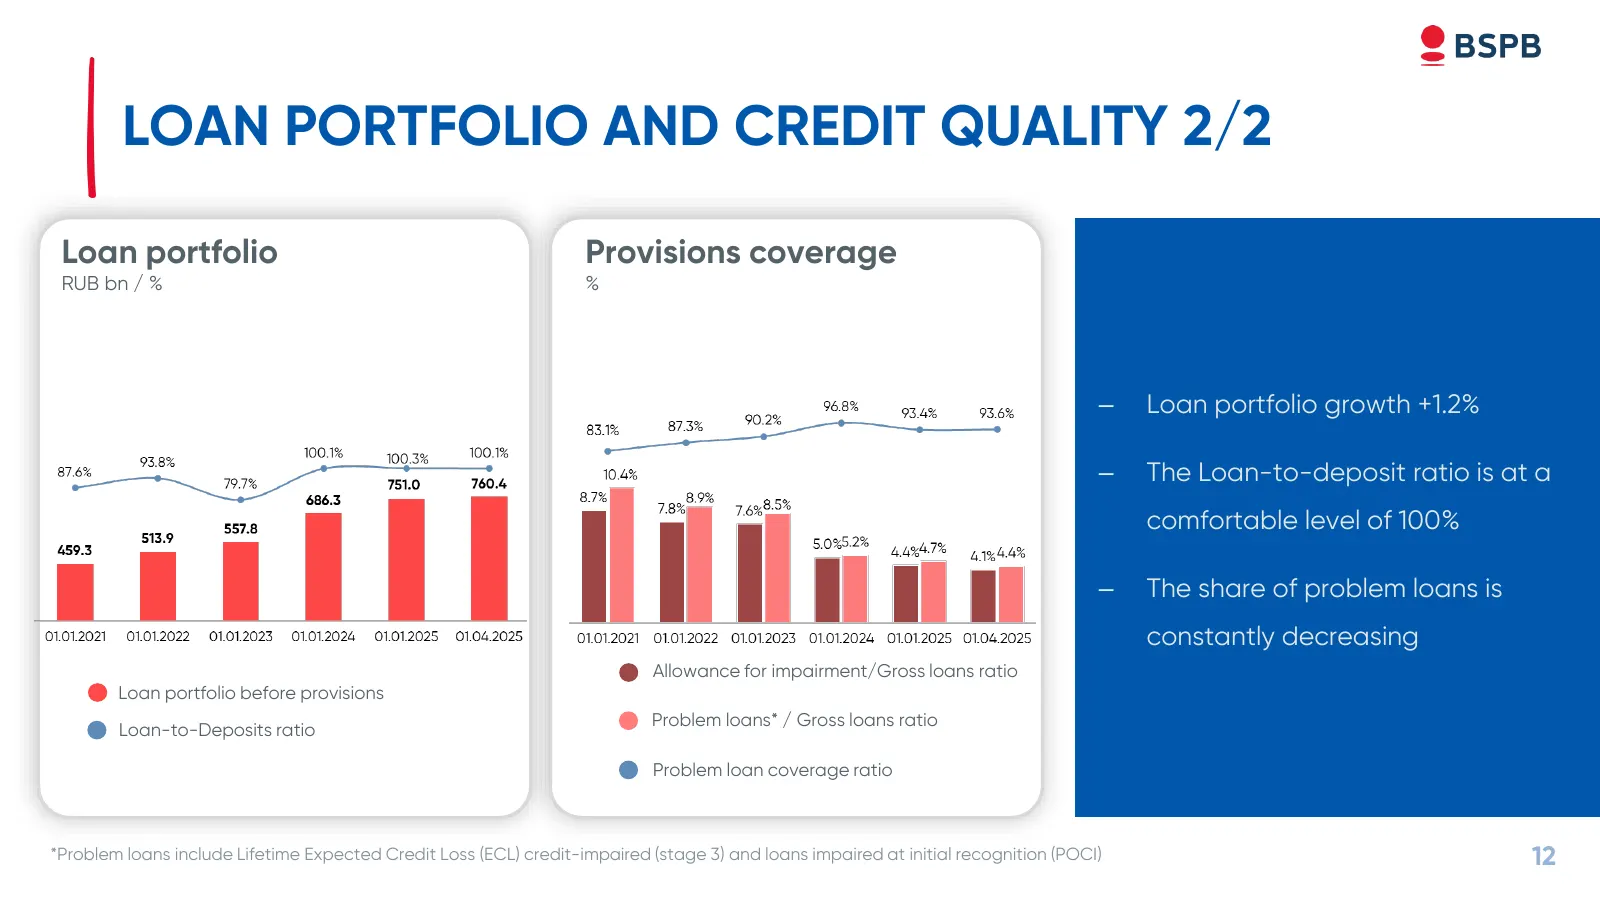
Slide 12: Loan Portfolio and Credit Quality 2/2
LOAN PORTFOLIO AND CREDIT QUALITY 2/2 Loan portfolio Provisions coverage RUB bn / % % – Loan portfolio growth +1.2% – The Loan-to-deposit ratio is at a comfortable level of 100% – The share of problem loans is constantly decreasing Allowance for impairment/Gross loans ratio Loan portfolio before pro
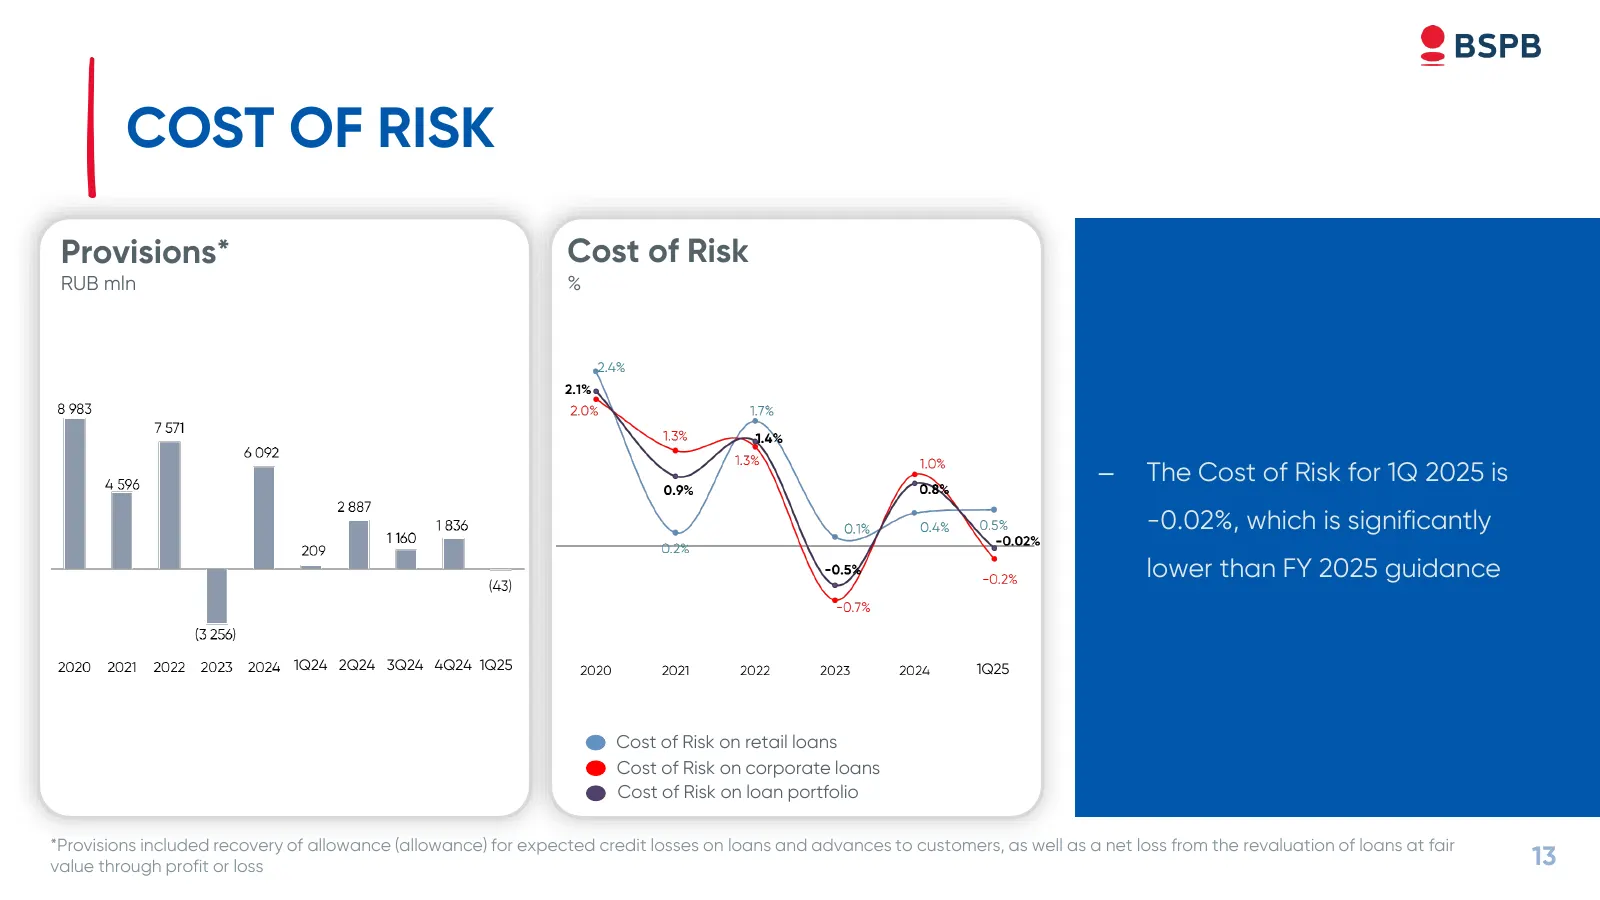
Slide 13: Cost of Risk
COST OF RISK Provisions* Cost of Risk RUB mln % – The Cost of Risk for 1Q 2025 is -0.02%, which is significantly lower than FY 2025 guidance 1Q24 2Q24 3Q24 4Q24 1Q25 1Q25 Cost of Risk on retail loans Cost of Risk on corporate loans Cost of Risk on loan portfolio *Provisions included recovery of allo
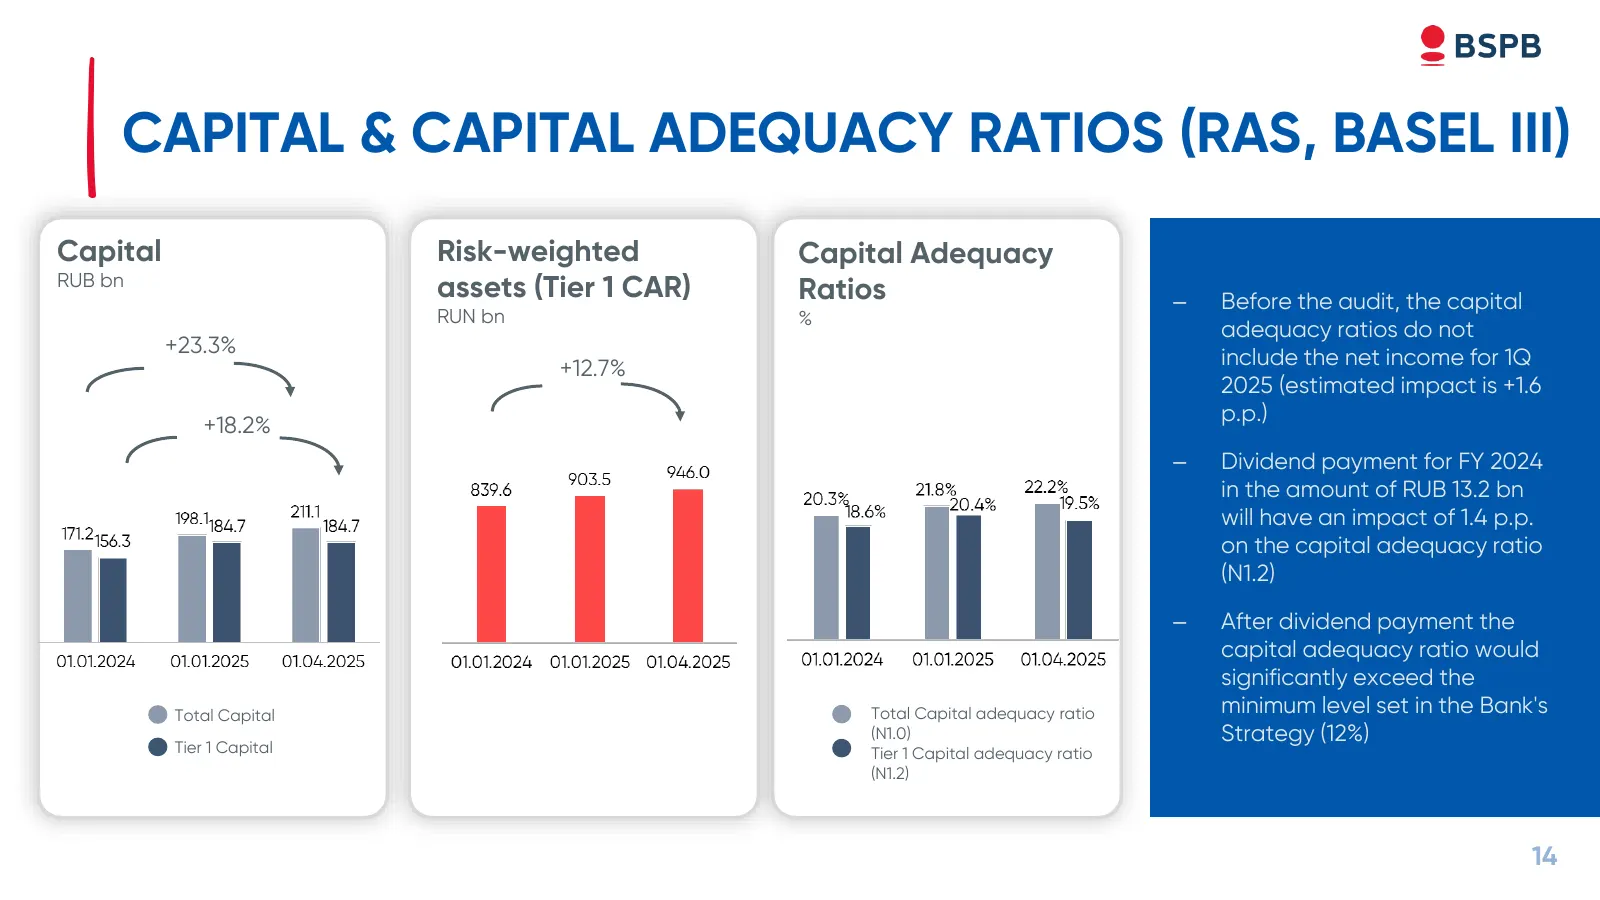
Slide 14: Capital & Capital Adequacy Ratios (RAS, Basel III)
CAPITAL & CAPITAL ADEQUACY RATIOS (RAS, BASEL III) Capital Risk-weighted Capital Adequacy RUB bn assets (Tier 1 CAR) Ratios – Before the audit, the capital RUN bn % adequacy ratios do not +23.3% +12.7% include the net income for 1Q 2025 (estimated impact is +1.6 +18.2% p.p.) – Dividend payment for F
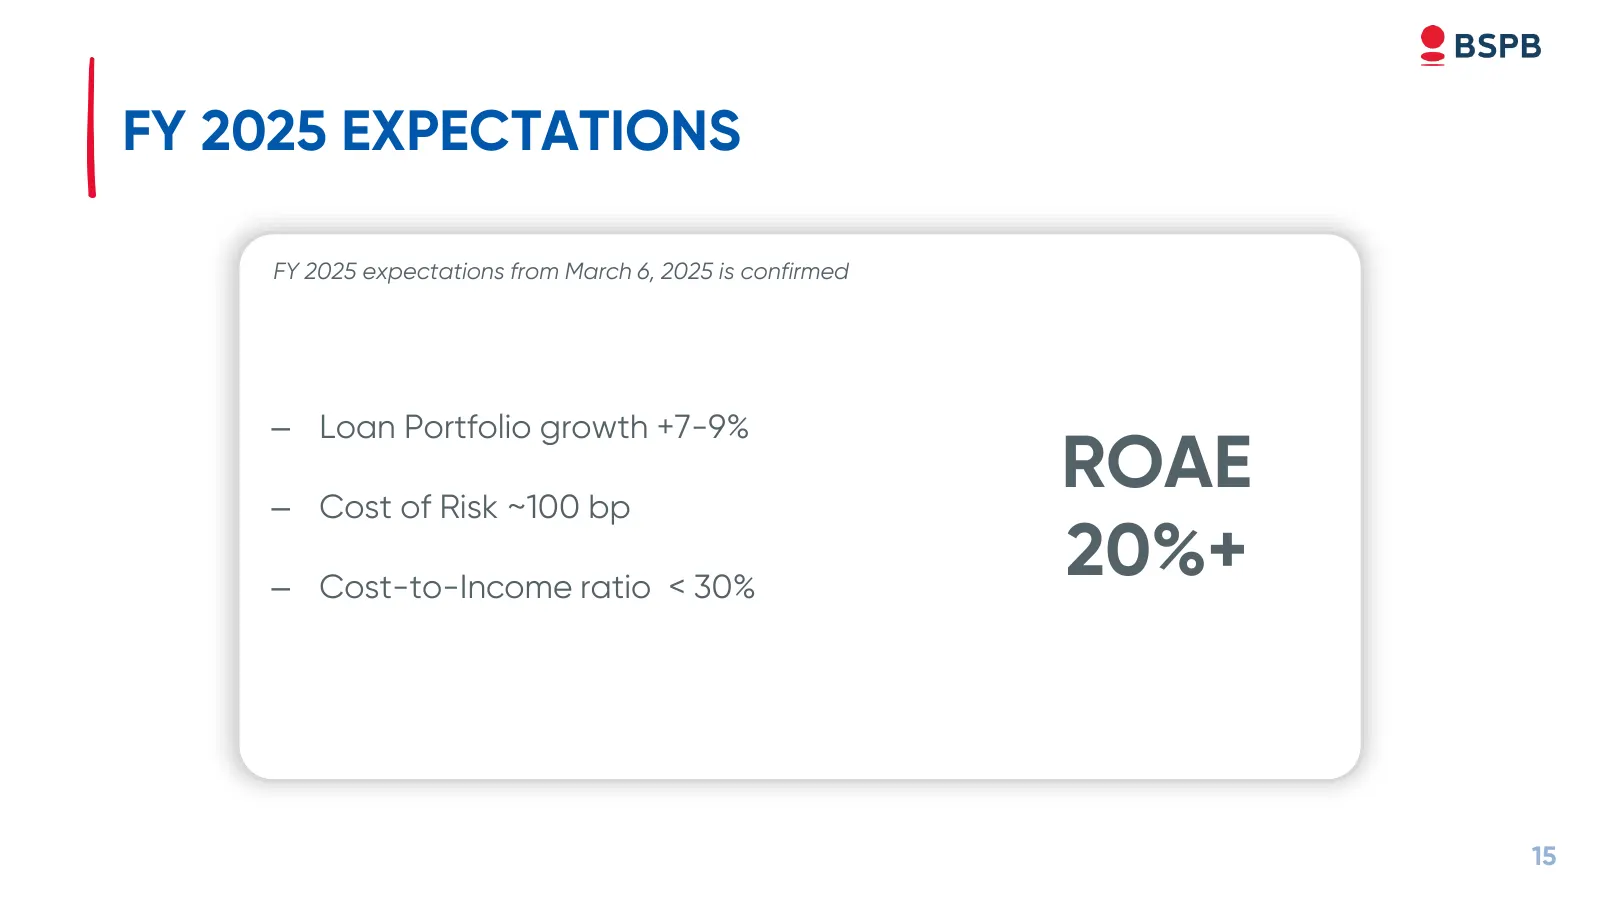
Slide 15: FY 2025 Expectations
FY 2025 EXPECTATIONS FY 2025 expectations from March 6, 2025 is confirmed – Loan Portfolio growth +7-9% – Cost of Risk ~100 bp ROAE – Cost-to-Income ratio < 30% 20%+ 15

Slide 16: Appendix
APPENDIX EE
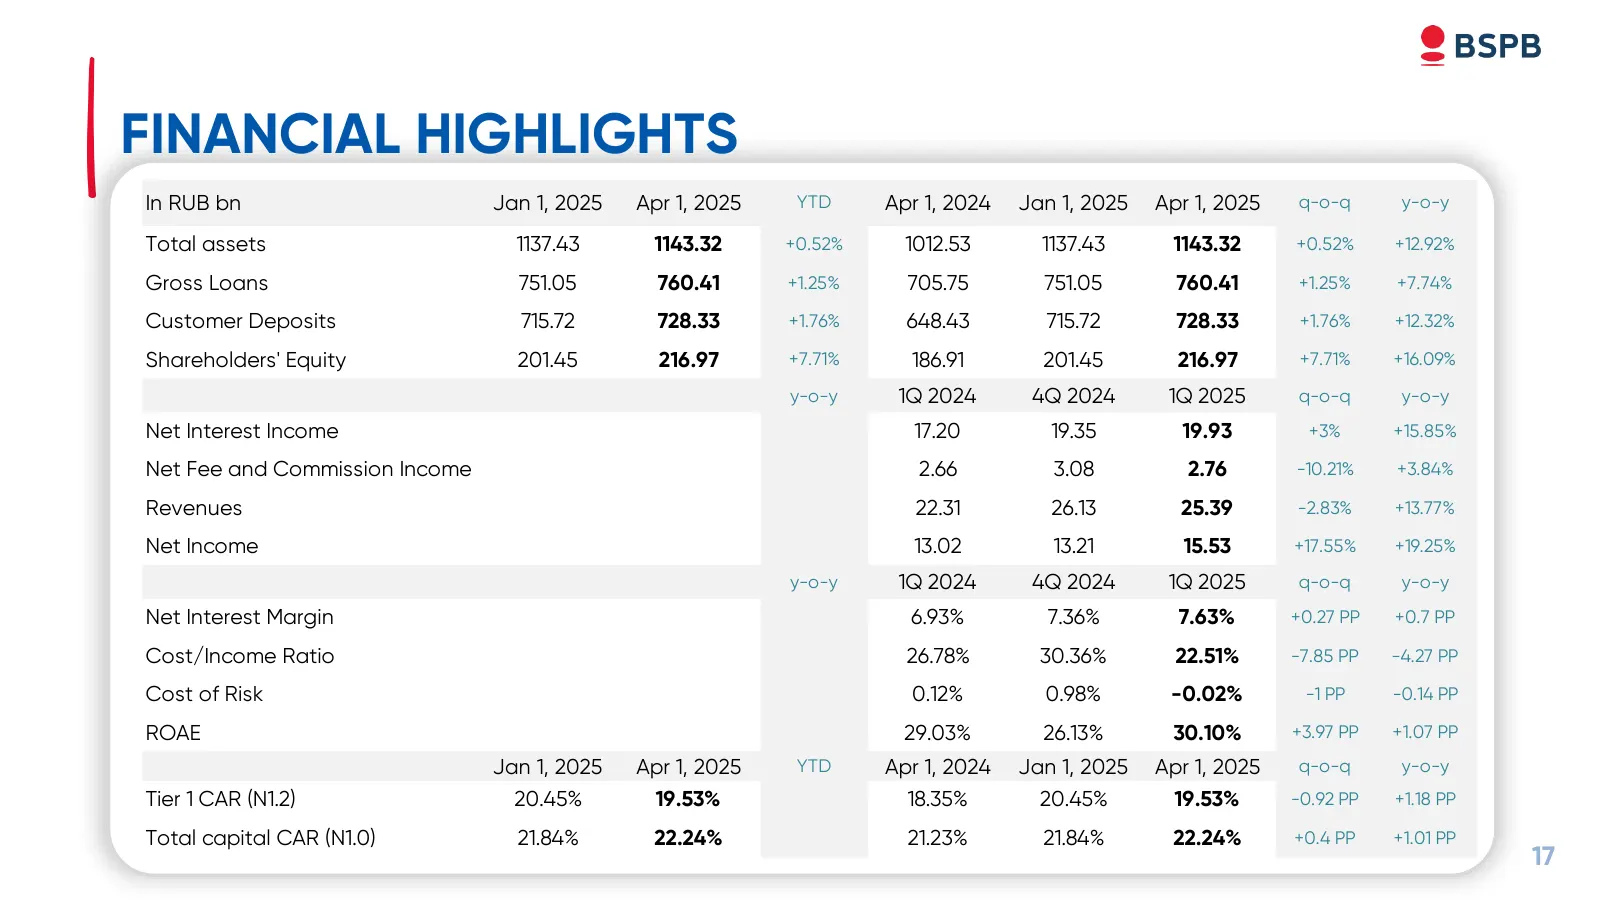
Slide 17: Financial Highlights
FINANCIAL HIGHLIGHTS In RUB bn Jan 1, 2025 Apr 1, 2025 YTD Apr 1, 2024 Jan 1, 2025 Apr 1, 2025 q-o-q y-o-y Total assets 1137.43 1143.32 +0.52% 1012.53 1137.43 1143.32 +0.52% +12.92% Gross Loans 751.05 760.41 +1.25% 705.75 751.05 760.41 +1.25% +7.74% Customer Deposits 715.72 728.33 +1.76% 648.43 715.
Slide 18: Contacts for Investors
CONTACTS FOR INVESTORS Information for investors is available on site: https://www.bspb.ru/en/investors/ Е-mail: ir@bspb.ru Tel.: +7 /812/ 332 78 36 18
Source: company website
More decks from BSP
 Investor Presentation (November 2026)30 slides · November 2026
 Bank Saint Petersburg — Q2 2026 Earnings Presentation18 slides · Aug 21, 2026
 Bank Saint Petersburg — Investor Presentation (August 2026)29 slides · August 2026
 Investor Presentation (August 2026)29 slides · August 2026
 Bank Saint Petersburg — Q1 2026 Earnings Presentation17 slides · May 15, 2026
 Bank Saint Petersburg — FY2025 Earnings Presentation19 slides · Mar 6, 2026