Oaktree Strategic Income Corporation
Oaktree Strategic Income — Q2 2020 Earnings Presentation
16 slides from Oaktree Strategic Income's earnings presentation, May 7, 2020

Slide 1: Second Quarter Fiscal Year 2020 Earnings Presentation
Second Quarter Fiscal Year 2020 Earnings Presentation May 7, 2020 Nasdaq: OCSI Exhibit 99.2
Slide 2: Forward Looking Statements
Forward Looking Statements Some of the statements in this presentation constitute forward-looking statements because they relate to future events or our future performance or financial condition. The forward-looking statements contained in this presentation may include statements as to: our future o
Slide 3: Summary of Results for the Quarter Ended March 31, 2020
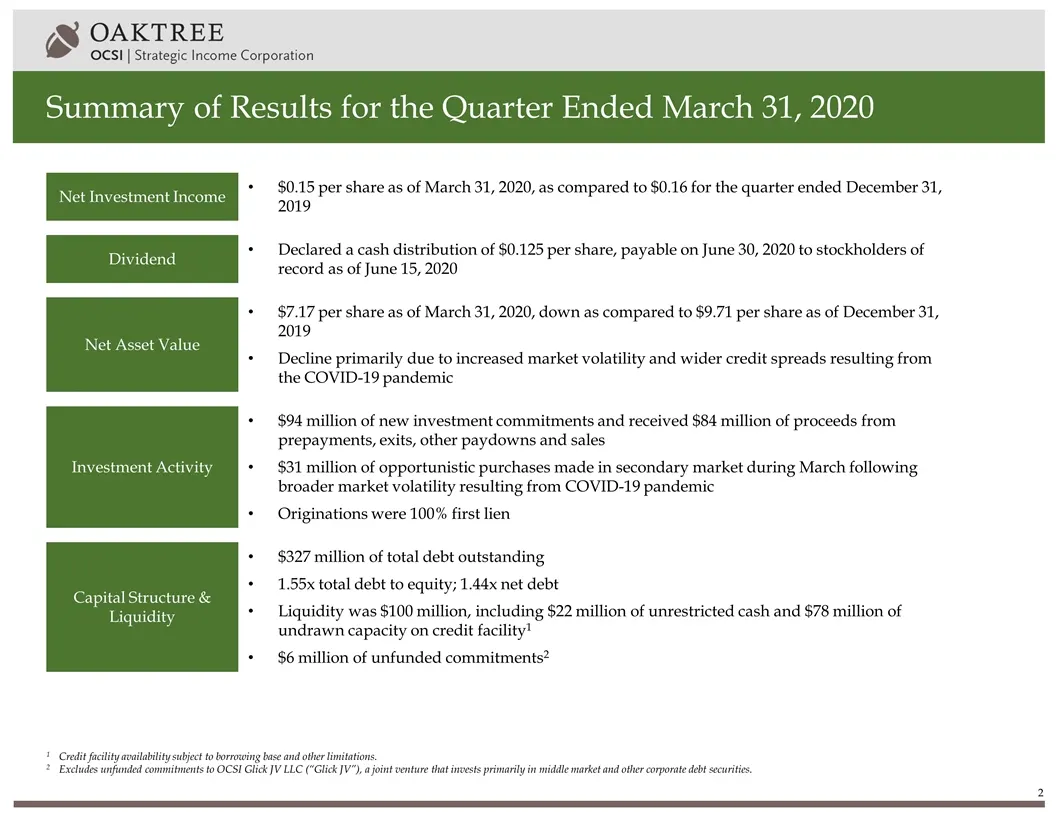
Summary of Results for the Quarter Ended March 31, 2020 Net Investment Income $0.15 per share as of March 31, 2020, as compared to $0.16 for the quarter ended December 31, 2019 Dividend Declared a cash distribution of $0.125 per share, payable on June 30, 2020 to stockholders of record as of June 15
Slide 4: Portfolio Summary
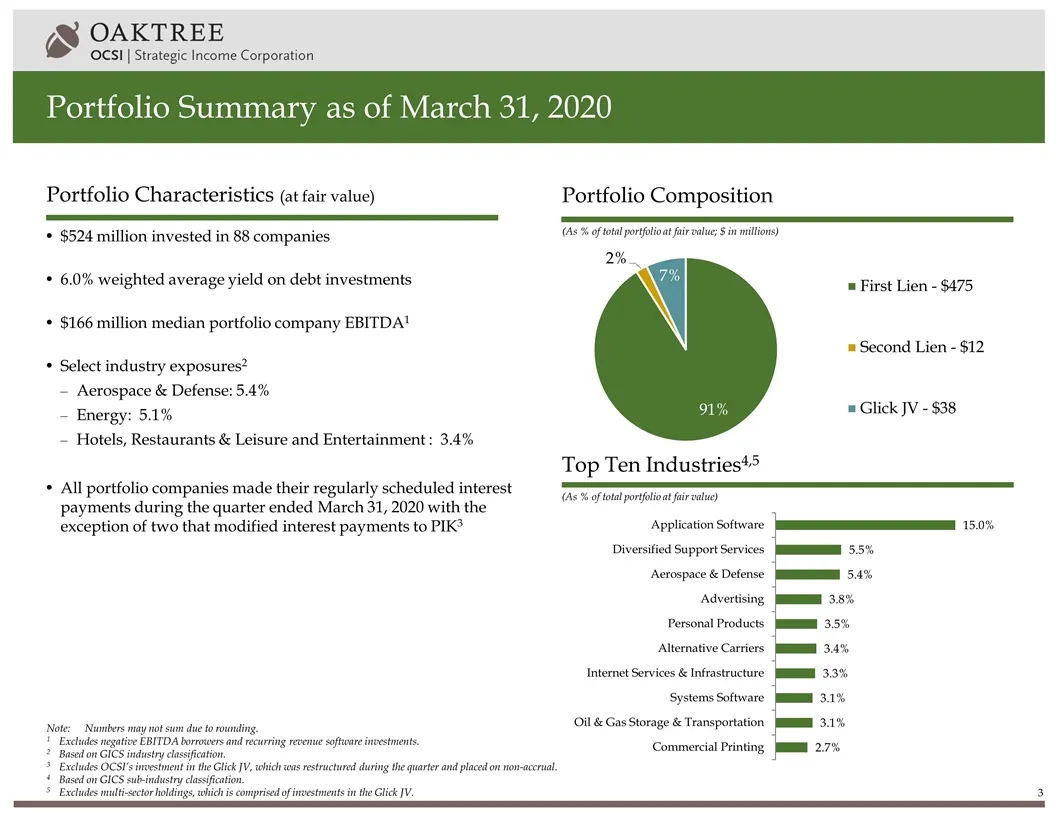
Portfolio Summary as of March 31, 2020 (As % of total portfolio at fair value; $ in millions) (As % of total portfolio at fair value) Portfolio Composition Top Ten Industries4,5 Portfolio Characteristics (at fair value) $524 million invested in 88 companies 6.0% weighted average yield on debt invest
Slide 5: Portfolio Diversity
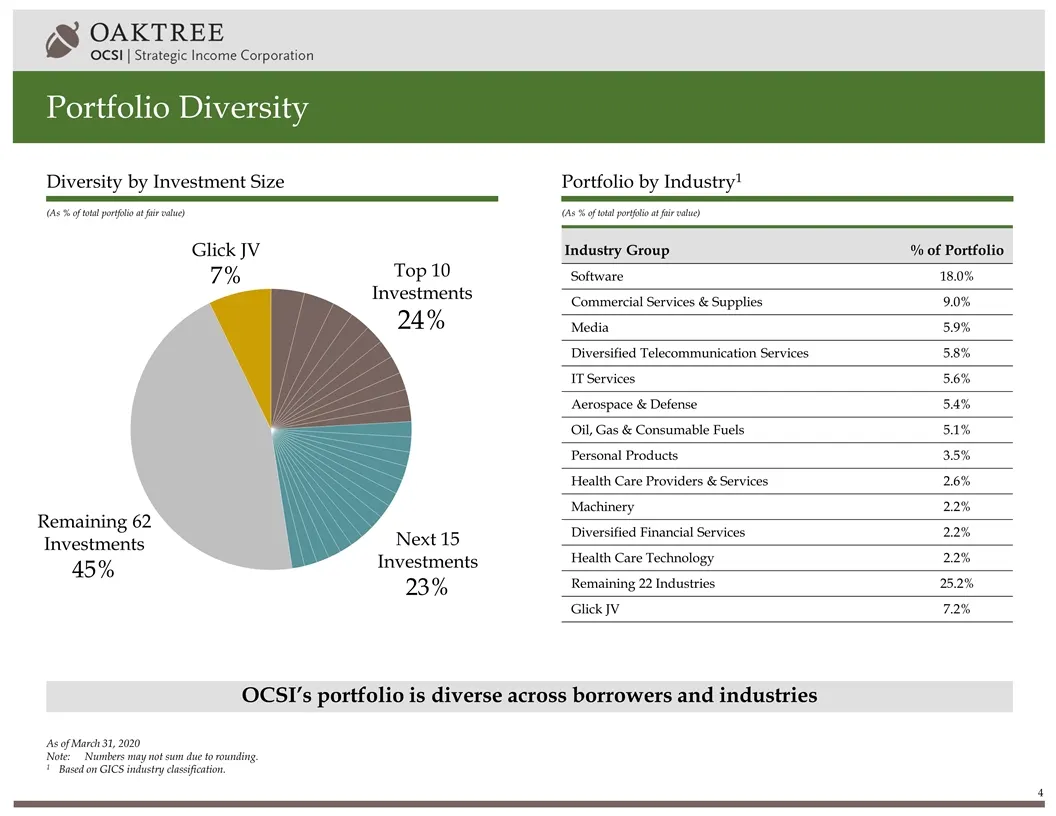
Portfolio Diversity OCSI’s portfolio is diverse across borrowers and industries (As % of total portfolio at fair value) (As % of total portfolio at fair value) Portfolio by Industry1 Diversity by Investment Size Top 10 Investments 24% Next 15 Investments 23% Remaining 62 Investments 45% Glick JV 7%
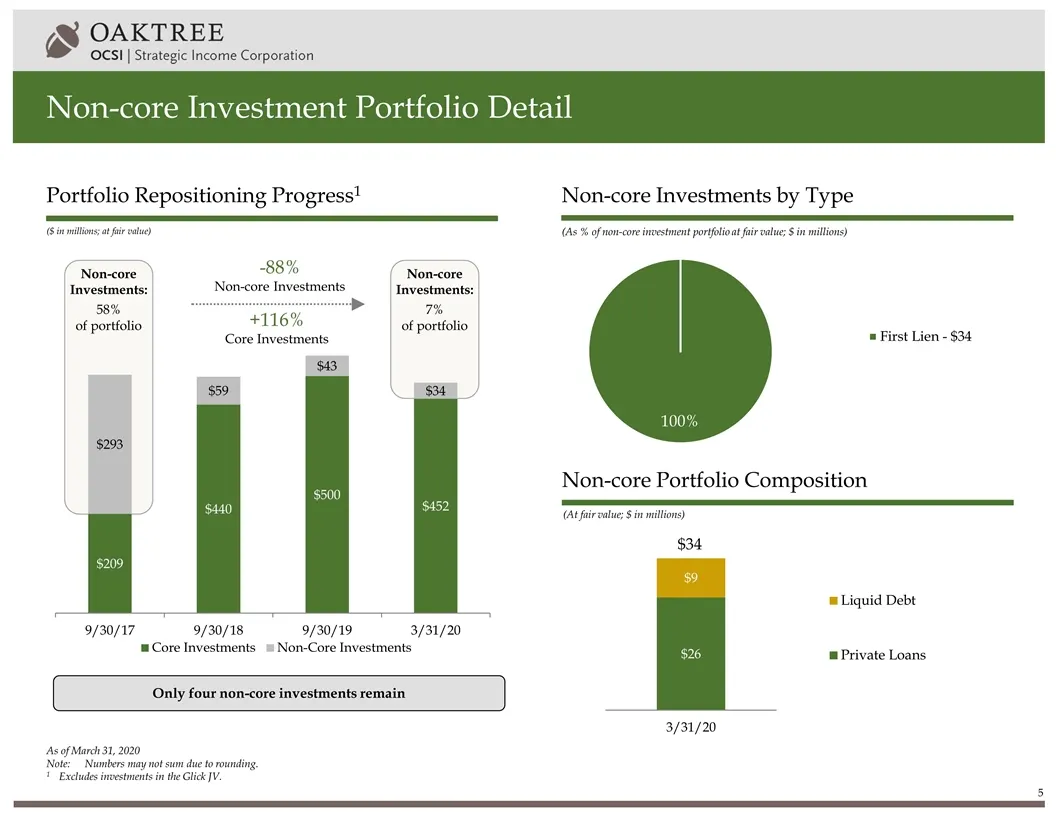
Slide 6: Non-core Investment Portfolio Detail
As of March 31, 2020 Note:Numbers may not sum due to rounding. 1Excludes investments in the Glick JV. Non-core Investment Portfolio Detail Portfolio Repositioning Progress1 (As % of non-core investment portfolio at fair value; $ in millions) Non-core Investments by Type (At fair value; $ in millions
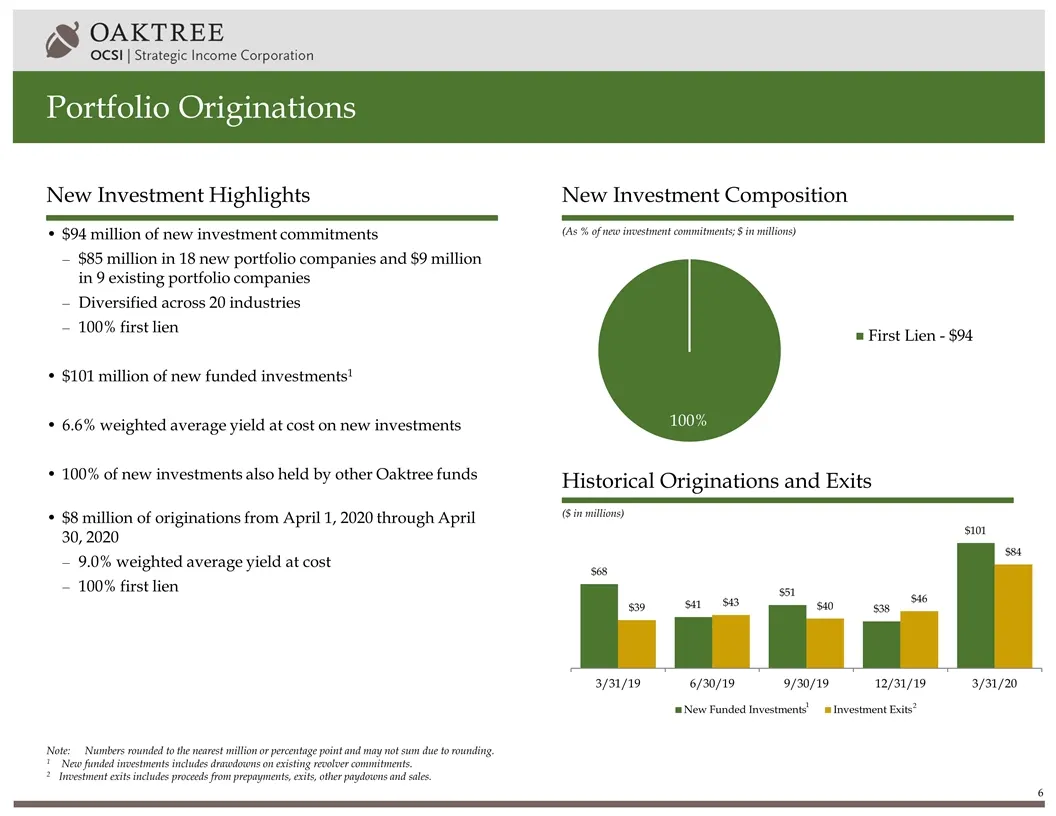
Slide 7: Portfolio Originations
Portfolio Originations $94 million of new investment commitments $85 million in 18 new portfolio companies and $9 million in 9 existing portfolio companies Diversified across 20 industries 100% first lien $101 million of new funded investments1 6.6% weighted average yield at cost on new investments
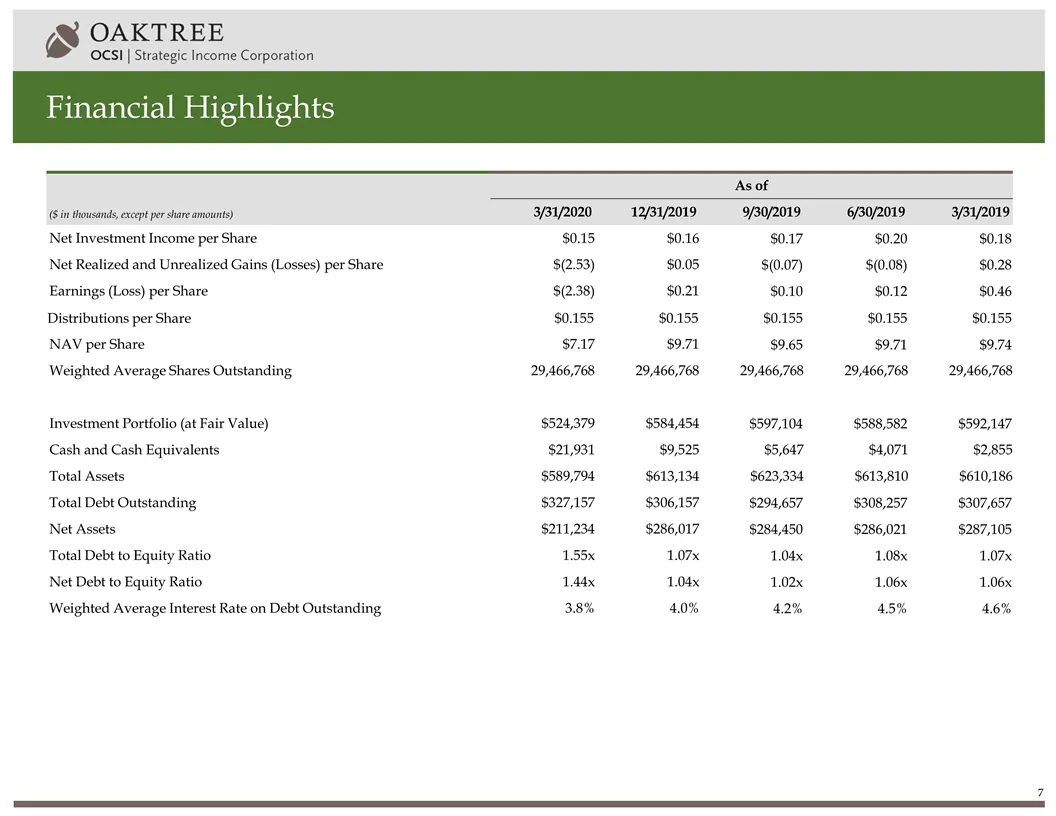
Slide 8: Financial Highlights
Financial Highlights ($ in thousands, except per share amounts) As of 3/31/2020 12/31/2019 9/30/2019 6/30/2019 3/31/2019 Net Investment Income per Share $0.15 $0.16 $0.17 $0.20 $0.18 Net Realized and Unrealized Gains (Losses) per Share $(2.53) $0.05 $(0.07) $(0.08) $0.28 Earnings (Loss) per Share $(
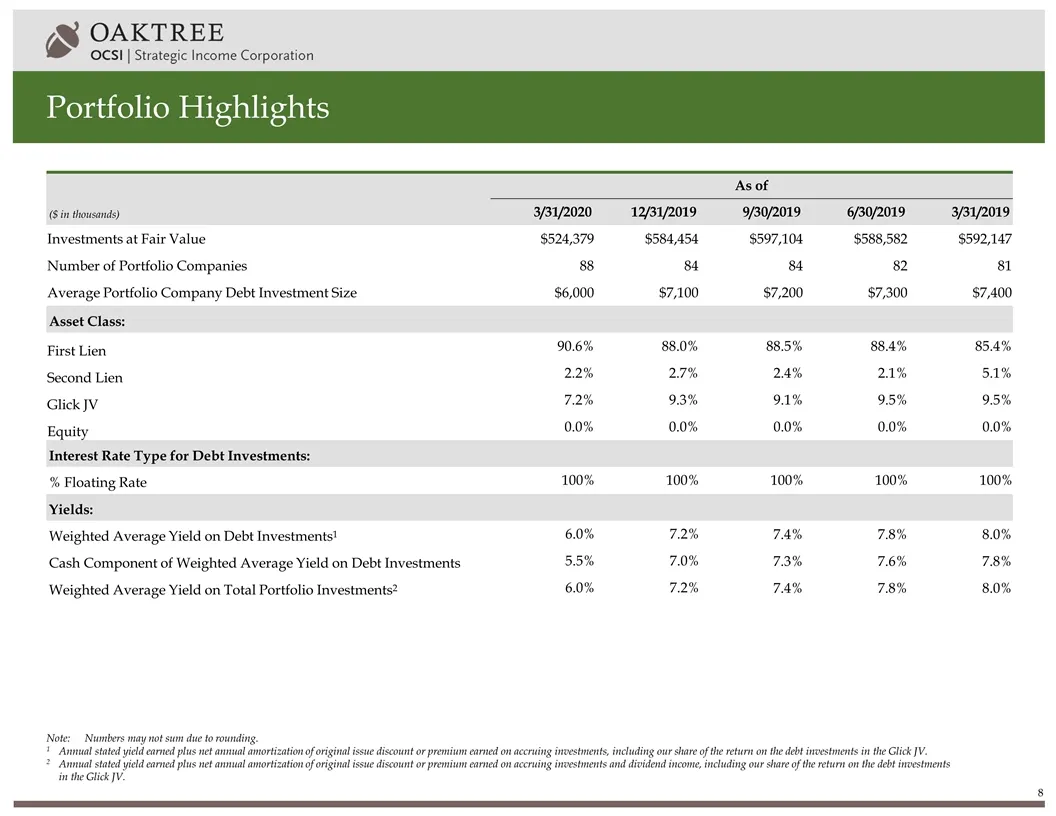
Slide 9: Portfolio Highlights
Portfolio Highlights ($ in thousands) As of 3/31/2020 12/31/2019 9/30/2019 6/30/2019 3/31/2019 Investments at Fair Value $524,379 $584,454 $597,104 $588,582 $592,147 Number of Portfolio Companies 88 84 84 82 81 Average Portfolio Company Debt Investment Size $6,000 $7,100 $7,200 $7,300 $7,400 Asset C
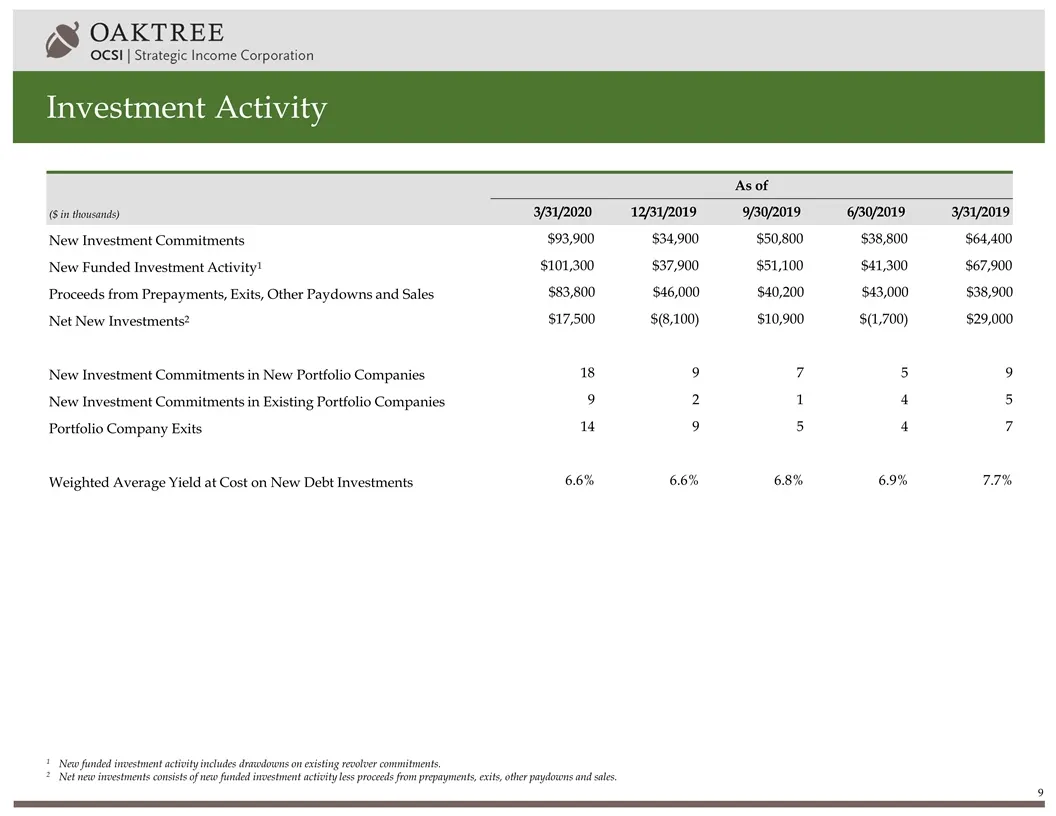
Slide 10: Investment Activity
Investment Activity ($ in thousands) As of 3/31/2020 12/31/2019 9/30/2019 6/30/2019 3/31/2019 New Investment Commitments $93,900 $34,900 $50,800 $38,800 $64,400 New Funded Investment Activity1 $101,300 $37,900 $51,100 $41,300 $67,900 Proceeds from Prepayments, Exits, Other Paydowns and Sales $83,800
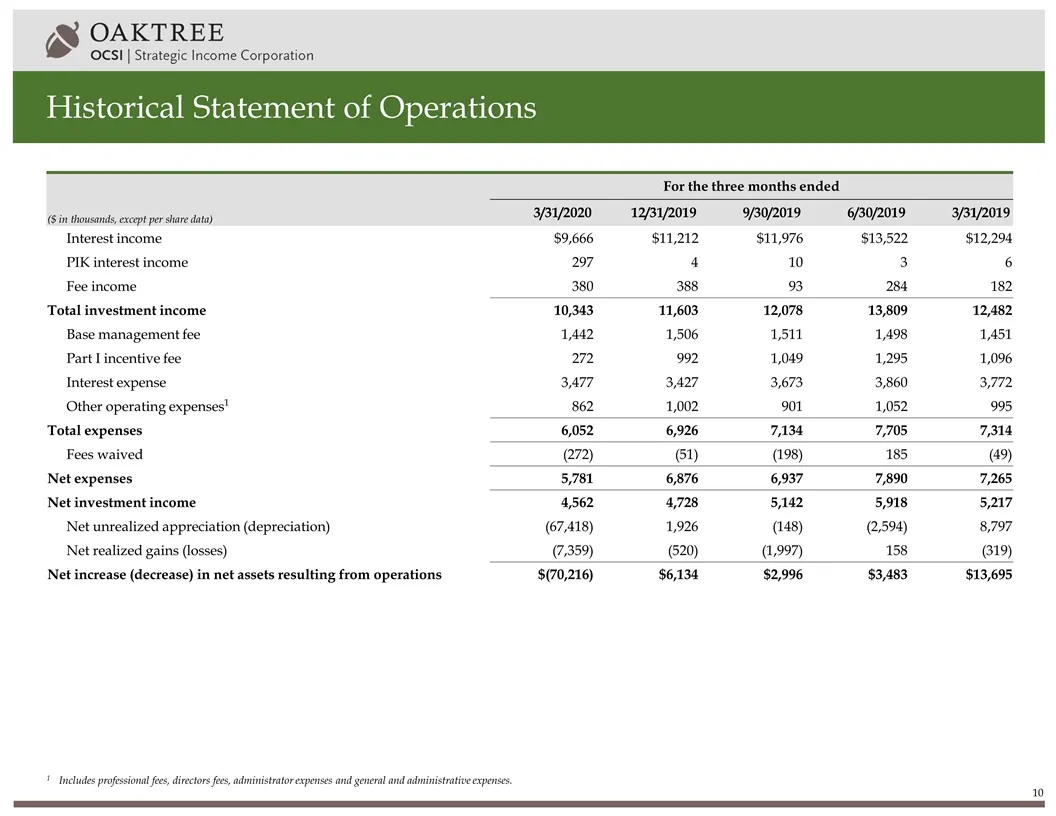
Slide 11: Historical Statement of Operations
Historical Statement of Operations ($ in thousands, except per share data) For the three months ended 3/31/2020 12/31/2019 9/30/2019 6/30/2019 3/31/2019 Interest income $9,666 $11,212 $11,976 $13,522 $12,294 PIK interest income 297 4 10 3 6 Fee income 380 388 93 284 182 Total investment income 10,34
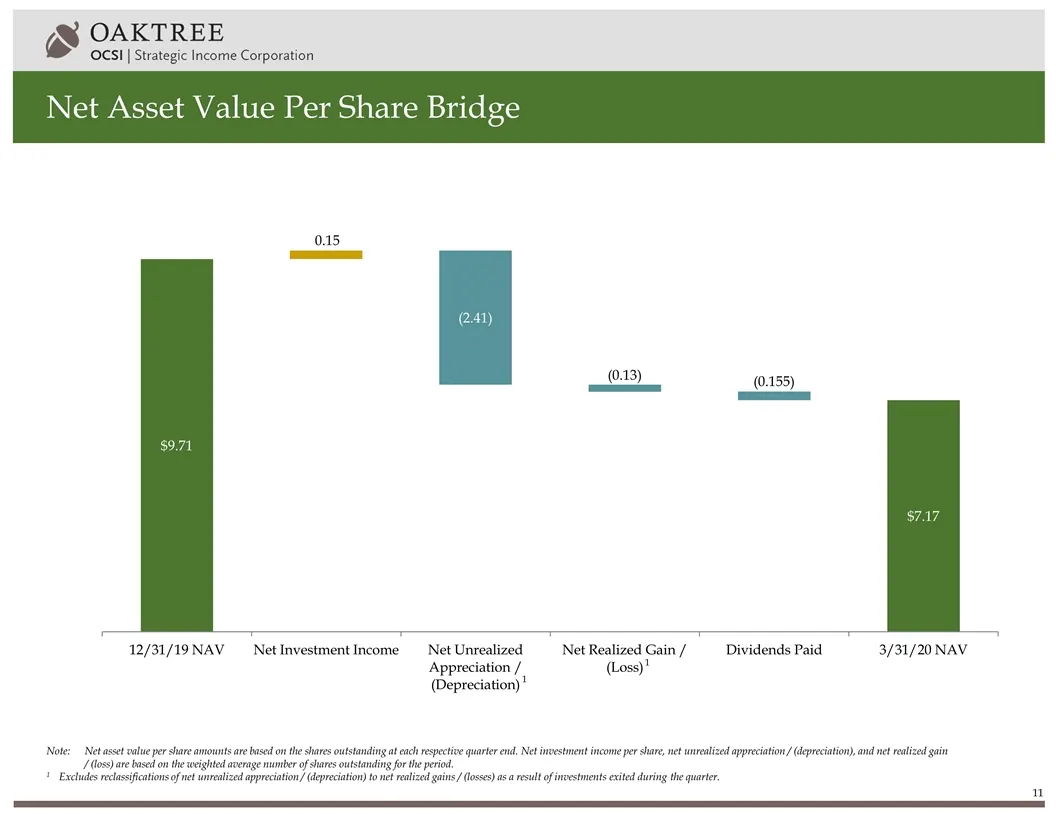
Slide 12: Net Asset Value Per Share Bridge
Net Asset Value Per Share Bridge Note:Net asset value per share amounts are based on the shares outstanding at each respective quarter end. Net investment income per share, net unrealized appreciation / (depreciation), and net realized gain / (loss) are based on the weighted average number of shares
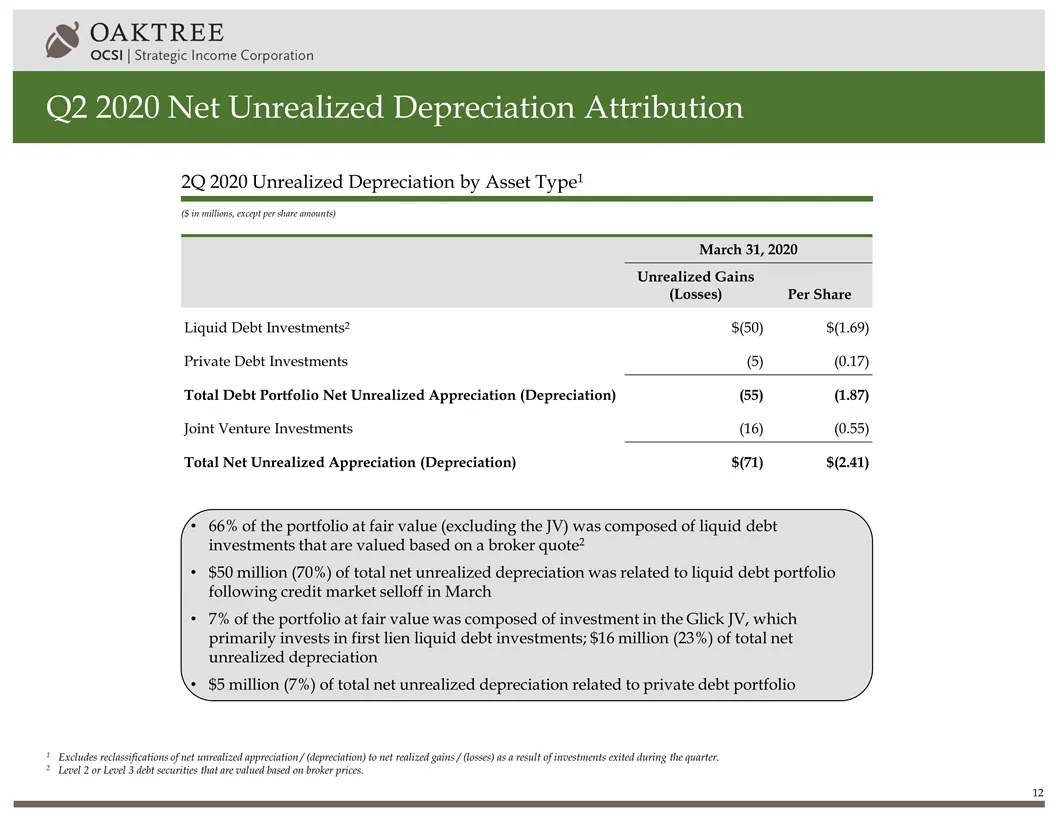
Slide 13: Q2 2020 Net Unrealized Depreciation Attribution
Q2 2020 Net Unrealized Depreciation Attribution ($ in millions, except per share amounts) 2Q 2020 Unrealized Depreciation by Asset Type1 March 31, 2020 Unrealized Gains (Losses) Per Share Liquid Debt Investments2 $(50) $(1.69) Private Debt Investments (5) (0.17) Total Debt Portfolio Net Unrealized A
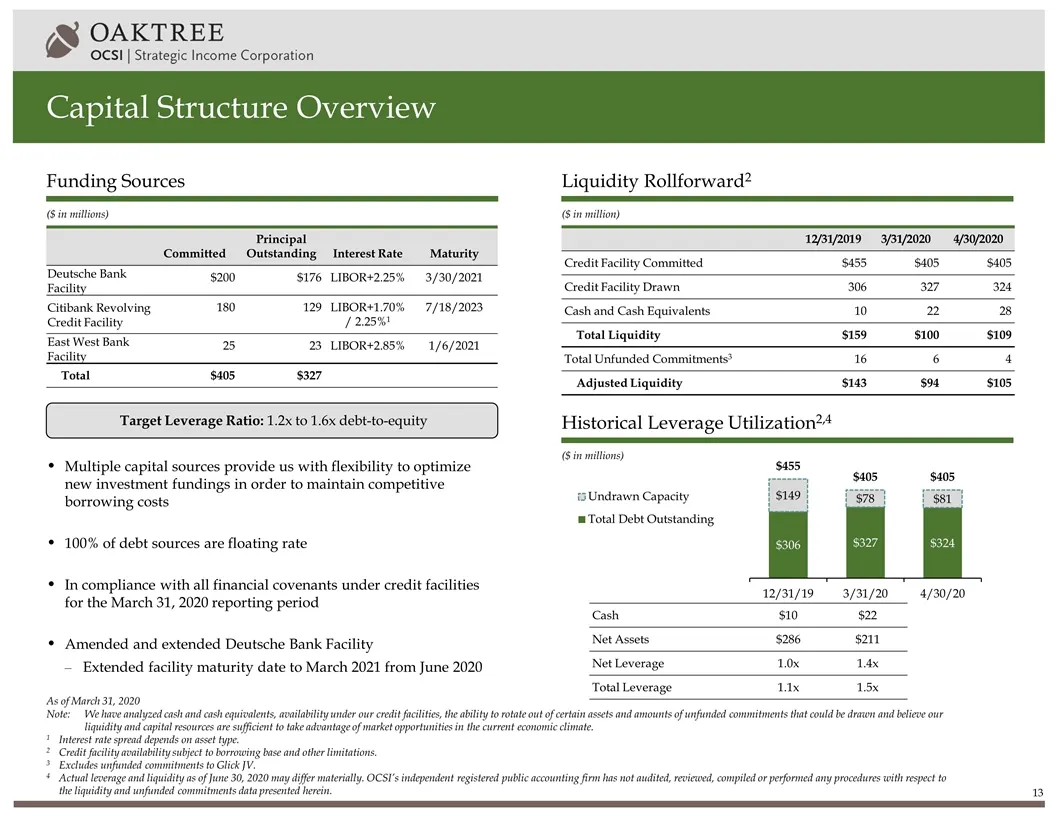
Slide 14: Capital Structure Overview
Capital Structure Overview ($ in millions) ($ in million) ($ in millions) Funding Sources Liquidity Rollforward2 Historical Leverage Utilization2,4 Committed Principal Outstanding Interest Rate Maturity Deutsche Bank Facility $200 $176 LIBOR+2.25% 3/30/2021 Citibank Revolving Credit Facility 180 129
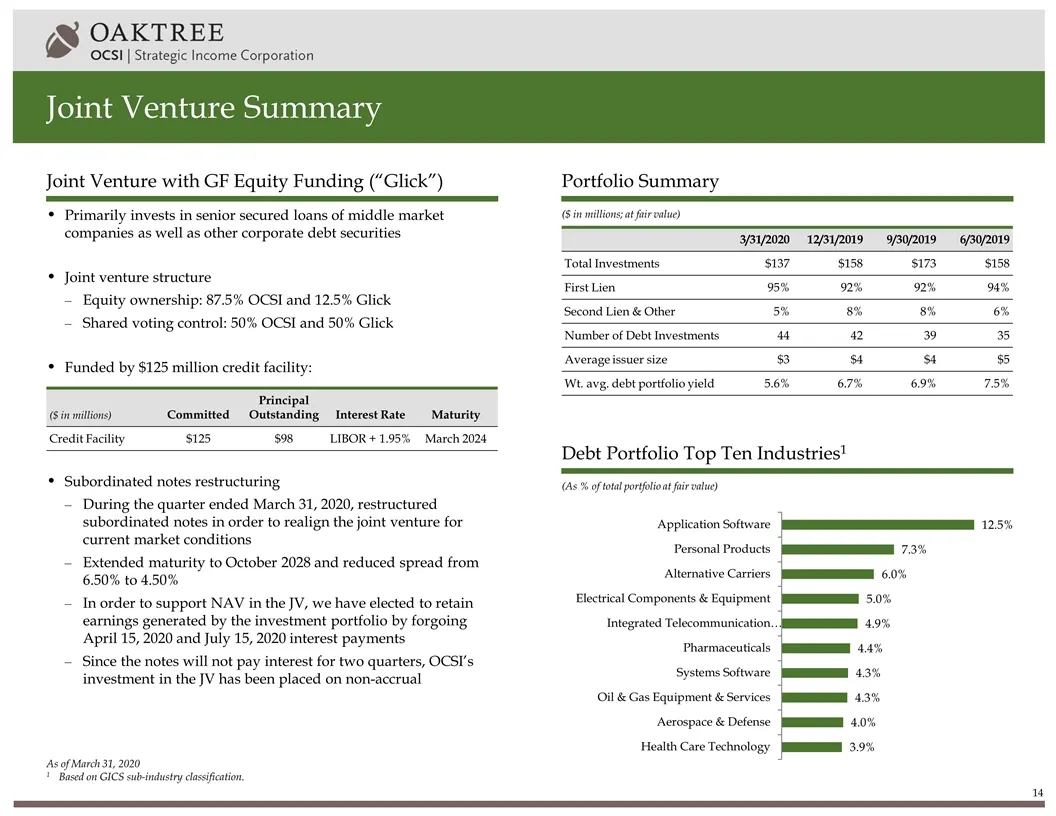
Slide 15: Joint Venture Summary
Joint Venture Summary ($ in millions; at fair value) (As % of total portfolio at fair value) Joint Venture with GF Equity Funding (“Glick”) Portfolio Summary Debt Portfolio Top Ten Industries1 As of March 31, 2020 1Based on GICS sub-industry classification. Primarily invests in senior secured loans

Slide 16: Contact: Investor Relations
Contact: Michael Mosticchio, Investor Relations ocsi-ir@oaktreecapital.com
Source: SEC EDGAR · 8-K filed May 7, 2020
More decks from Oaktree Strategic Income Corporation
 Q1 2021 Earnings Presentation28 slides · Feb 17, 2021
 Q1 2021 Earnings Presentation33 slides · Feb 17, 2021
 Q1 FY2021 Earnings Presentation19 slides · Feb 4, 2021
 Q1 FY2021 Earnings Presentation23 slides · Feb 4, 2021
 Merger or Acquisition (December 2020)27 slides · Dec 8, 2020
 Q4 2020 Earnings Presentation34 slides · Dec 8, 2020