Quest Resource Holding Corporation · NASDAQ:QRHC
Quest Resource — Investor Presentation (June 2022)
30 slides from Quest Resource's investor presentation, June 2022
Slide 1: Investor Presentation
I N V E S T O R P R E S E N TAT I O N Quest Resource Holding Corporation (NASDAQ: QRHC) June 2022 NATIONAL PROVIDER OF WASTE & RECYCLING SOLUTIONS © 2022 Quest Resource Holding Corporation. Copying, publication or redistribution outside of Quest is strictly prohibited.
Slide 2: SEC Safe Harbor
SEC SAFE HARBOR The statements contained in this Investor Presentation that are not purely historical are forward-looking statements within the meaning of Section 27A of the Securities Act of 1933, as amended, and Section 21E of the Securities Exchange Act of 1934, as amended. All statements other t
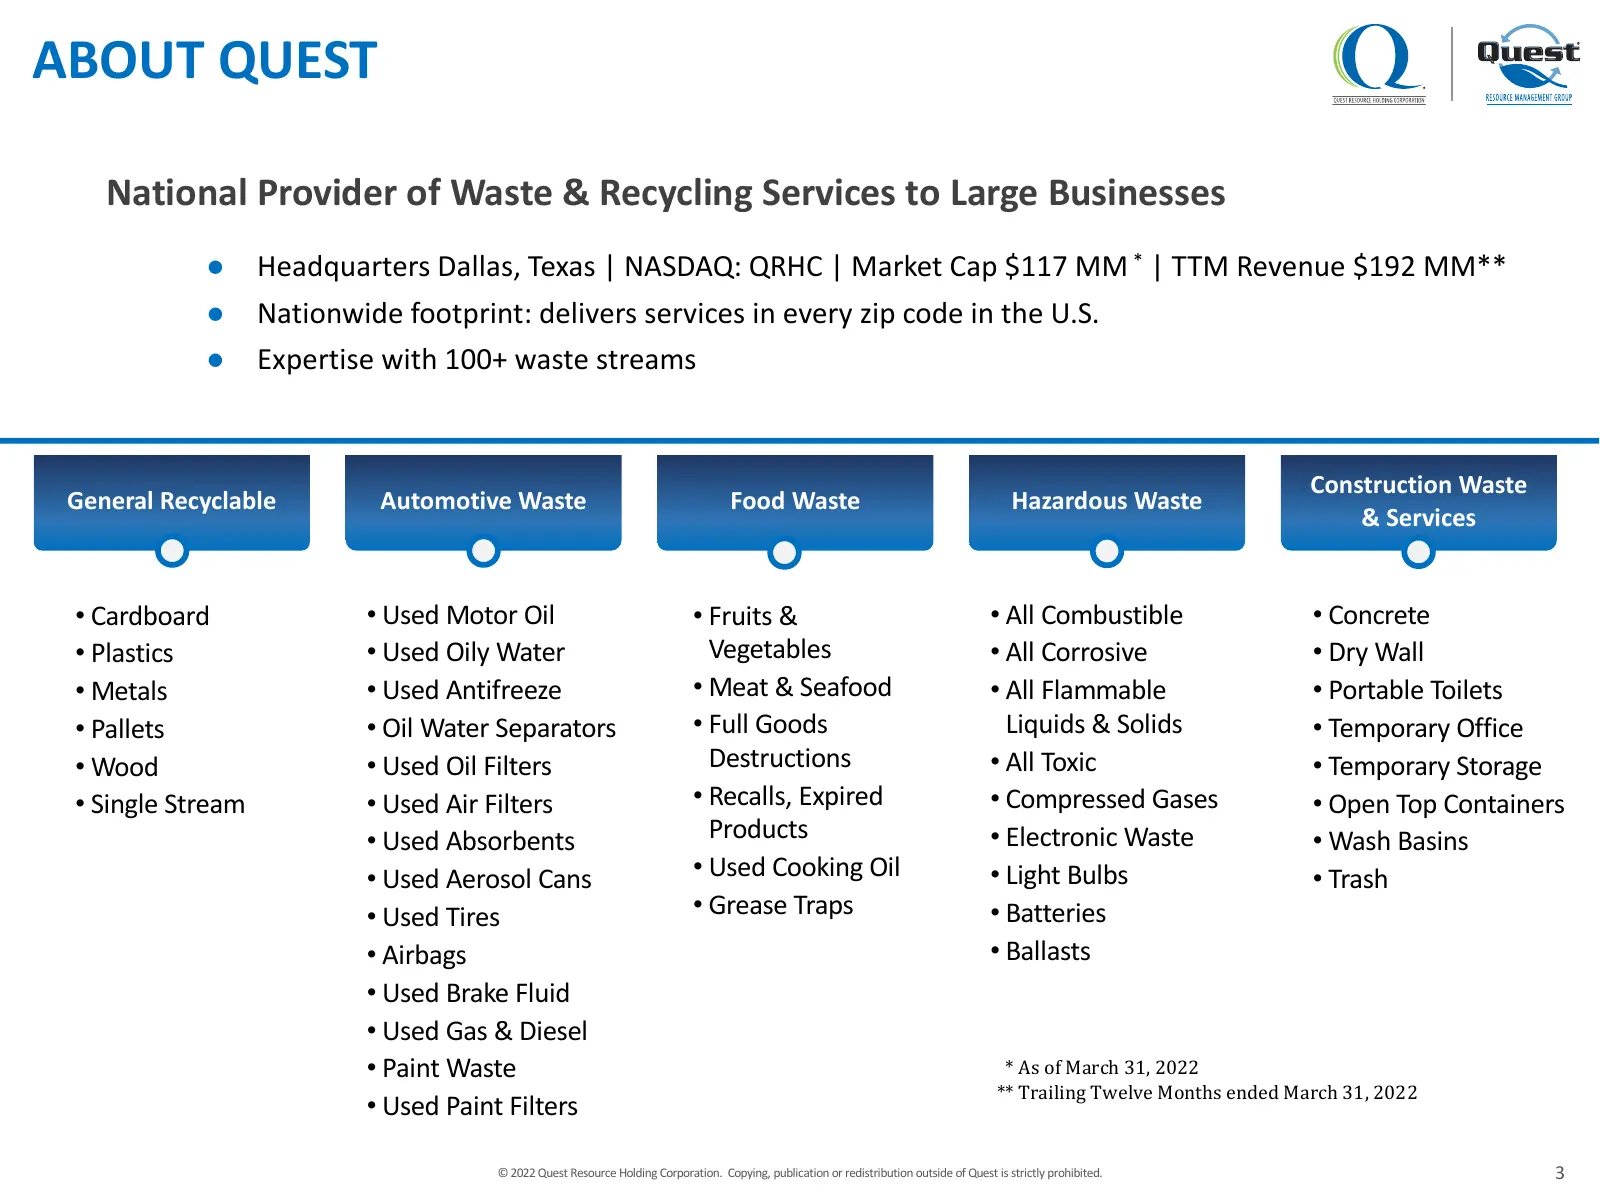
Slide 3: About Quest
ABOUT QUEST National Provider of Waste & Recycling Services to Large Businesses ● Headquarters Dallas, Texas | NASDAQ: QRHC | Market Cap $117 MM * | TTM Revenue $192 MM** ● Nationwide footprint: delivers services in every zip code in the U.S. ● Expertise with 100+ waste streams Construction Waste Ge
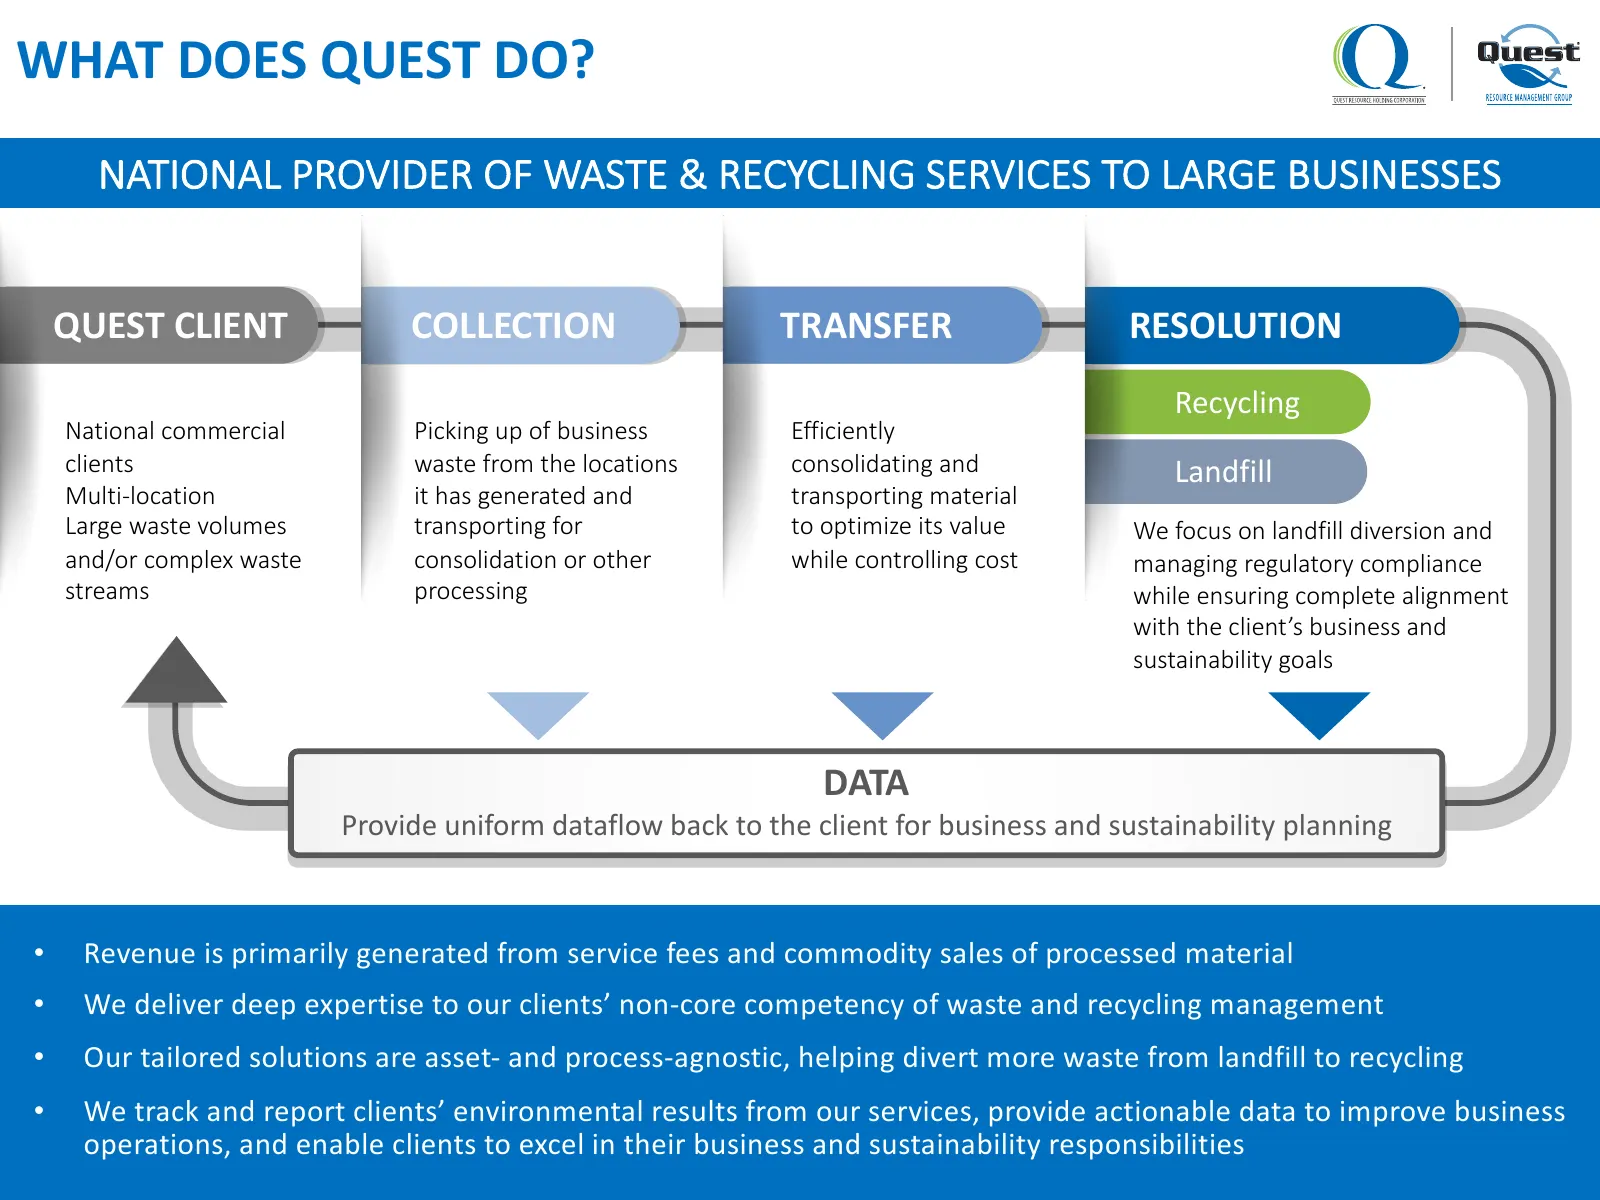
Slide 4: What Does Quest Do?
WHAT DOES QUEST DO? NATIONAL PROVIDER OF WASTE & RECYCLING SERVICES TO LARGE BUSINESSES QUEST CLIENT COLLECTION TRANSFER RESOLUTION Recycling National commercial Picking up of business Efficiently clients waste from the locations consolidating and Landfill Multi-location it has generated and transpo
Slide 5: Stable, Scalable Platform with Attractive Industry Dynamics and Financial Characteristics
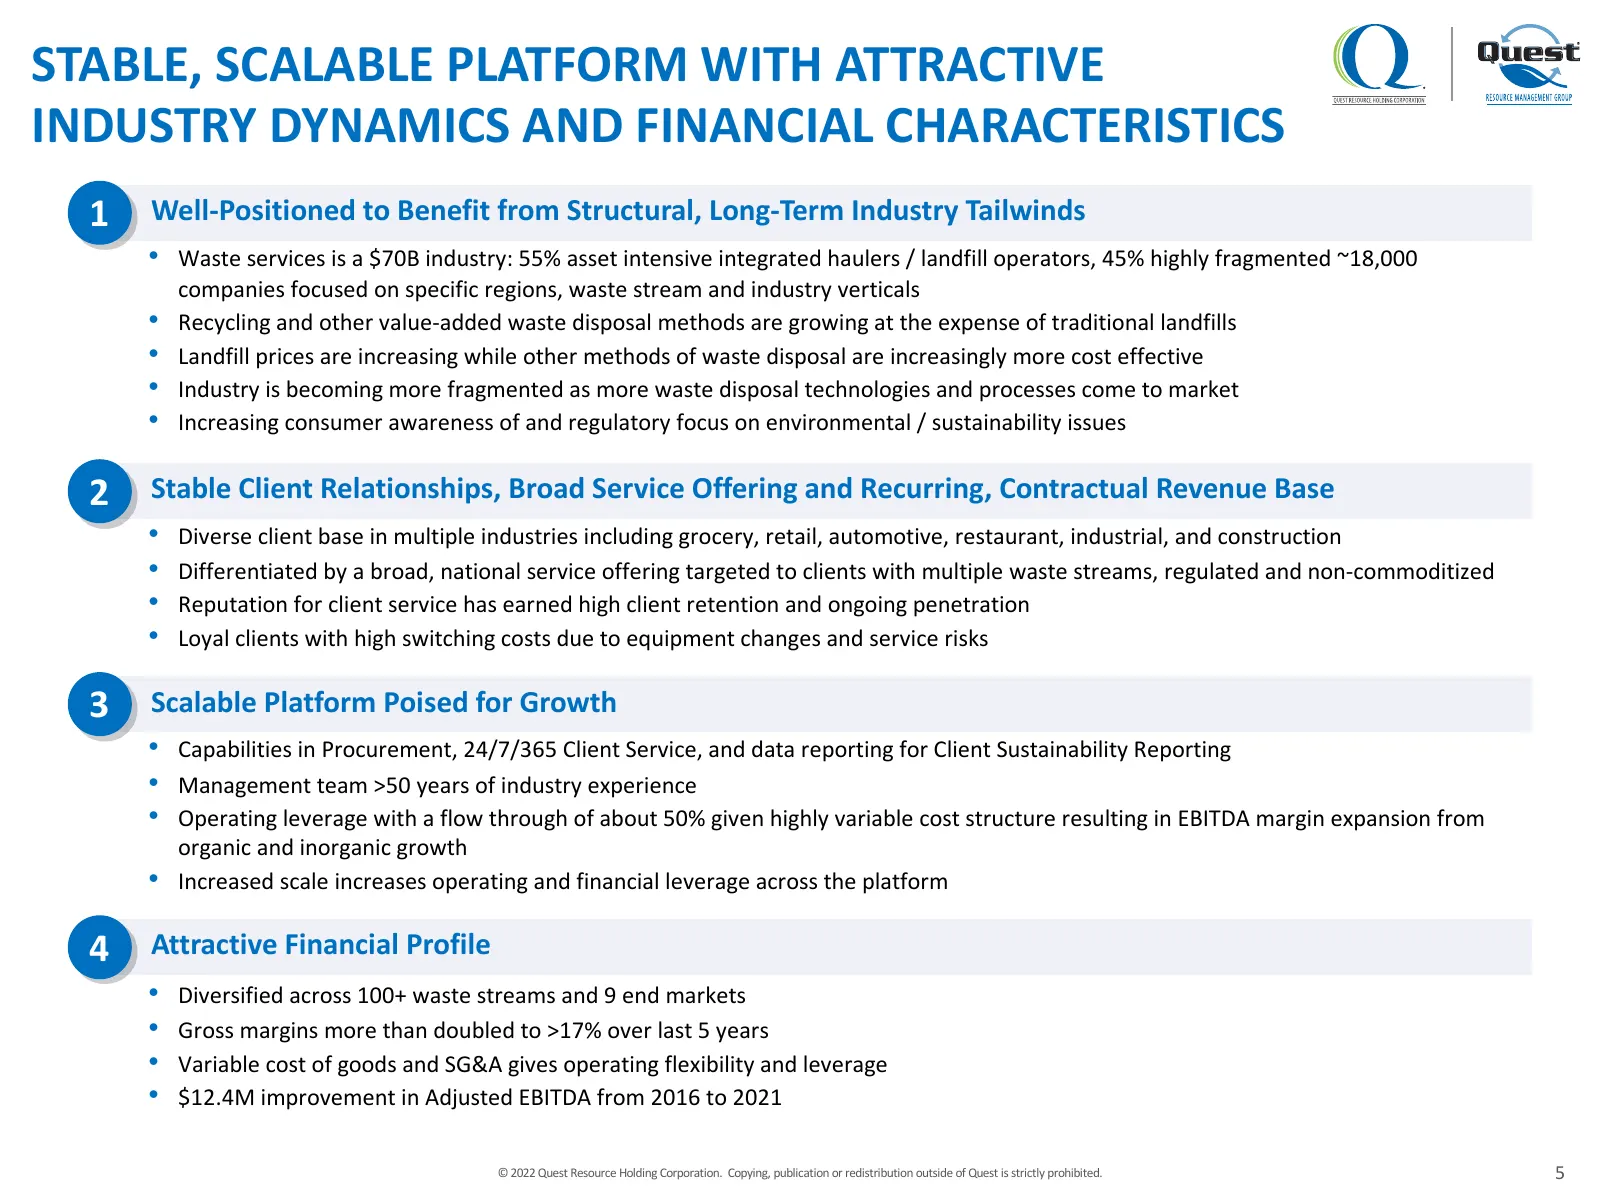
STABLE, SCALABLE PLATFORM WITH ATTRACTIVE INDUSTRY DYNAMICS AND FINANCIAL CHARACTERISTICS 1 Well-Positioned to Benefit from Structural, Long-Term Industry Tailwinds • Waste services is a $70B industry: 55% asset intensive integrated haulers / landfill operators, 45% highly fragmented ~18,000 compani
Slide 6: Focus on Large Clients with Complex Waste Streams
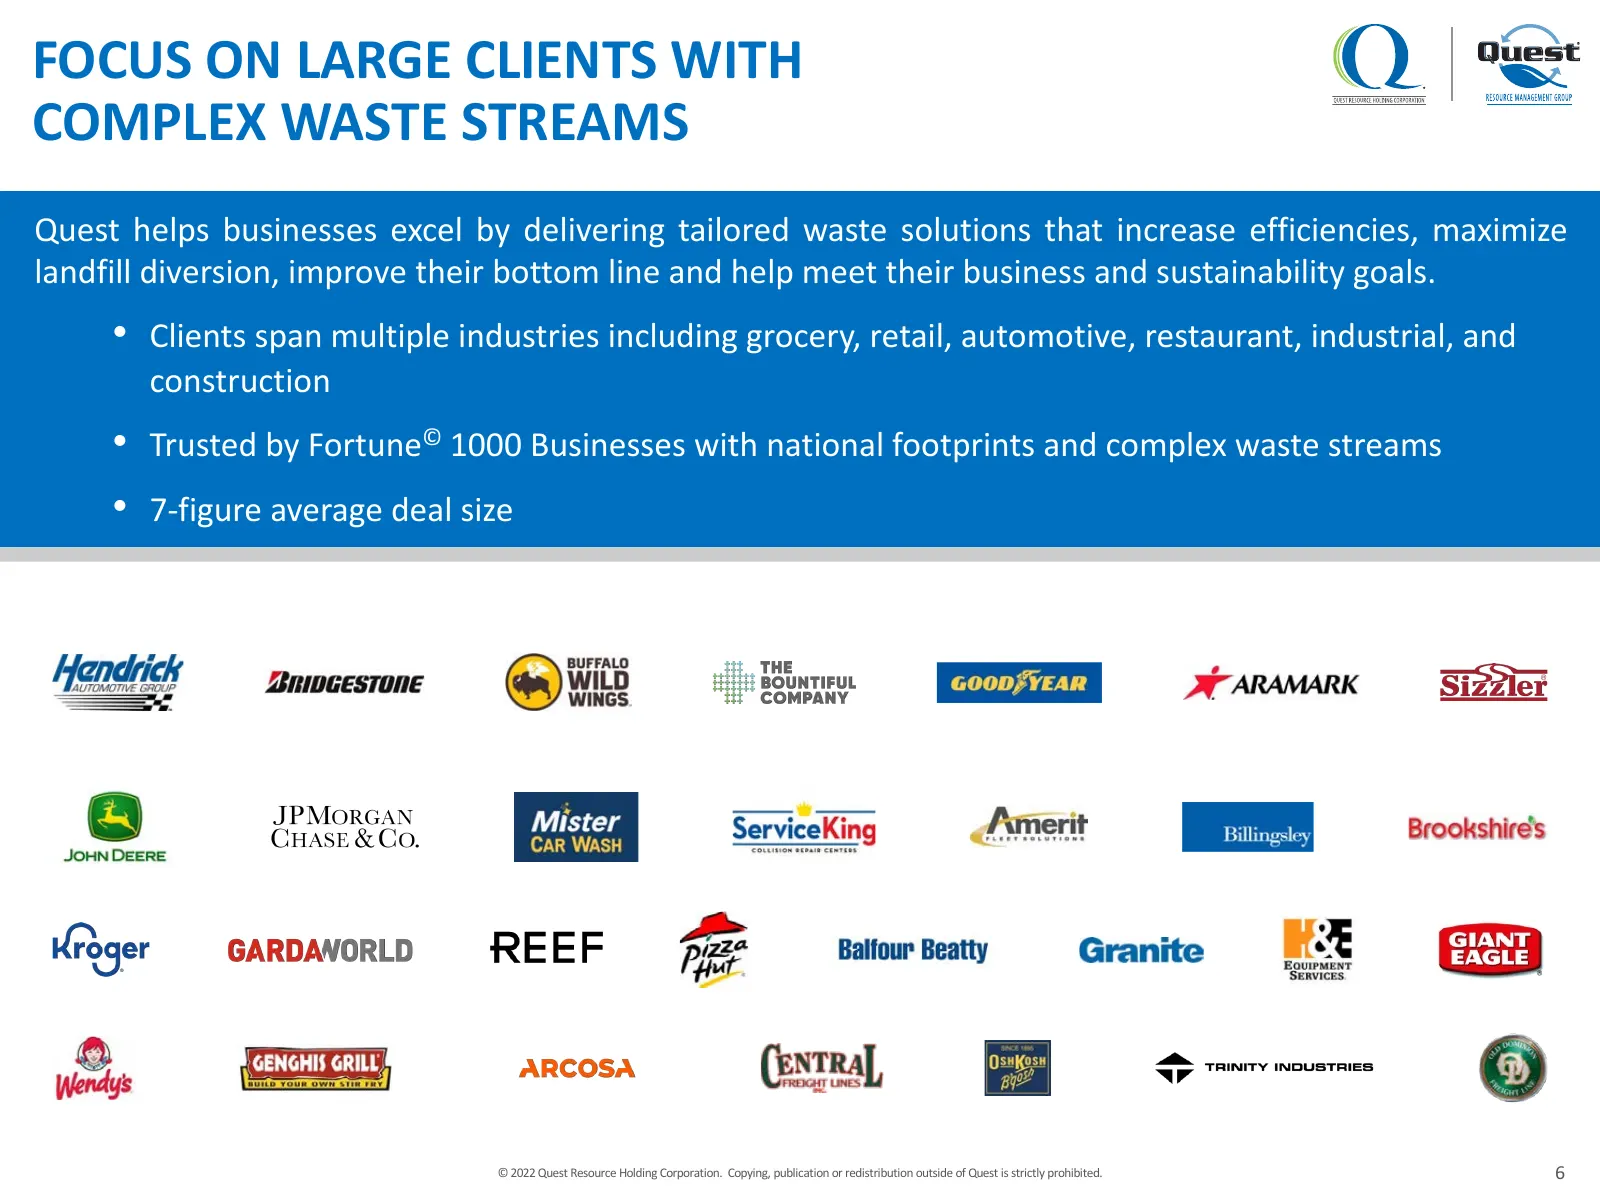
FOCUS ON LARGE CLIENTS WITH COMPLEX WASTE STREAMS Quest helps businesses excel by delivering tailored waste solutions that increase efficiencies, maximize landfill diversion, improve their bottom line and help meet their business and sustainability goals. • Clients span multiple industries including
Slide 7: Quest's Value Proposition
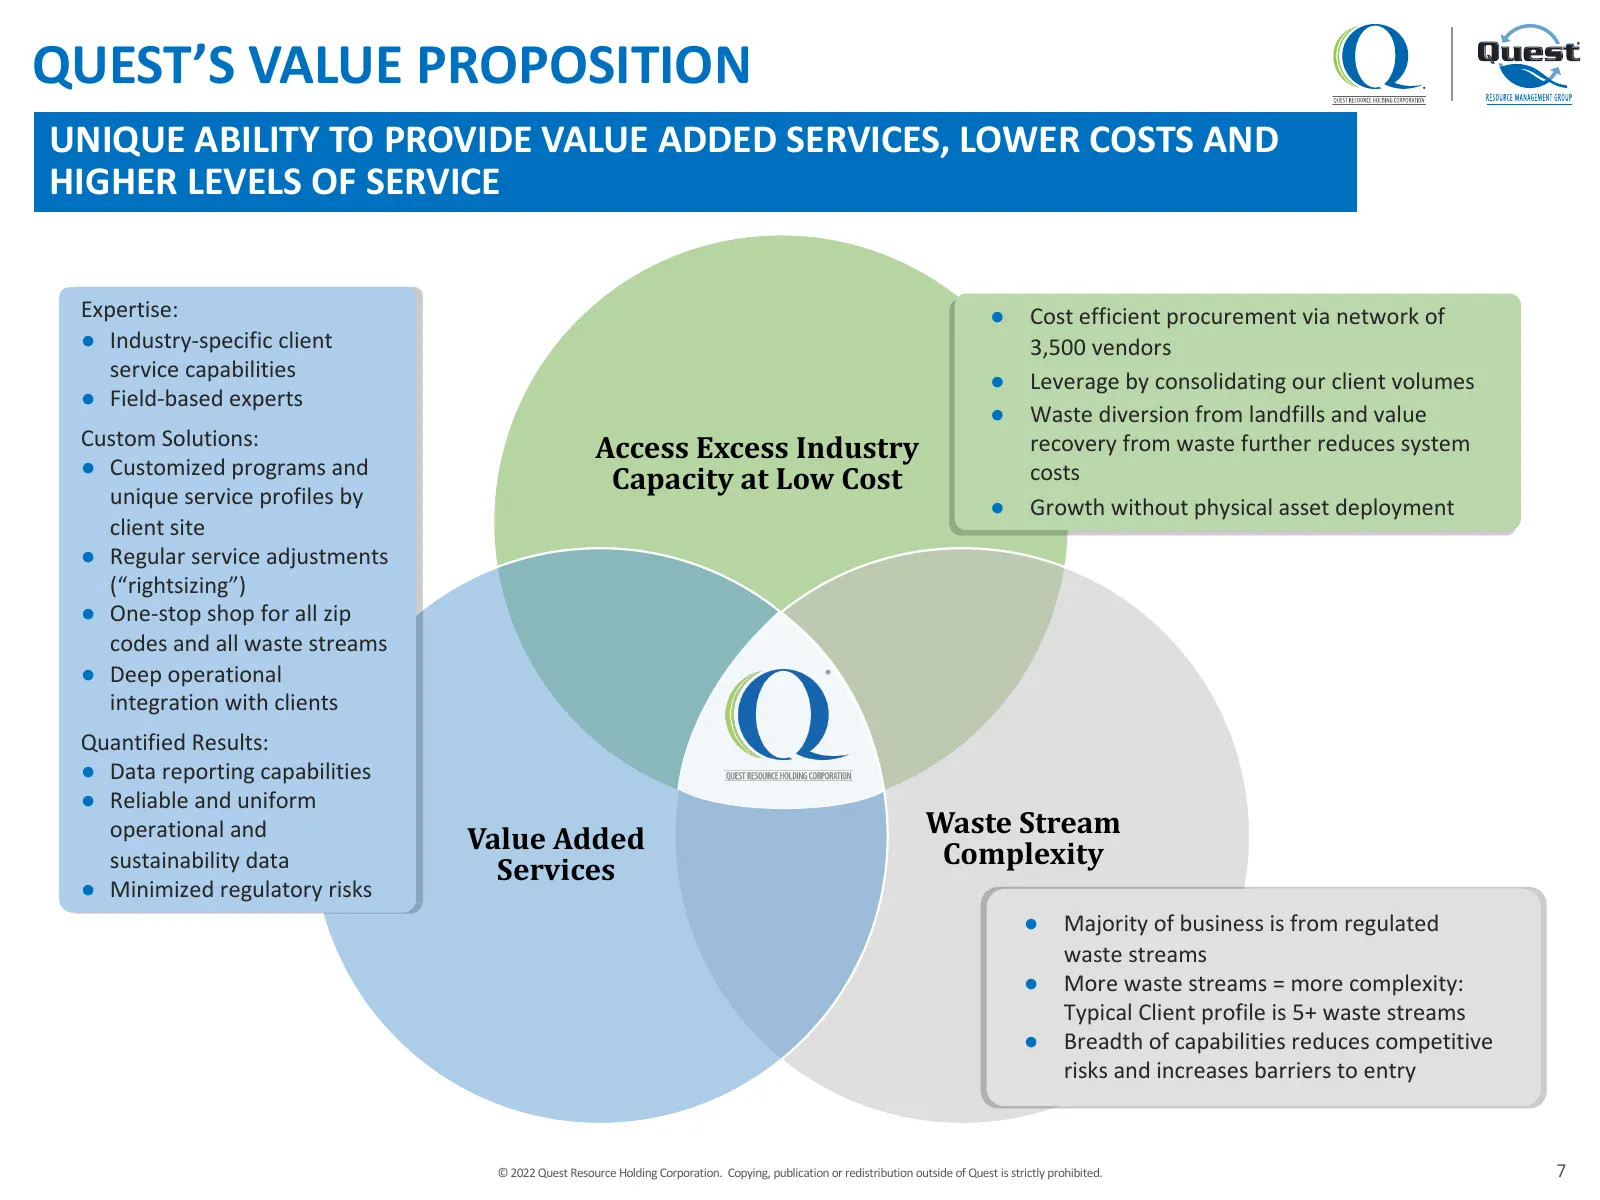
QUEST’S VALUE PROPOSITION UNIQUE ABILITY TO PROVIDE VALUE ADDED SERVICES, LOWER COSTS AND HIGHER LEVELS OF SERVICE Expertise: ● Cost efficient procurement via network of ● Industry-specific client 3,500 vendors service capabilities ● Leverage by consolidating our client volumes ● Field-based experts
Slide 8: National Asset-Light Model and Robust Vendor Network
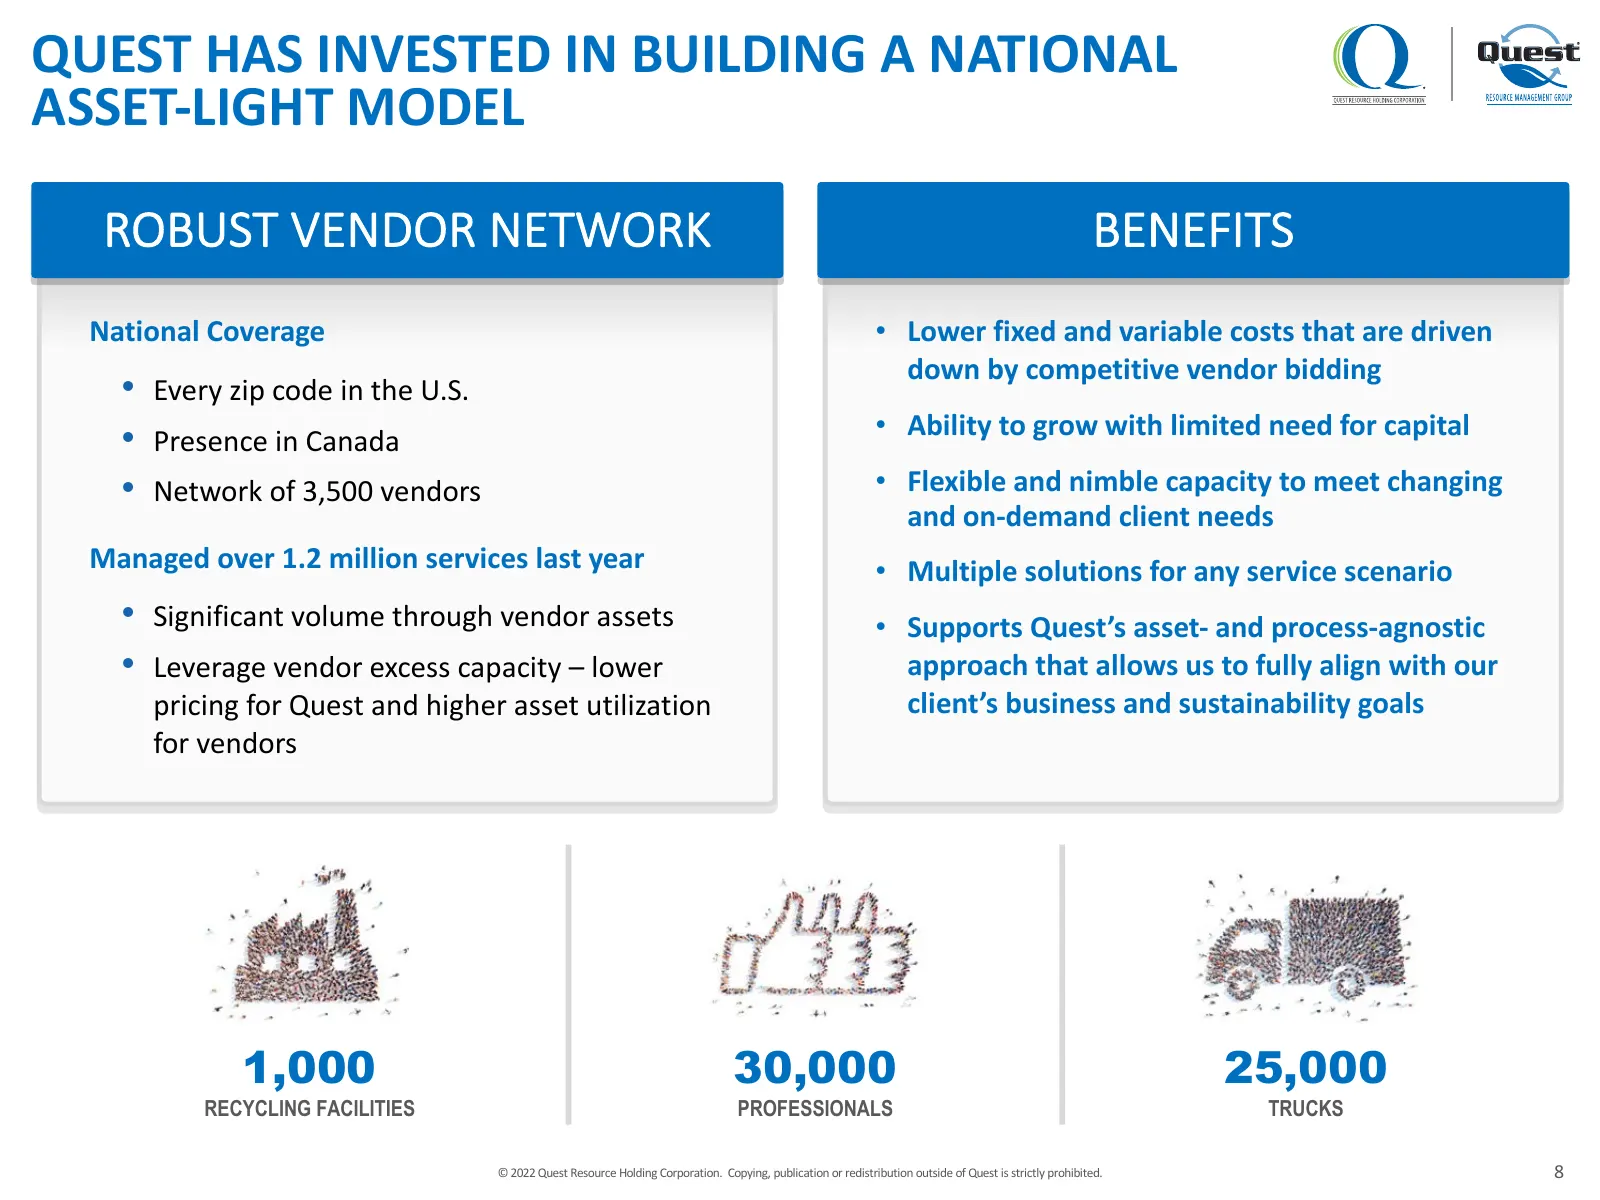
QUEST HAS INVESTED IN BUILDING A NATIONAL ASSET-LIGHT MODEL ROBUST VENDOR NETWORK BENEFITS National Coverage • Lower fixed and variable costs that are driven down by competitive vendor bidding • Every zip code in the U.S. • Ability to grow with limited need for capital • Presence in Canada • Network
Slide 9: Scalable Technology Platform to Support Clients' CSR & Operational Performance
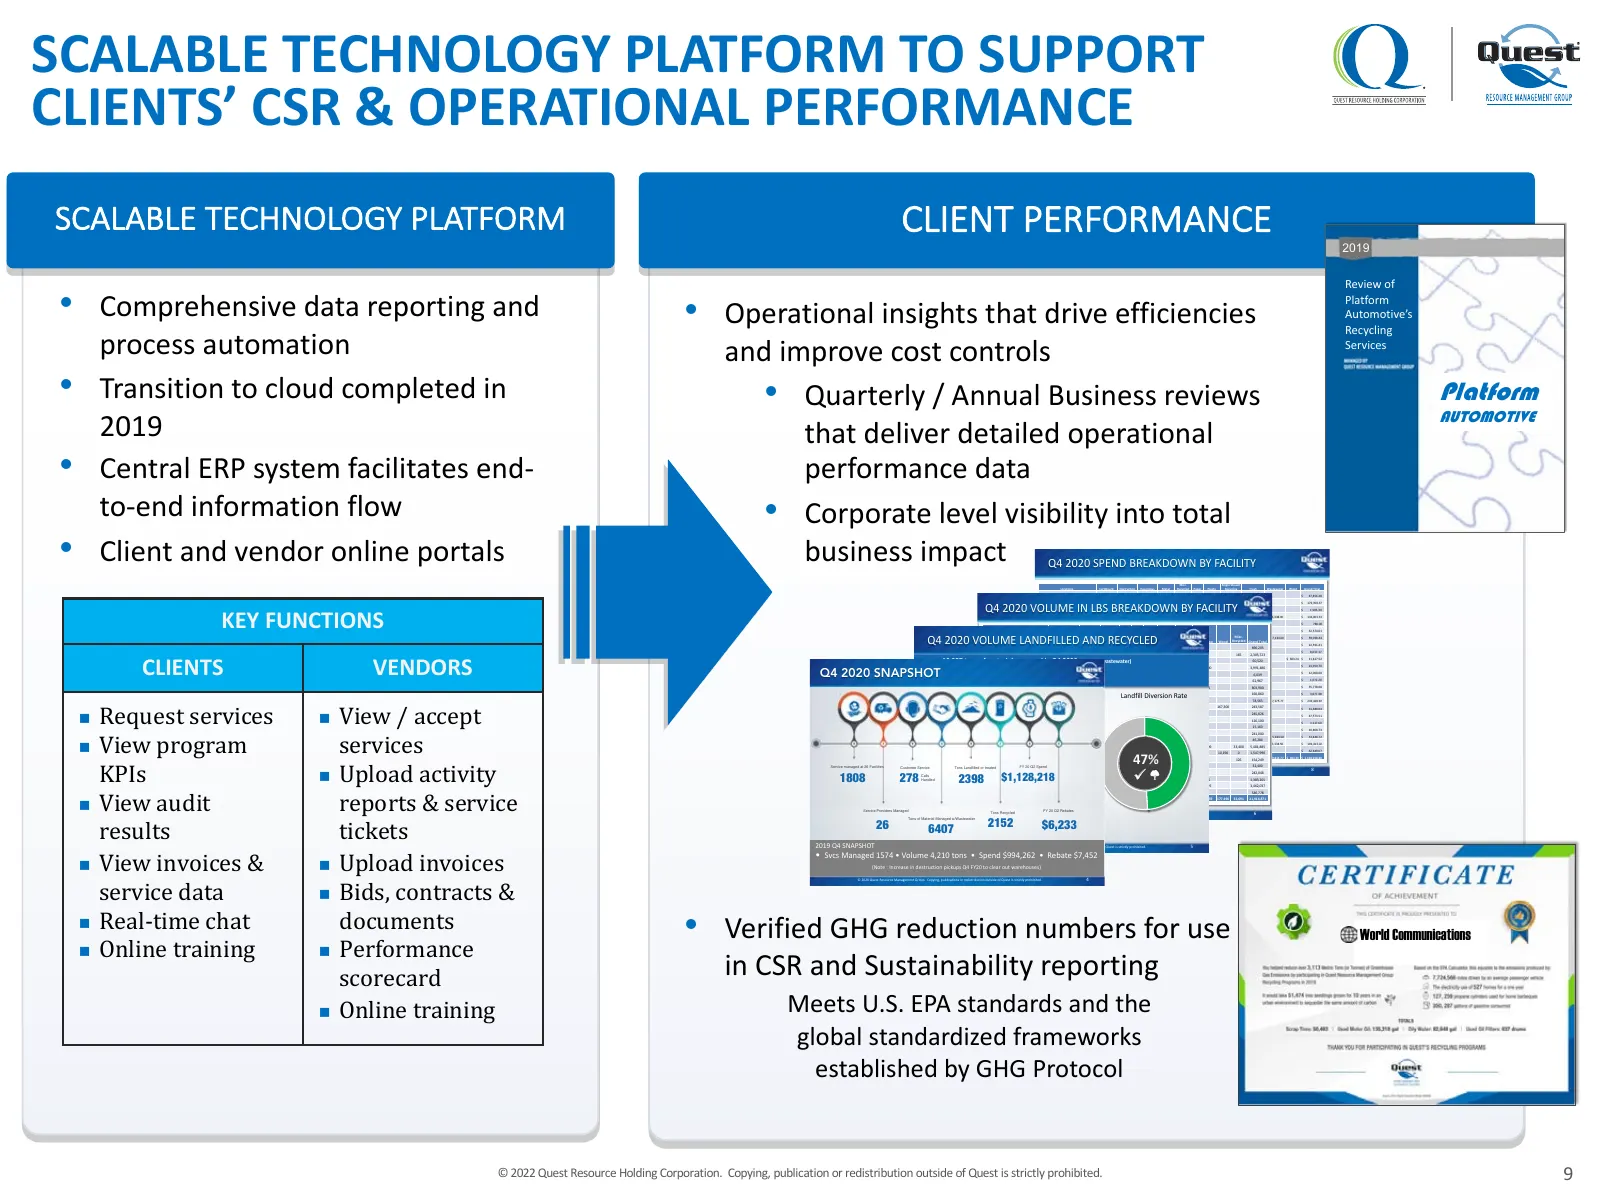
SCALABLE TECHNOLOGY PLATFORM TO SUPPORT CLIENTS’ CSR & OPERATIONAL PERFORMANCE SCALABLE TECHNOLOGY PLATFORM CLIENT PERFORMANCE 2019 Review of • Comprehensive data reporting and • Operational insights that drive efficiencies Platform Automotive’s Recycling process automation and improve cost controls
Slide 10: Experienced Management Team
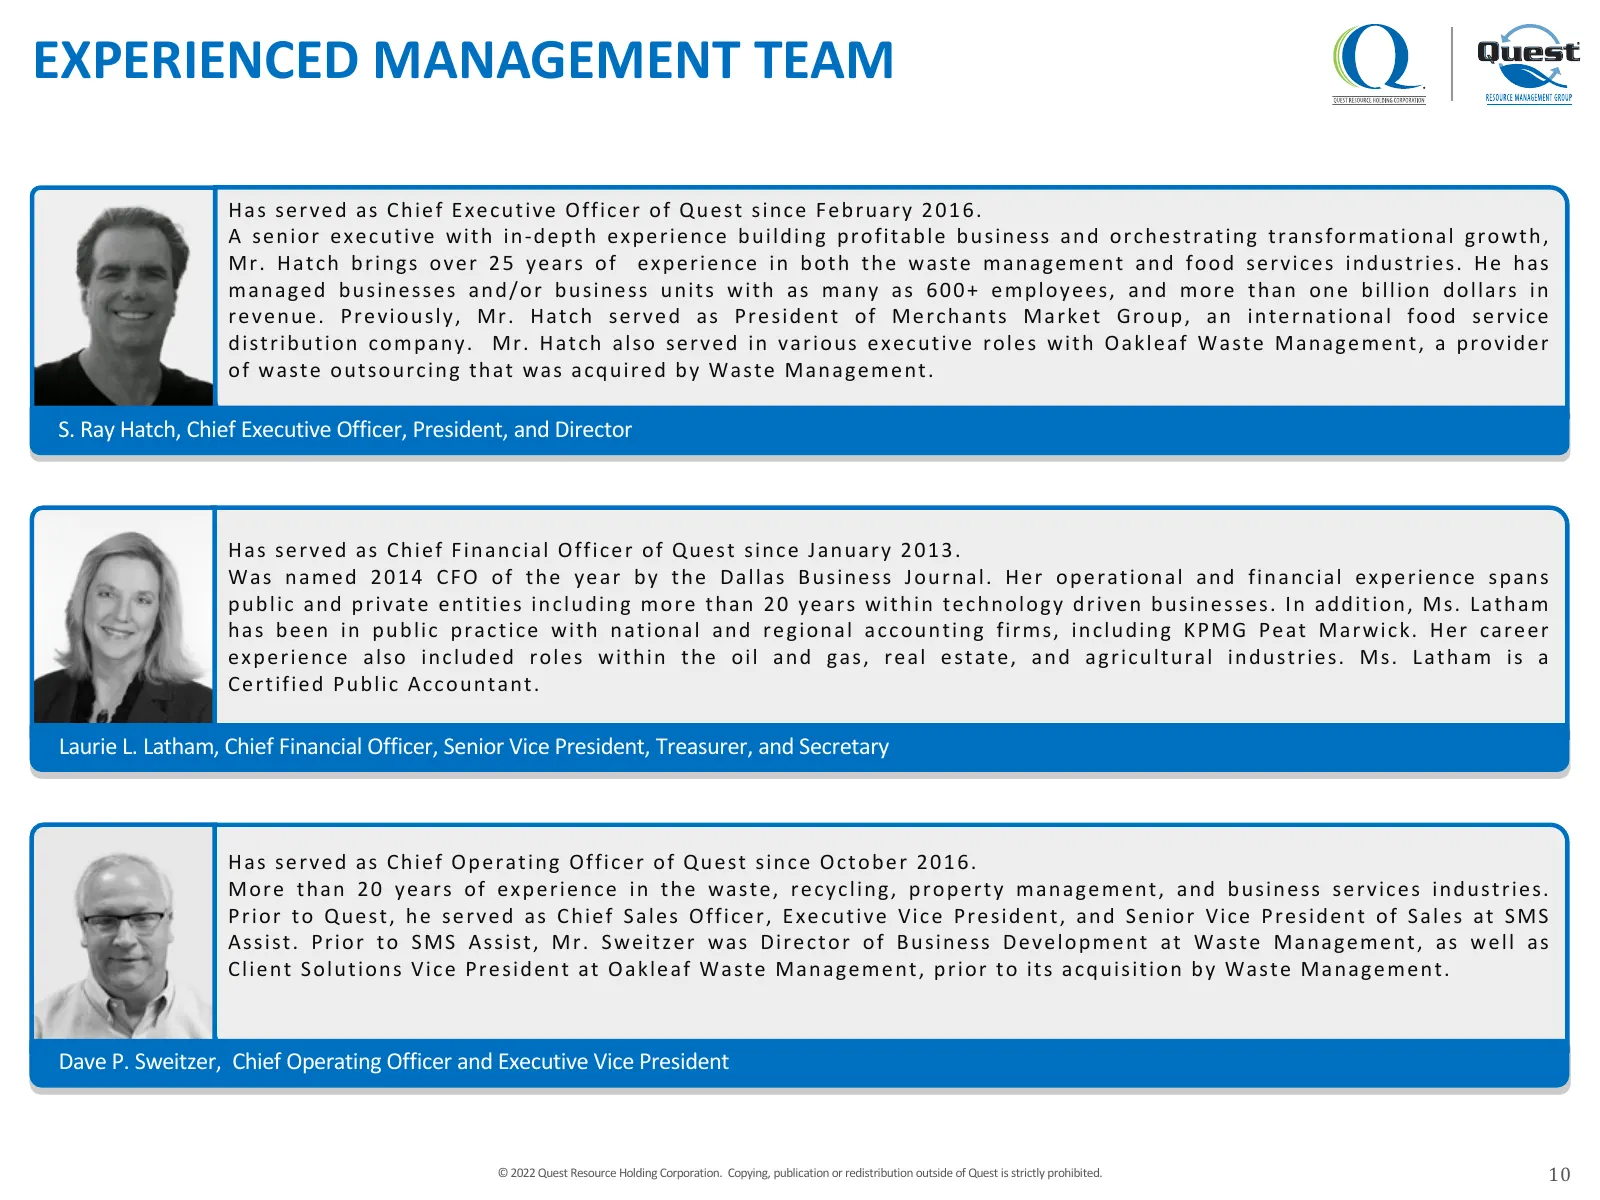
EXPERIENCED MANAGEMENT TEAM H as se r ve d as C hie f Ex e c u t ive O ffic e r of Q ue st sin c e F e br uar y 2 0 1 6 . A se n ior e x e c ut ive wit h in-de pt h e x pe r ie nc e building pr ofit able busine ss and or c he st r at ing t r ansfor m at ional g r owt h, Mr . H at c h br ing s ove r

Slide 11: Industry Overview
QO |= smc GEE INDUSTRY OVERVIEW
Slide 12: Waste Generation Continues to Grow; Landfill Diversion Pressures Continue
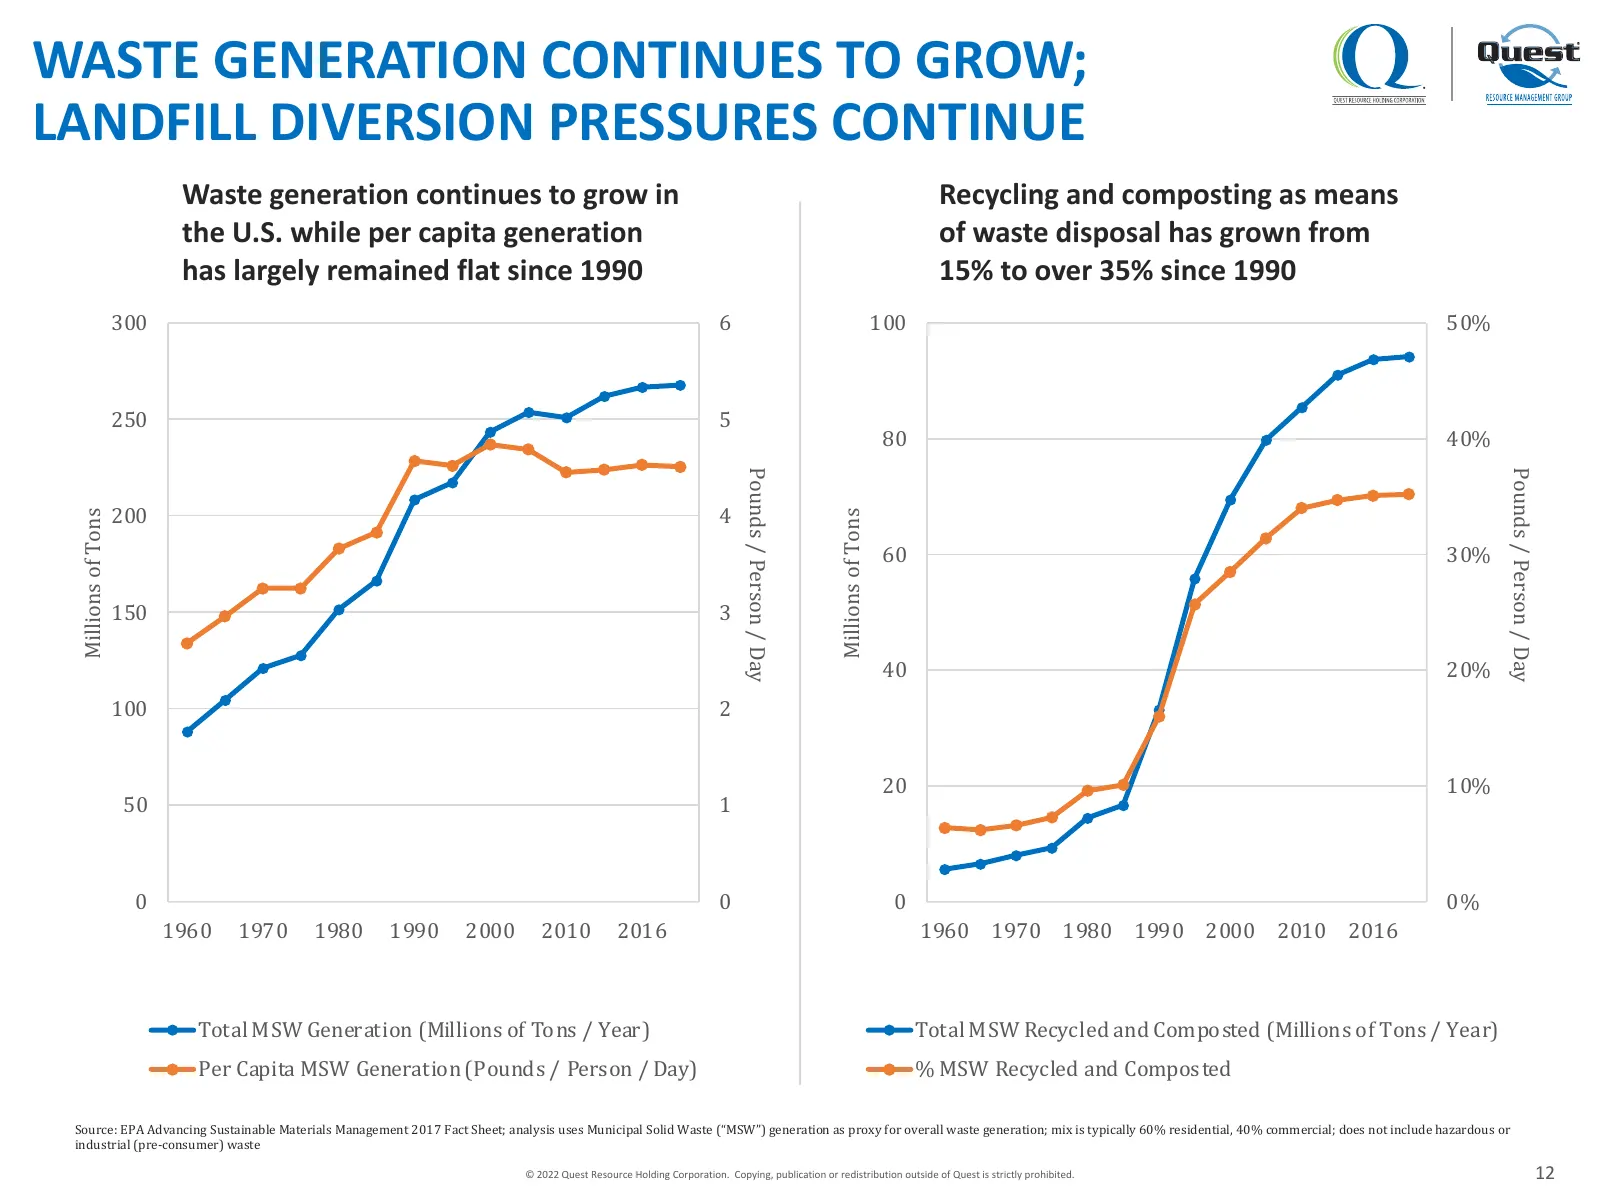
WASTE GENERATION CONTINUES TO GROW; LANDFILL DIVERSION PRESSURES CONTINUE Waste generation continues to grow in Recycling and composting as means the U.S. while per capita generation of waste disposal has grown from has largely remained flat since 1990 15% to over 35% since 1990 300 6 100 50% 250 5
Slide 13: Landfill Represents >50% of Waste Disposal
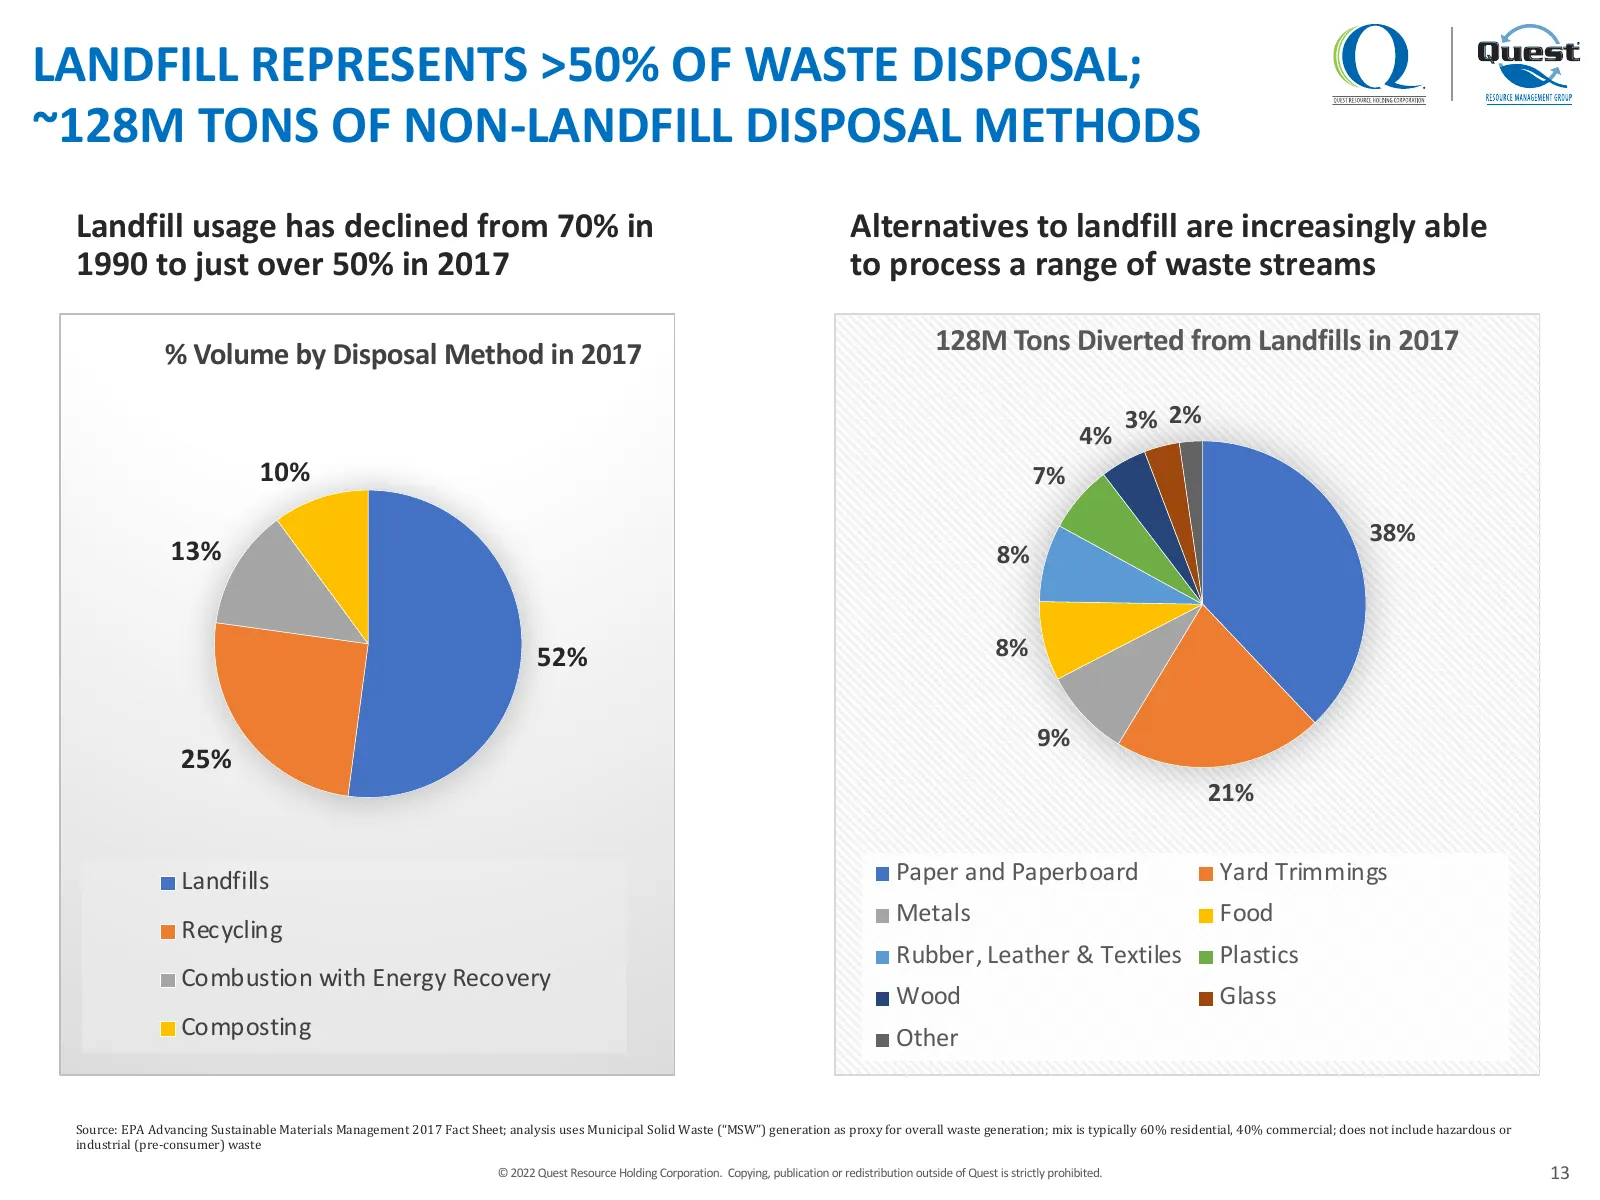
LANDFILL REPRESENTS >50% OF WASTE DISPOSAL; ~128M TONS OF NON-LANDFILL DISPOSAL METHODS Landfill usage has declined from 70% in Alternatives to landfill are increasingly able 1990 to just over 50% in 2017 to process a range of waste streams % Volume by Disposal Method in 2017 128M Tons Diverted from
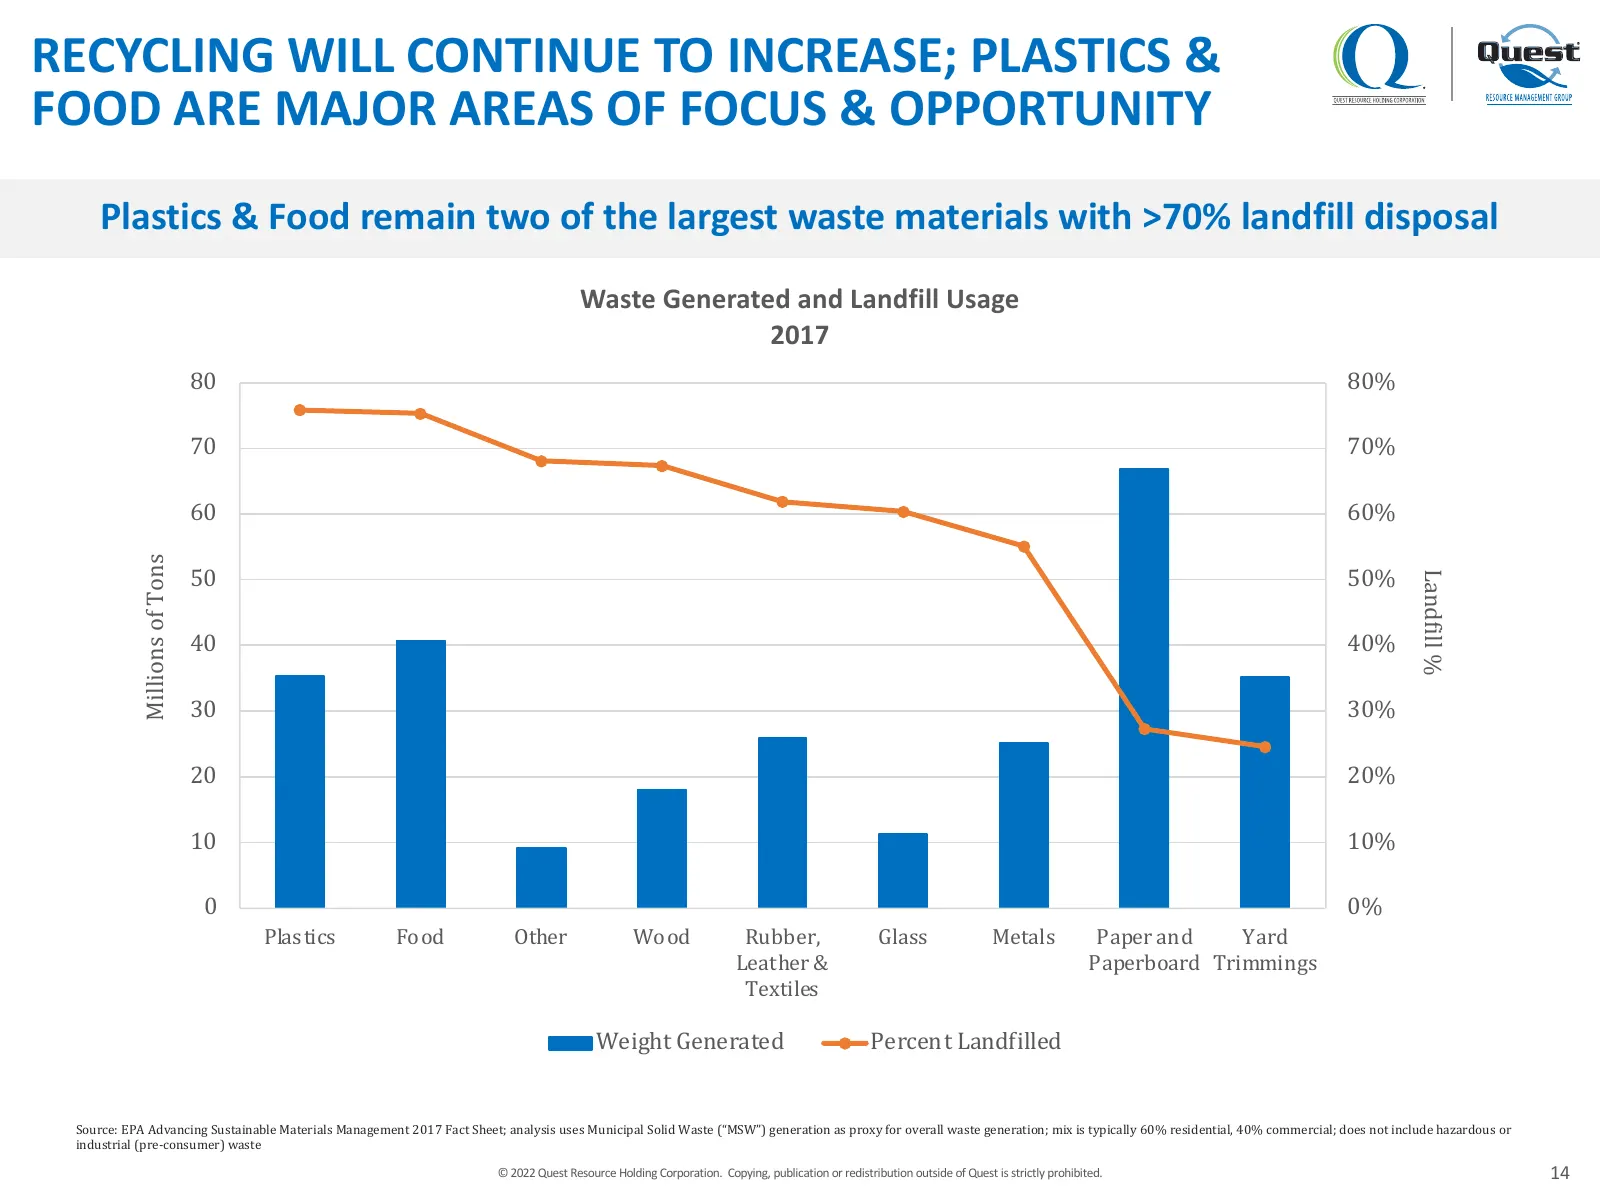
Slide 14: Recycling Will Continue to Increase; Plastics & Food Major Areas of Opportunity
RECYCLING WILL CONTINUE TO INCREASE; PLASTICS & FOOD ARE MAJOR AREAS OF FOCUS & OPPORTUNITY Plastics & Food remain two of the largest waste materials with >70% landfill disposal Waste Generated and Landfill Usage 2017 80 80% 70 70% 60 60% Millions of Tons 50 50% Landfill % 40 40% 30 30% 20 20% 10 10
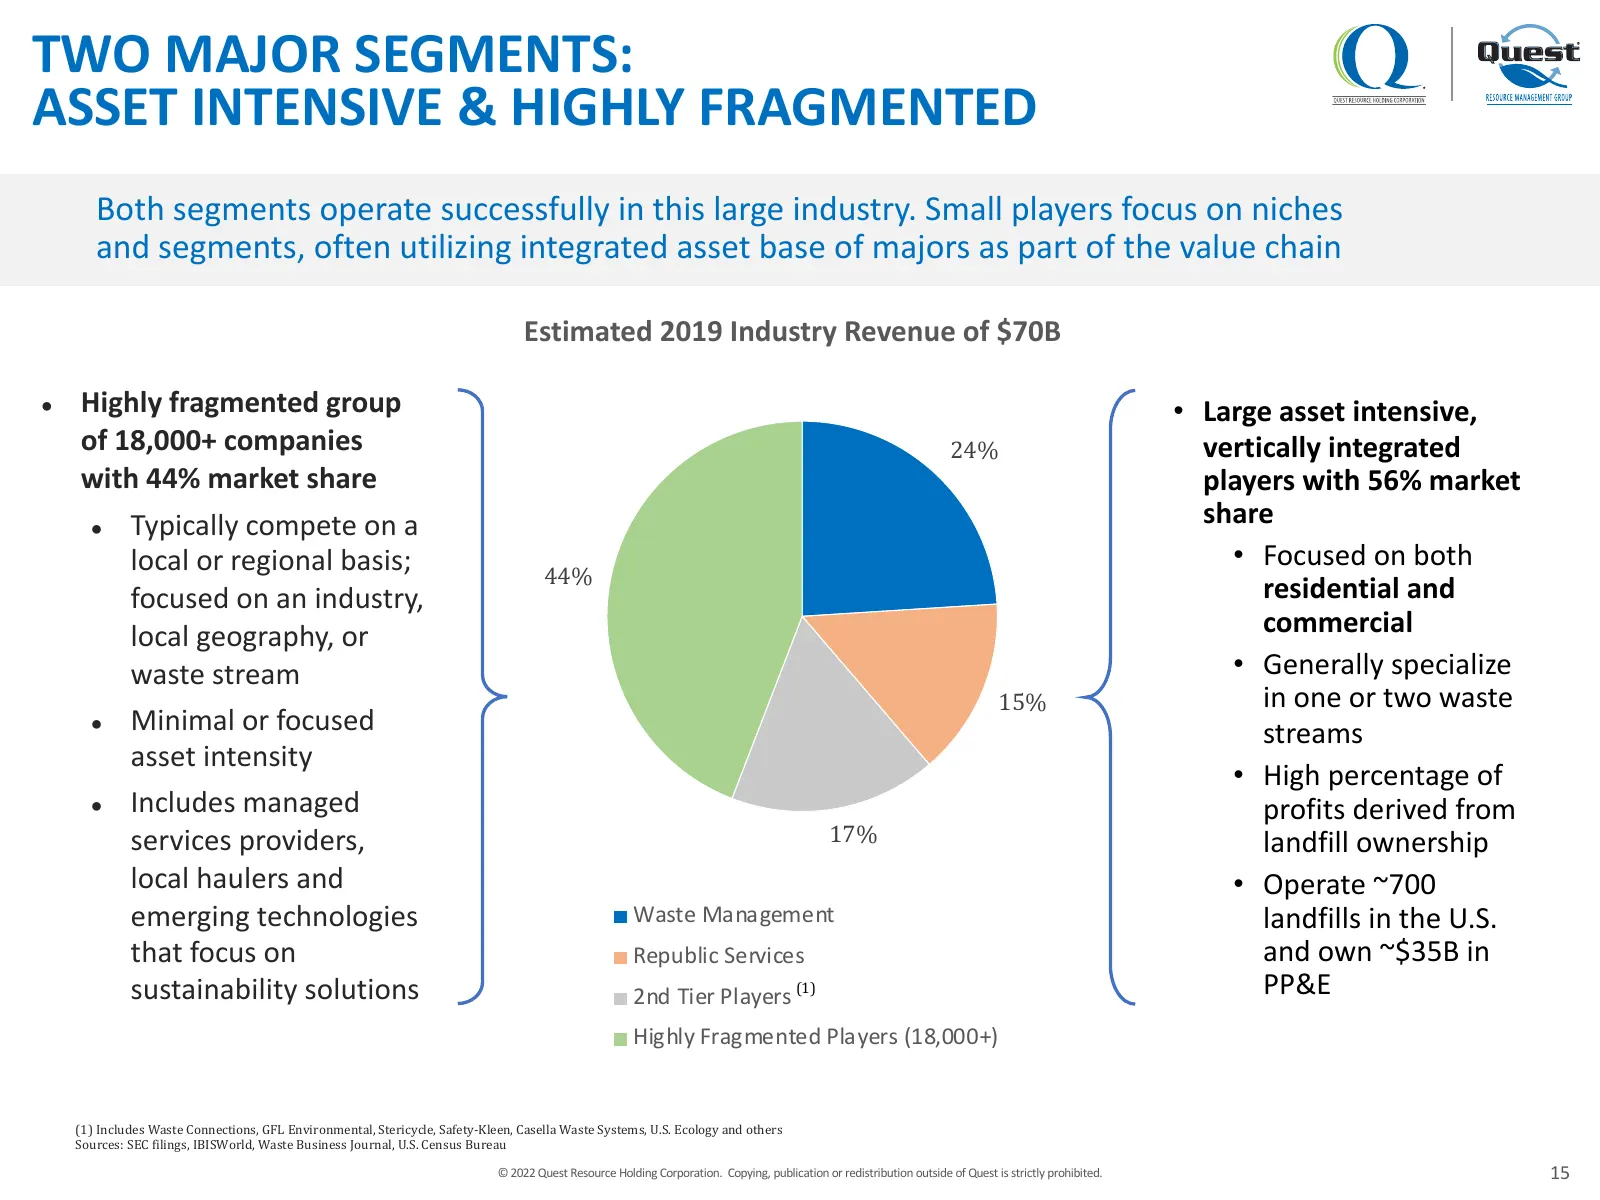
Slide 15: Two Major Segments: Asset Intensive & Highly Fragmented
TWO MAJOR SEGMENTS: ASSET INTENSIVE & HIGHLY FRAGMENTED Both segments operate successfully in this large industry. Small players focus on niches and segments, often utilizing integrated asset base of majors as part of the value chain Estimated 2019 Industry Revenue of $70B ● Highly fragmented group
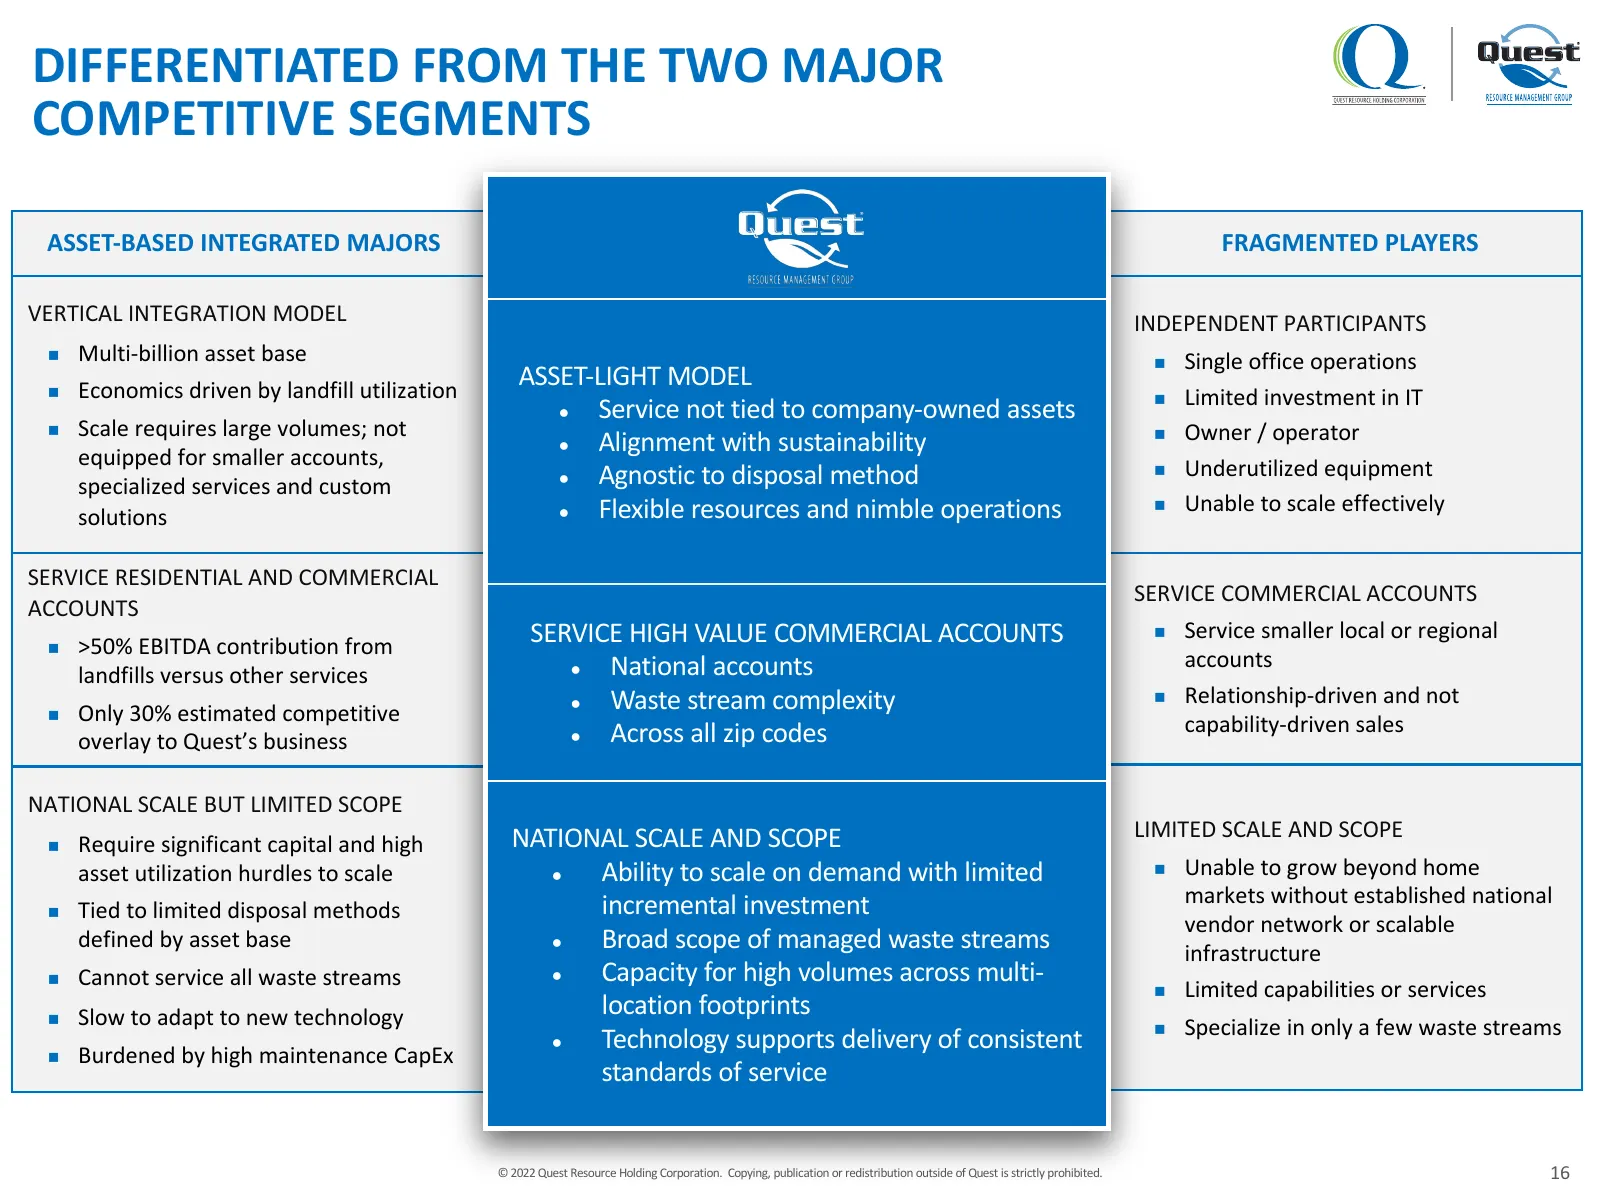
Slide 16: Differentiated from the Two Major Competitive Segments
DIFFERENTIATED FROM THE TWO MAJOR COMPETITIVE SEGMENTS ASSET-BASED INTEGRATED MAJORS FRAGMENTED PLAYERS VERTICAL INTEGRATION MODEL INDEPENDENT PARTICIPANTS n Multi-billion asset base n Single office operations Economics driven by landfill utilization ASSET-LIGHT MODEL n Limited investment in IT ● Se
Slide 17: Quest Business, Performance & Strategy
QUEST BUSINESS, PERFORMANCE & STRATEGY
Slide 18: Business Transformation
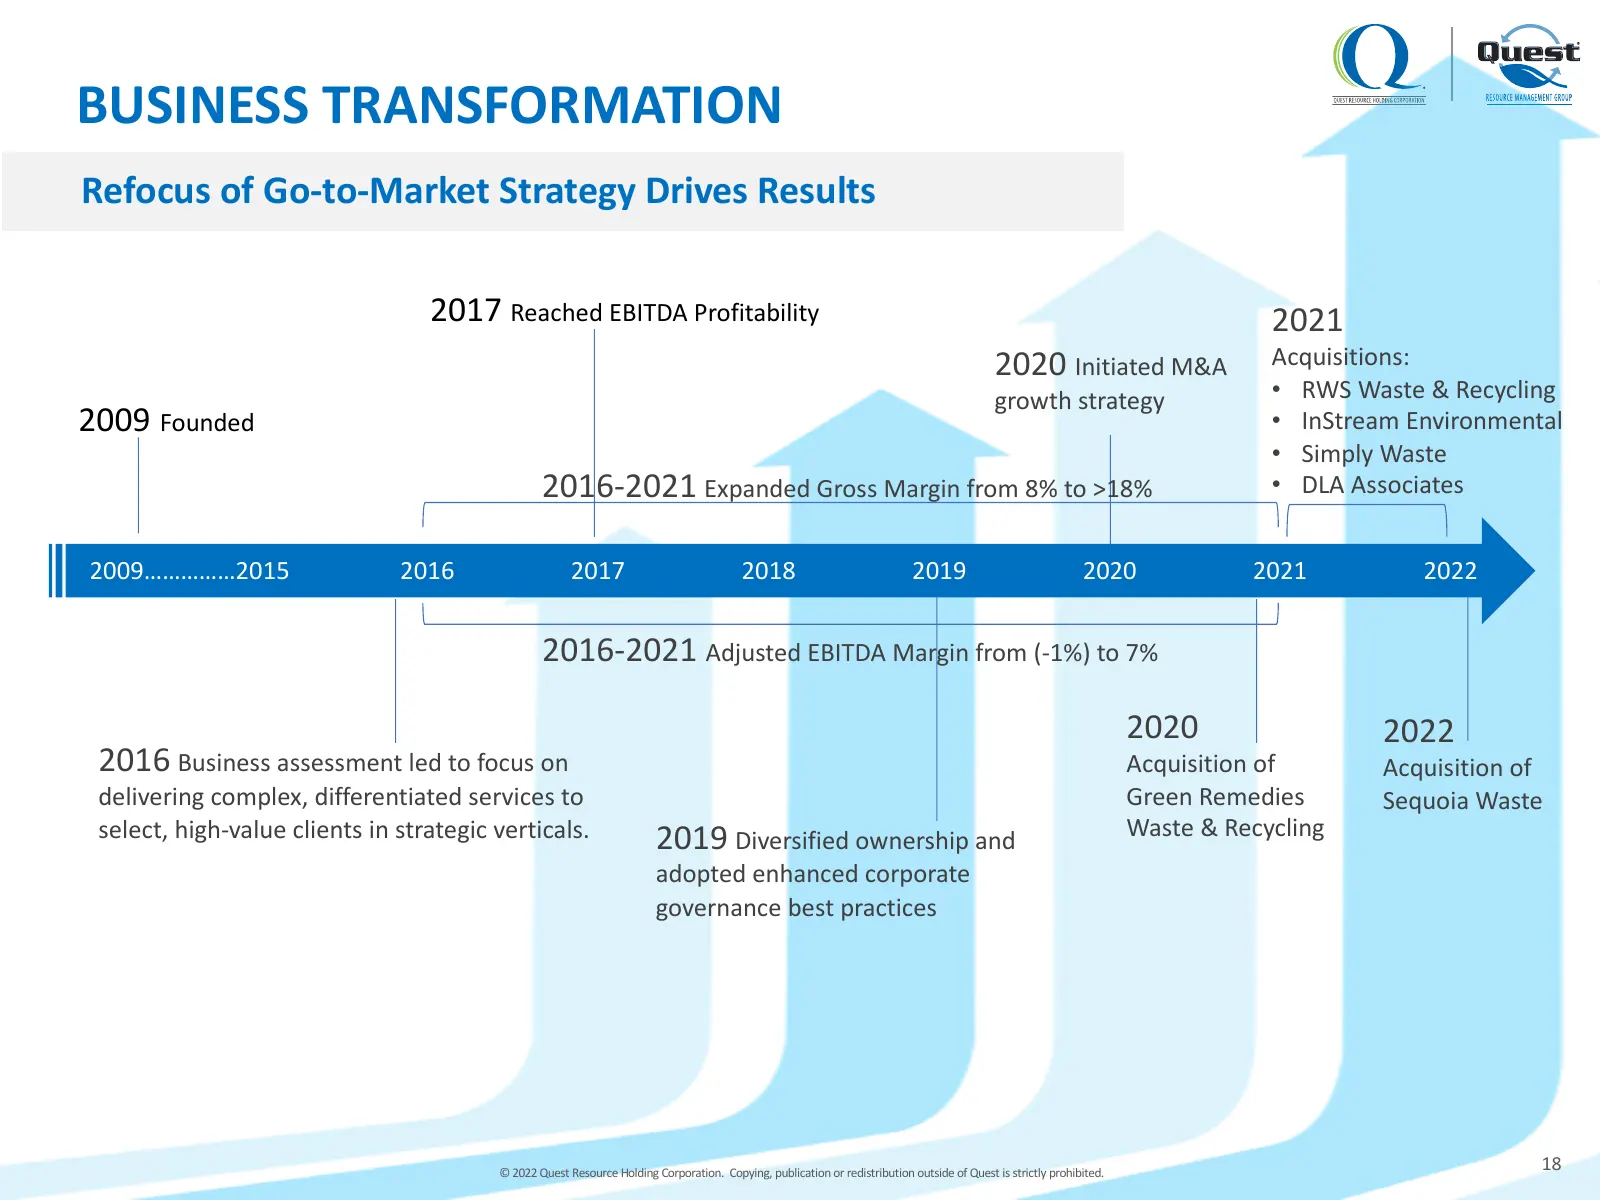
BUSINESS TRANSFORMATION Refocus of Go-to-Market Strategy Drives Results 2017 Reached EBITDA Profitability 2021 2020 Initiated M&A Acquisitions: growth strategy • RWS Waste & Recycling 2009 Founded • InStream Environmental • Simply Waste 2016-2021 Expanded Gross Margin from 8% to >18% • DLA Associate
Slide 19: Plan Going Forward
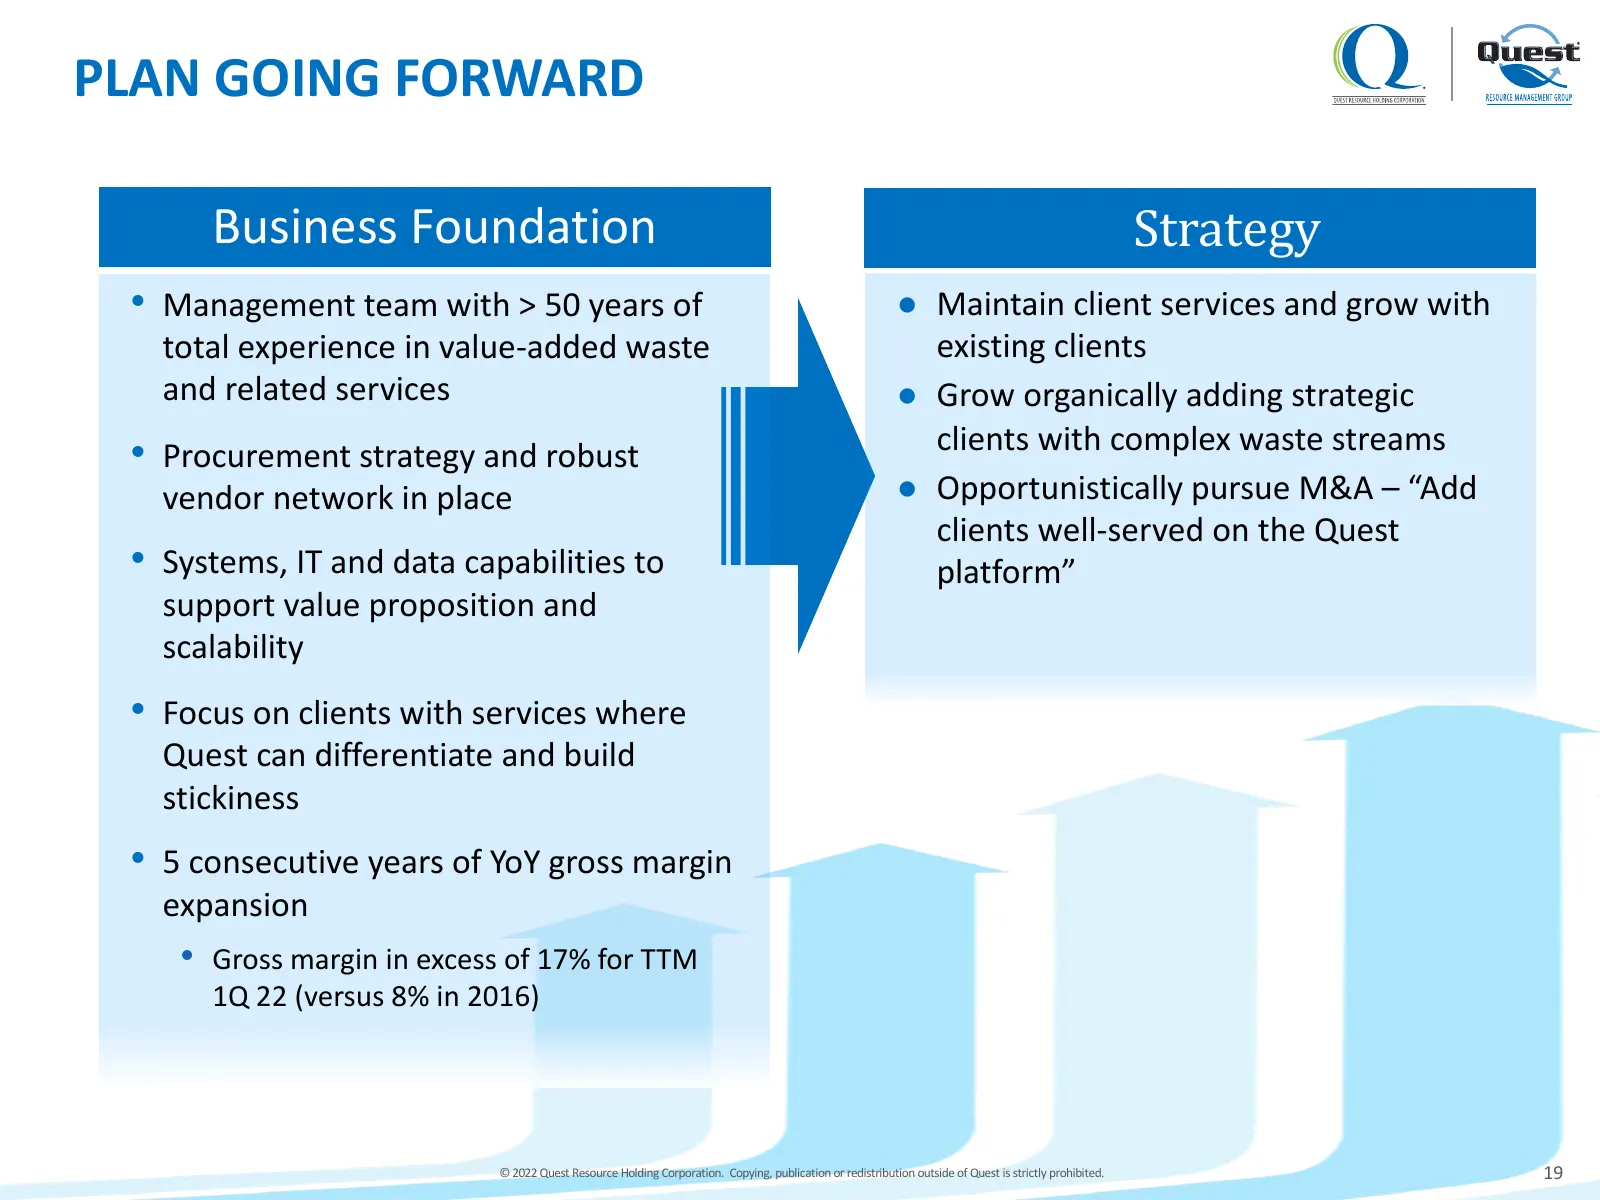
PLAN GOING FORWARD Business Foundation Strategy • Management team with > 50 years of ● Maintain client services and grow with total experience in value-added waste existing clients and related services ● Grow organically adding strategic • Procurement strategy and robust clients with complex waste s
Slide 20: Focused M&A Strategy: Acquire Companies with Strong Clients & Focus on Service
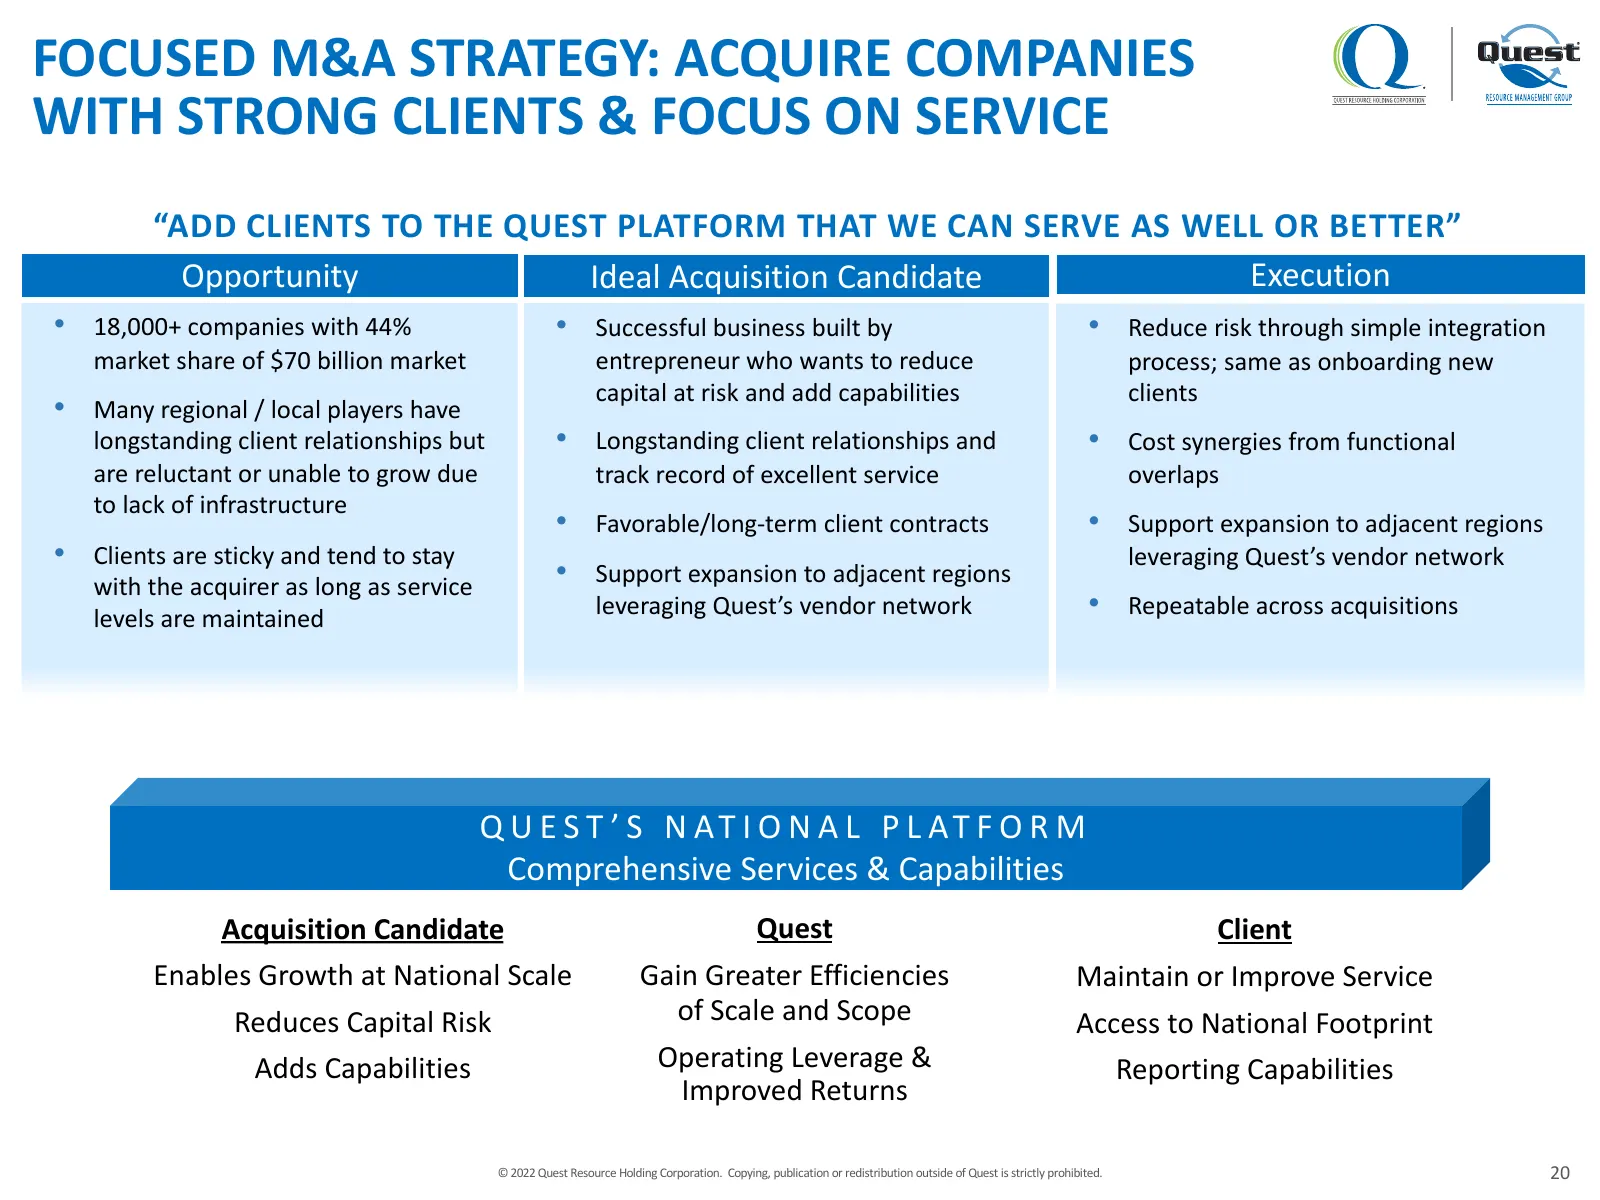
FOCUSED M&A STRATEGY: ACQUIRE COMPANIES WITH STRONG CLIENTS & FOCUS ON SERVICE “ADD CLIENTS TO THE QUEST PLATFORM THAT WE CAN SERVE AS WELL OR BETTER” Opportunity Ideal Acquisition Candidate Execution • 18,000+ companies with 44% • Successful business built by • Reduce risk through simple integratio
Slide 21: Shift to Complex, Differentiated Services to Select, High-Value Clients
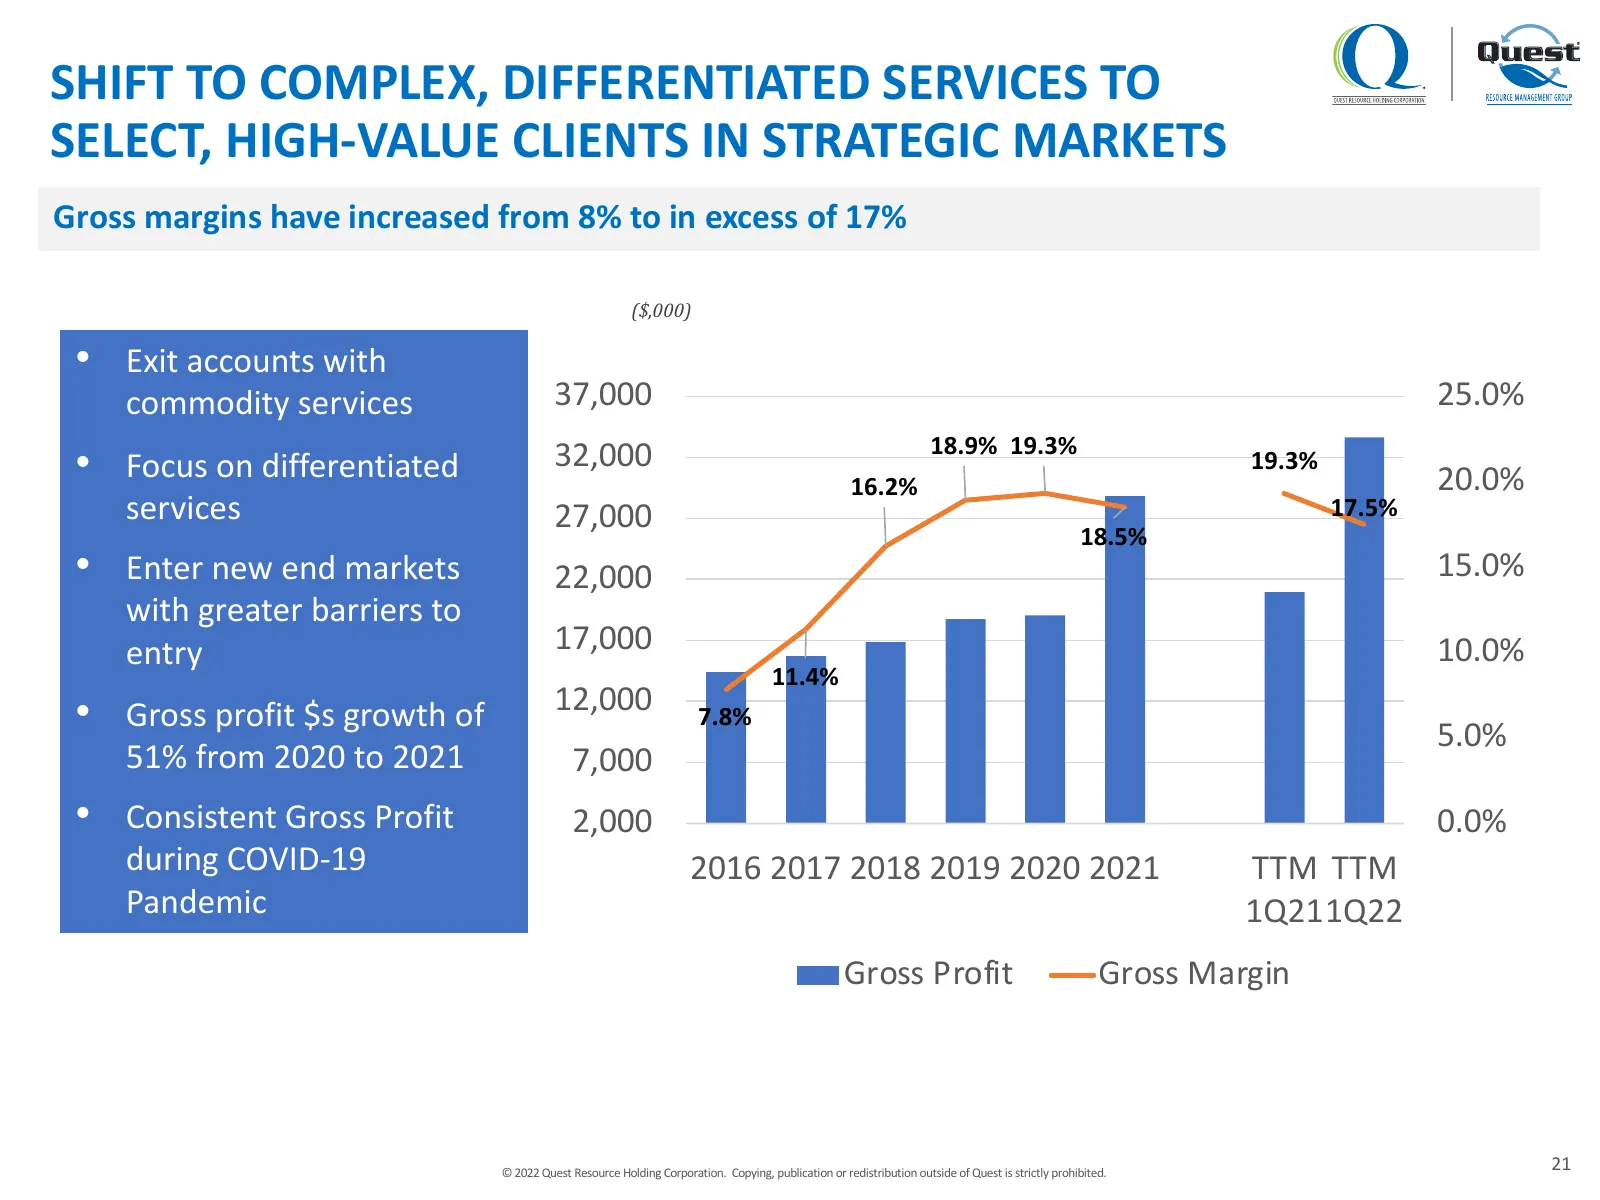
SHIFT TO COMPLEX, DIFFERENTIATED SERVICES TO SELECT, HIGH-VALUE CLIENTS IN STRATEGIC MARKETS Gross margins have increased from 8% to in excess of 17% ($,000) • Exit accounts with commodity services 37,000 25.0% 32,000 18.9% 19.3% • Focus on differentiated 16.2% 19.3% 20.0% services 27,000 17.5% 18.5
Slide 22: Platform at Scale to Deliver Operating Leverage
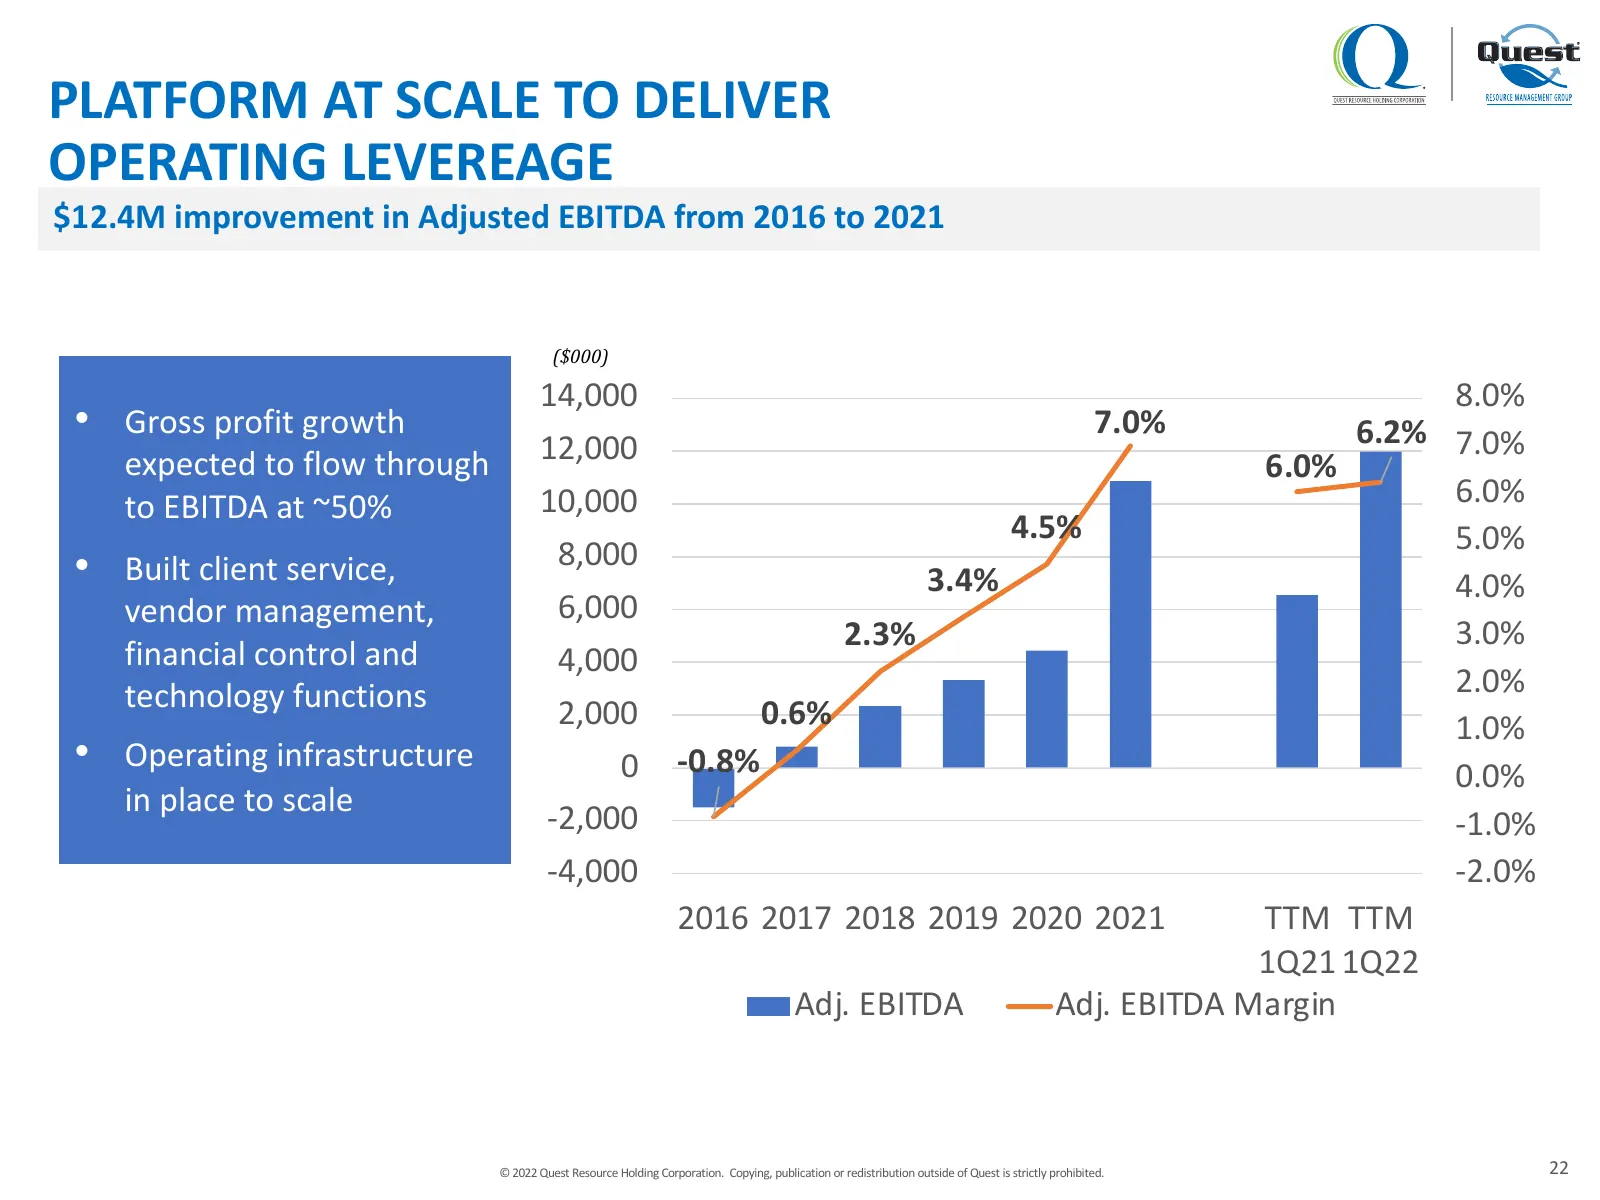
PLATFORM AT SCALE TO DELIVER OPERATING LEVEREAGE $12.4M improvement in Adjusted EBITDA from 2016 to 2021 ($000) 14,000 8.0% • Gross profit growth 6.2% 7.0% 7.0% expected to flow through 12,000 6.0% to EBITDA at ~50% 10,000 6.0% 4.5% 5.0% • Built client service, 8,000 3.4% 4.0% vendor management, 6,0
Slide 23: Recent Financial Results
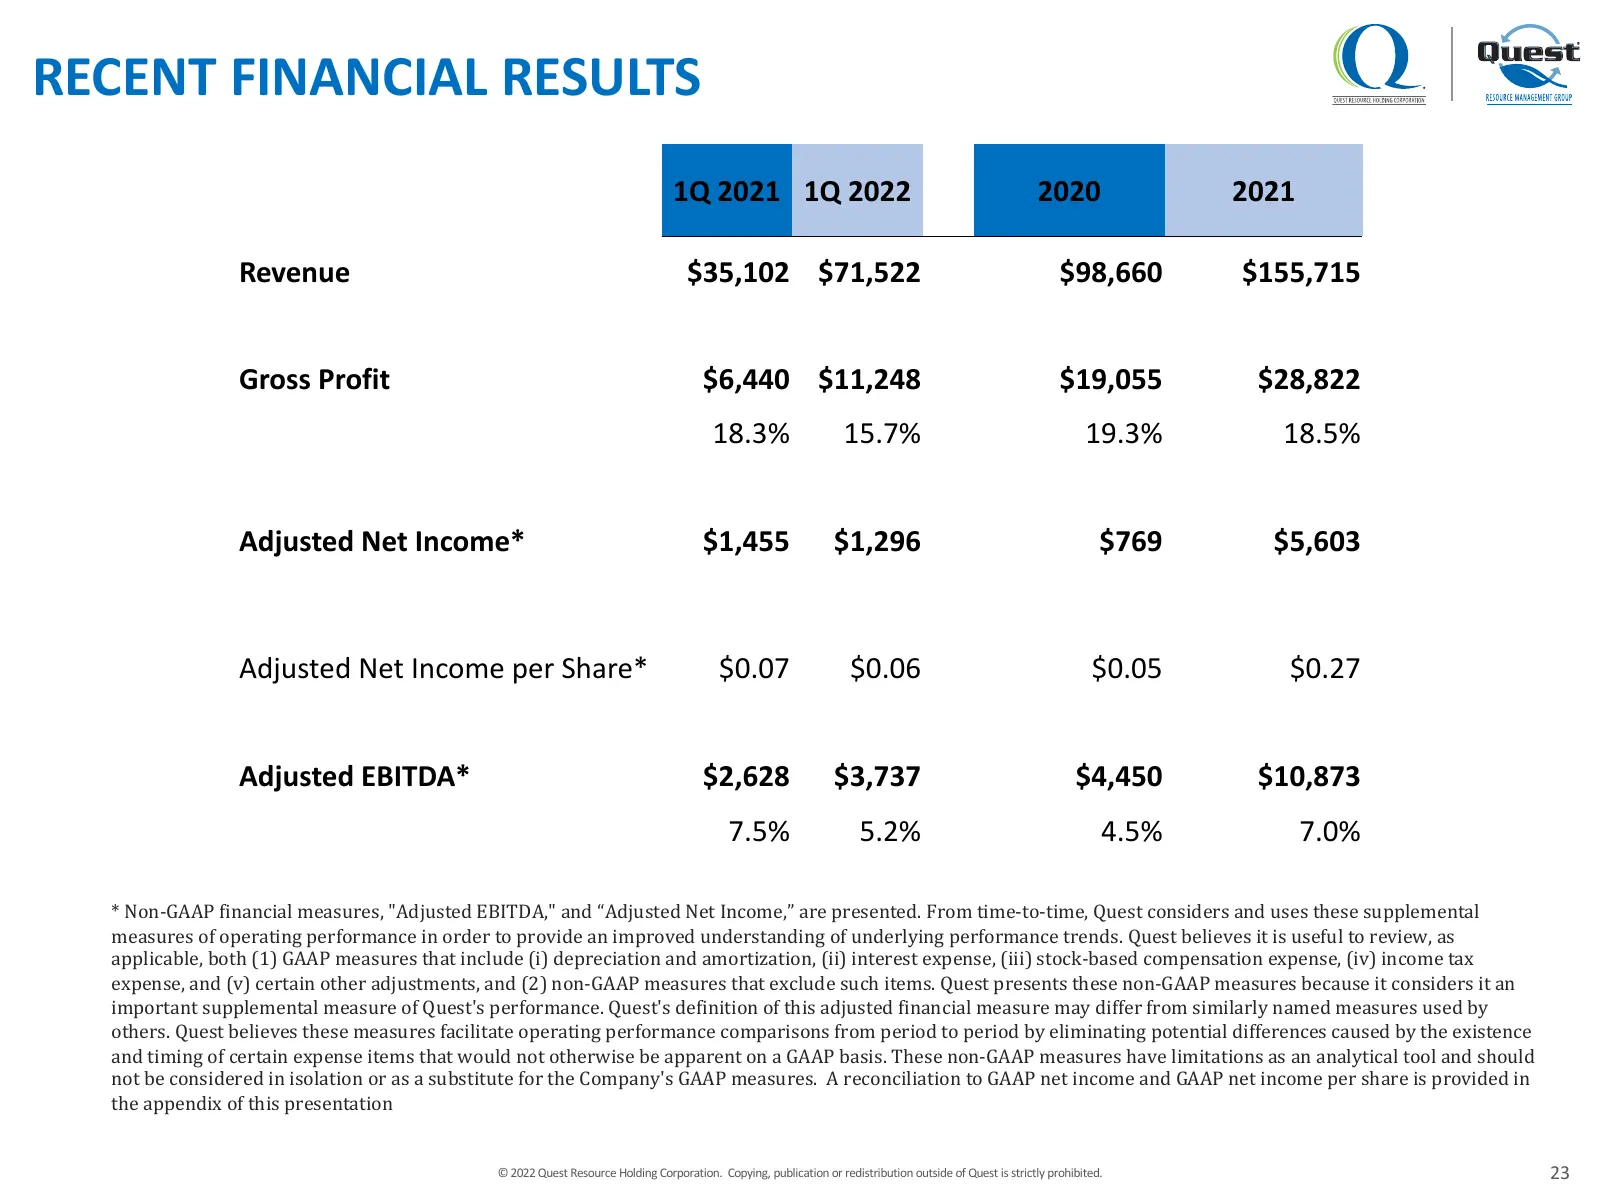
RECENT FINANCIAL RESULTS 1Q 2021 1Q 2022 2020 2021 Revenue $35,102 $71,522 $98,660 $155,715 Gross Profit $6,440 $11,248 $19,055 $28,822 18.3% 15.7% 19.3% 18.5% Adjusted Net Income* $1,455 $1,296 $769 $5,603 Adjusted Net Income per Share* $0.07 $0.06 $0.05 $0.27 Adjusted EBITDA* $2,628 $3,737 $4,450
Slide 24: Stable, Scalable Platform with Attractive Industry Dynamics and Financial Characteristics
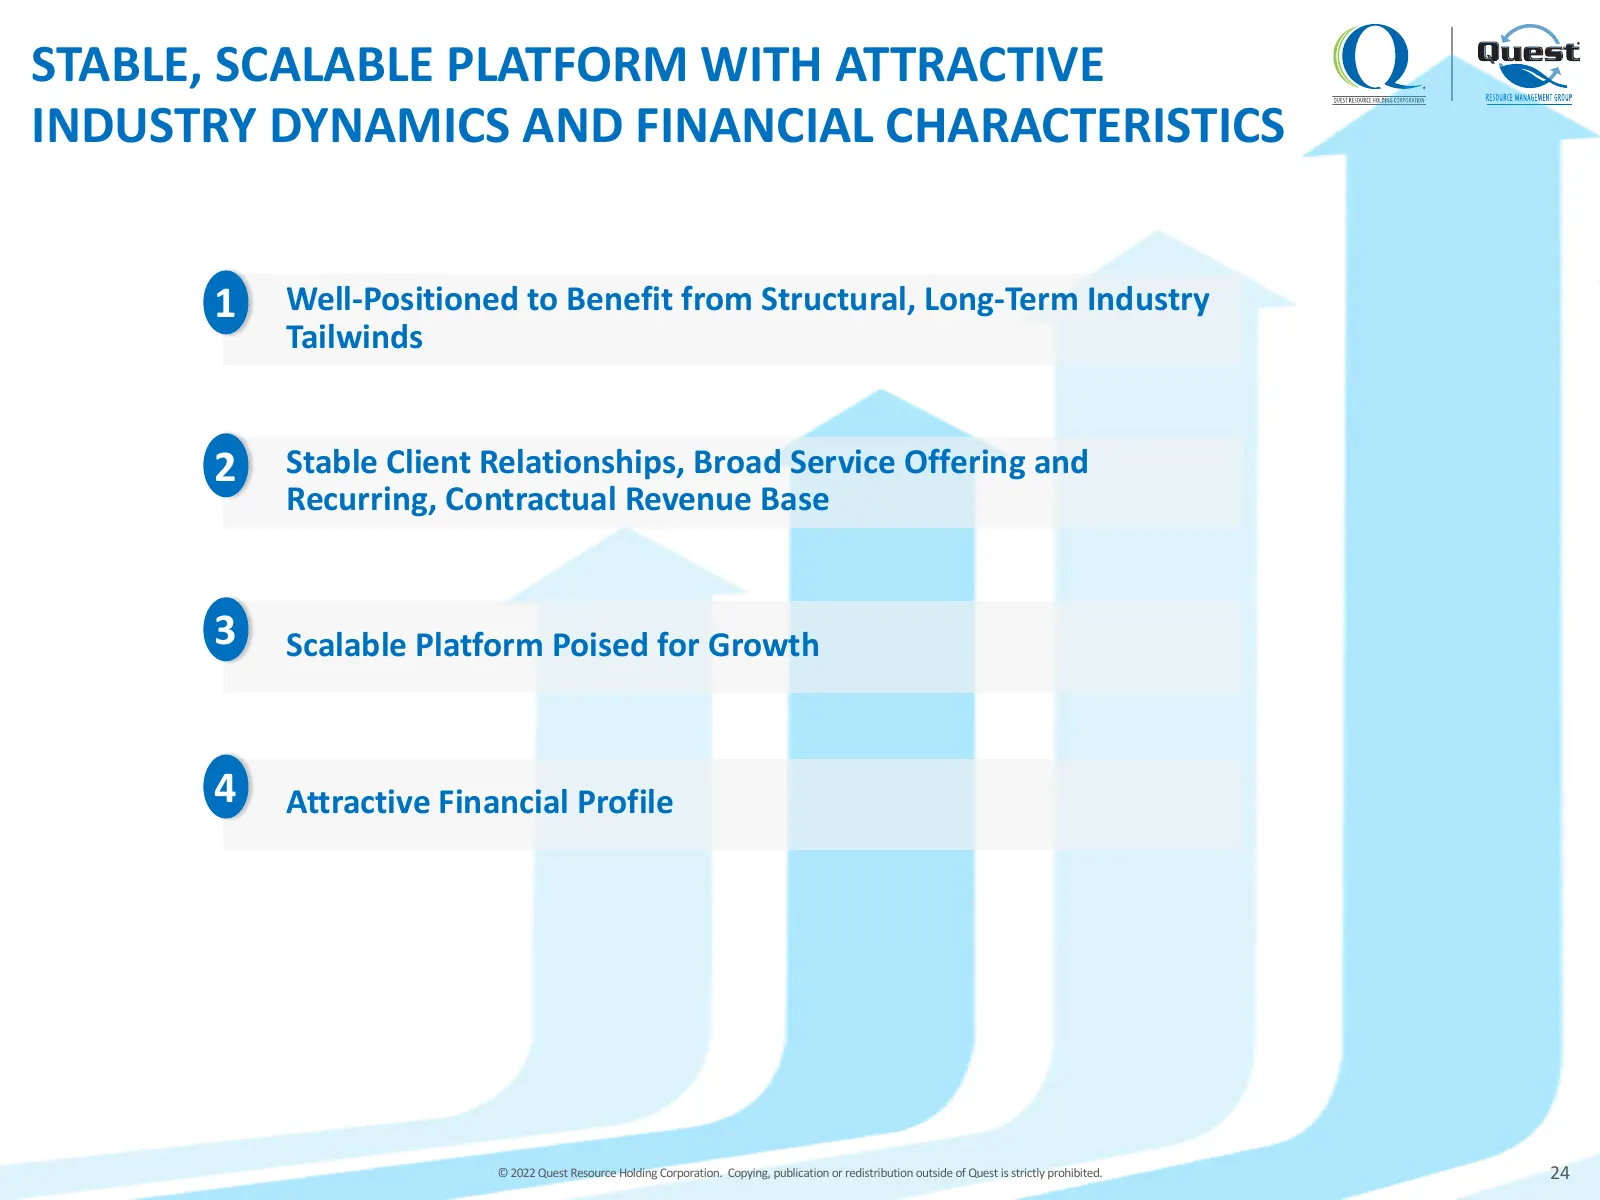
STABLE, SCALABLE PLATFORM WITH ATTRACTIVE INDUSTRY DYNAMICS AND FINANCIAL CHARACTERISTICS 1 Well-Positioned to Benefit from Structural, Long-Term Industry Tailwinds 2 Stable Client Relationships, Broad Service Offering and Recurring, Contractual Revenue Base 3 Scalable Platform Poised for Growth 4 A
Slide 25: Appendix
APPENDIX
Slide 26: Reconciliation of U.S. GAAP to Non-GAAP Financial Measures
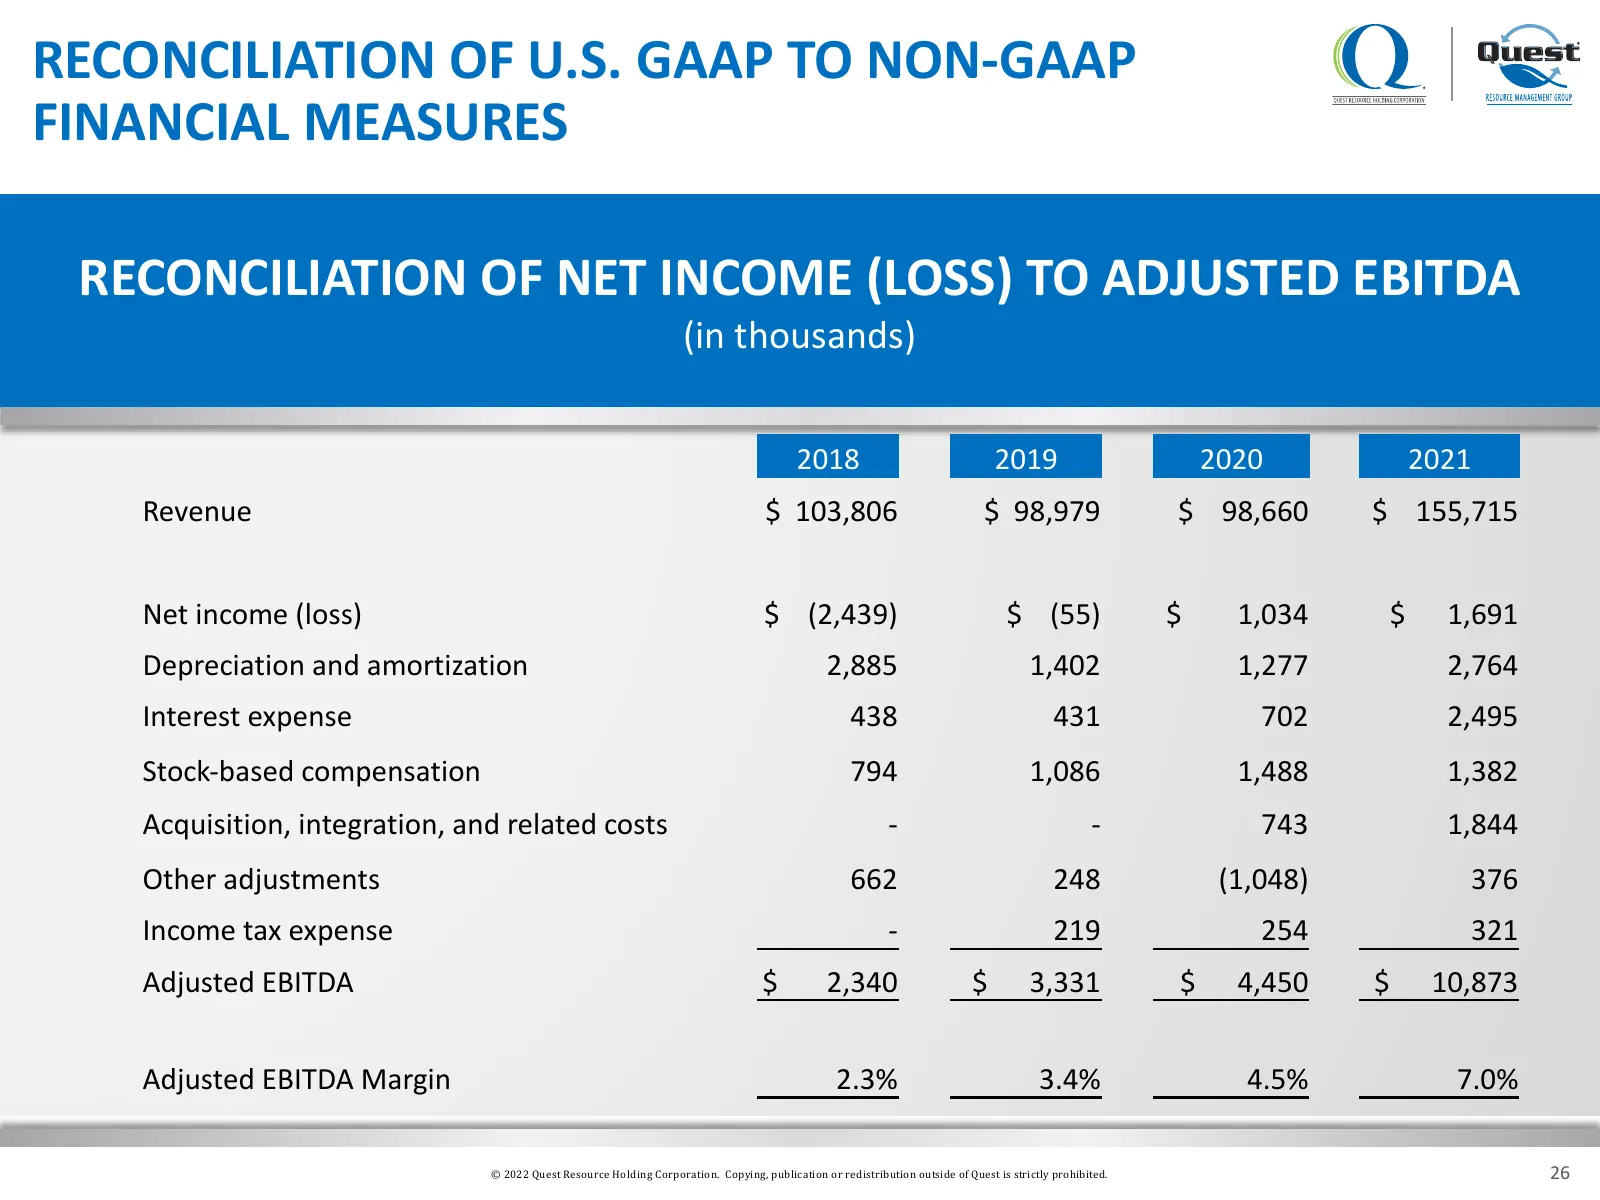
RECONCILIATION OF U.S. GAAP TO NON-GAAP FINANCIAL MEASURES RECONCILIATION OF NET INCOME (LOSS) TO ADJUSTED EBITDA (in thousands) 2018 2019 2020 2021 Revenue $ 103,806 $ 98,979 $ 98,660 $ 155,715 Net income (loss) $ (2,439) $ (55) $ 1,034 $ 1,691 Depreciation and amortization 2,885 1,402 1,277 2,764
Slide 27: Reconciliation of U.S. GAAP to Non-GAAP Financial Measures
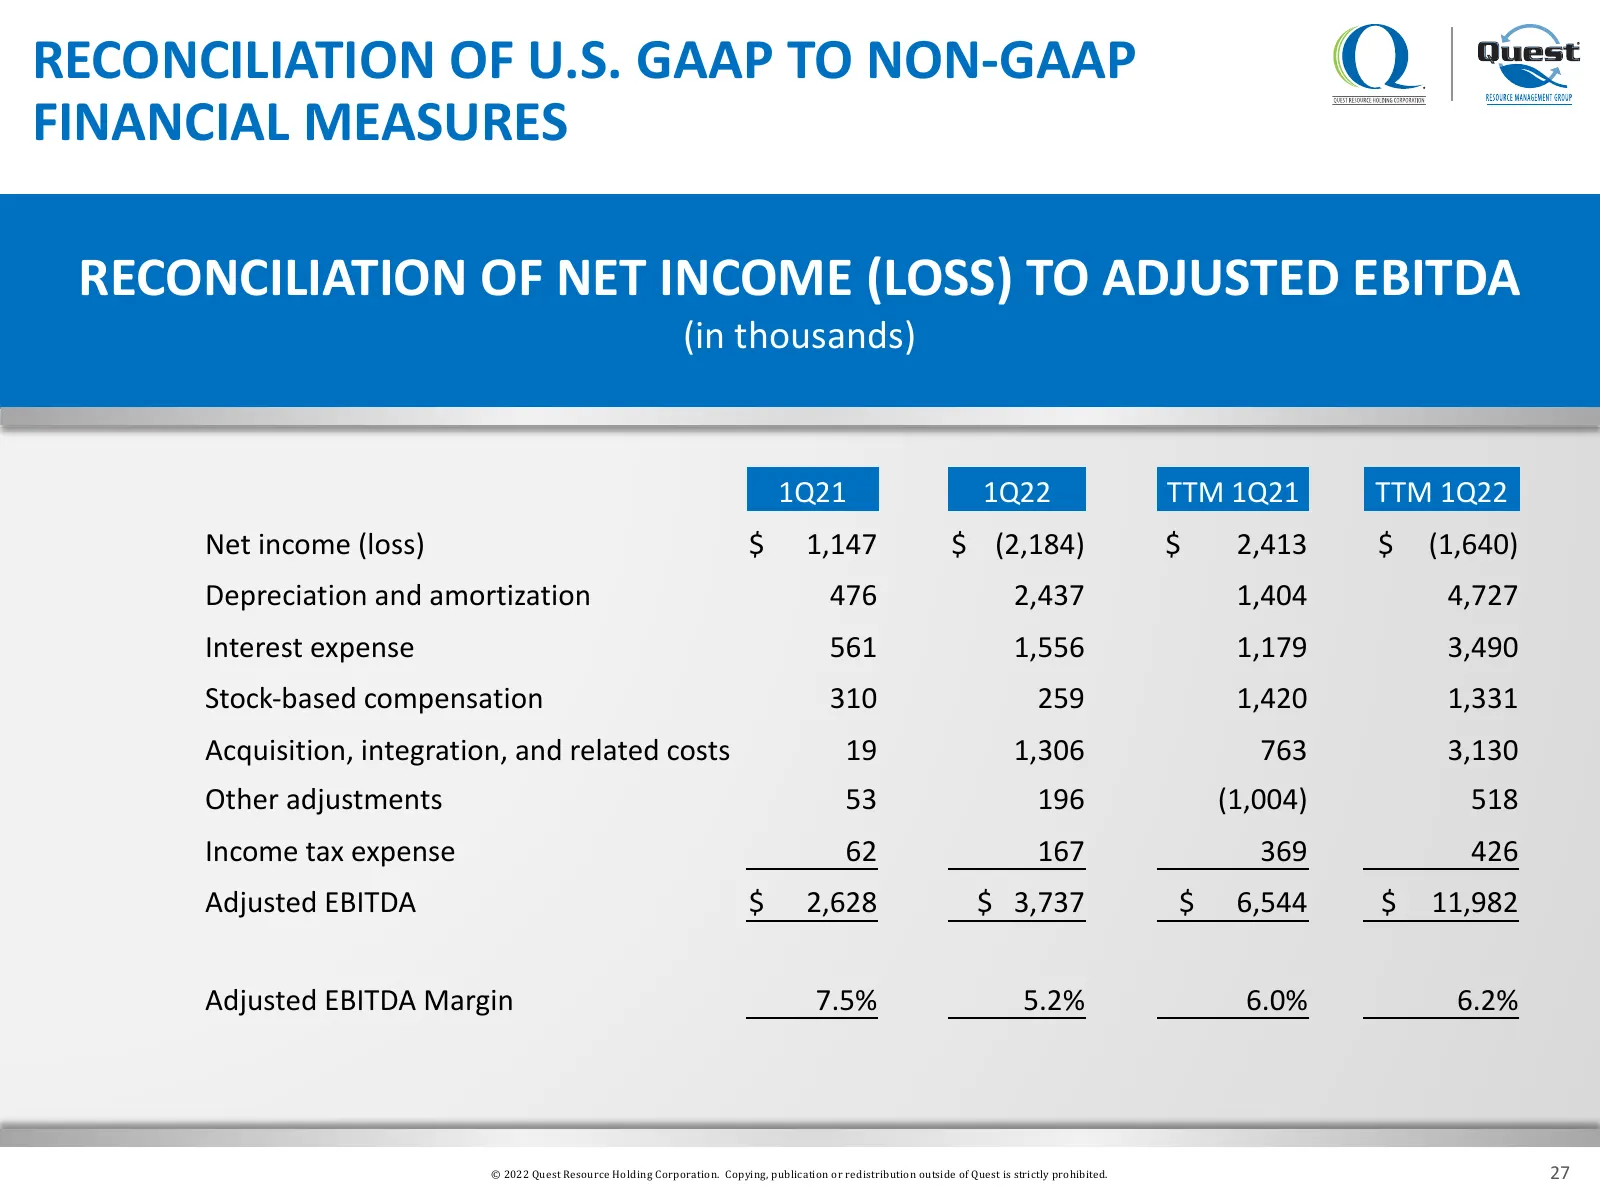
RECONCILIATION OF U.S. GAAP TO NON-GAAP FINANCIAL MEASURES RECONCILIATION OF NET INCOME (LOSS) TO ADJUSTED EBITDA (in thousands) 1Q21 1Q22 TTM 1Q21 TTM 1Q22 Net income (loss) $ 1,147 $ (2,184) $ 2,413 $ (1,640) Depreciation and amortization 476 2,437 1,404 4,727 Interest expense 561 1,556 1,179 3,49
Slide 28: Reconciliation of Adjusted Net Income per Share
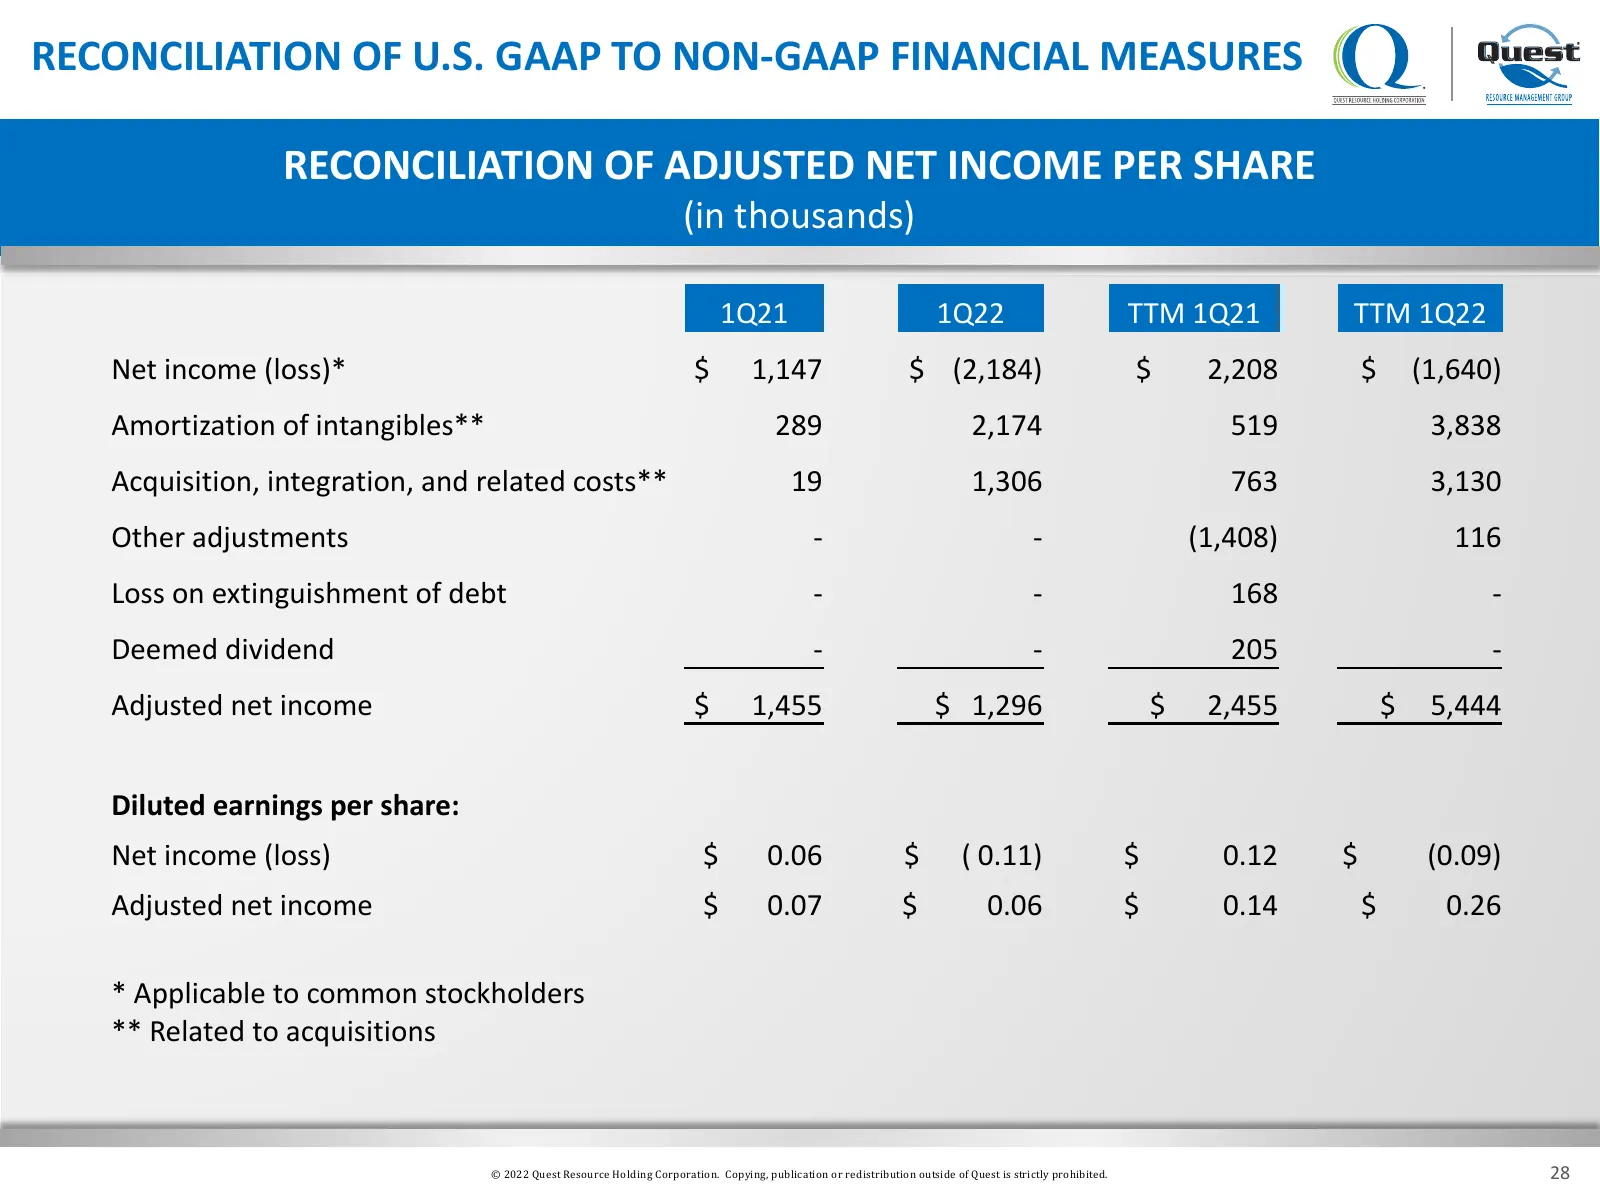
RECONCILIATION OF U.S. GAAP TO NON-GAAP FINANCIAL MEASURES RECONCILIATION OF ADJUSTED NET INCOME PER SHARE (in thousands) 1Q21 1Q22 TTM 1Q21 TTM 1Q22 Net income (loss)* $ 1,147 $ (2,184) $ 2,208 $ (1,640) Amortization of intangibles** 289 2,174 519 3,838 Acquisition, integration, and related costs**
Slide 29: Contact
3481 Plano Pkwy. The Colony, TX 75056 877.321.1811 www.questrmg.com RAY HATCH Chief Executive Officer LAURIE LATHAM Chief Financial Officer DAVE SWEITZER Chief Operations Officer © 2022 Quest Resource Holding Corporation. Copying, publication or redistribution outside of Quest is strictly prohibited
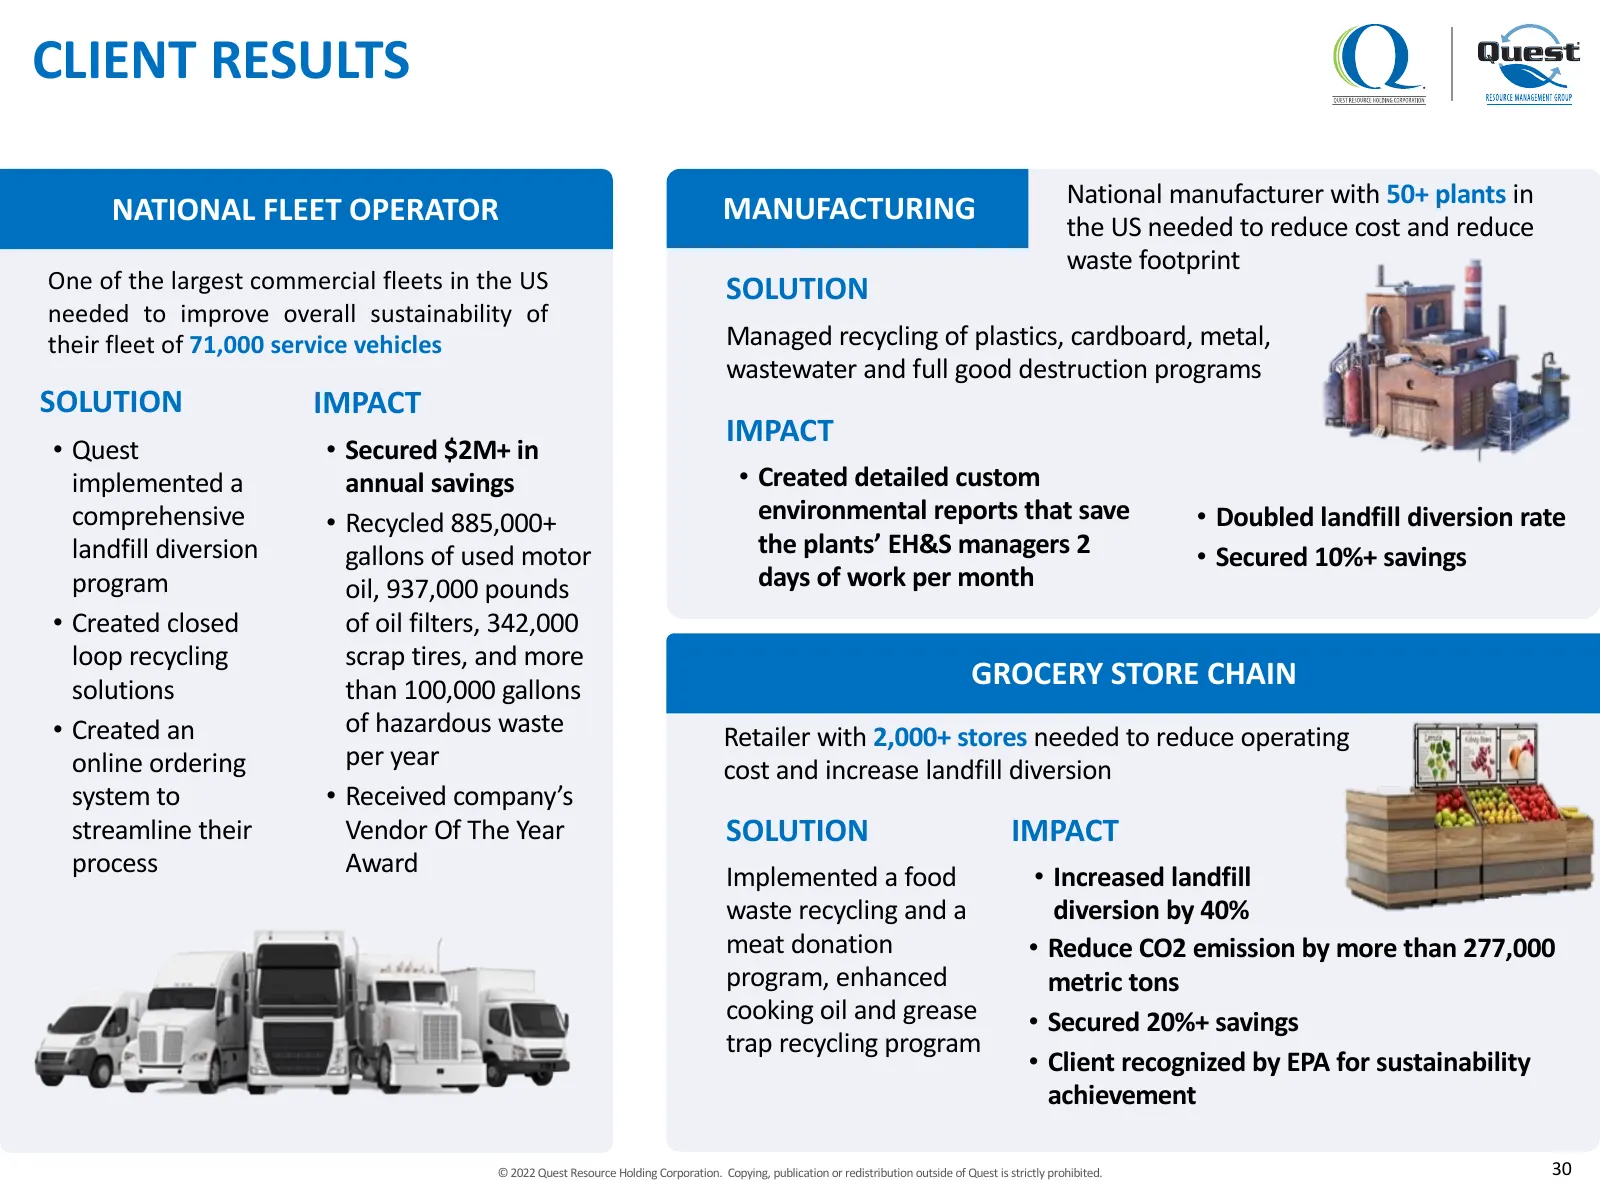
Slide 30: Client Results
CLIENT RESULTS National manufacturer with 50+ plants in NATIONAL FLEET OPERATOR MANUFACTURING the US needed to reduce cost and reduce waste footprint One of the largest commercial fleets in the US SOLUTION needed to improve overall sustainability of their fleet of 71,000 service vehicles Managed rec
Source: Internet Archive copy of s29.q4cdn.com
More decks from Quest Resource Holding Corporation
 Investor Presentation (May 2026)22 slides · May 2026
 Q4 2025 Earnings Presentation22 slides · Mar 12, 2026
 Investor Presentation (November 2025)20 slides · November 2025
 Investor Presentation (August 2025)20 slides · August 2025
 Q1 2025 Earnings Presentation20 slides · May 12, 2025
 Q4 2024 Earnings Presentation20 slides · Mar 12, 2025