Oi S.A. · BMFBOVESPA:OIBR3
Oi — Non-Deal Roadshow (June 2018)
52 slides from Oi's roadshow presentation, June 2018
Slide 1: Comunicado ao Mercado divulgado pela Oi
Comunicado | Lisboa | 8 de junho de 2018 Comunicado ao Mercado divulgado pela Oi A PHAROL, SGPS S.A. informa sobre o Comunicado ao Mercado divulgado pela Oi, S.A., conforme documento da empresa em anexo.

Slide 2: Non Deal Roadshow June 2018
NON DEAL ROADSHOW JUNE 2018
Slide 3: Agenda
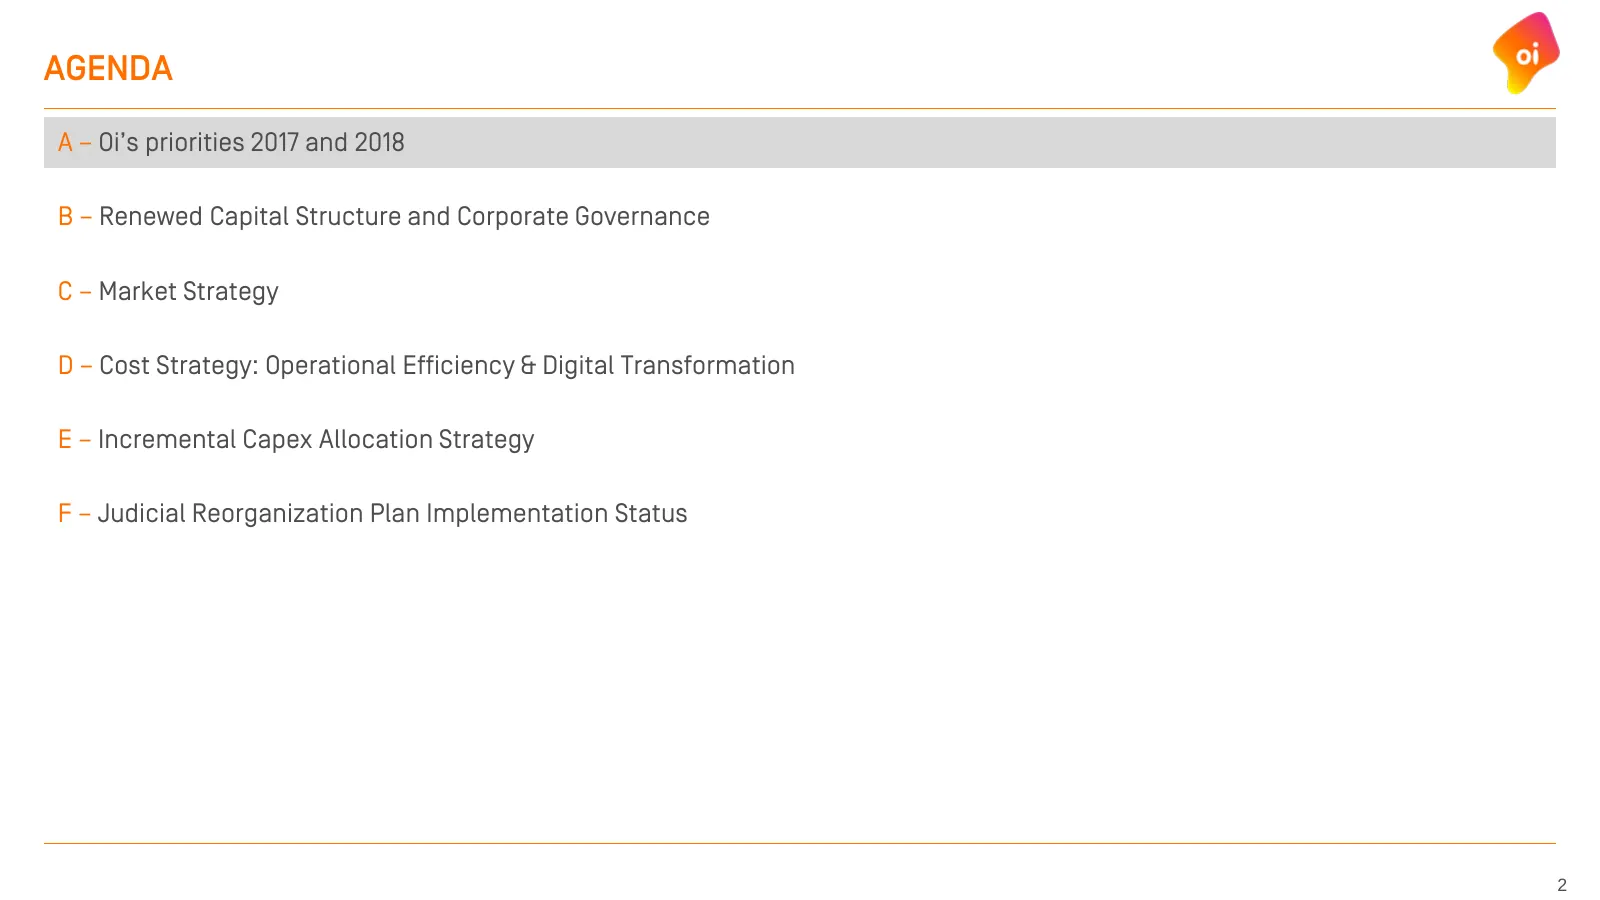
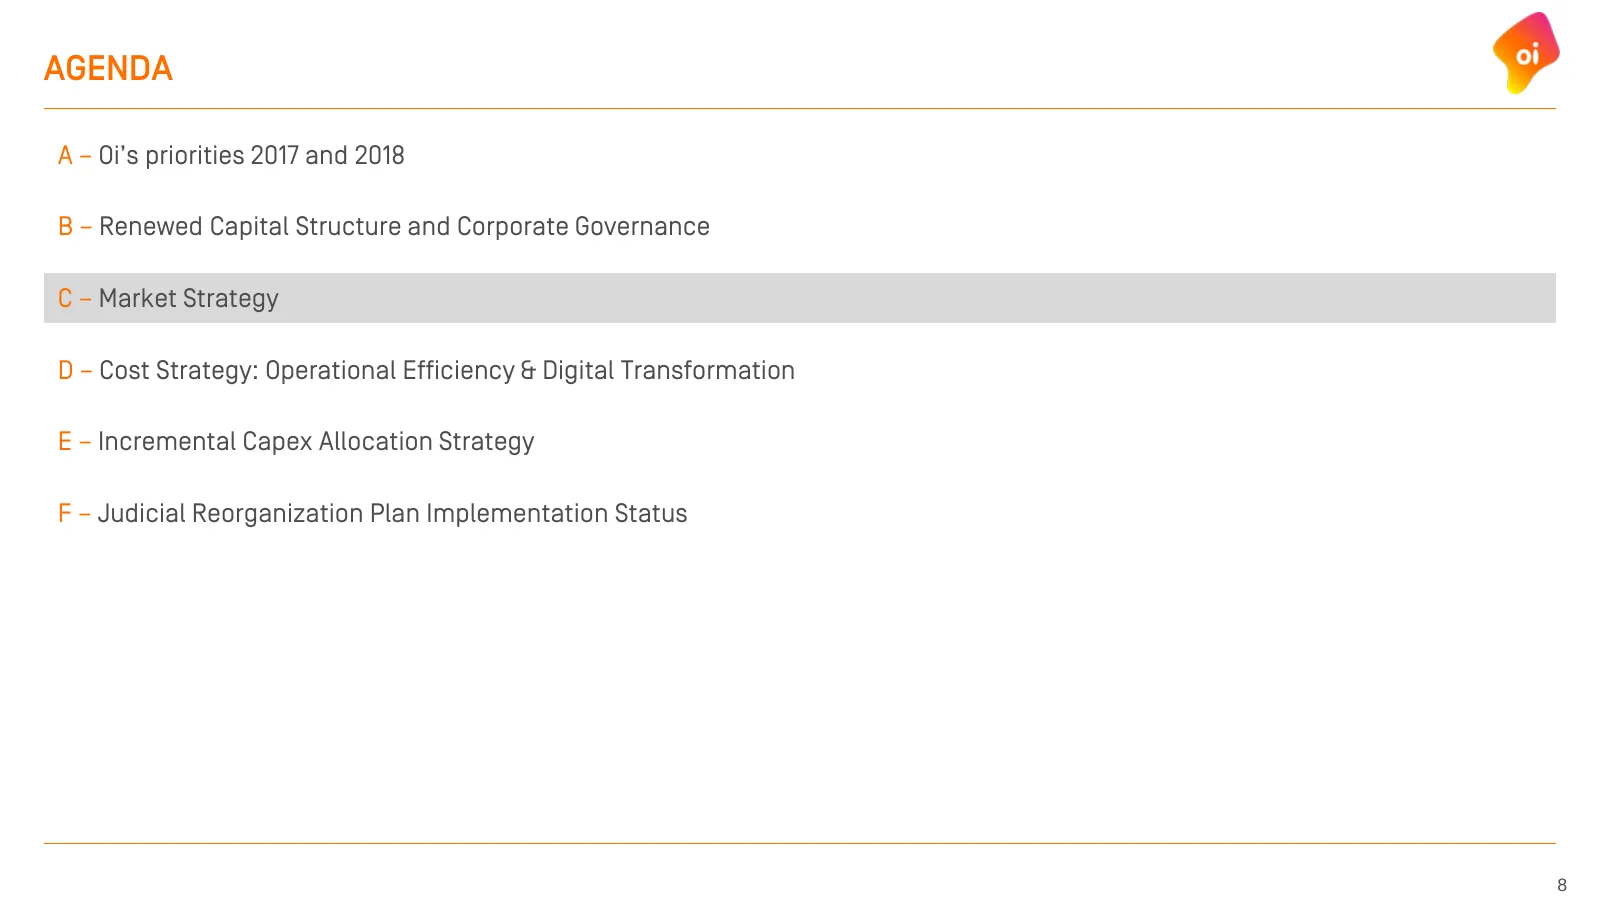
AGENDA A – Oi’s priorities 2017 and 2018 B – Renewed Capital Structure and Corporate Governance C – Market Strategy D – Cost Strategy: Operational Efficiency & Digital Transformation E – Incremental Capex Allocation Strategy F – Judicial Reorganization Plan Implementation Status 2
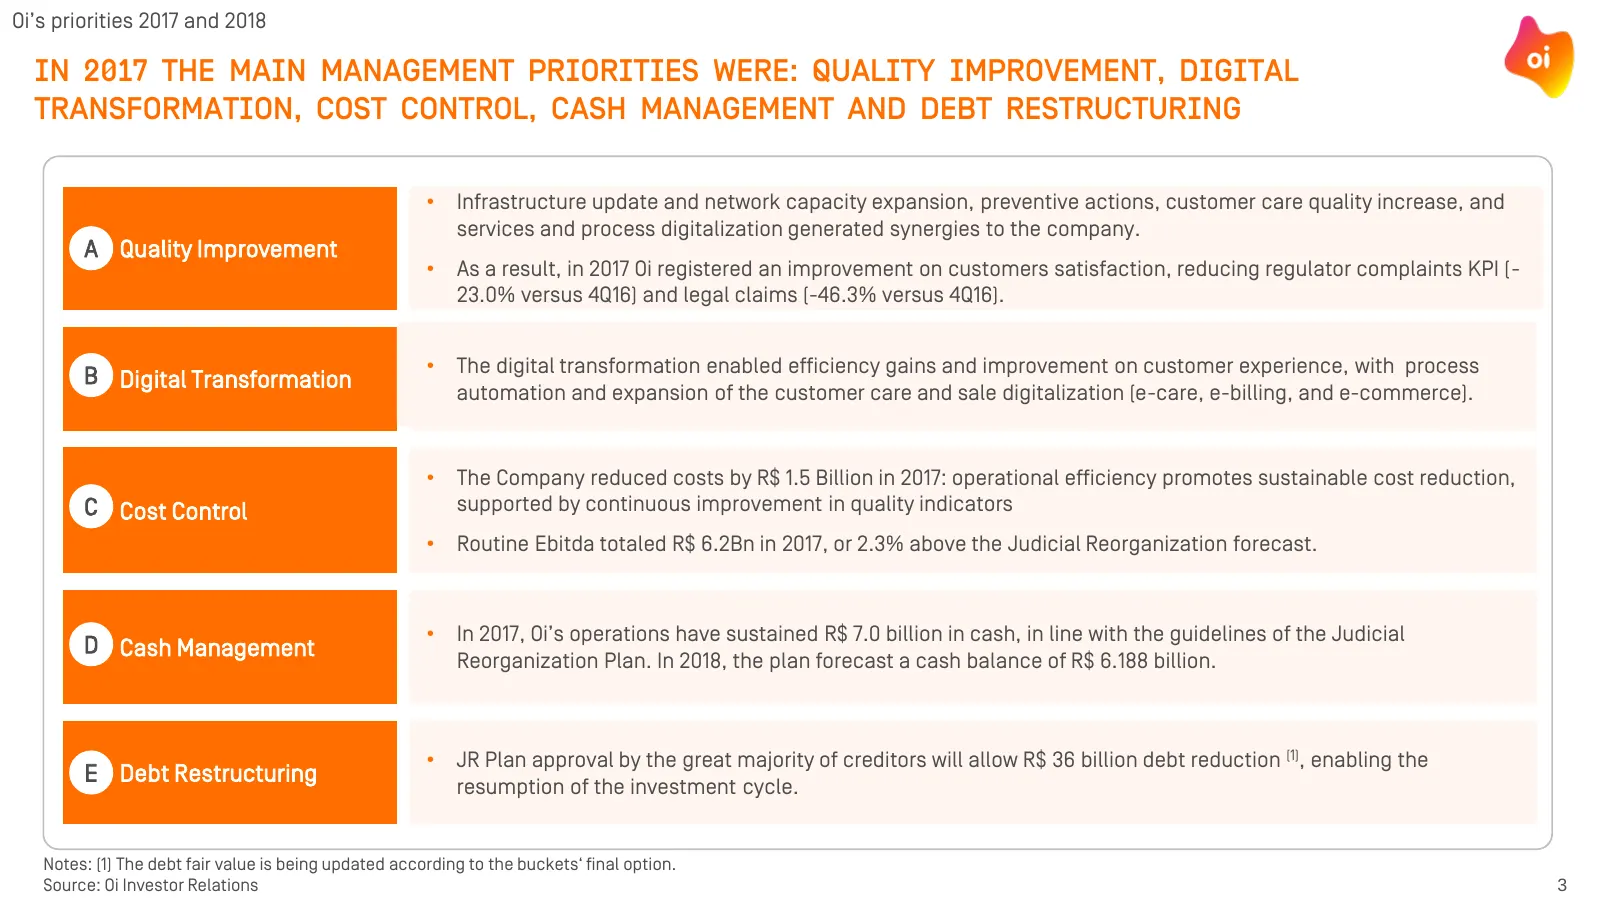
Slide 4: 2017 main management priorities
Oi’s priorities 2017 and 2018 IN 2017 THE MAIN MANAGEMENT PRIORITIES WERE: QUALITY IMPROVEMENT, DIGITAL TRANSFORMATION, COST CONTROL, CASH MANAGEMENT AND DEBT RESTRUCTURING • Infrastructure update and network capacity expansion, preventive actions, customer care quality increase, and services and pr
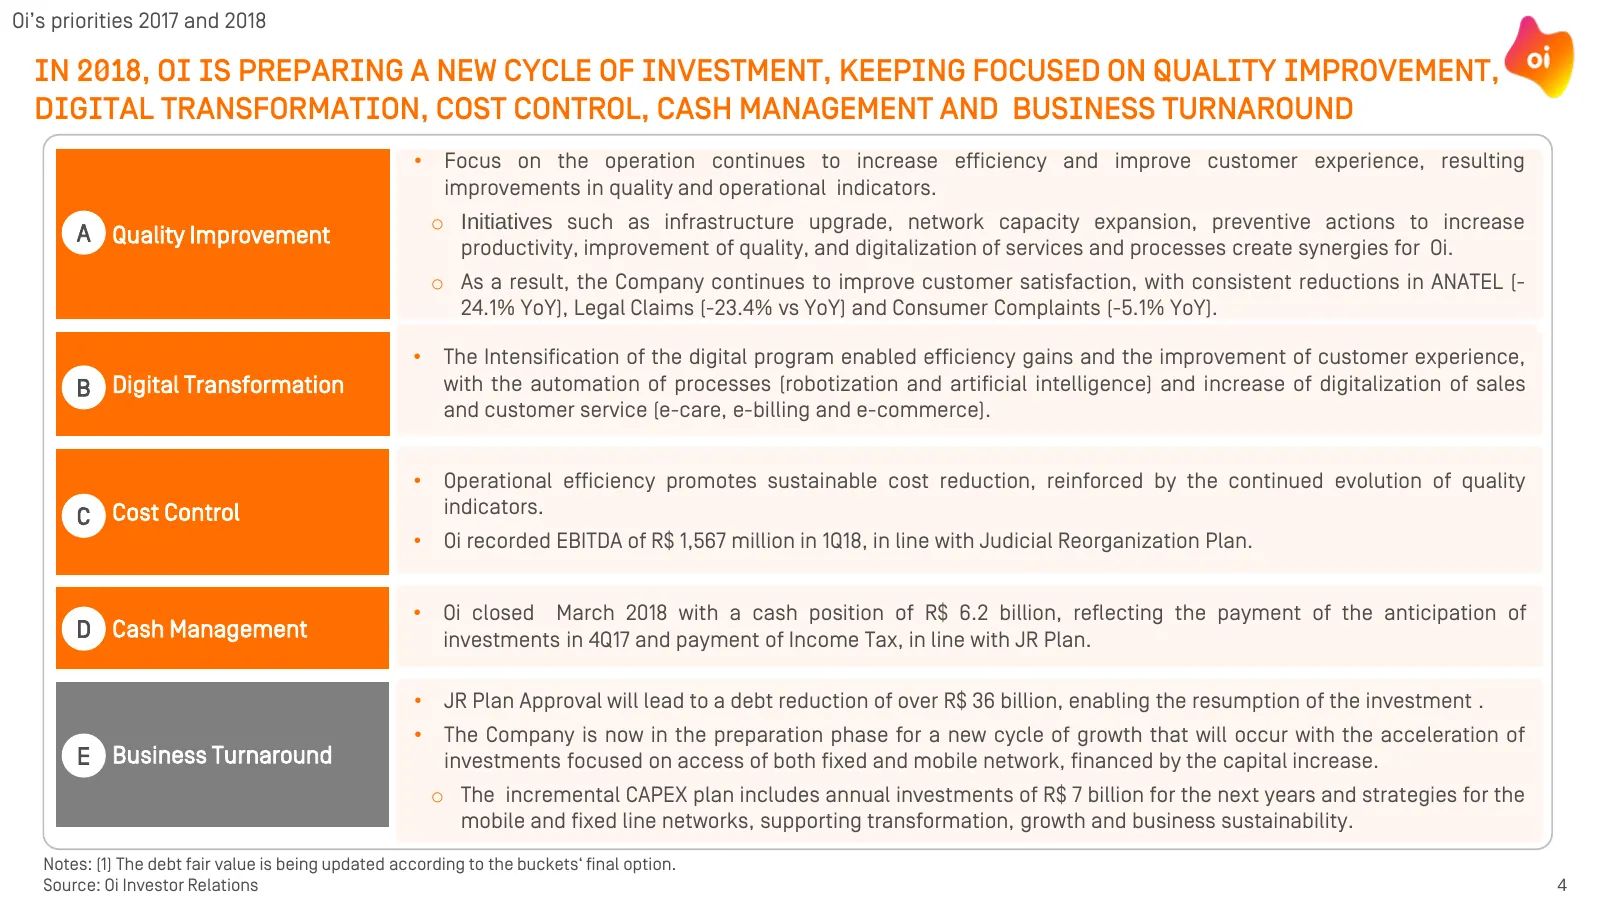
Slide 5: 2018 new cycle of investment and priorities
Oi’s priorities 2017 and 2018 IN 2018, OI IS PREPARING A NEW CYCLE OF INVESTMENT, KEEPING FOCUSED ON QUALITY IMPROVEMENT, DIGITAL TRANSFORMATION, COST CONTROL, CASH MANAGEMENT AND BUSINESS TURNAROUND • Focus on the operation continues to increase efficiency and improve customer experience, resulting
Slide 6: Agenda
AGENDA A – Oi’s priorities 2017 and 2018 B – Renewed Capital Structure and Corporate Governance C – Market Strategy D – Cost Strategy: Operational Efficiency & Digital Transformation E – Incremental Capex Allocation Strategy F – Judicial Reorganization Plan Implementation Status 5
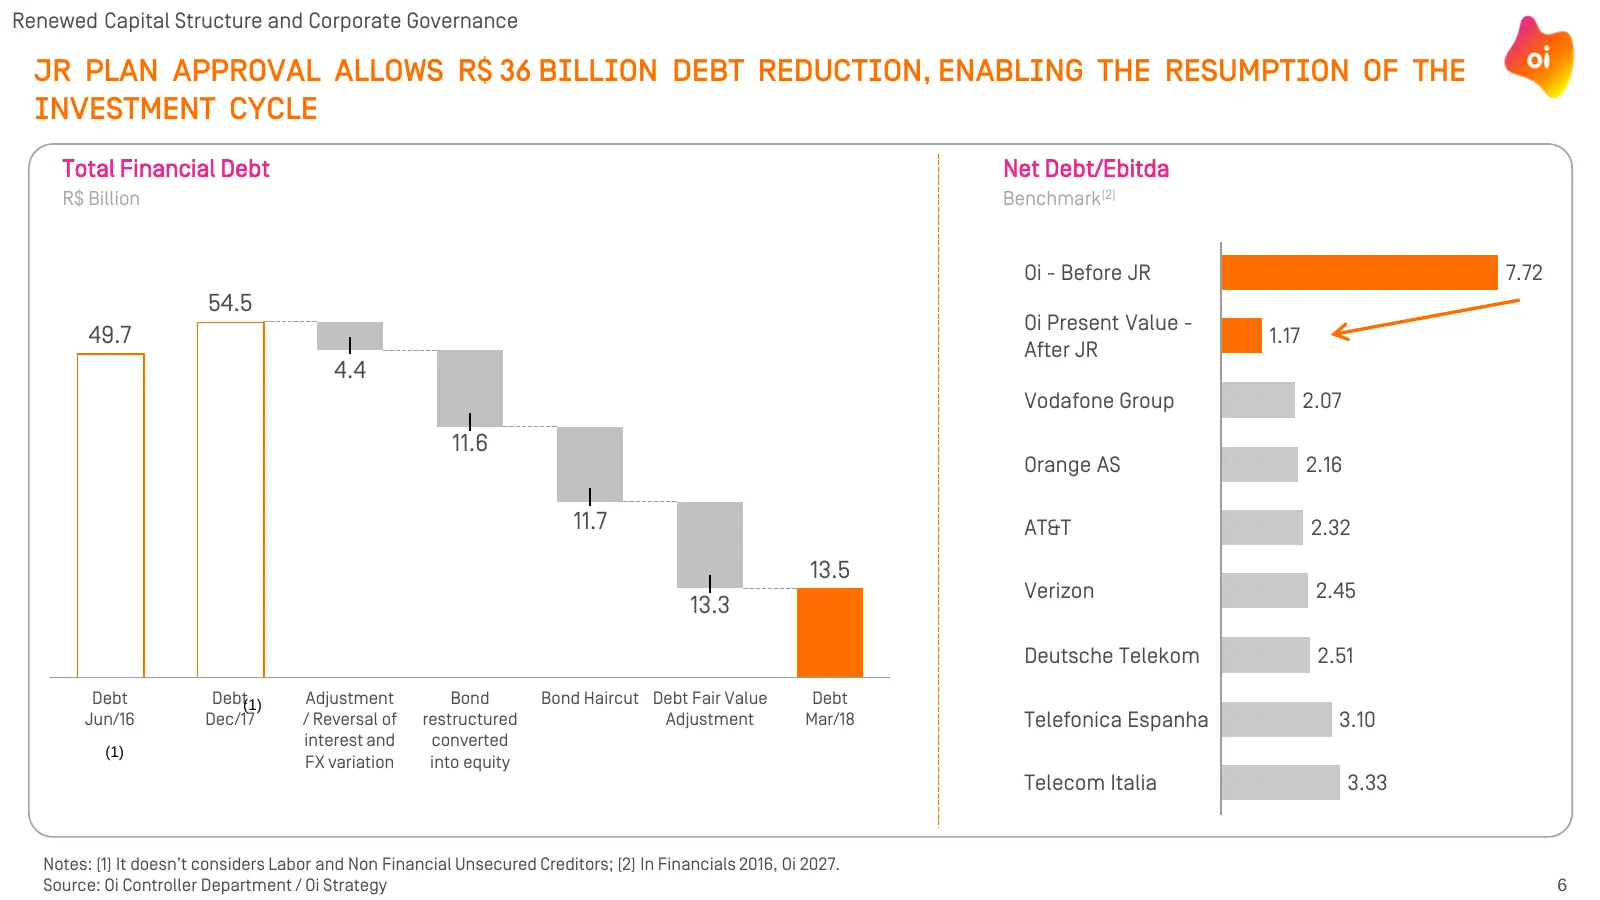
Slide 7: JR plan approval allows R$36 billion debt reduction
Renewed Capital Structure and Corporate Governance JR PLAN APPROVAL ALLOWS R$ 36 BILLION DEBT REDUCTION, ENABLING THE RESUMPTION OF THE INVESTMENT CYCLE Total Financial Debt Net Debt/Ebitda R$ Billion Benchmark(2) Oi - Before JR 7.72 54.5 Oi Present Value - 49.7 1.17 After JR 4.4 Vodafone Group 2.07
Slide 8: Approval of the Judicial Reorganization Plan
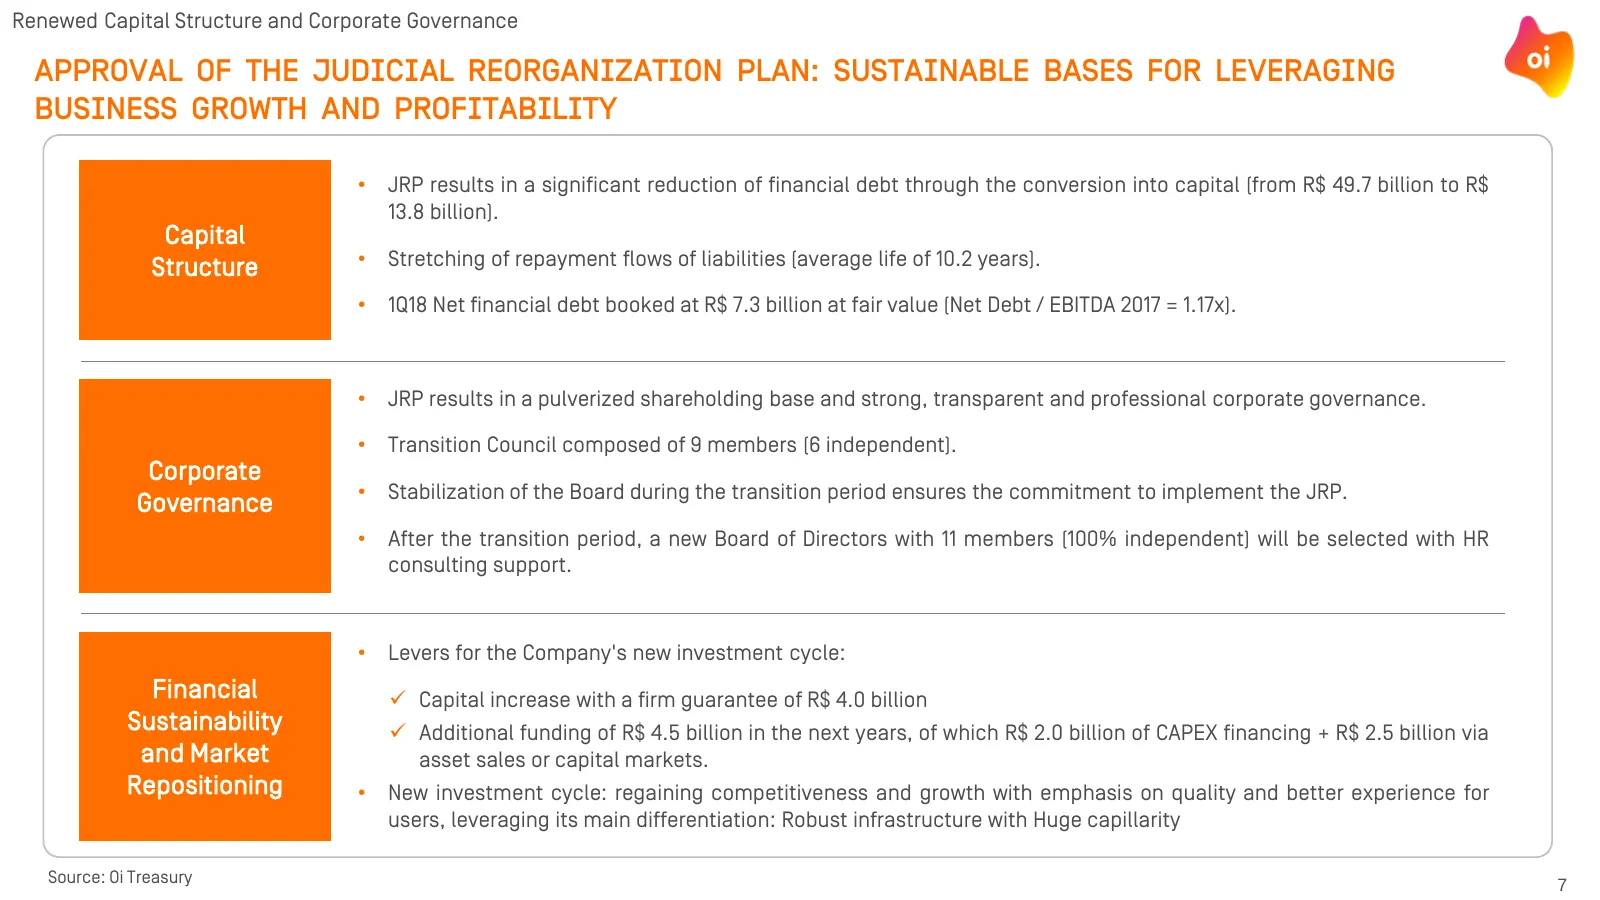
Renewed Capital Structure and Corporate Governance APPROVAL OF THE JUDICIAL REORGANIZATION PLAN: SUSTAINABLE BASES FOR LEVERAGING BUSINESS GROWTH AND PROFITABILITY • JRP results in a significant reduction of financial debt through the conversion into capital (from R$ 49.7 billion to R$ 13.8 billion)
Slide 9: Agenda
AGENDA A – Oi’s priorities 2017 and 2018 B – Renewed Capital Structure and Corporate Governance C – Market Strategy D – Cost Strategy: Operational Efficiency & Digital Transformation E – Incremental Capex Allocation Strategy F – Judicial Reorganization Plan Implementation Status 8
Slide 10: Brazilian market increasingly competitive
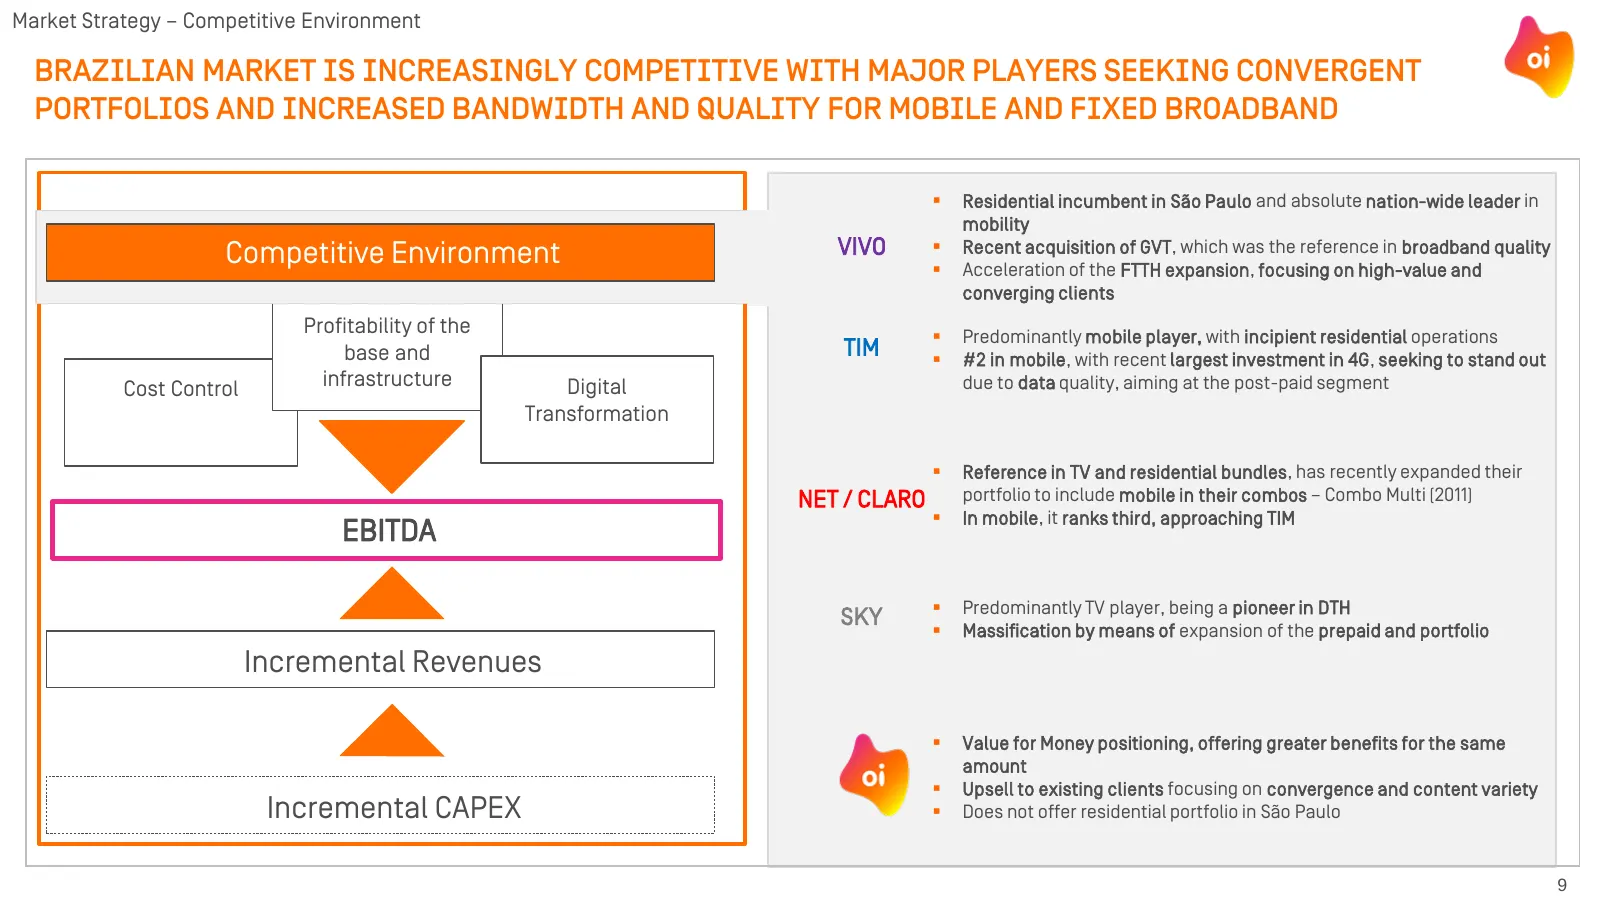
Market Strategy – Competitive Environment BRAZILIAN MARKET IS INCREASINGLY COMPETITIVE WITH MAJOR PLAYERS SEEKING CONVERGENT PORTFOLIOS AND INCREASED BANDWIDTH AND QUALITY FOR MOBILE AND FIXED BROADBAND Residential incumbent in São Paulo and absolute nation-wide leader in mobility Competitive Envi
Slide 11: Oi's 4G/3G coverage gap and market share reduction
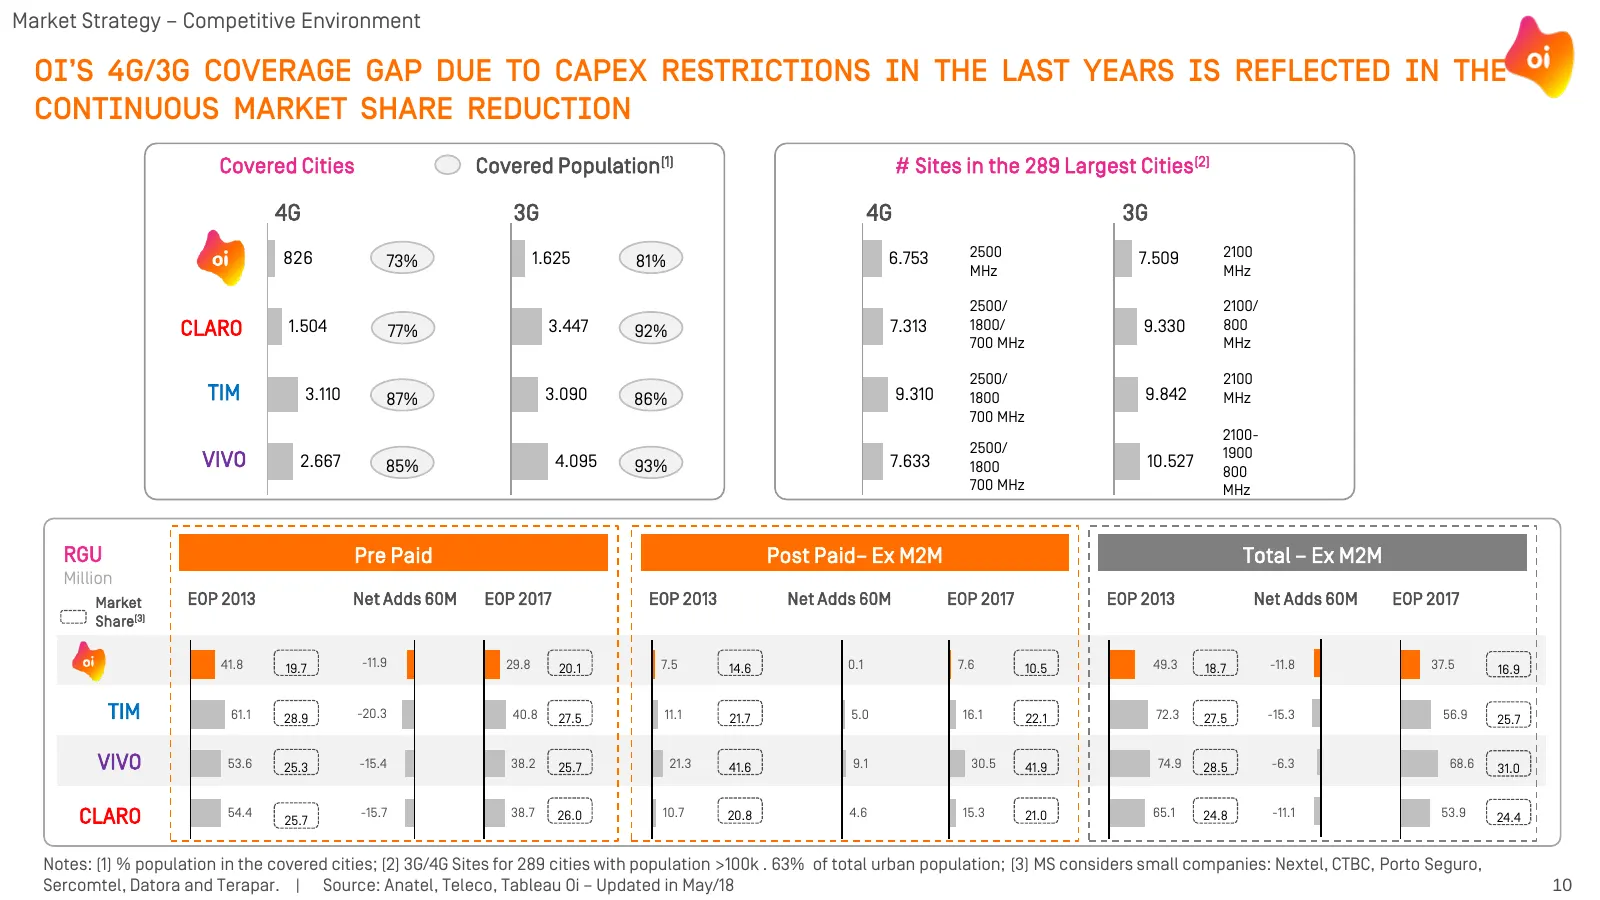
Market Strategy – Competitive Environment OI’S 4G/3G COVERAGE GAP DUE TO CAPEX RESTRICTIONS IN THE LAST YEARS IS REFLECTED IN THE CONTINUOUS MARKET SHARE REDUCTION Covered Cities Covered Population(1) # Sites in the 289 Largest Cities(2) 4G 3G 4G 3G 826 1.625 6.753 2500 7.509 2100 73% 81% MHz MHz 25
Slide 12: Oi losing market share in broadband
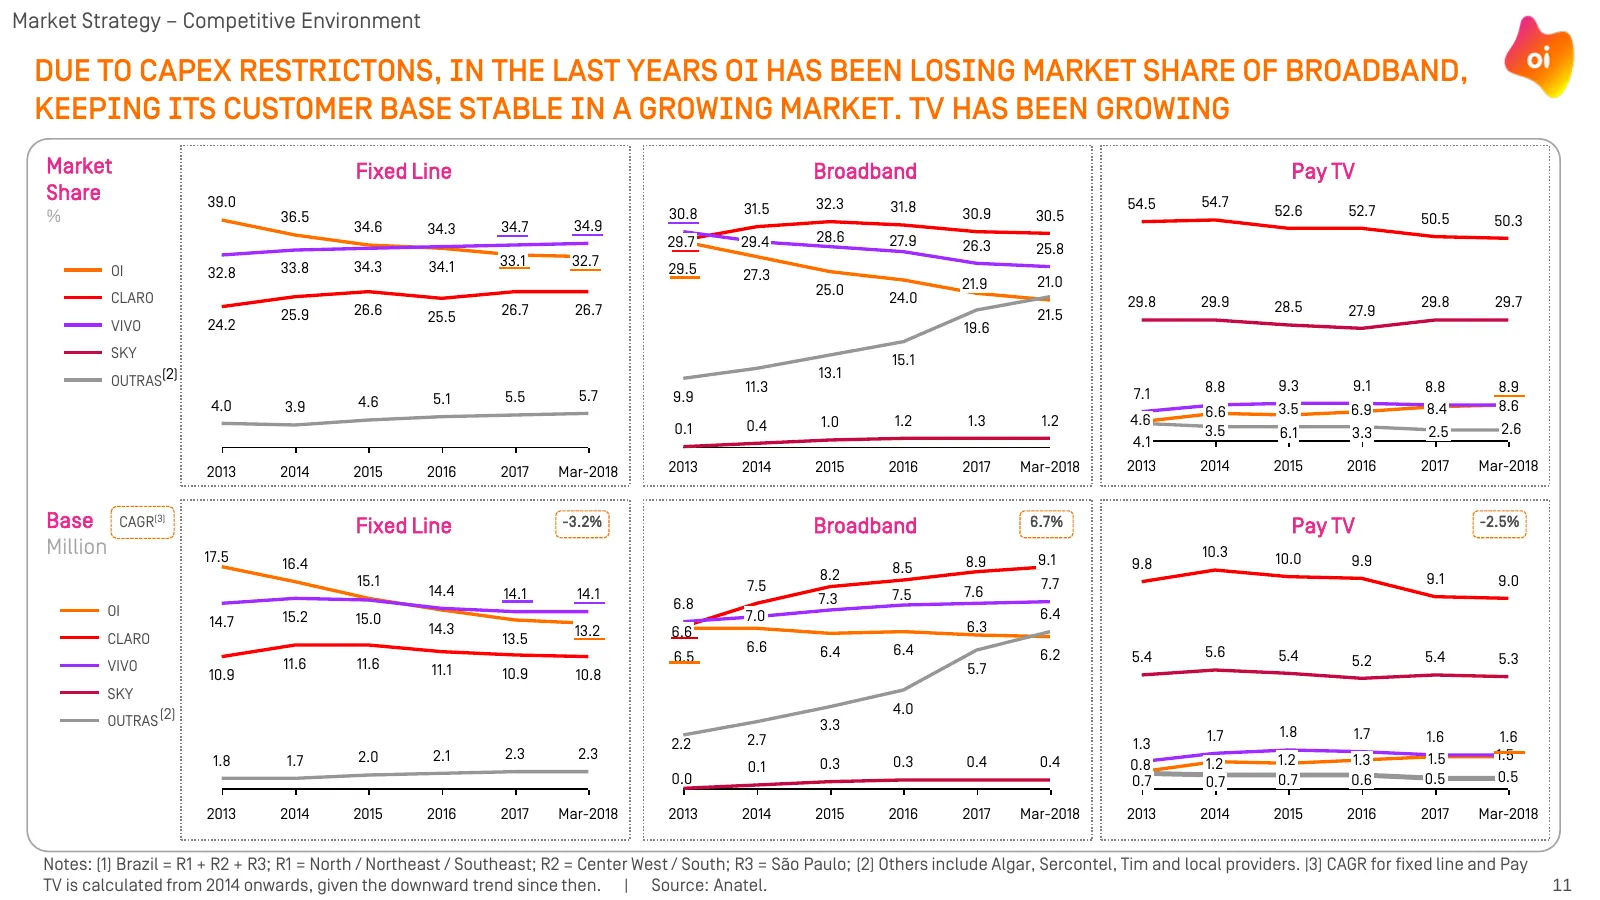
Market Strategy – Competitive Environment DUE TO CAPEX RESTRICTONS, IN THE LAST YEARS OI HAS BEEN LOSING MARKET SHARE OF BROADBAND, KEEPING ITS CUSTOMER BASE STABLE IN A GROWING MARKET. TV HAS BEEN GROWING Market Fixed Line Broadband Pay TV Share 39.0 32.3 54.5 54.7 30.8 31.5 31.8 30.9 52.6 52.7 % 3
Slide 13: Brazilian B2B market to decline despite IT growth
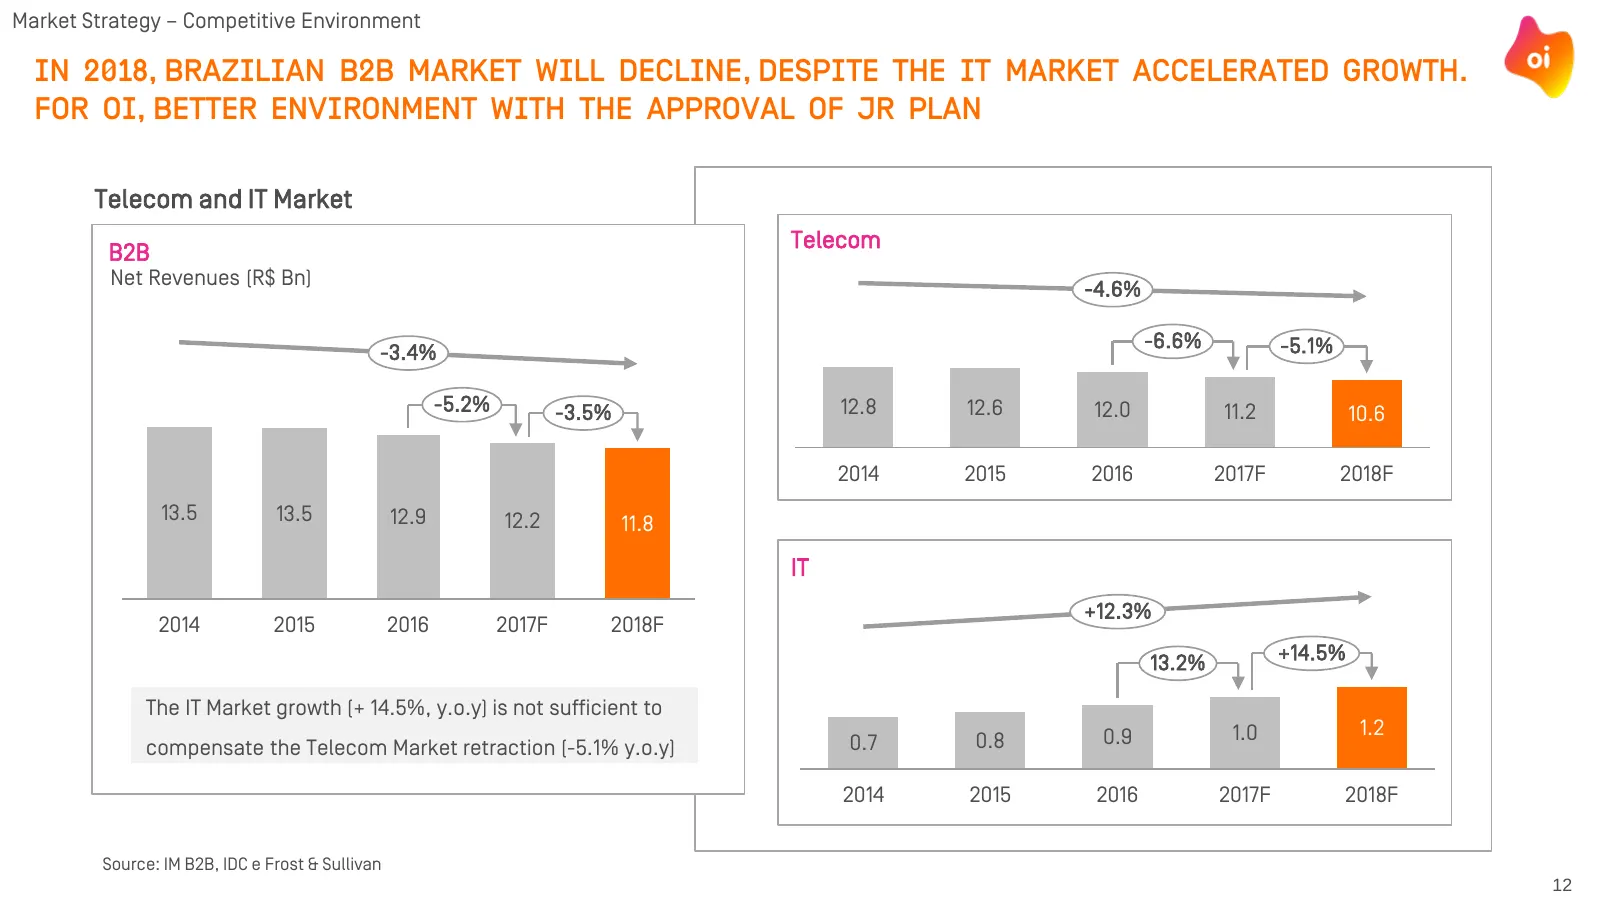
Market Strategy – Competitive Environment IN 2018, BRAZILIAN B2B MARKET WILL DECLINE, DESPITE THE IT MARKET ACCELERATED GROWTH. FOR OI, BETTER ENVIRONMENT WITH THE APPROVAL OF JR PLAN Telecom and IT Market Telecom B2B Net Revenues (R$ Bn) -4.6% -6.6% -5.1% -3.4% -5.2% -3.5% 12.8 12.6 12.0 11.2 10.6
Slide 14: Market strategy in line with global and Brazilian trends
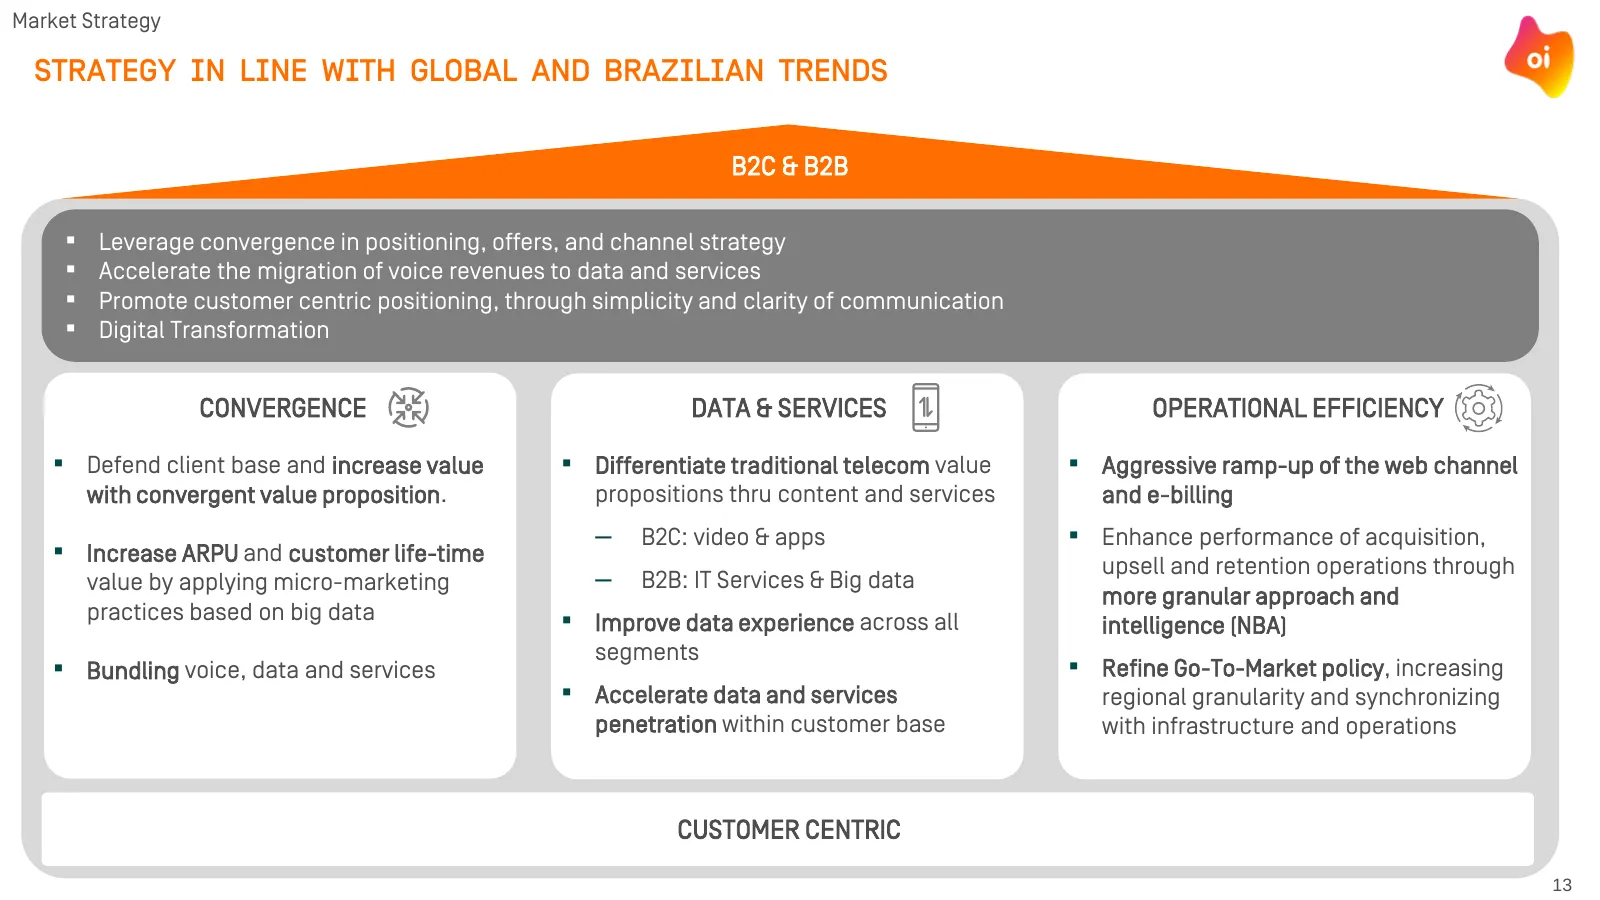
Market Strategy STRATEGY IN LINE WITH GLOBAL AND BRAZILIAN TRENDS B2C & B2B ▪ Leverage convergence in positioning, offers, and channel strategy ▪ Accelerate the migration of voice revenues to data and services ▪ Promote customer centric positioning, through simplicity and clarity of communication ▪
Slide 15: B2C strategy focuses on 6 major levers
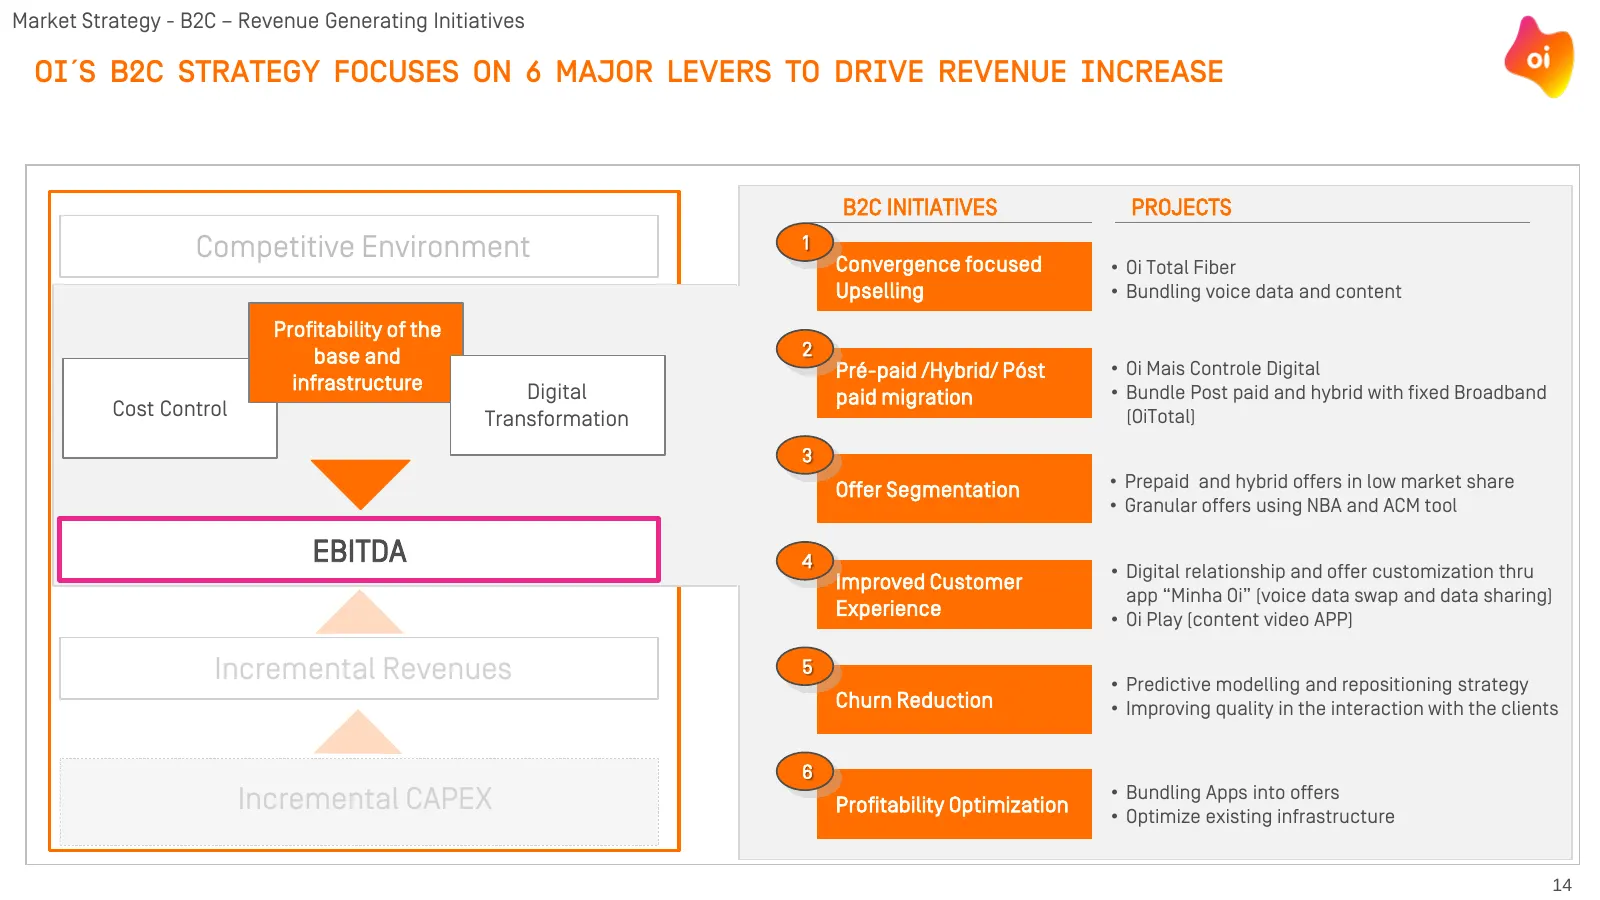
Market Strategy - B2C – Revenue Generating Initiatives OI´S B2C STRATEGY FOCUSES ON 6 MAJOR LEVERS TO DRIVE REVENUE INCREASE B2C INITIATIVES PROJECTS Competitive Environment 1 Convergence focused • Oi Total Fiber Upselling • Bundling voice data and content Profitability of the base and 2 Pré-paid /H
Slide 16: B2C first results
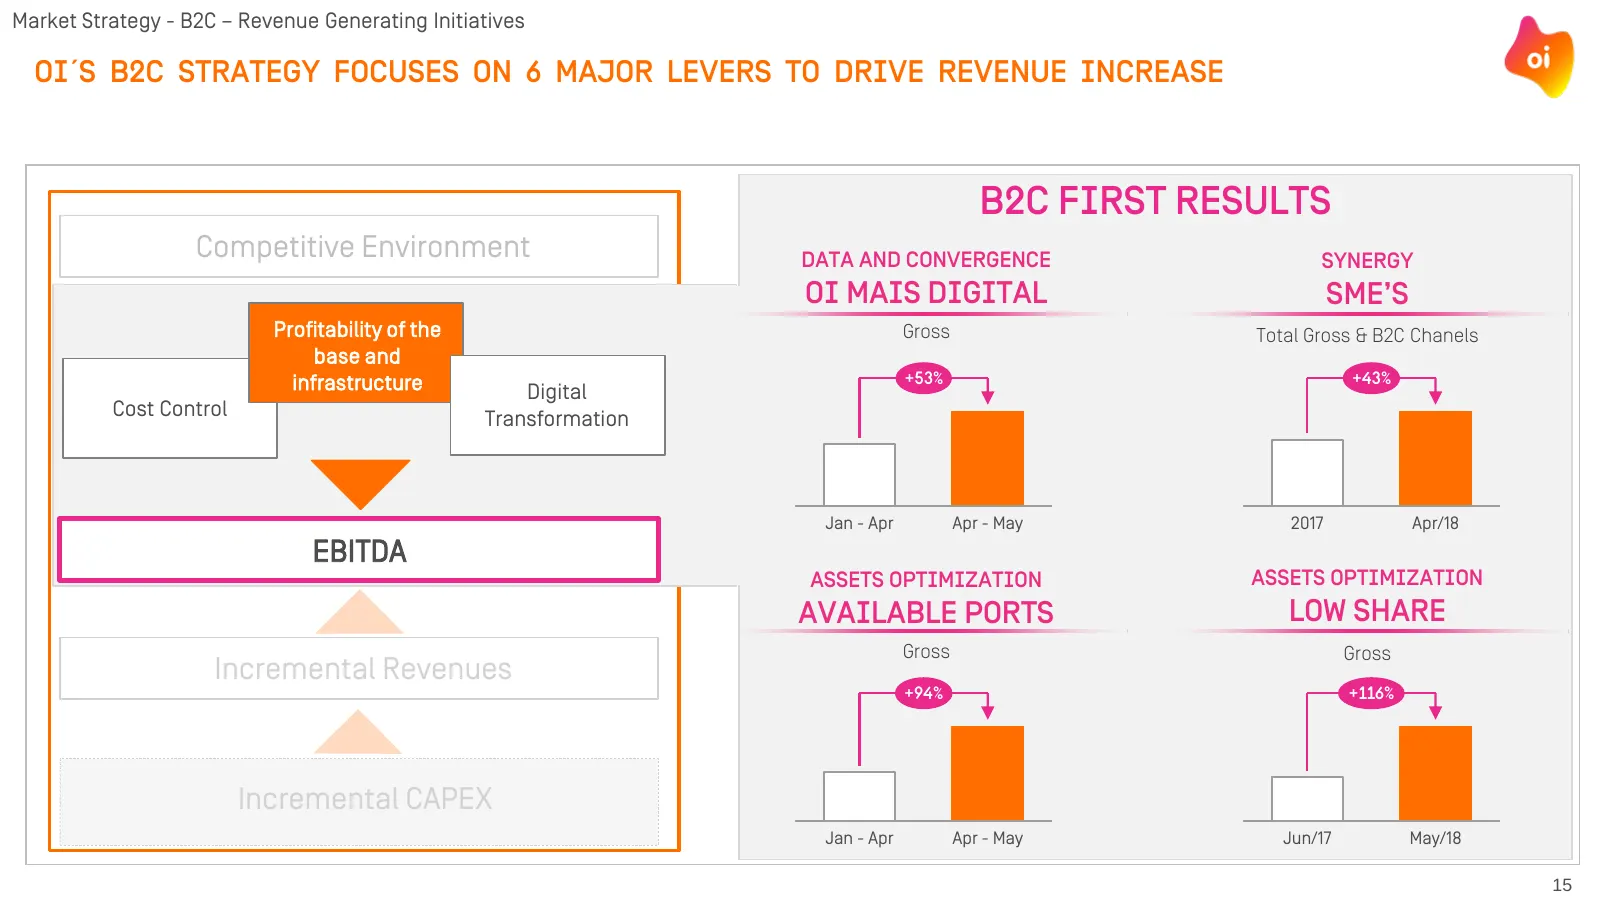
Market Strategy - B2C – Revenue Generating Initiatives OI´S B2C STRATEGY FOCUSES ON 6 MAJOR LEVERS TO DRIVE REVENUE INCREASE B2C first Results Competitive Environment Data and Convergence synergy Oi Mais Digital SME’s Profitability of the Gross Total Gross & B2C Chanels base and infrastructure +53%
Slide 17: B2B turnaround strategy based on 3 pillars
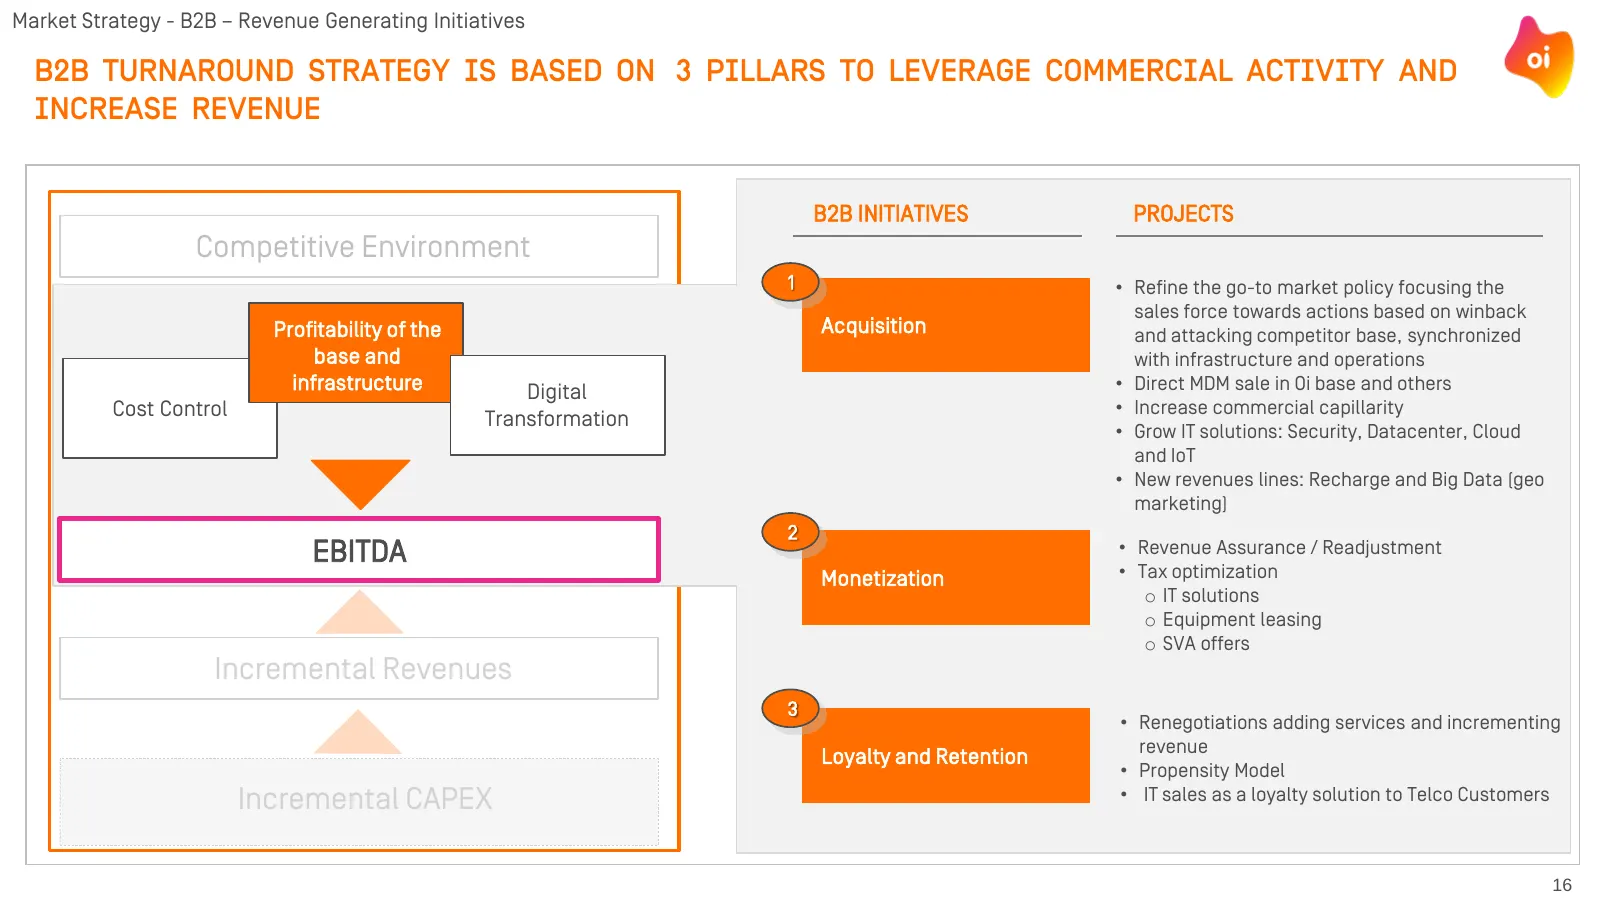
Market Strategy - B2B – Revenue Generating Initiatives B2B TURNAROUND STRATEGY IS BASED ON 3 PILLARS TO LEVERAGE COMMERCIAL ACTIVITY AND INCREASE REVENUE B2B INITIATIVES PROJECTS Competitive Environment 1 • Refine the go-to market policy focusing the sales force towards actions based on winback Prof
Slide 18: B2B first results
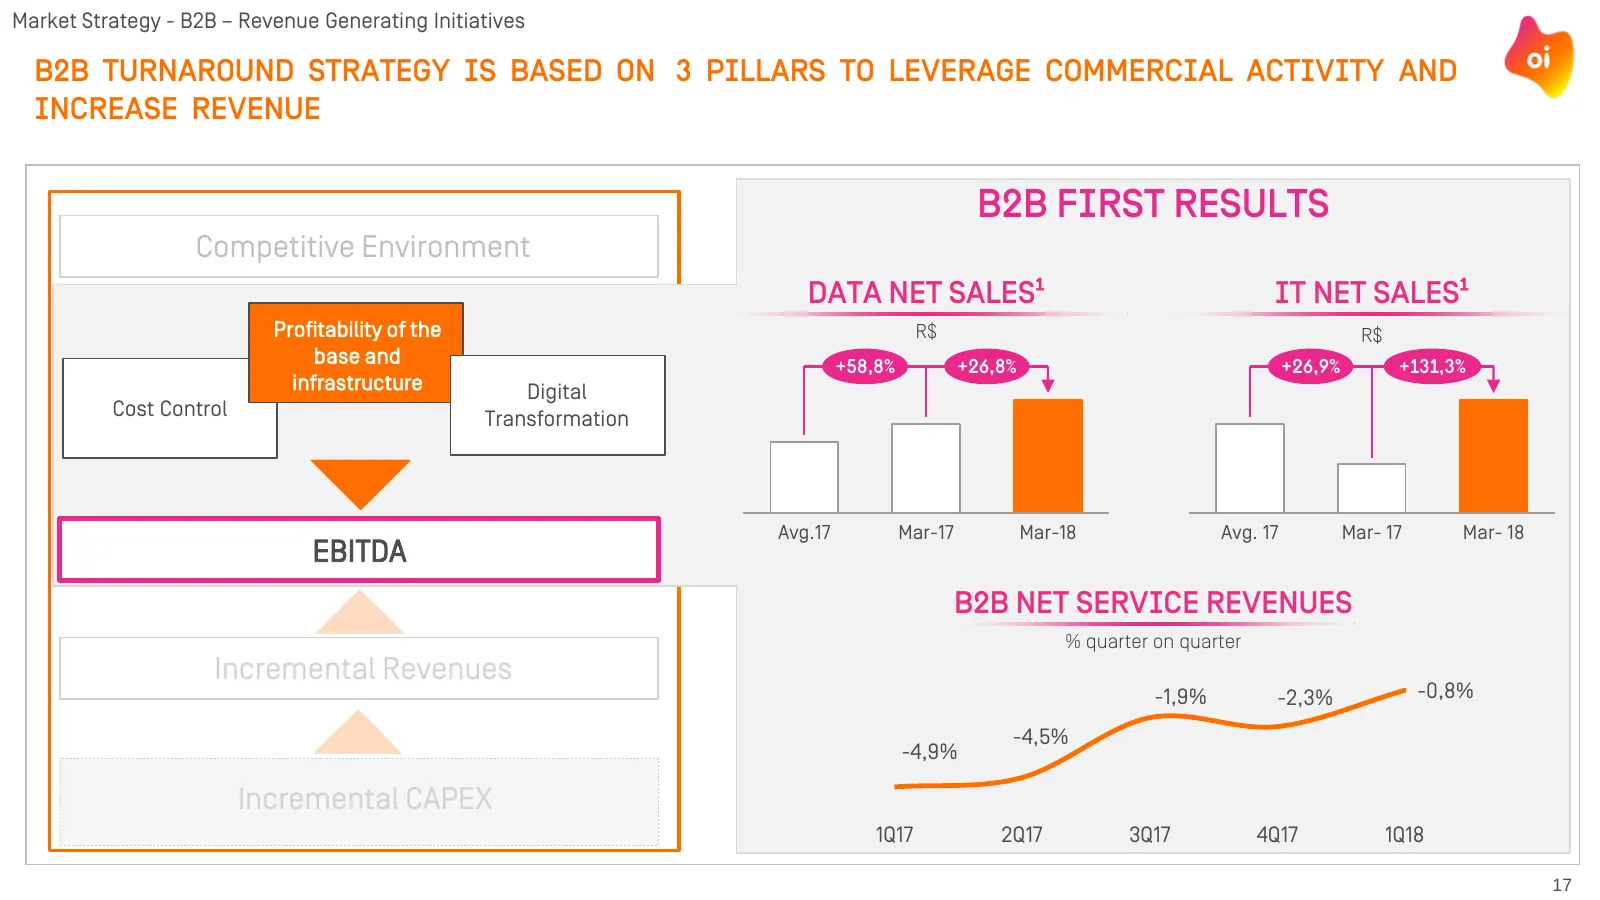
Market Strategy - B2B – Revenue Generating Initiatives B2B TURNAROUND STRATEGY IS BASED ON 3 PILLARS TO LEVERAGE COMMERCIAL ACTIVITY AND INCREASE REVENUE B2B first Results Competitive Environment Data net sales¹ It net sales¹ Profitability of the R$ R$ base and +58,8% +26,8% +26,9% +131,3% infrastru
Slide 19: Agenda
AGENDA A – Oi’s priorities 2017 and 2018 B – Renewed Capital Structure C – Market Strategy D – Cost Strategy: Operational Efficiency & Digital Transformation E – Incremental Capex Allocation Strategy F – Judicial Reorganization Plan Implementation Status 18
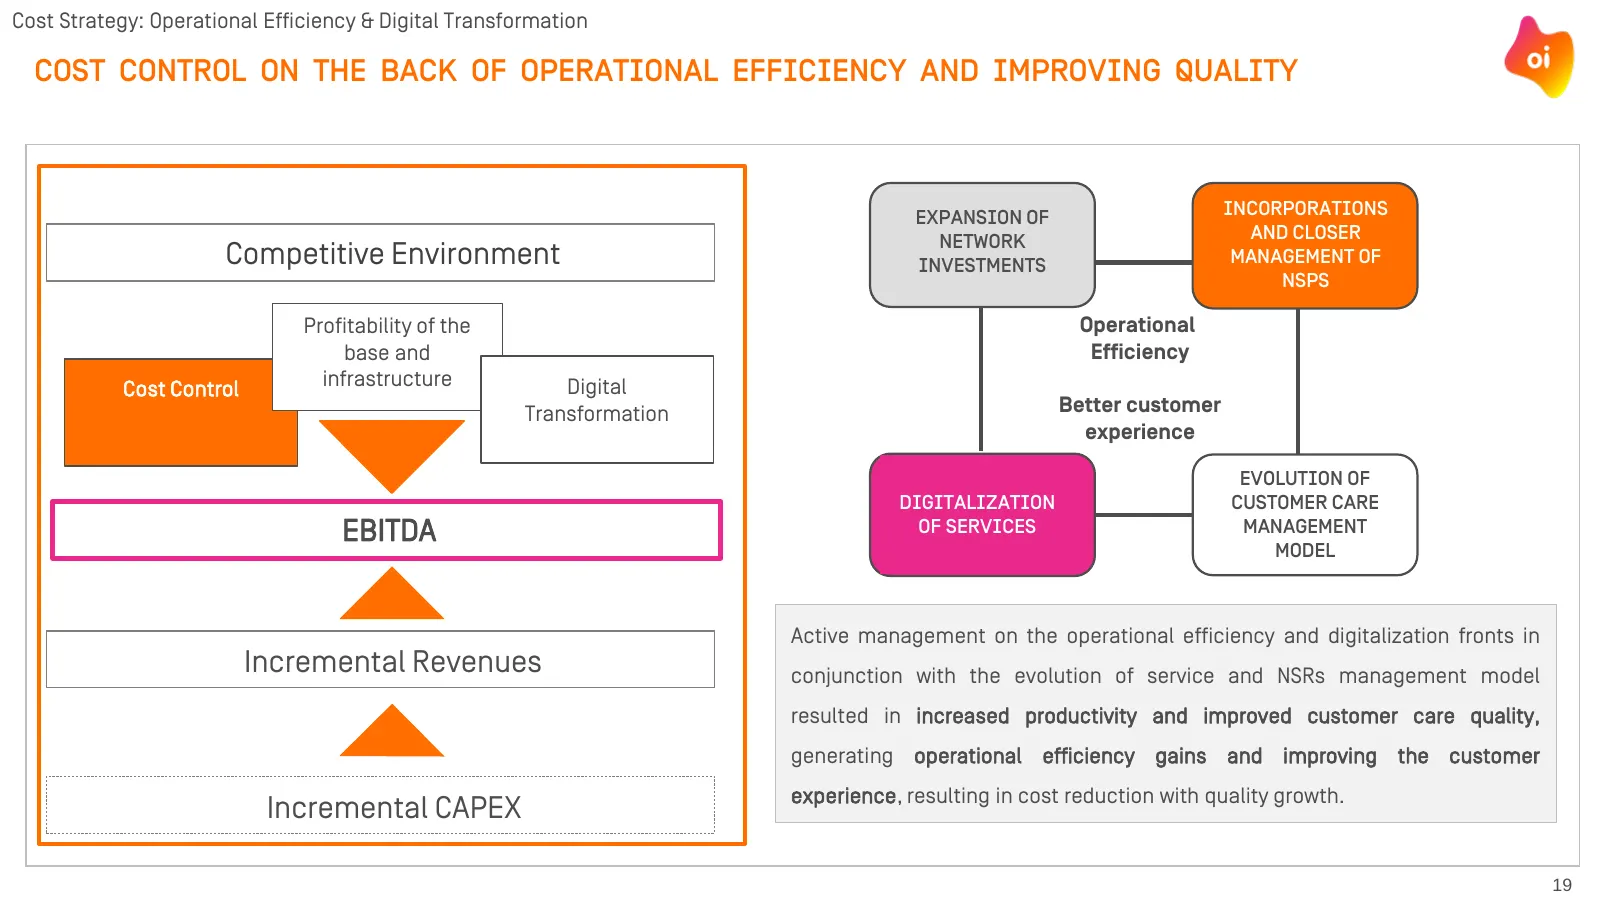
Slide 20: Cost control through operational efficiency and quality
Cost Strategy: Operational Efficiency & Digital Transformation COST CONTROL ON THE BACK OF OPERATIONAL EFFICIENCY AND IMPROVING quality Expansion of Incorporations network and closer Competitive Environment investments management of NSPs Profitability of the Operational base and Efficiency Cost Cont
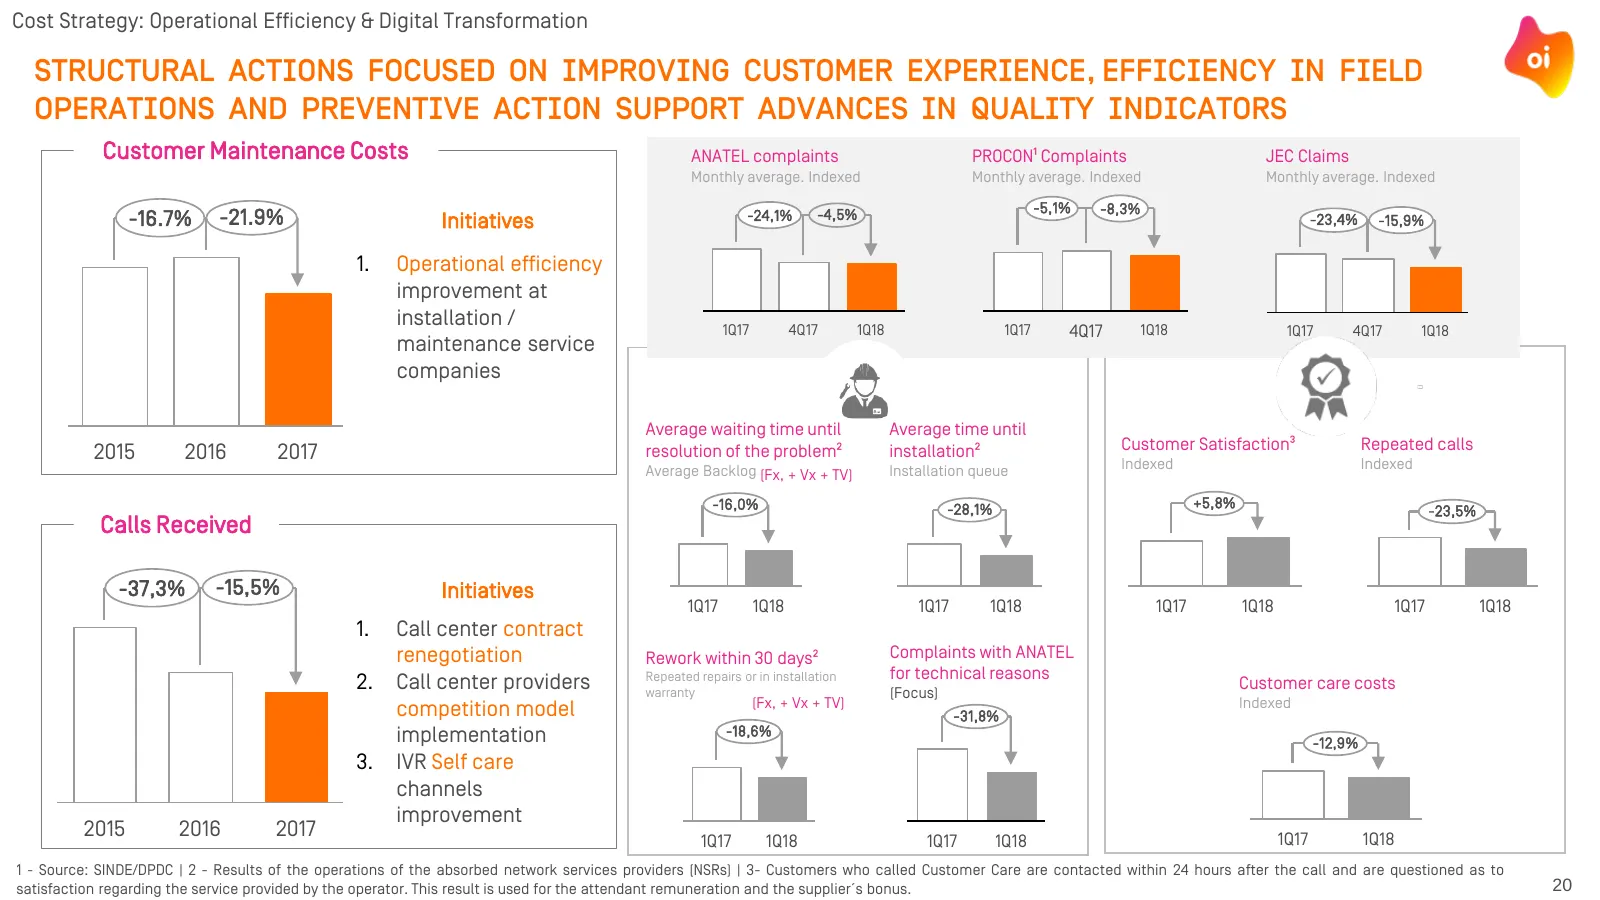
Slide 21: Structural actions improving customer experience and efficiency
Cost Strategy: Operational Efficiency & Digital Transformation STRUCTURAL ACTIONS FOCUSED ON IMPROVING CUSTOMER EXPERIENCE, EFFICIENCY IN FIELD OPERATIONS AND PREVENTIVE ACTION SUPPORT ADVANCES IN QUALITY INDICATORS Customer Maintenance Costs ANATEL complaints PROCON¹ Complaints JEC Claims Monthly a
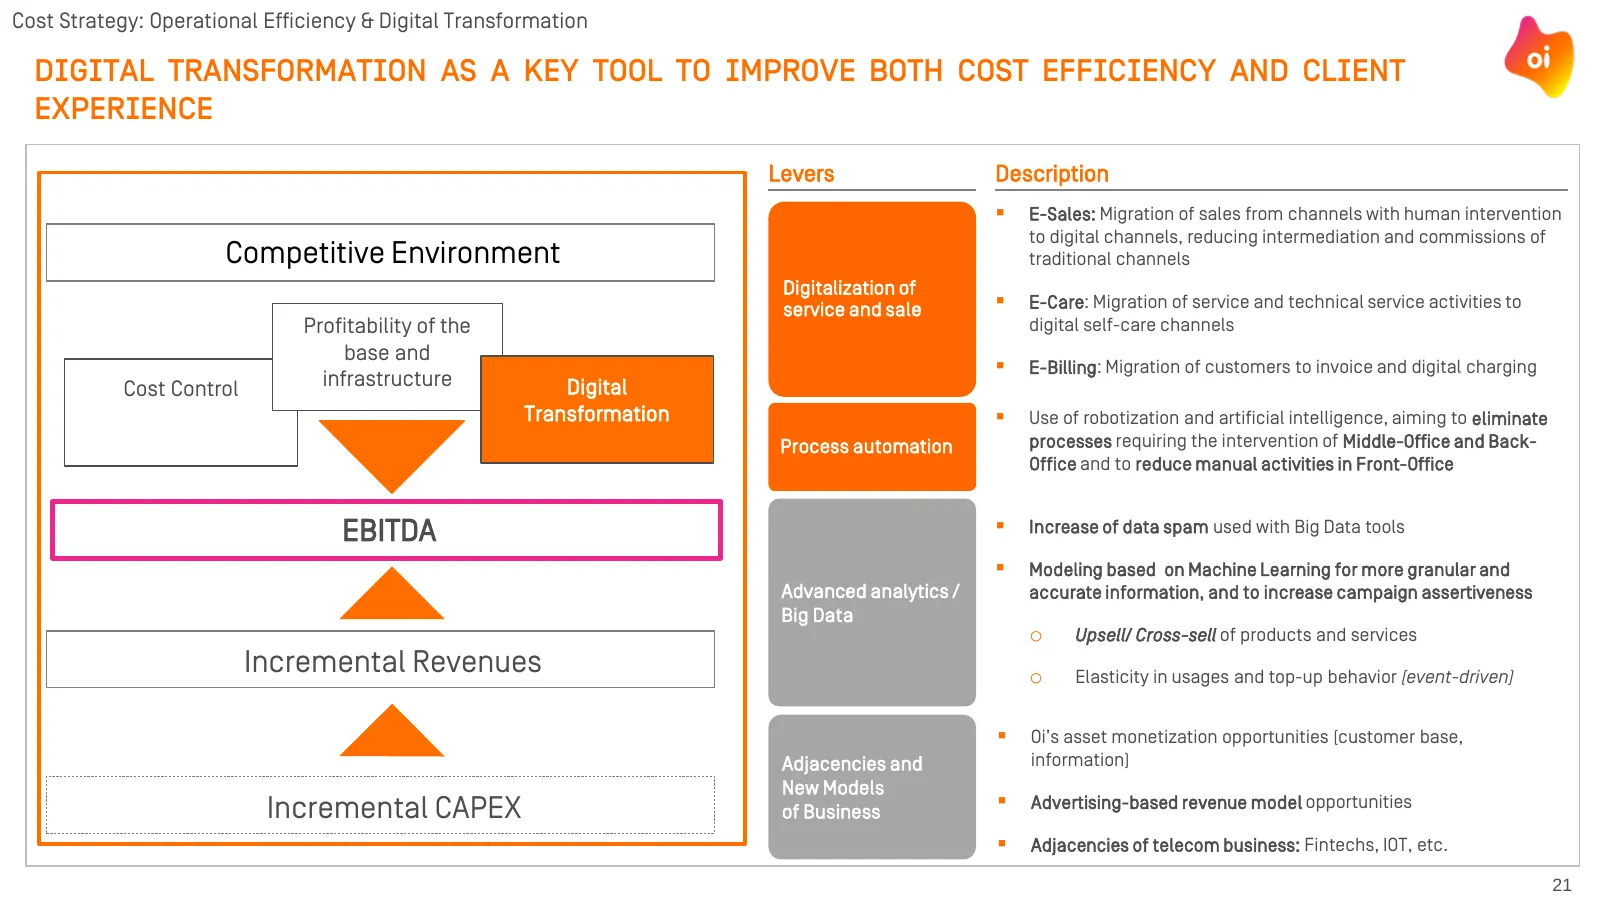
Slide 22: Digital transformation to improve cost efficiency and client experience
Cost Strategy: Operational Efficiency & Digital Transformation DIGITAL TRANSFORMATION AS A KEY TOOL TO IMPROVE BOTH COST EFFICIENCY AND CLIENT EXPERIENCE Levers Description E-Sales: Migration of sales from channels with human intervention to digital channels, reducing intermediation and commission
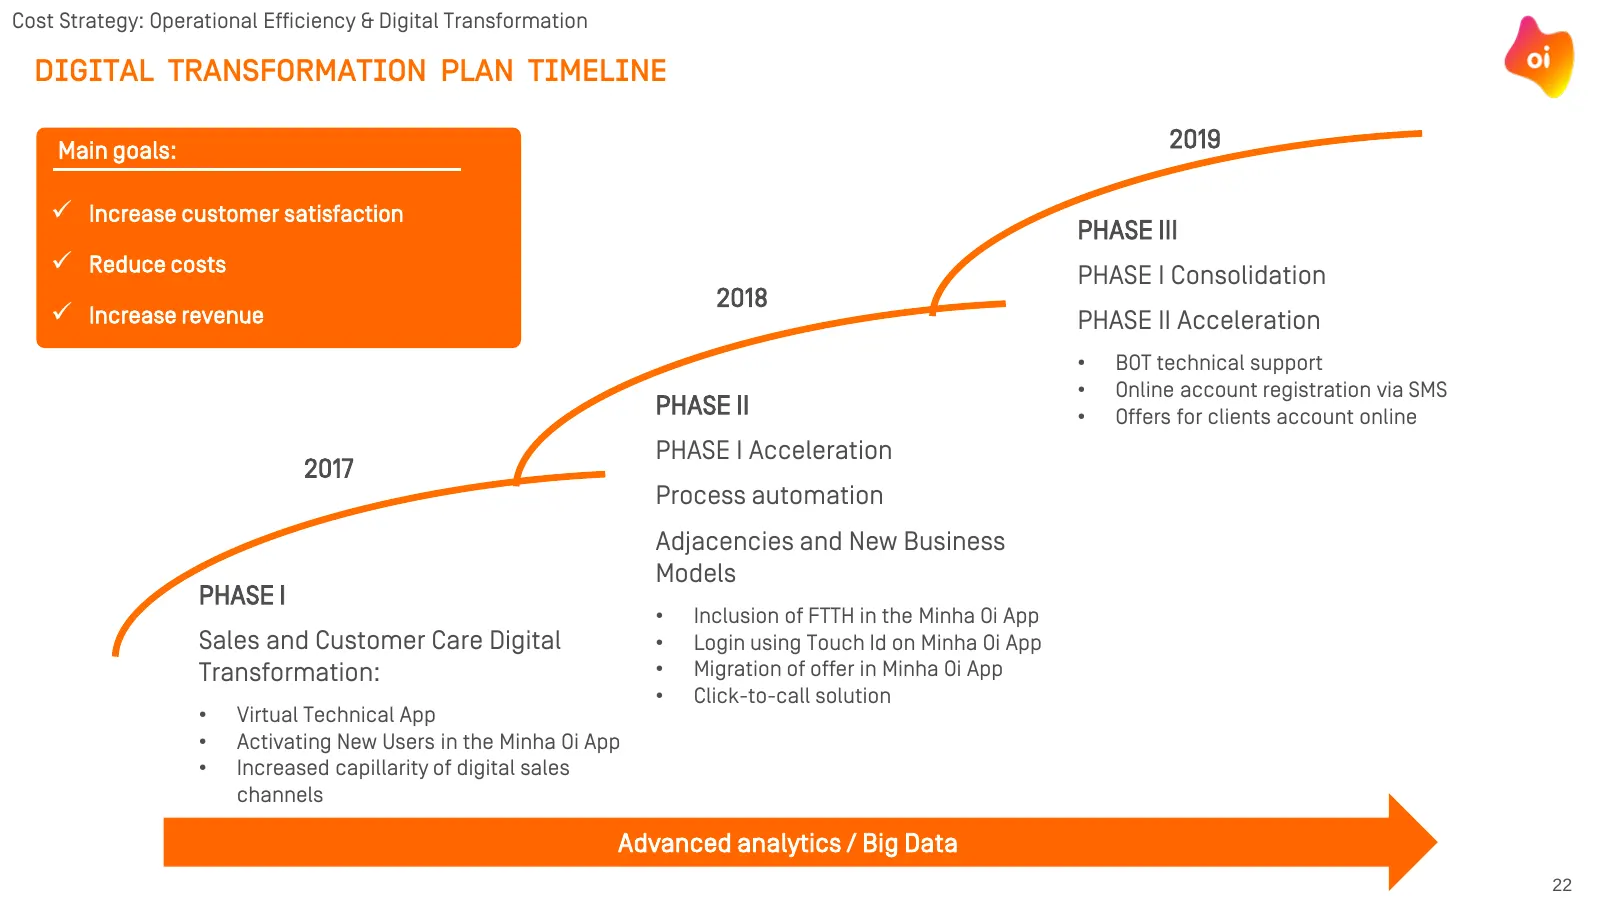
Slide 23: Digital transformation plan timeline
Cost Strategy: Operational Efficiency & Digital Transformation DIGITAL TRANSFORMATION PLAN TIMELINE Main goals: 2019 Increase customer satisfaction PHASE III Reduce costs PHASE I Consolidation Foco atual 2018 Increase revenue PHASE II Acceleration • BOT technical support • Online account regis
Slide 24: Agenda
AGENDA A – Oi’s priorities 2017 and 2018 B – Renewed Capital Structure C – Market Strategy D – Cost Strategy: Operational Efficiency & Digital Transformation E – Incremental Capex Allocation Strategy F – Judicial Reorganization Plan Implementation Status 23
Slide 25: JR plan foresees revenue growth from incremental capex
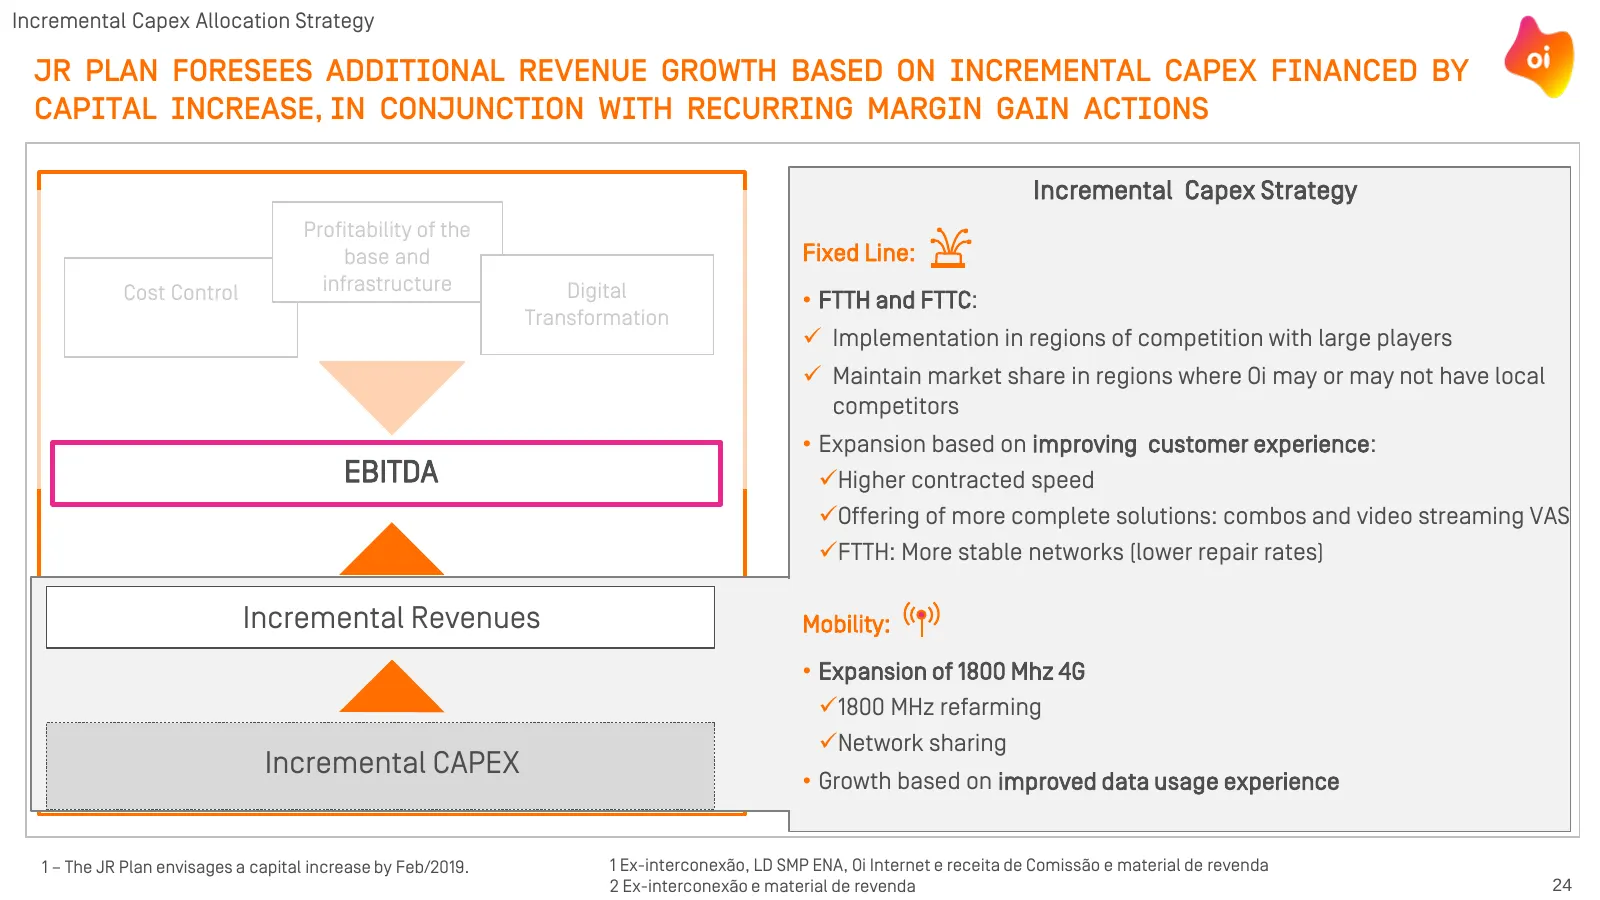
Incremental Capex Allocation Strategy JR PLAN FORESEES ADDITIONAL REVENUE GROWTH BASED ON INCREMENTAL CAPEX FINANCED BY CAPITAL INCREASE, IN CONJUNCTION WITH RECURRING MARGIN GAIN ACTIONS Incremental Capex Strategy Profitability of the base and Fixed Line: Cost Control infrastructure Digital • FTTH
Slide 26: Oi's nationwide coverage and robust infrastructure
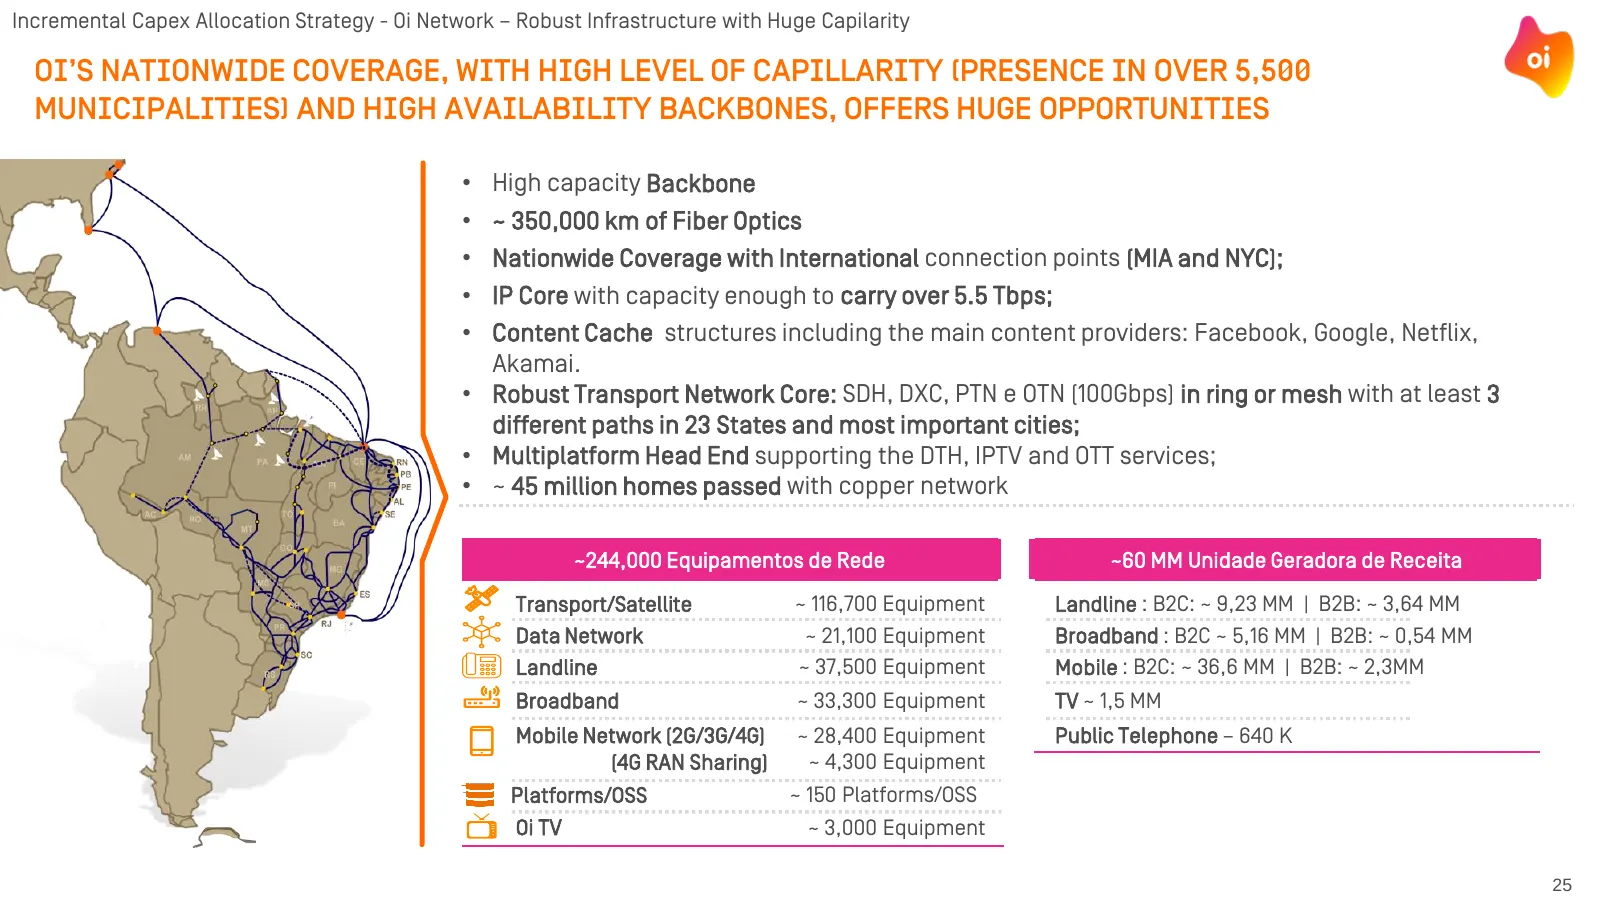
Incremental Capex Allocation Strategy - Oi Network – Robust Infrastructure with Huge Capilarity OI’S NATIONWIDE COVERAGE, WITH HIGH LEVEL OF CAPILLARITY (PRESENCE IN OVER 5,500 MUNICIPALITIES) AND HIGH AVAILABILITY BACKBONES, OFFERS HUGE OPPORTUNITIES • High capacity Backbone • ~ 350,000 km of Fiber
Slide 27: Investments in network core prepare incremental capex plan
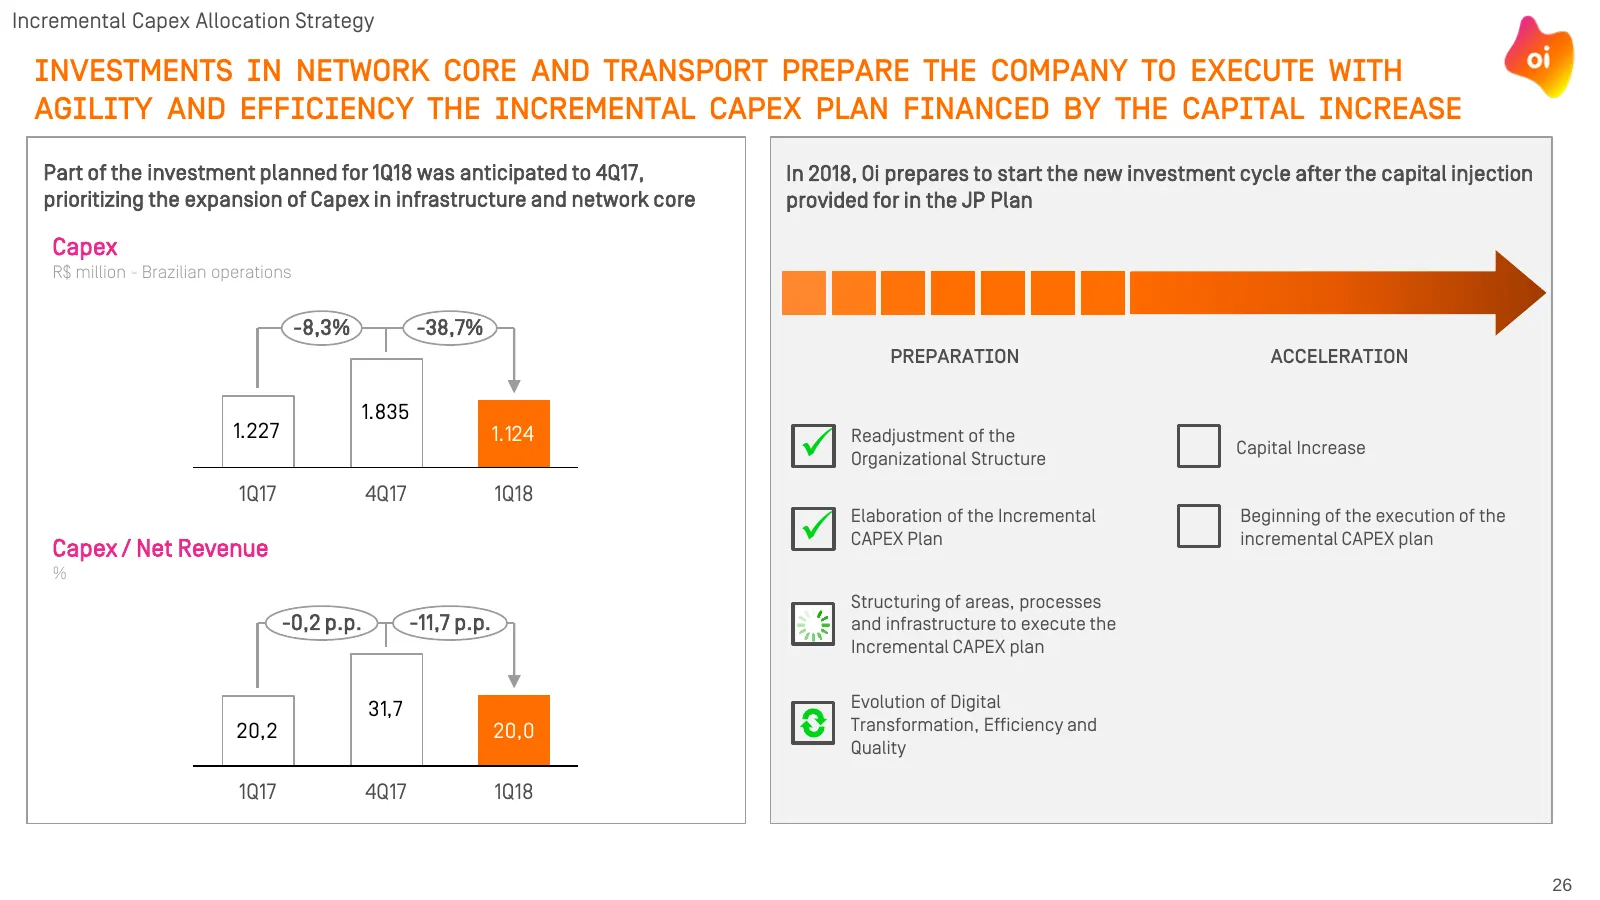
Incremental Capex Allocation Strategy INVESTMENTS IN NETWORK CORE AND TRANSPORT PREPARE THE COMPANY TO EXECUTE WITH AGILITY AND EFFICIENCY THE INCREMENTAL CAPEX PLAN FINANCED BY THE CAPITAL INCREASE Part of the investment planned for 1Q18 was anticipated to 4Q17, In 2018, Oi prepares to start the ne
Slide 28: Capital increase to reduce competitive and quality gaps
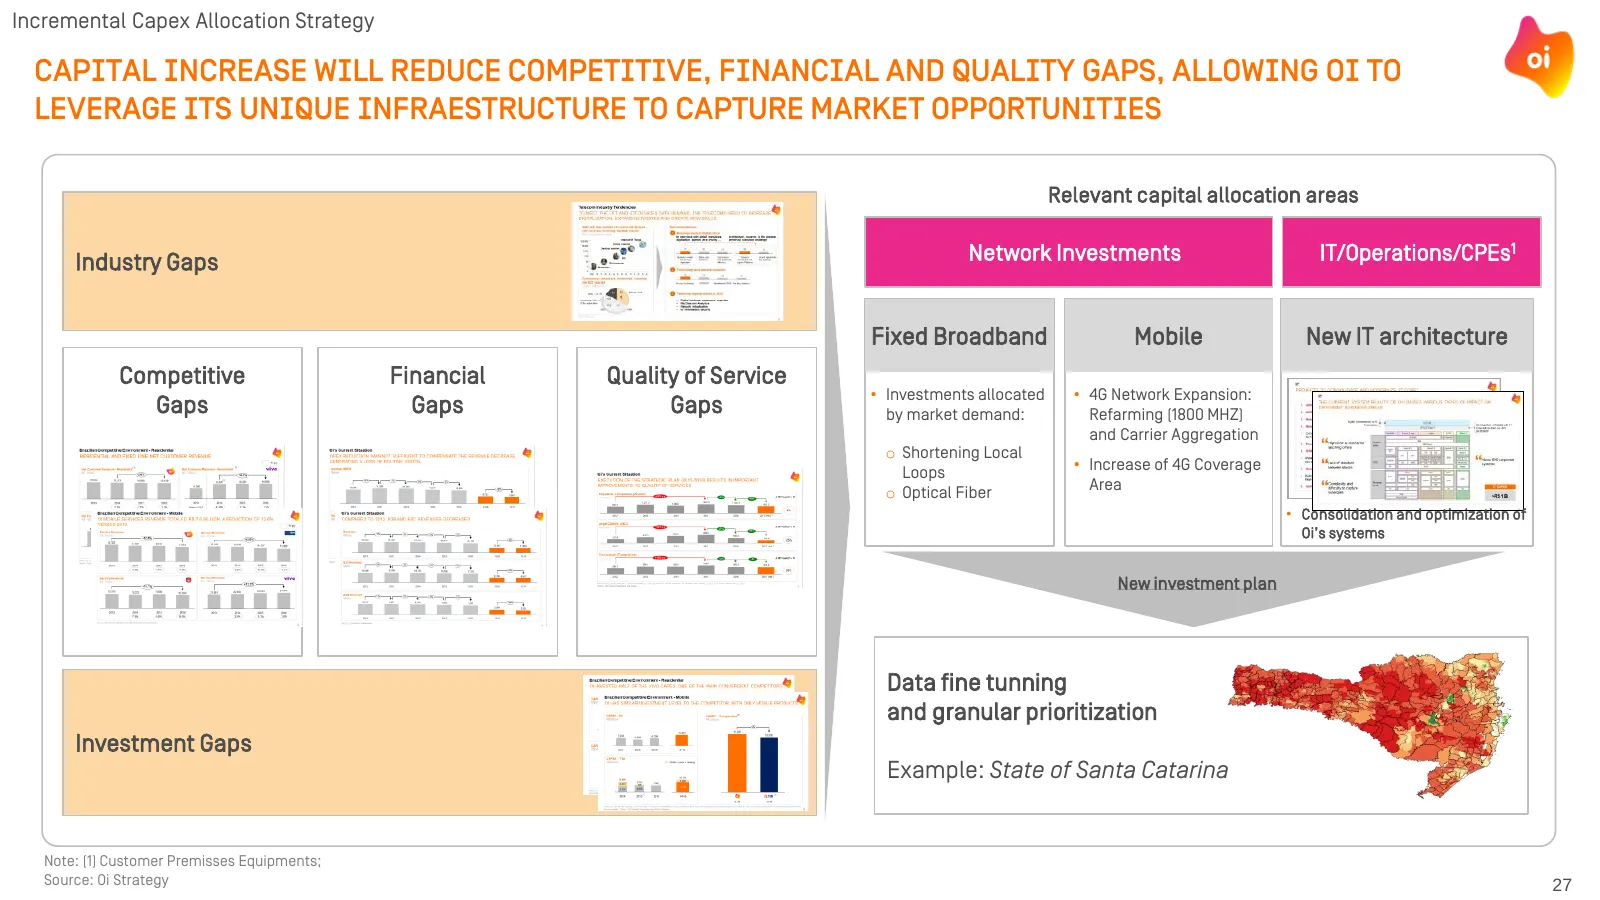
Incremental Capex Allocation Strategy CAPITAL INCREASE WILL REDUCE COMPETITIVE, FINANCIAL AND QUALITY GAPS, ALLOWING OI TO LEVERAGE ITS UNIQUE INFRAESTRUCTURE TO CAPTURE MARKET OPPORTUNITIES Relevant capital allocation areas Industry Gaps Network Investments IT/Operations/CPEs1 Fixed Broadband Mobil
Slide 29: Strategy to face competition focusing on customer service
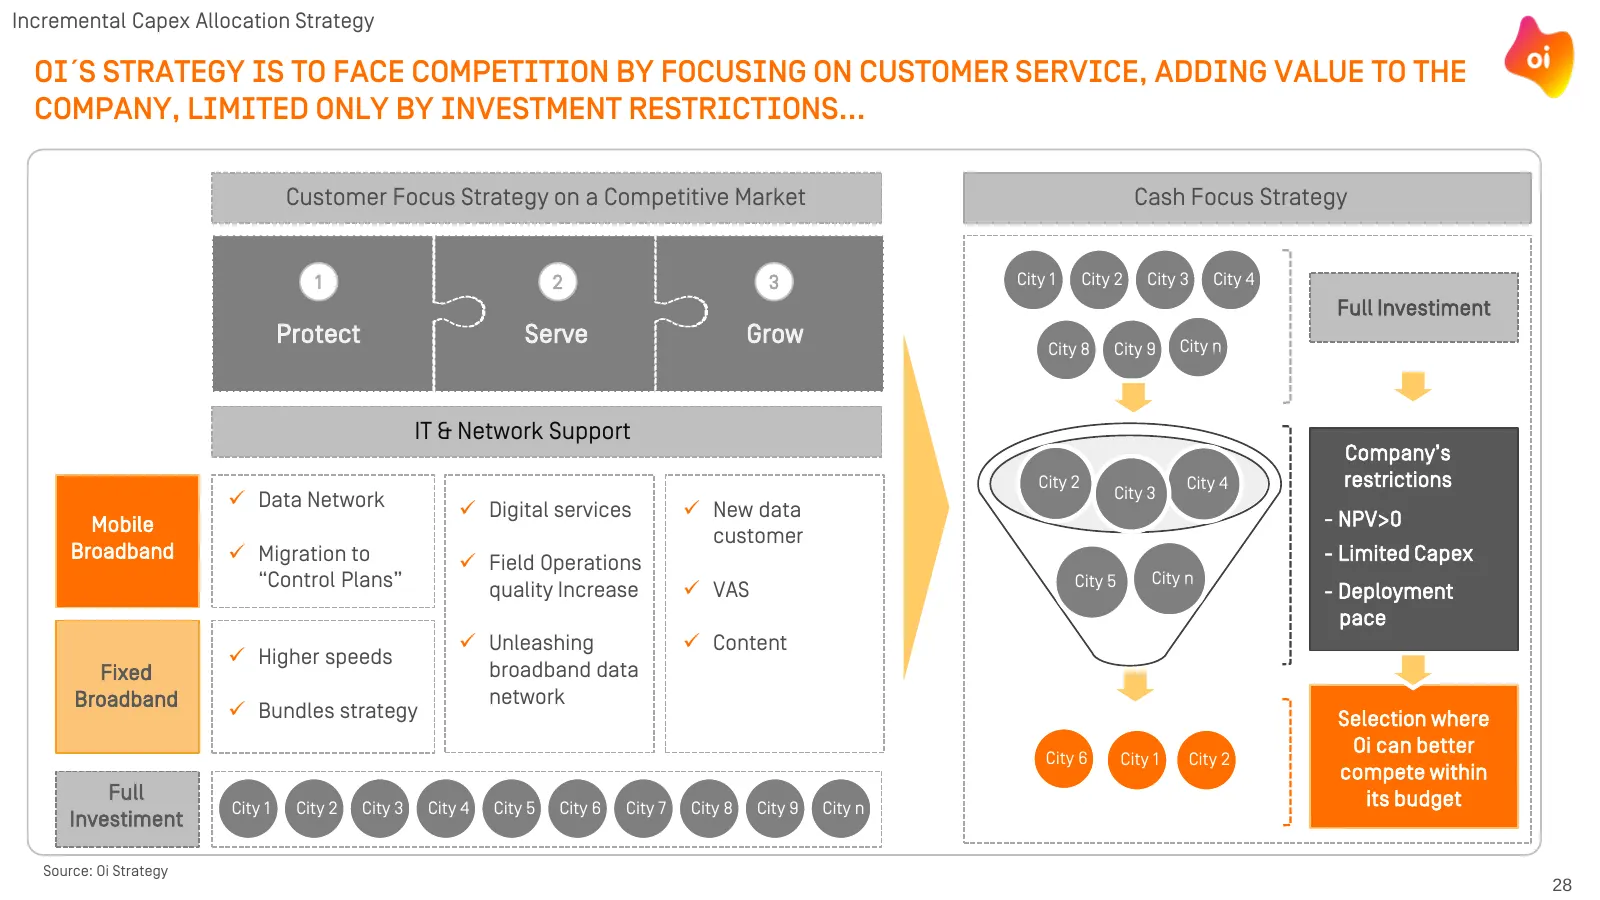
Incremental Capex Allocation Strategy OI´S STRATEGY IS TO FACE COMPETITION BY FOCUSING ON CUSTOMER SERVICE, ADDING VALUE TO THE COMPANY, LIMITED ONLY BY INVESTMENT RESTRICTIONS... Customer Focus Strategy on a Competitive Market Cash Focus Strategy 1 2 3 City 1 City 2 City 3 City 4 Full Investiment P
Slide 30: Customer focus strategy based on 4G and FTTx
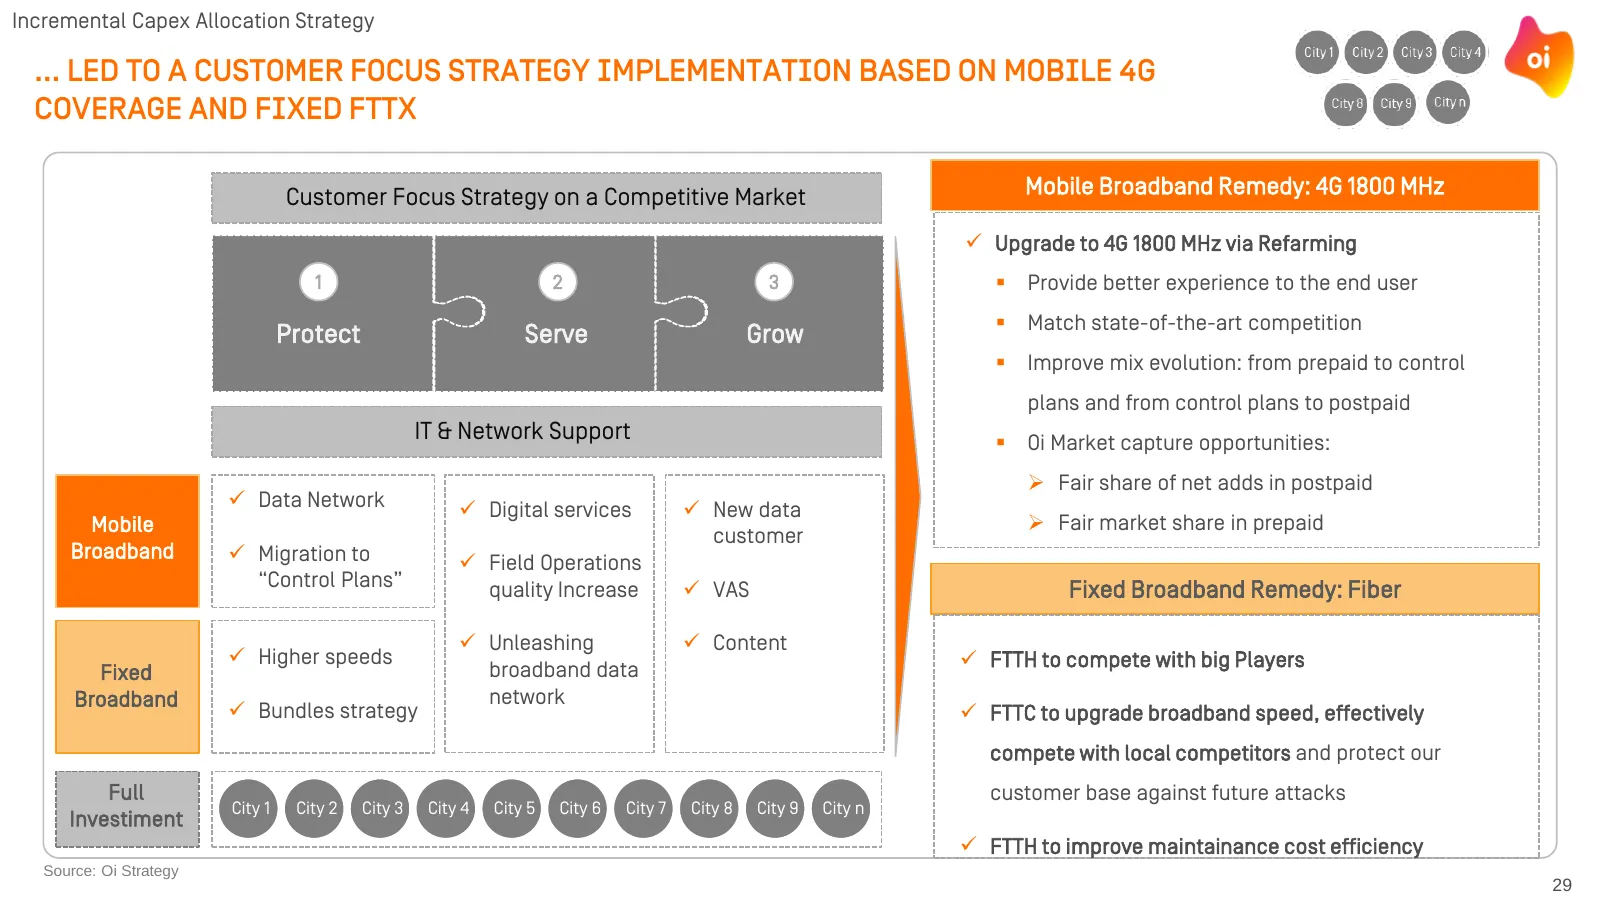
Incremental Capex Allocation Strategy … LED TO A CUSTOMER FOCUS STRATEGY IMPLEMENTATION BASED ON MOBILE 4G COVERAGE AND FIXED FTTX Customer Focus Strategy on a Competitive Market Mobile Broadband Remedy: 4G 1800 MHz Upgrade to 4G 1800 MHz via Refarming 1 2 3 Provide better experience to the end
Slide 31: Most attractive regions determined by profitability analysis
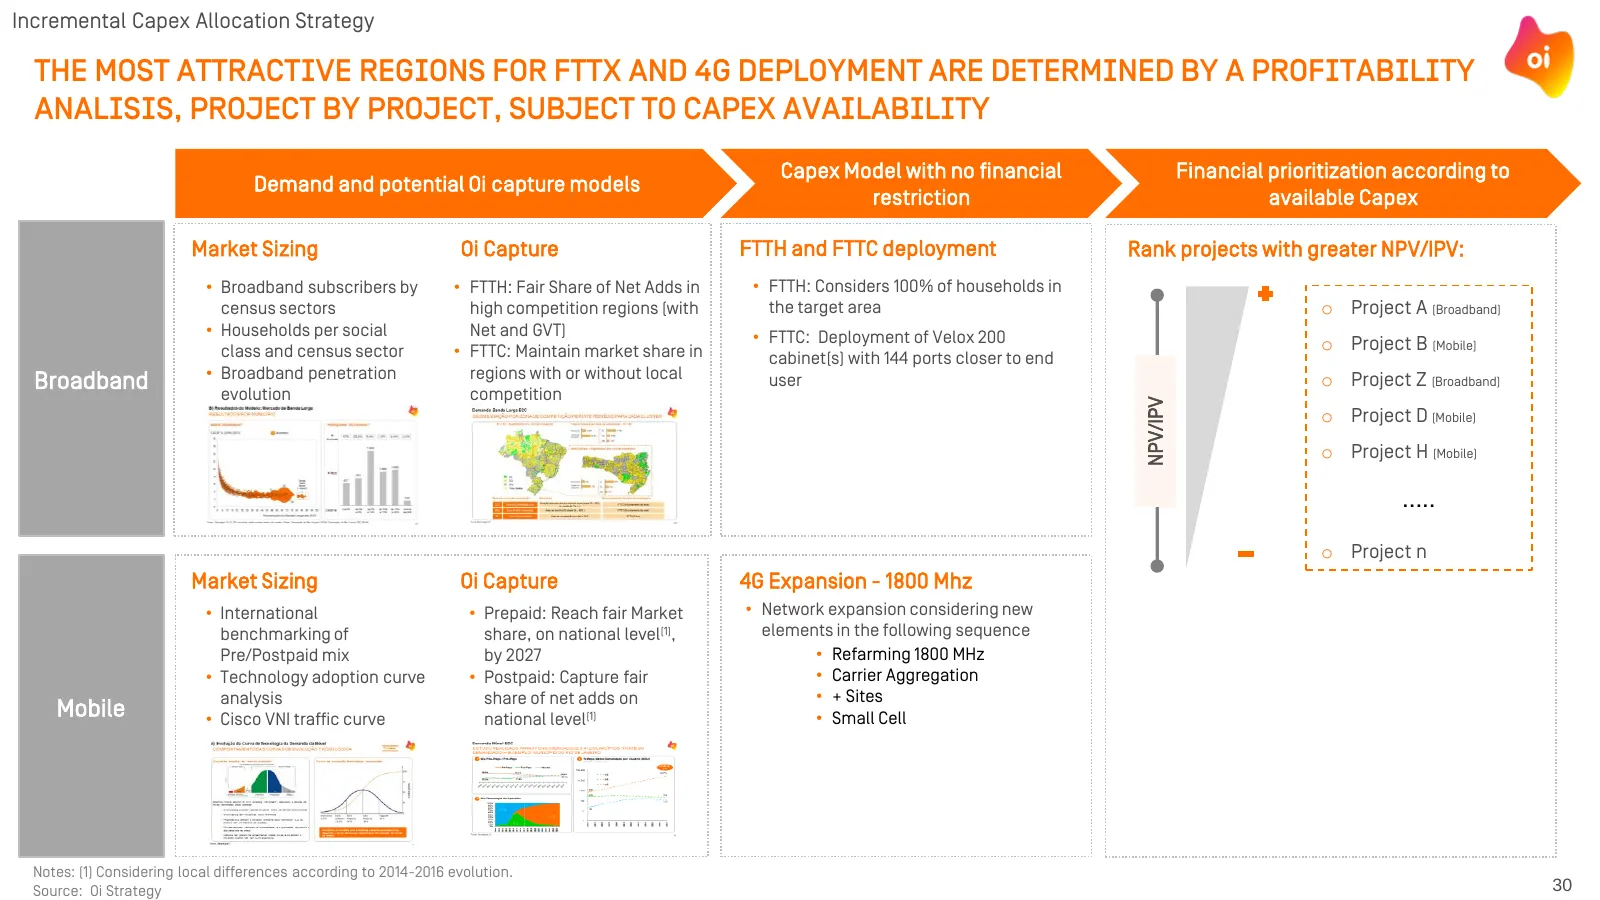
Incremental Capex Allocation Strategy THE MOST ATTRACTIVE REGIONS FOR FTTX AND 4G DEPLOYMENT ARE DETERMINED BY A PROFITABILITY ANALISIS, PROJECT BY PROJECT, SUBJECT TO CAPEX AVAILABILITY Capex Model with no financial Financial prioritization according to Demand and potential Oi capture models restri
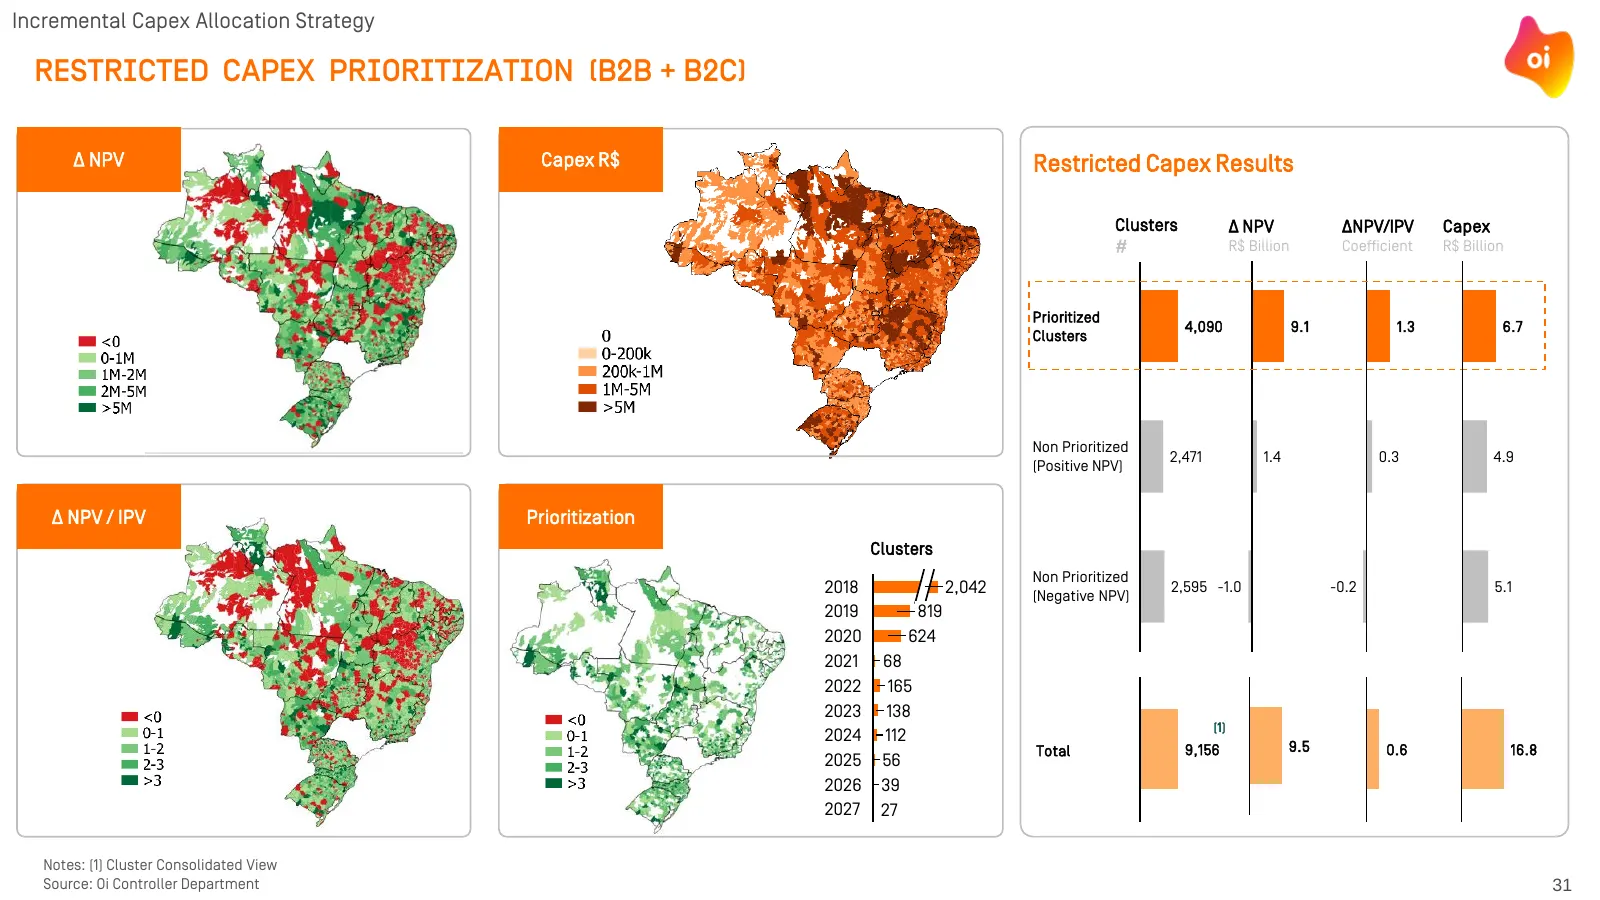
Slide 32: Restricted capex prioritization (B2B + B2C)
Incremental Capex Allocation Strategy RESTRICTED CAPEX PRIORITIZATION (B2B + B2C) ∆ NPV Capex R$ Restricted Capex Results Clusters ∆ NPV ∆NPV/IPV Capex # R$ Billion Coefficient R$ Billion Prioritized 4,090 9.1 1.3 6.7 Clusters Non Prioritized 2,471 1.4 0.3 4.9 (Positive NPV) ∆ NPV / IPV Prioritizati
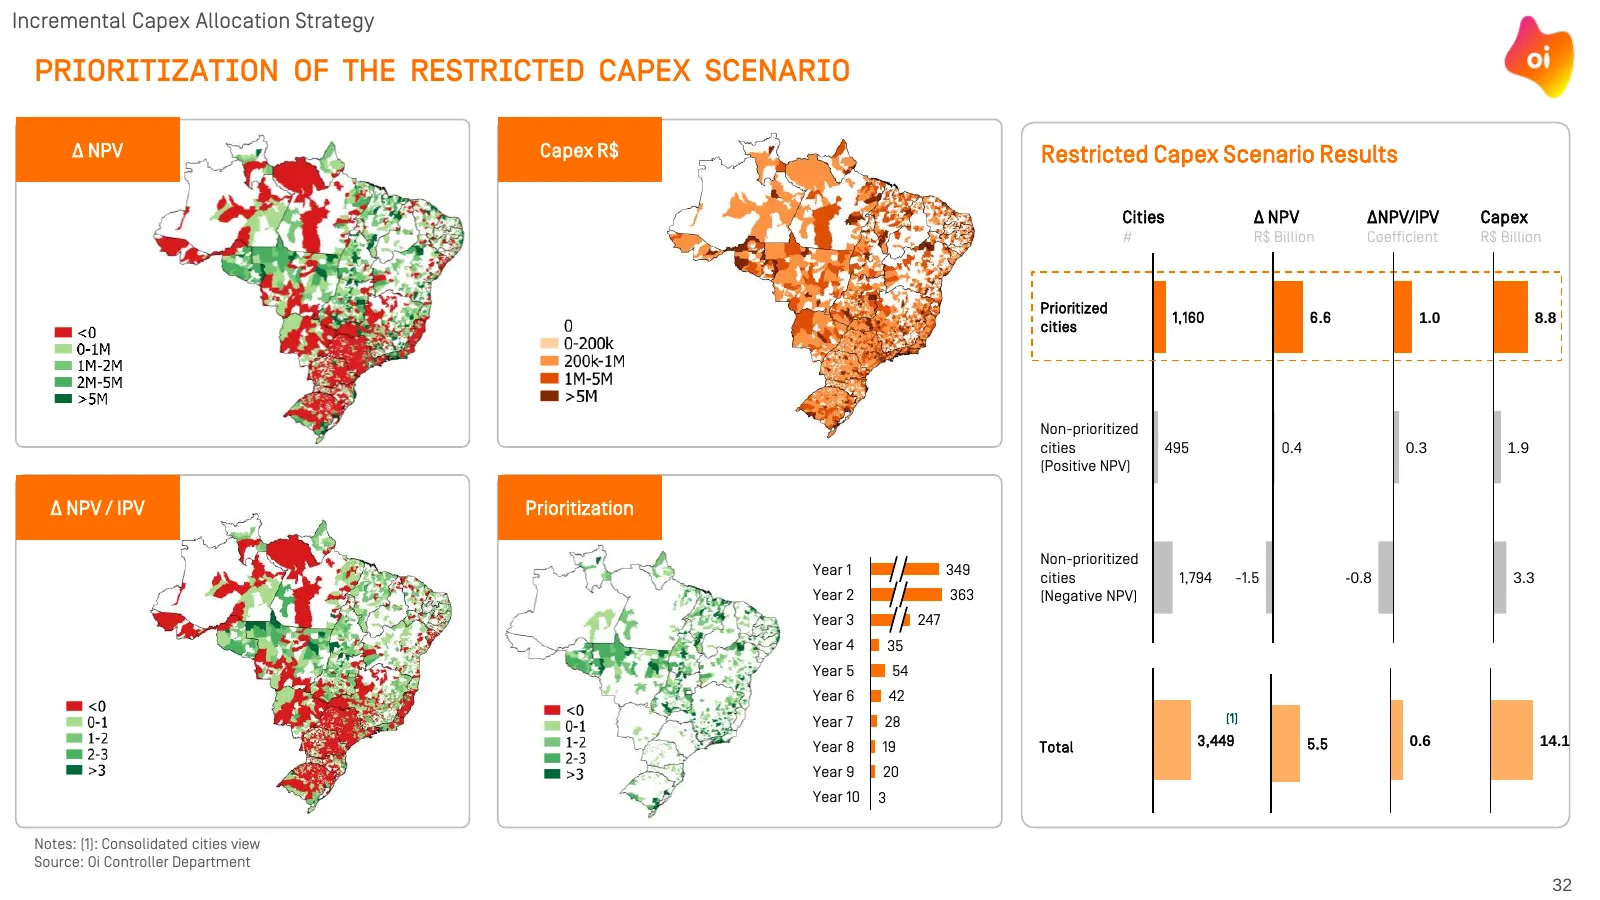
Slide 33: Prioritization of the restricted capex scenario
Incremental Capex Allocation Strategy PRIORITIZATION of the RESTRICTED CAPEX scenario ∆ NPV Capex R$ Restricted Capex Scenario Results Cities ∆ NPV ∆NPV/IPV Capex # R$ Billion Coefficient R$ Billion Prioritized 1,160 6.6 1.0 8.8 cities Non-prioritized cities 495 0.4 0.3 1.9 (Positive NPV) ∆ NPV / IP
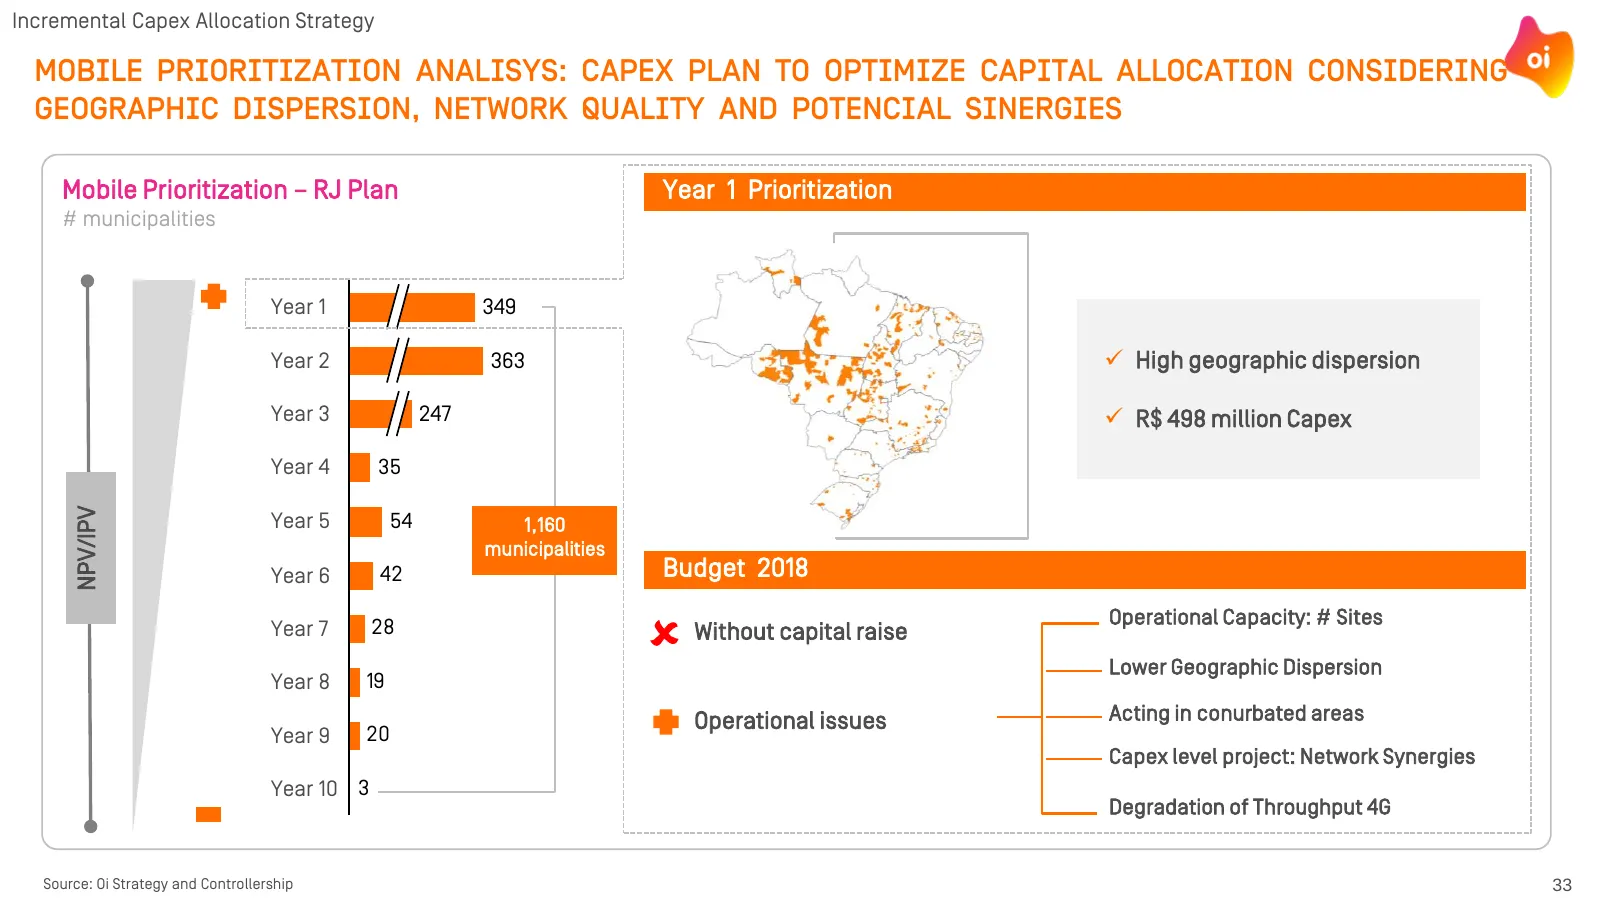
Slide 34: Mobile prioritization analysis
Incremental Capex Allocation Strategy MOBILE PRIORITIZATION ANALISYS: CAPEX PLAN TO OPTIMIZE CAPITAL ALLOCATION CONSIDERING GEOGRAPHIC DISPERSION, NETWORK QUALITY AND POTENCIAL SINERGIES Mobile Prioritization – RJ Plan Year 1 Prioritization # municipalities Year 1 349 Year 2 363 High geographic di
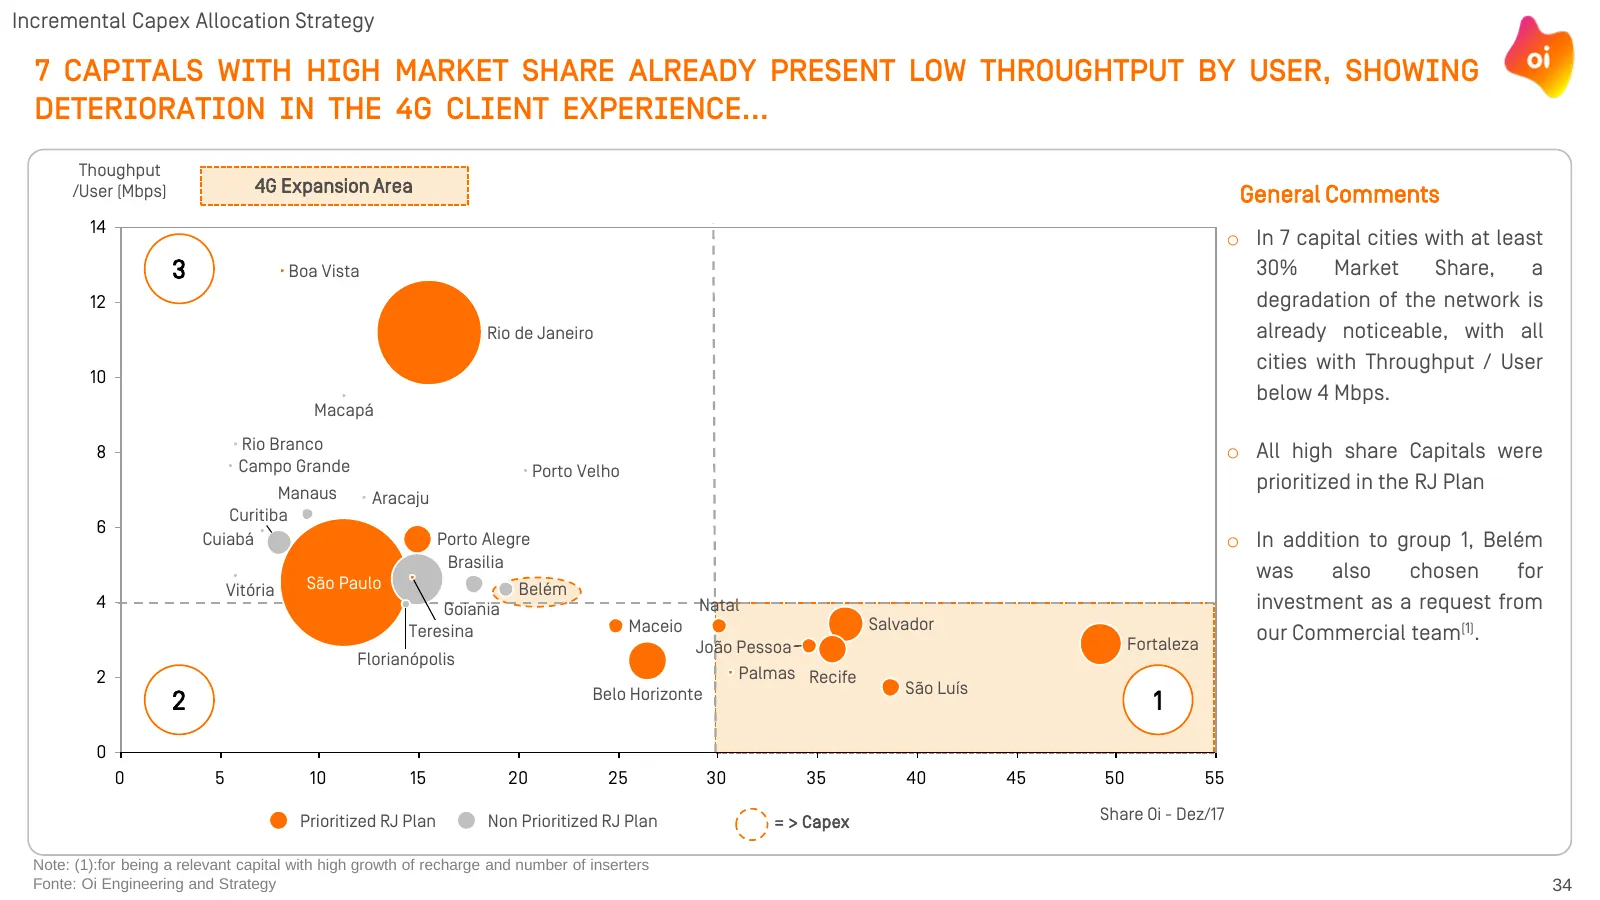
Slide 35: Capitals with high market share show low throughput
Incremental Capex Allocation Strategy 7 CAPITALS WITH HIGH MARKET SHARE ALREADY PRESENT LOW THROUGHTPUT BY USER, SHOWING DETERIORATION IN THE 4G CLIENT EXPERIENCE... Thoughput /User (Mbps) 4G Expansion Area General Comments 14 o In 7 capital cities with at least 3 Boa Vista 30% Market Share, a 12 de
Slide 36: Selected capitals present better NPV/IPV return
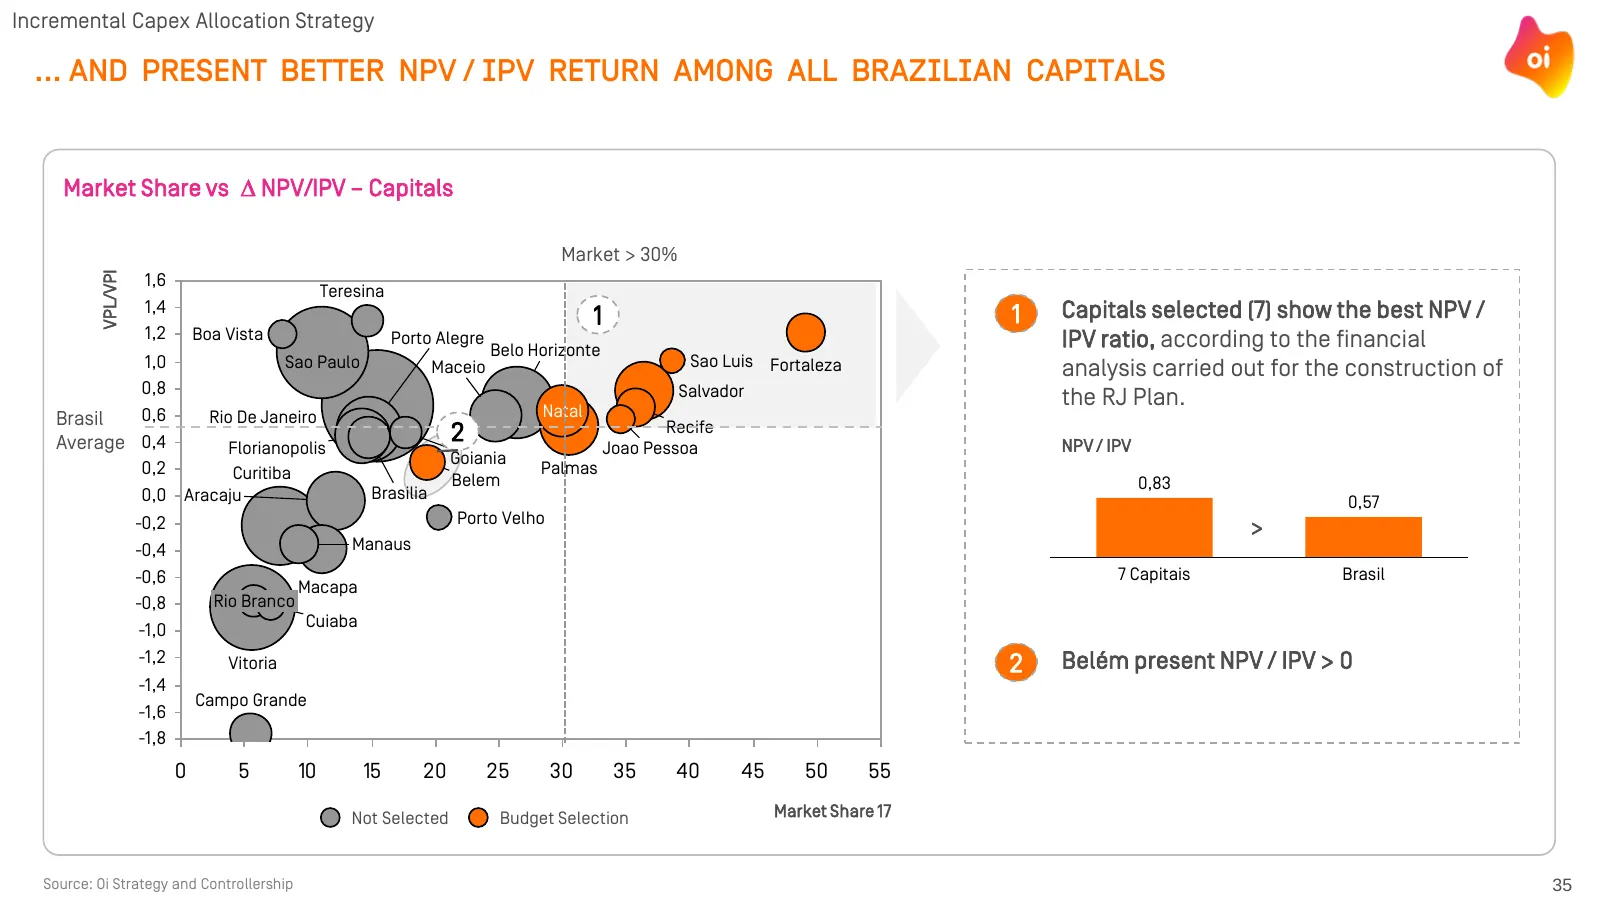
Incremental Capex Allocation Strategy ... AND PRESENT BETTER NPV / IPV RETURN AMONG ALL BRAZILIAN CAPITALS Market Share vs NPV/IPV – Capitals Market > 30% VPL/VPI 1,6 Teresina 1,4 1 1 Capitals selected (7) show the best NPV / 1,2 Boa Vista Porto Alegre IPV ratio, according to the financial Belo Ho
Slide 37: 1.8 GHz refarming project prioritizing 22 municipalities
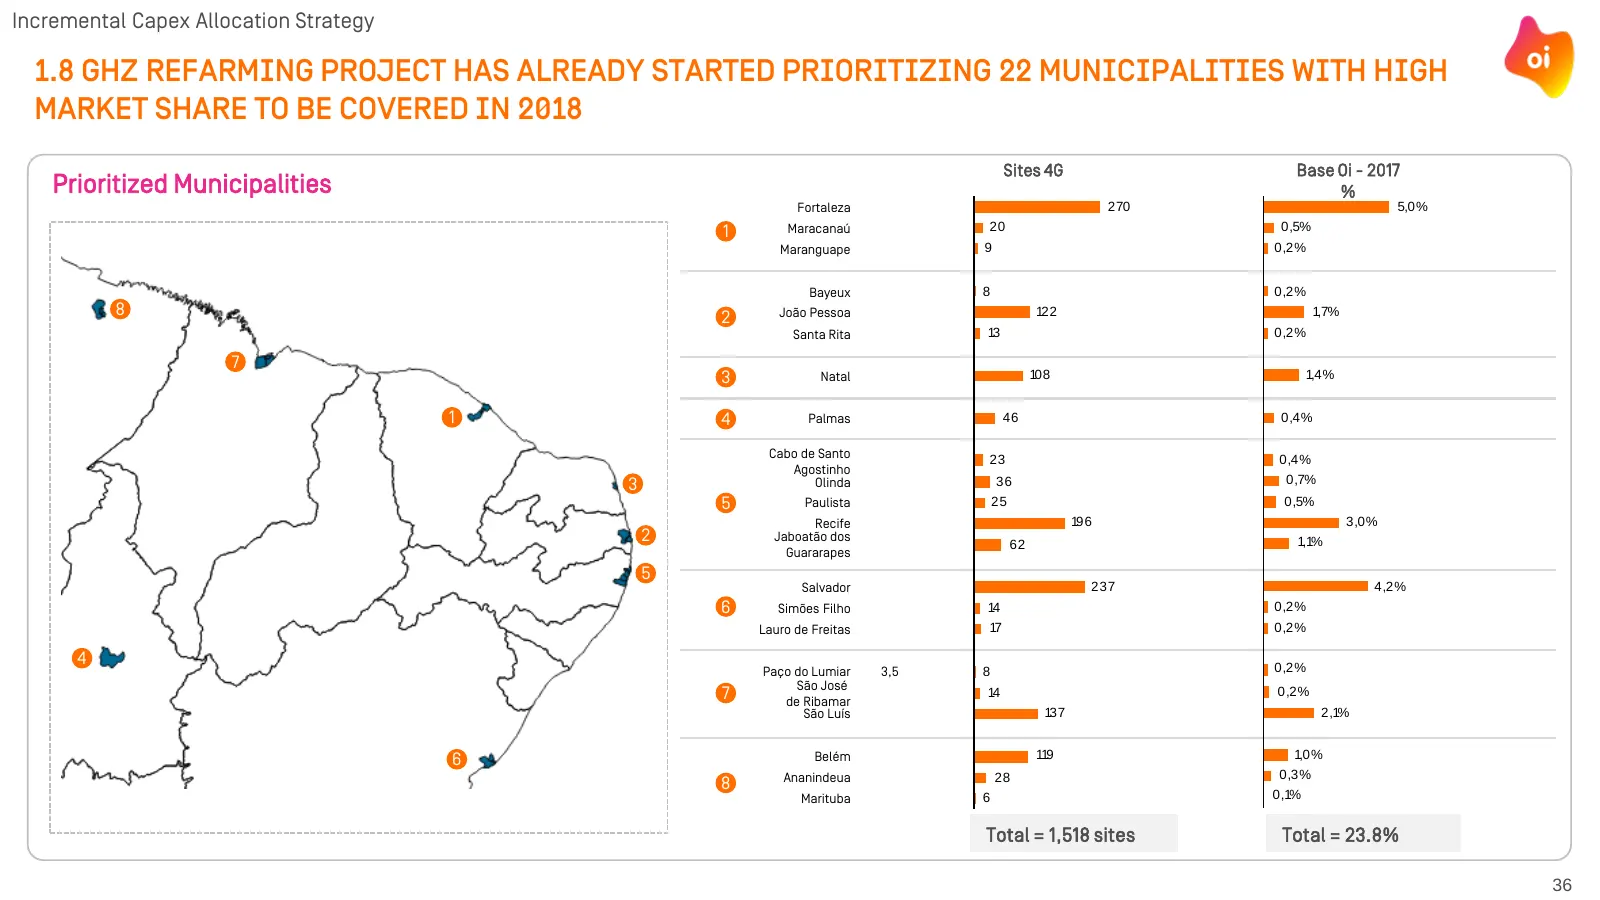
Incremental Capex Allocation Strategy 1.8 GHz REFARMING PROJECT HAS ALREADY STARTED PRIORITIZING 22 MUNICIPALITIES WITH HIGH MARKET SHARE TO BE COVERED IN 2018 Sites 4G Base Oi - 2017 Prioritized Municipalities % Fortaleza 270 5,0% 1 Maracanaú 20 0,5% Maranguape 9 0,2% Bayeux 8 0,2% 8 2 João Pessoa
Slide 38: Agenda
AGENDA A – Oi’s priorities 2017 and 2018 B – Renewed Capital Structure C – Market Strategy D – Cost Strategy: Operational Efficiency & Digital Transformation E – Incremental Capex Allocation Strategy F – Judicial Reorganization Plan Implementation Status 37
Slide 39: Judicial Reorganization Plan implementation status
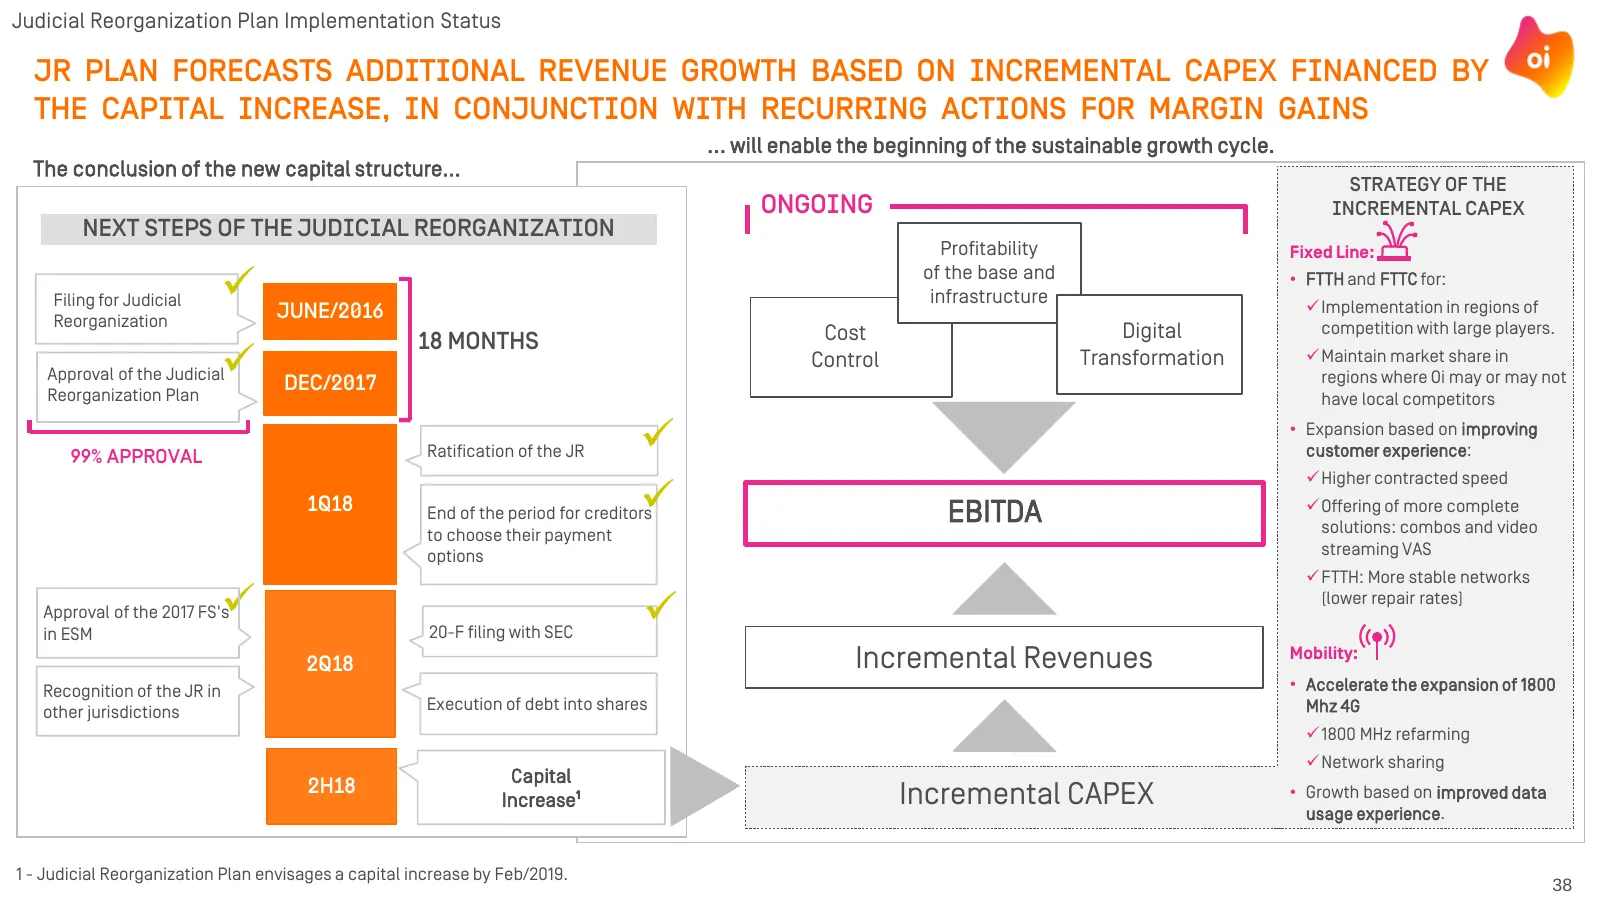
Judicial Reorganization Plan Implementation Status JR PLAN FORECASTS ADDITIONAL REVENUE GROWTH BASED ON INCREMENTAL CAPEX FINANCED BY THE CAPITAL INCREASE, IN CONJUNCTION WITH RECURRING ACTIONS FOR MARGIN GAINS ... will enable the beginning of the sustainable growth cycle. The conclusion of the new
Slide 40: Backup – Earnings Release 1Q18
BACKUP – EARNINGS RELEASE 1Q18 39
Slide 41: 1Q18 Results - Financial Highlights (Brazil)
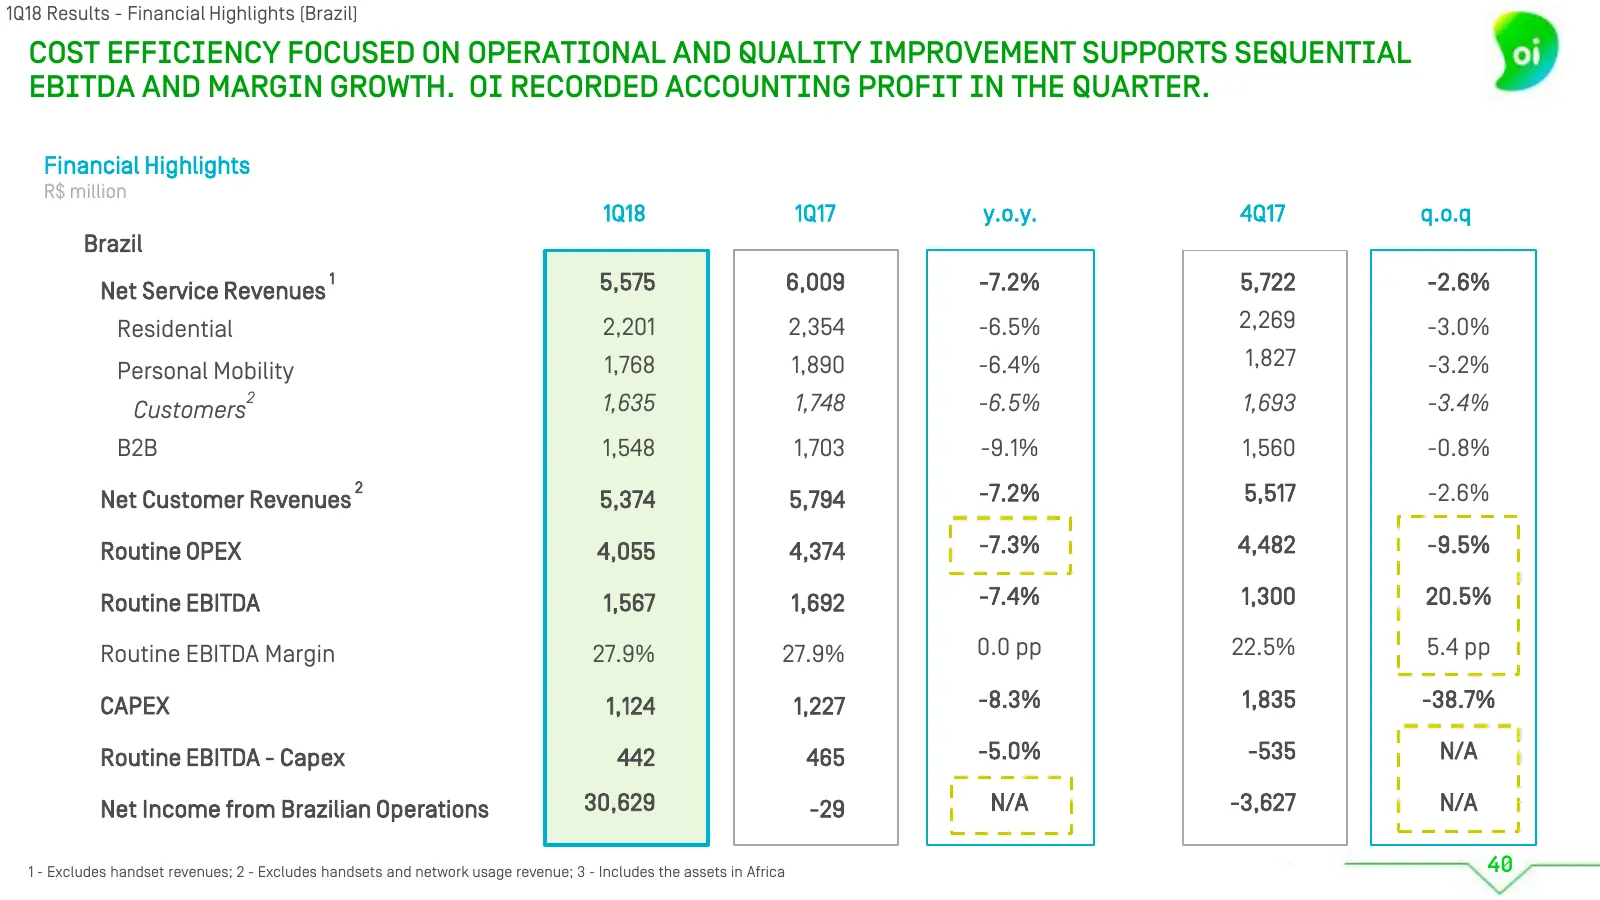
1Q18 Results - Financial Highlights (Brazil) cost efficiency focused on operational and quality improvement supports sequential ebitda and margin growth. Oi recorded accounting profit in the quarter. Financial Highlights R$ million 1Q18 1Q17 y.o.y. 4Q17 q.o.q Brazil Net Service Revenues 1 5,575 6,00
Slide 42: 1Q18 Results - Operating Highlights (Brazil)
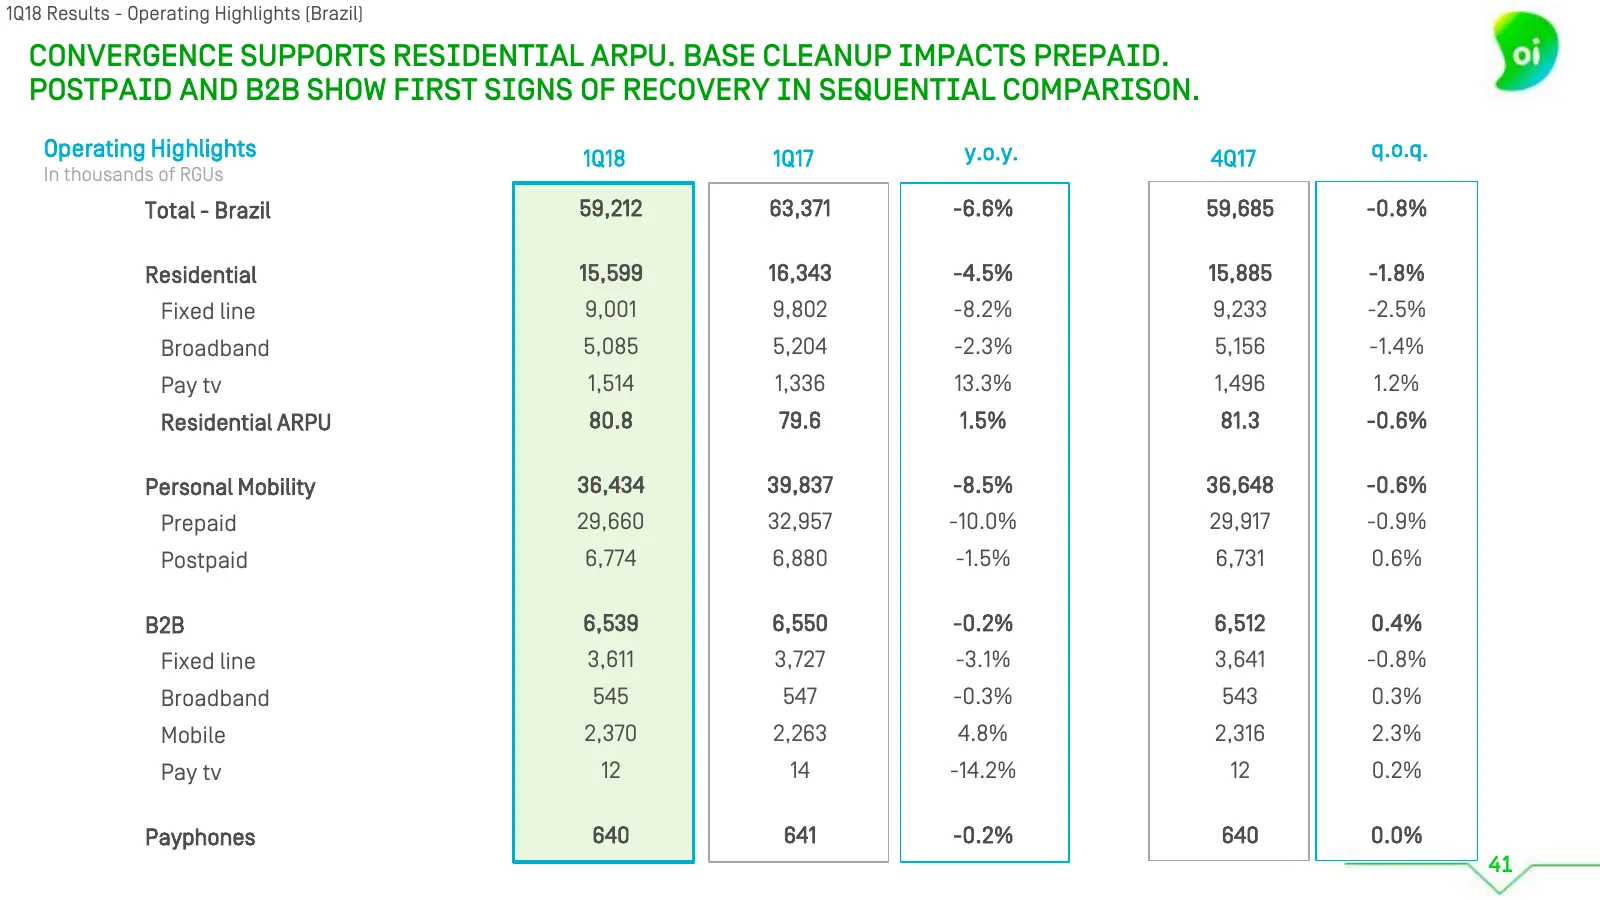
1Q18 Results - Operating Highlights (Brazil) Convergence supports residential ARPU. Base cleanup impacts prepaid. Postpaid and B2B show first signs of recovery in sequential comparison. Operating Highlights 1Q18 1Q17 y.o.y. 4Q17 q.o.q. In thousands of RGUs Total - Brazil 59,212 63,371 -6.6% 59,685 -
Slide 43: 1Q18 Results - Residential (Brazil)
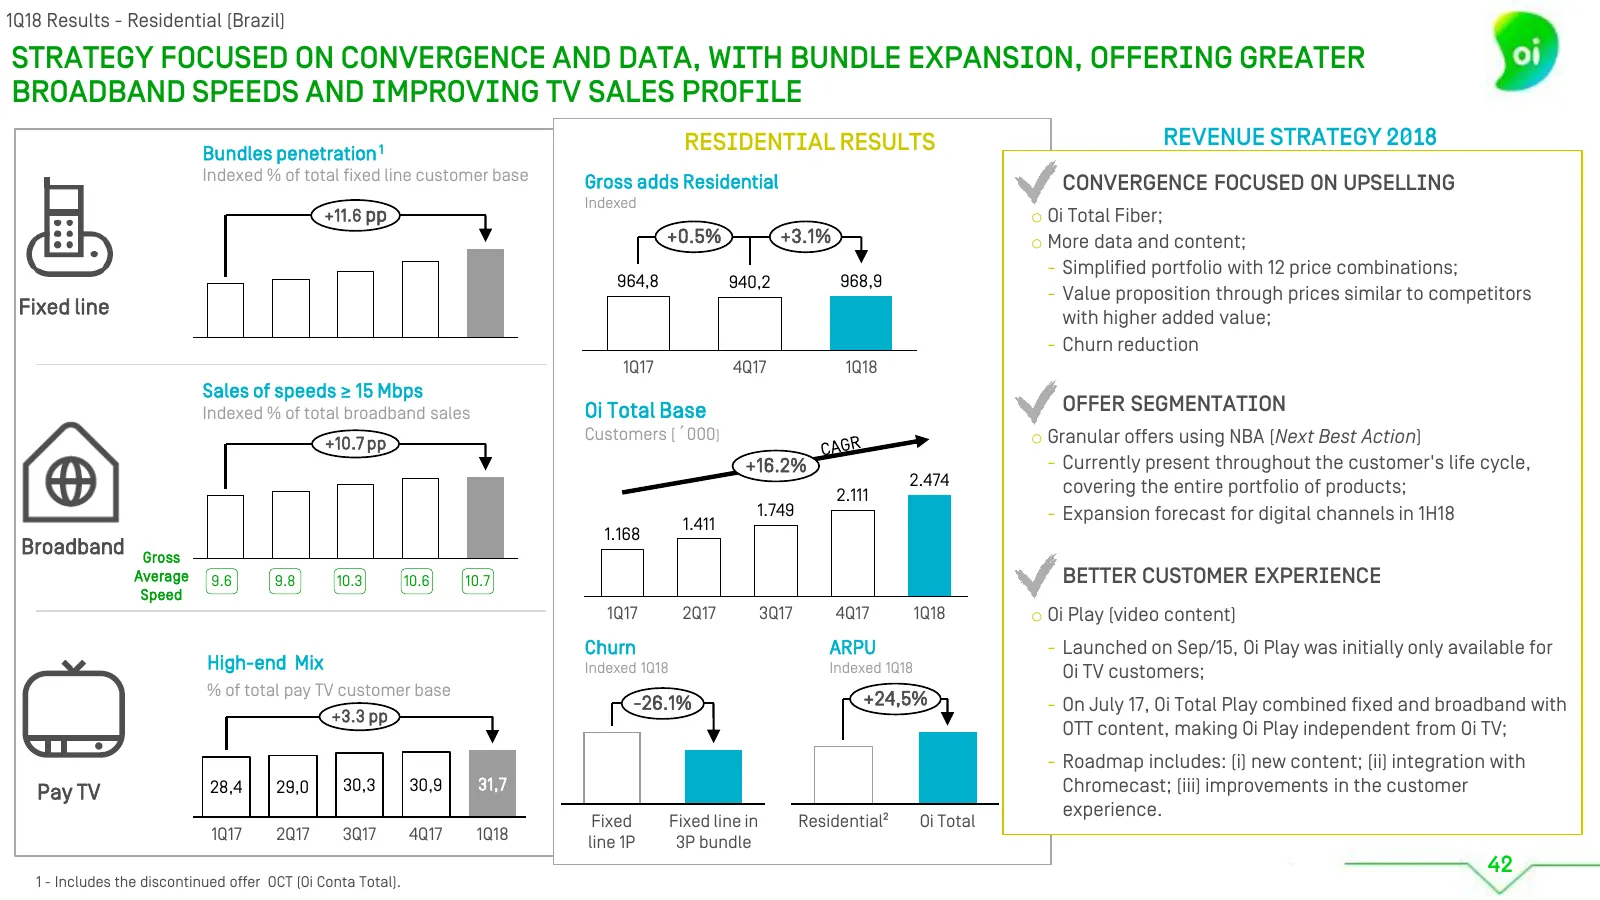
1Q18 Results - Residential (Brazil) Strategy focused on convergence and data, with bundle expansion, OFFERING GREATER BROADBAND SPEEDS AND IMPROVING TV SALES PROFILE residential RESULTS Revenue Strategy 2018 Bundles penetration 1 Indexed % of total fixed line customer base Gross adds Residential Con
Slide 44: 1Q18 Results - Personal Mobility (Brazil)
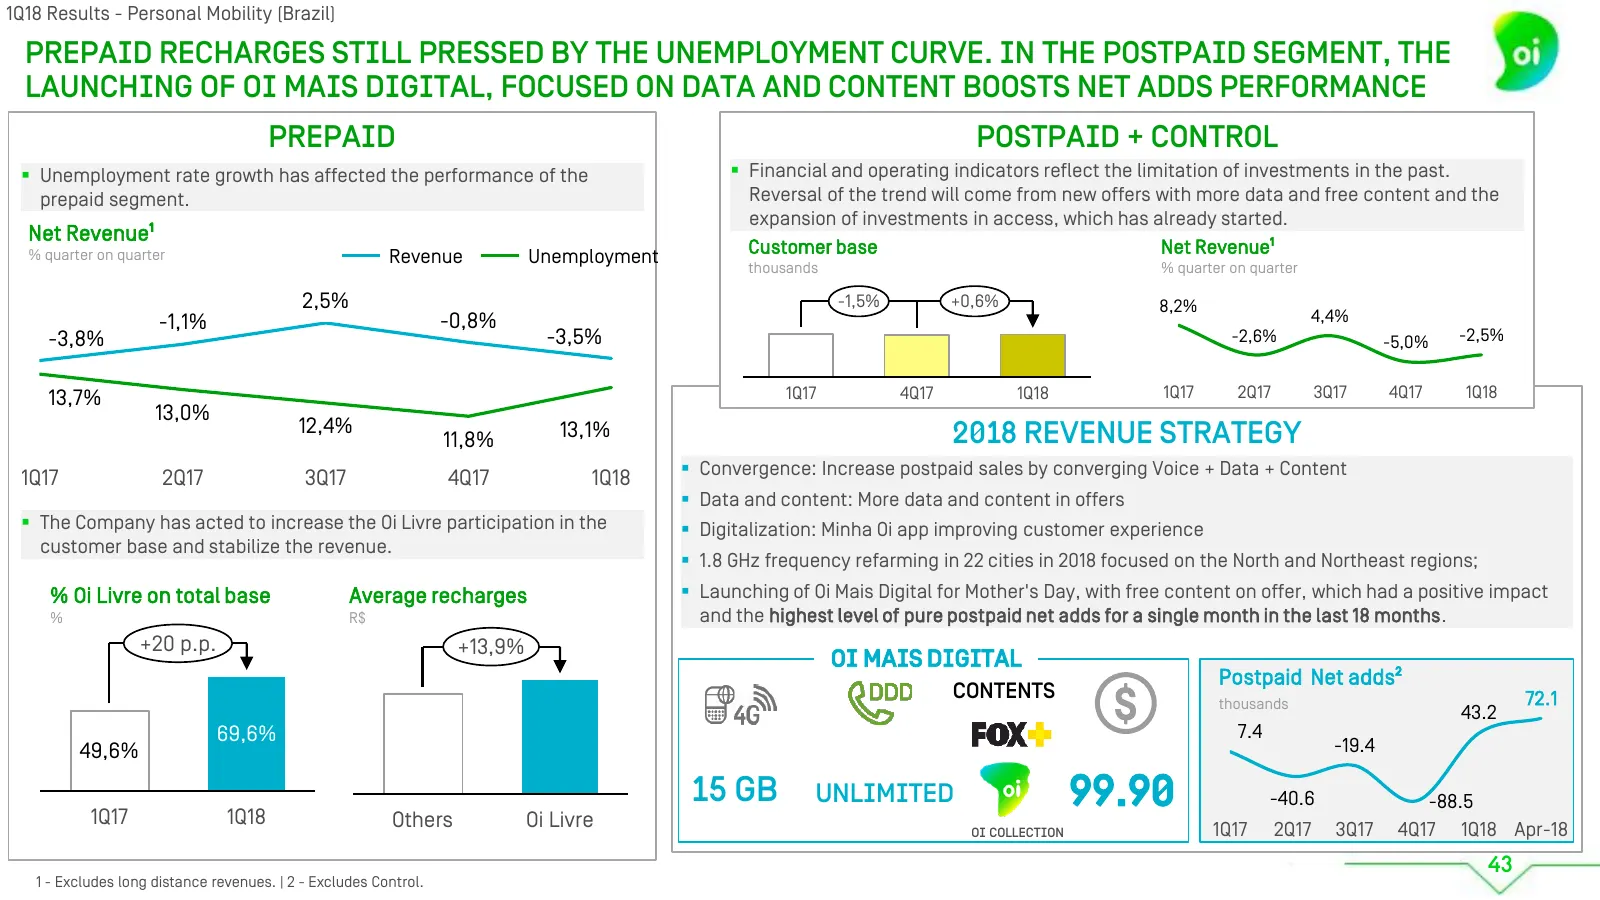
1Q18 Results - Personal Mobility (Brazil) Prepaid recharges still pressed by the unemployment curve. In the postpaid segment, the launching of oi mais digital, focused on data and content boosts net adds performance Prepaid Postpaid + CONTROL Unemployment rate growth has affected the performance o
Slide 45: 1Q18 Results - B2B (Brazil)
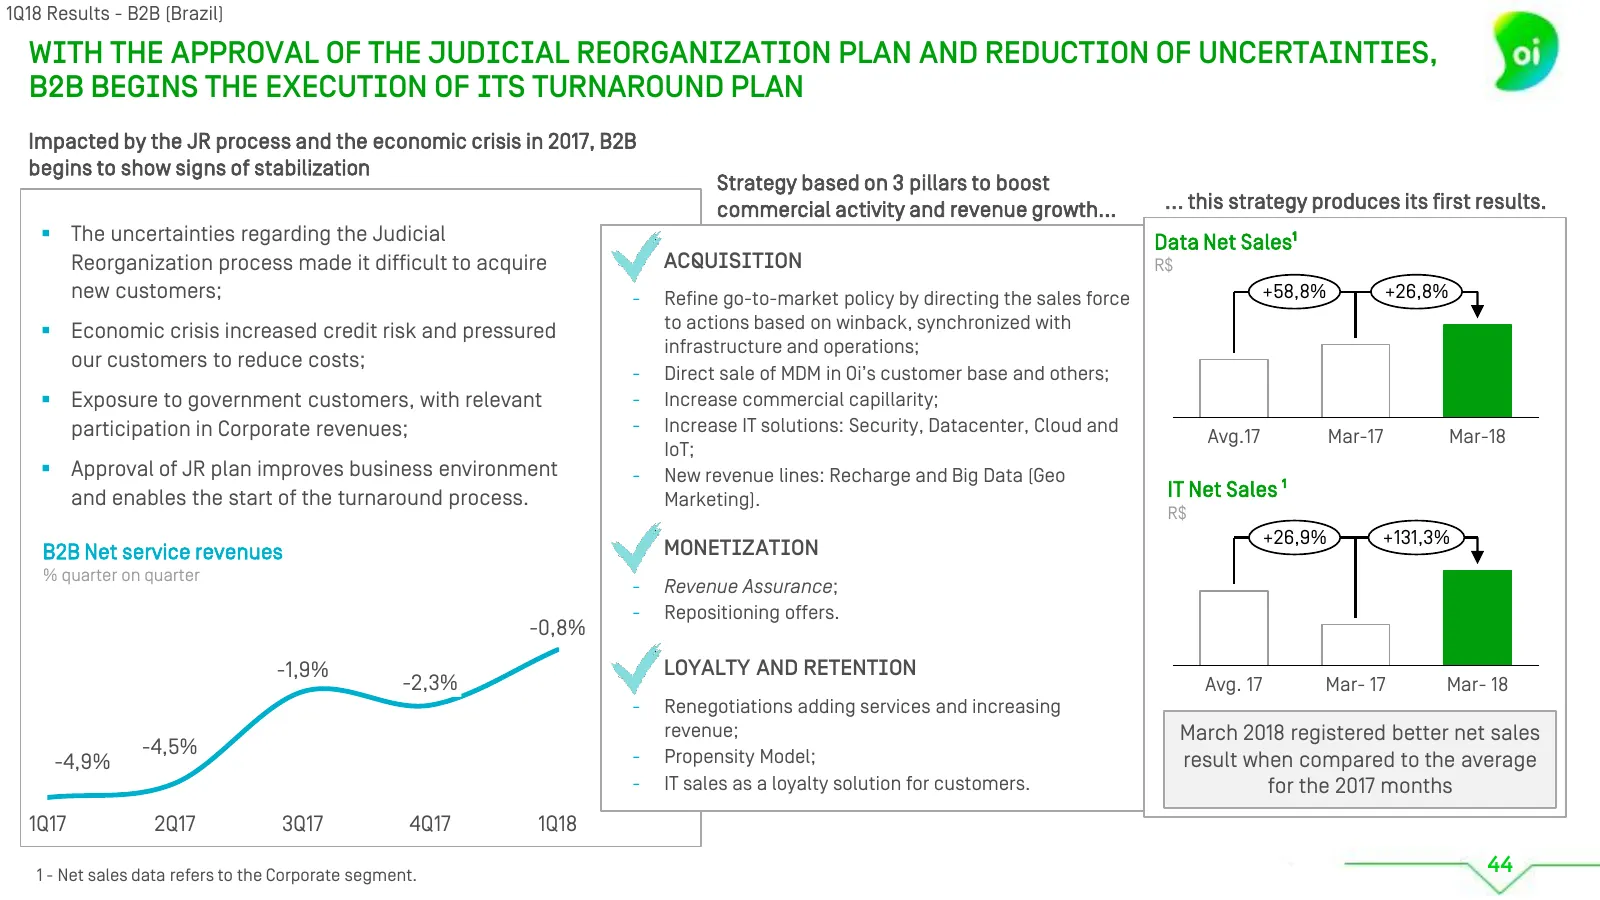
1Q18 Results - B2B (Brazil) With the approval of the judicial reorganization plan and reduction of uncertainties, b2b begins the execution of its turnaround plan Impacted by the JR process and the economic crisis in 2017, B2B begins to show signs of stabilization Strategy based on 3 pillars to boost
Slide 46: Structural fronts: cost control with operational efficiency
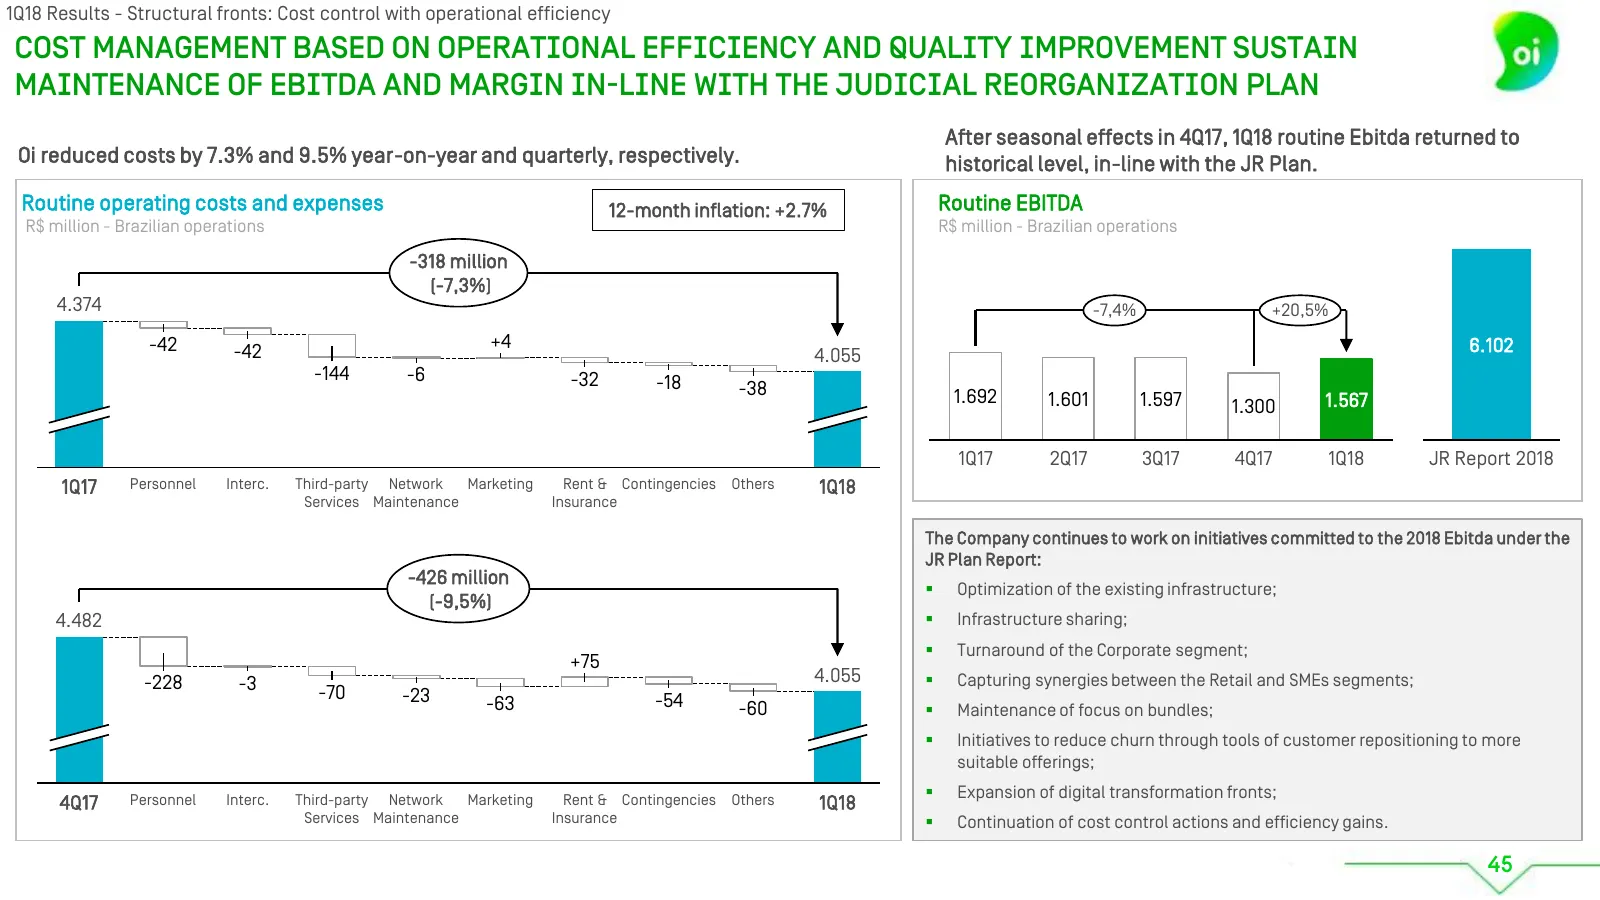
1Q18 Results - Structural fronts: Cost control with operational efficiency Cost management based on operational efficiency and quality improvement sustain maintenance of EBITDA and margin in-line with the judicial reorganization plan After seasonal effects in 4Q17, 1Q18 routine Ebitda returned to Oi
Slide 47: 1Q18 Results - Quality improvement
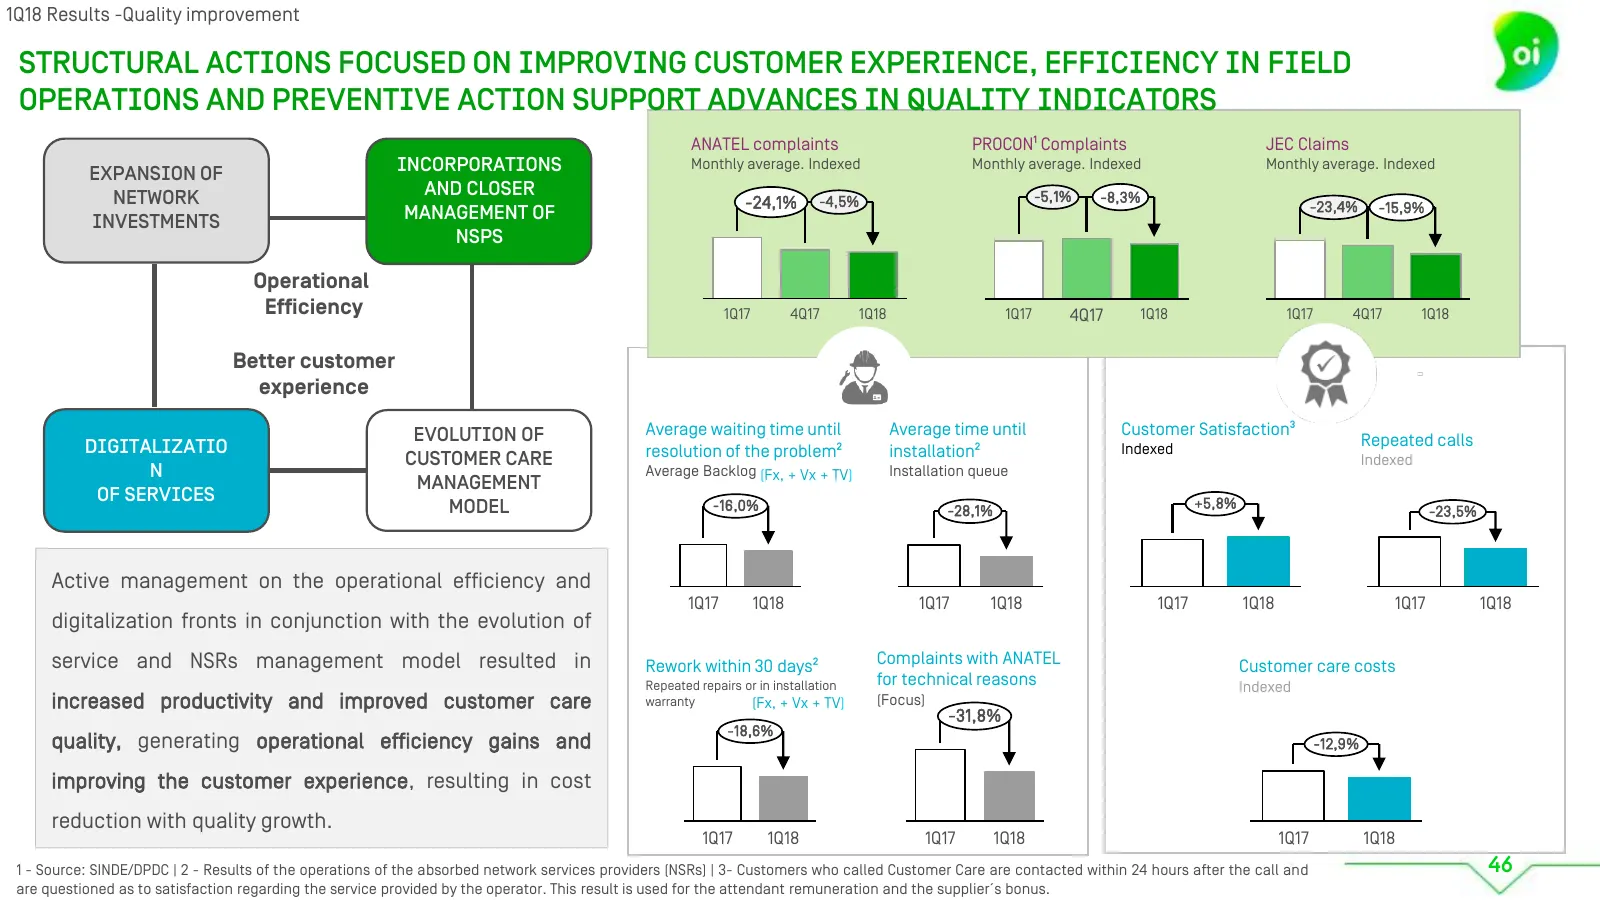
1Q18 Results -Quality improvement Structural actions focused on improving customer experience, efficiency in field operations and preventive action support advances in quality indicators ANATEL complaints PROCON¹ Complaints JEC Claims Expansion of Incorporations Monthly average. Indexed Monthly aver
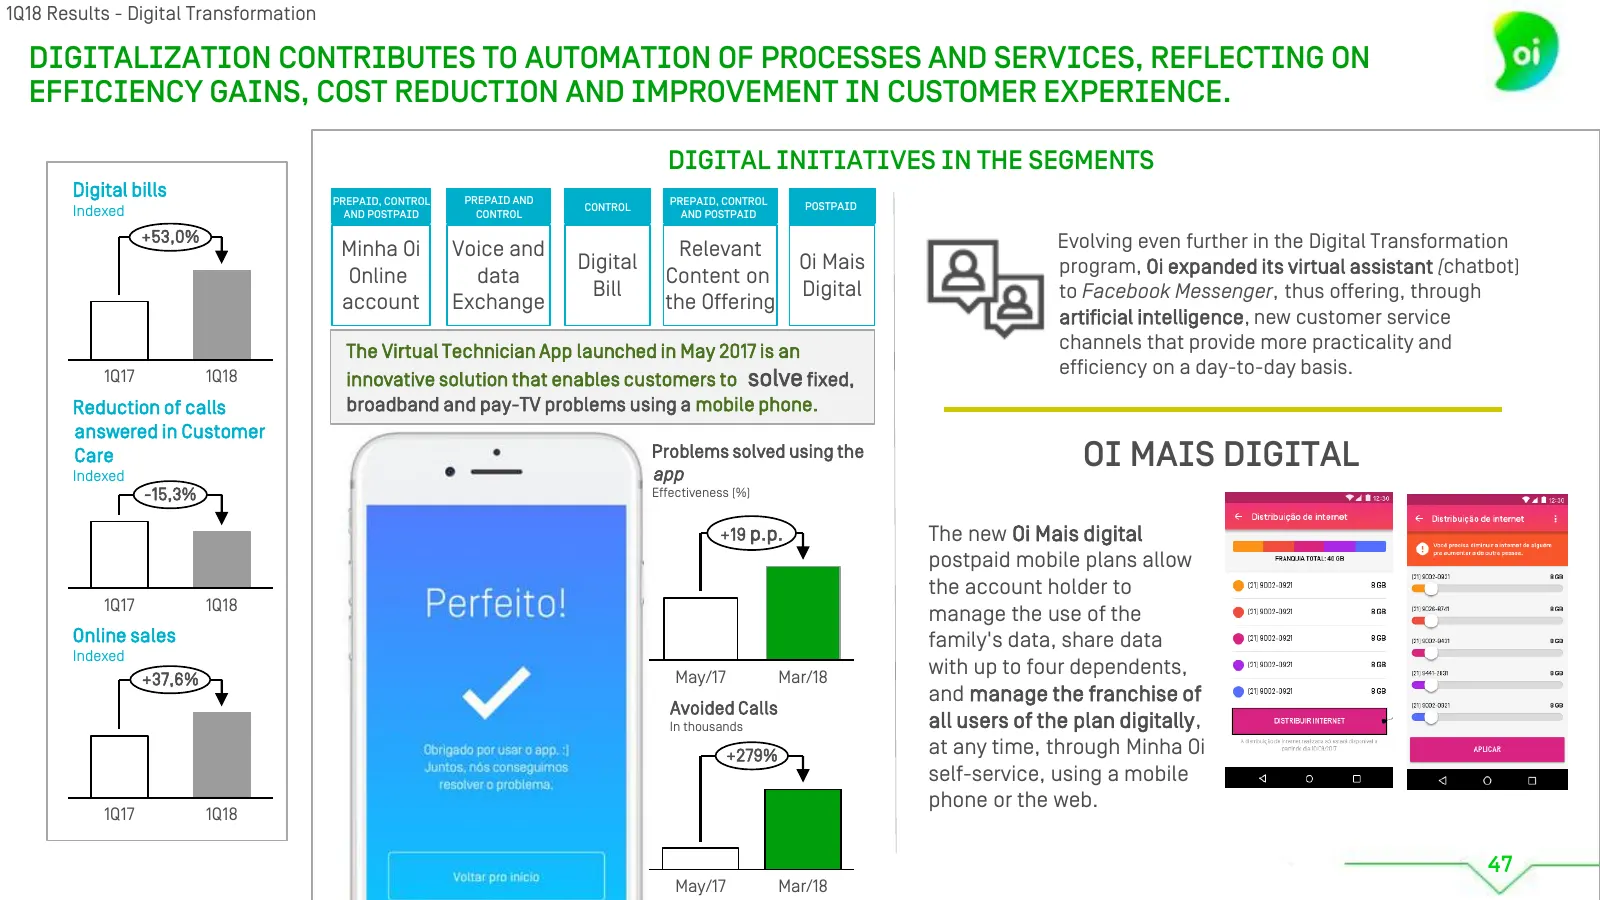
Slide 48: 1Q18 Results - Digital Transformation
1Q18 Results - Digital Transformation DIGITALIZATION CONTRIBUTES to automation of processes and services, reflecting on efficiency gains, cost reduction AND IMPROVEMENT in customer experience. Digital Initiatives in the segments Digital bills Prepaid, control Prepaid and Prepaid, control Indexed Con
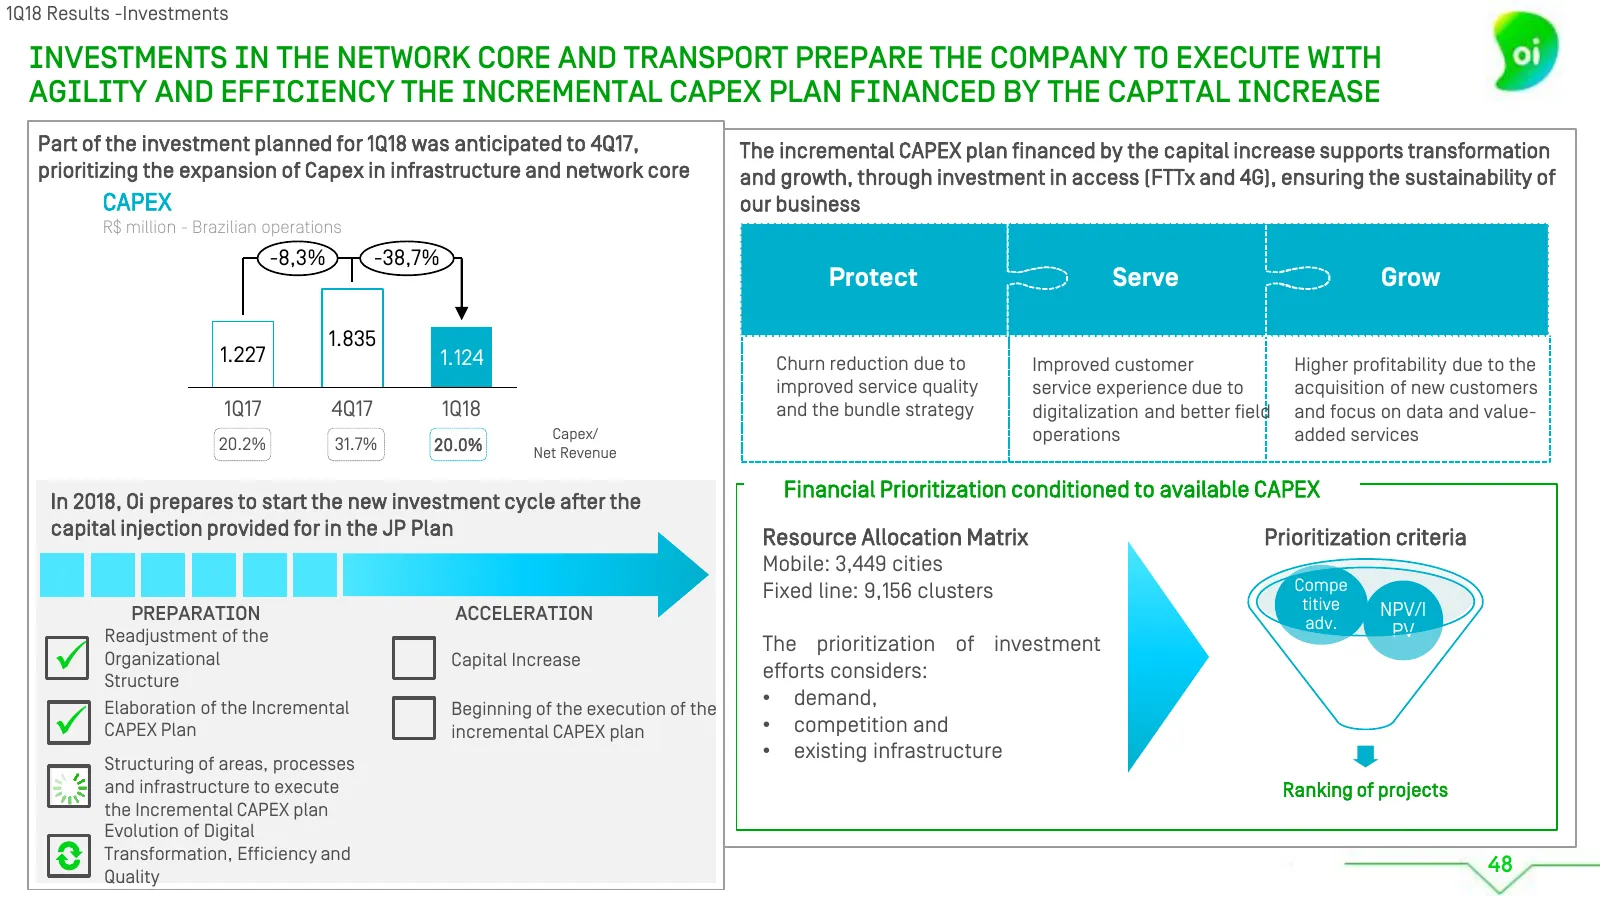
Slide 49: 1Q18 Results - Investments
1Q18 Results -Investments investments in the network core and transport prepare the Company to execute with agility and efficiency the incremental capex plan financed by the capital increase Part of the investment planned for 1Q18 was anticipated to 4Q17, The incremental CAPEX plan financed by the c
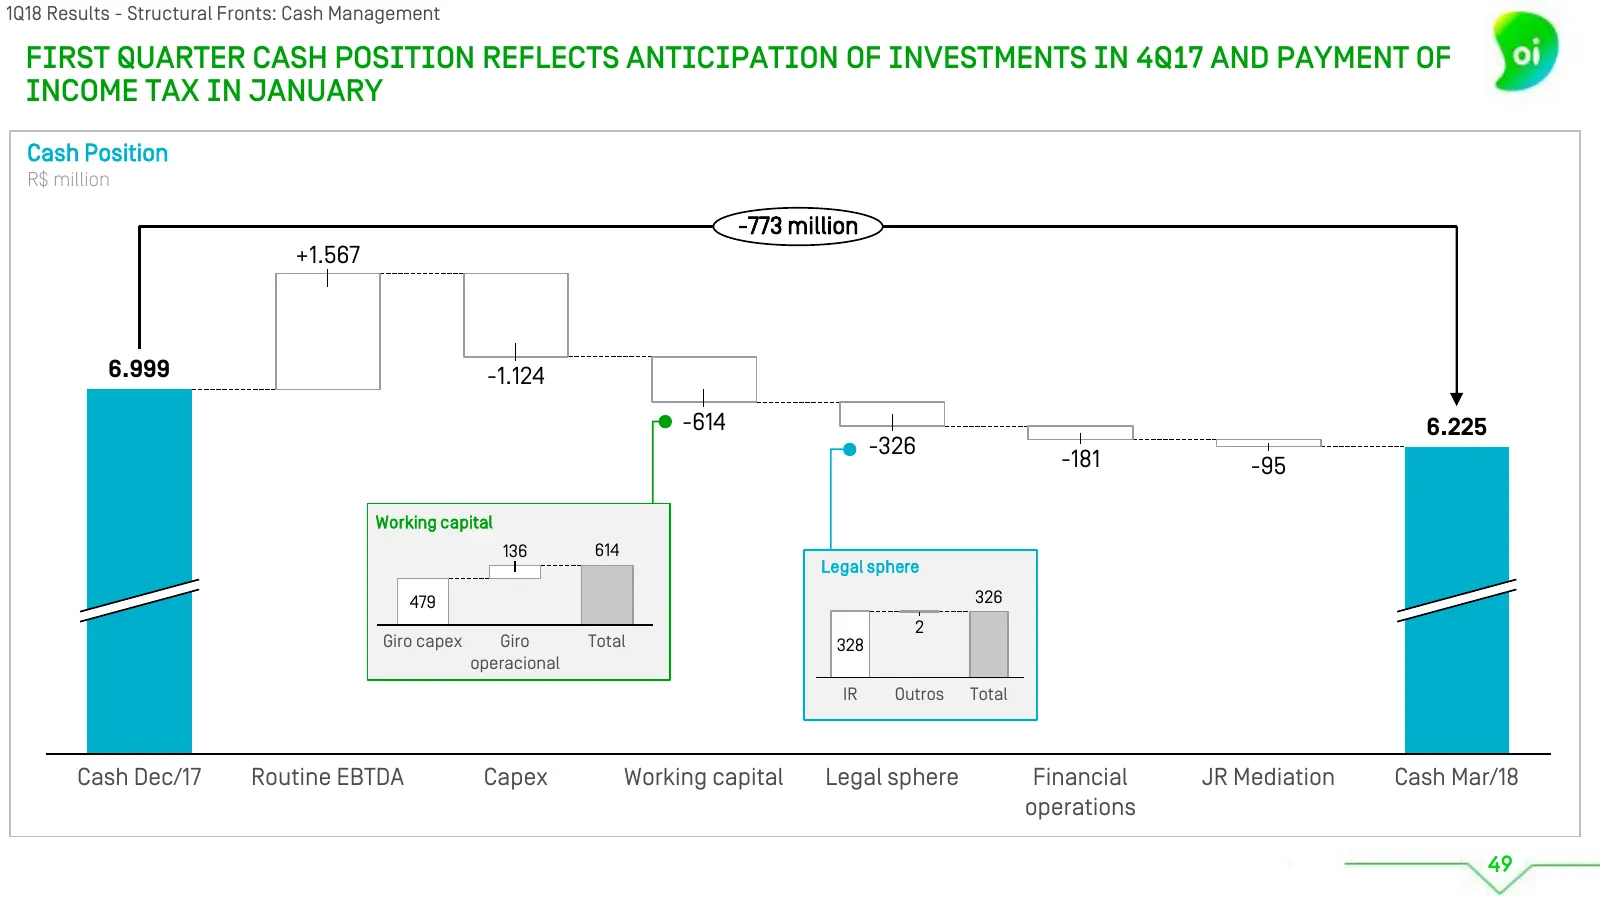
Slide 50: 1Q18 Results - Cash Management
1Q18 Results - Structural Fronts: Cash Management First quarter cash position reflects anticipation of investments in 4Q17 and payment of Income Tax in January Cash Position R$ million -773 million +1.567 6.999 -1.124 -614 6.225 -326 -181 -95 Working capital 136 614 Legal sphere 479 326 2 Giro capex
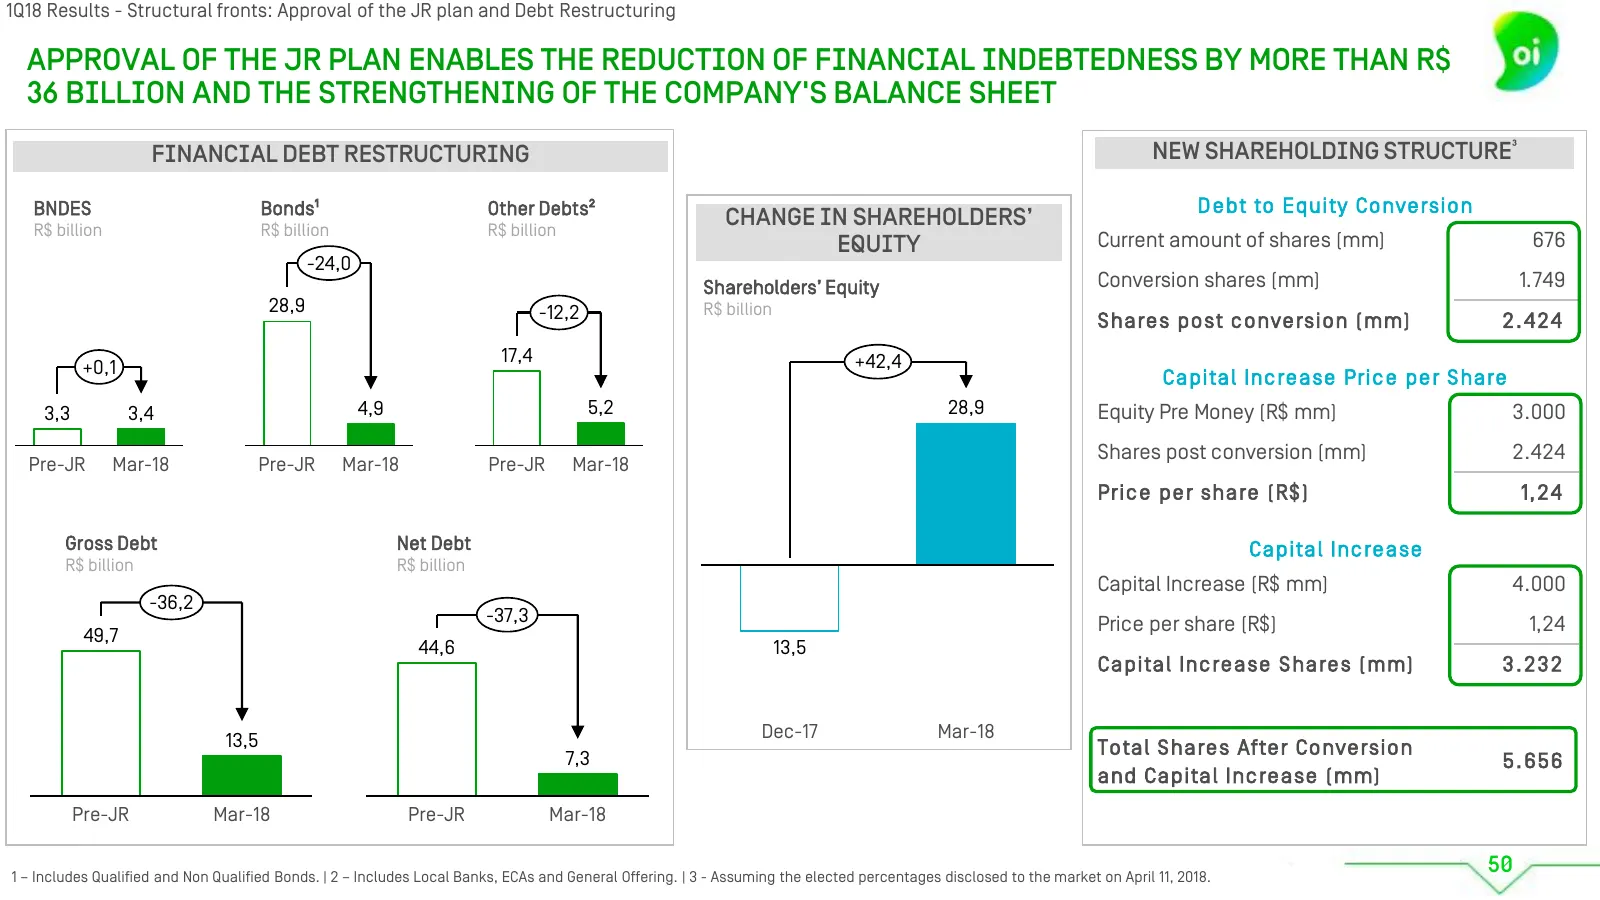
Slide 51: Approval of JR plan and debt restructuring
1Q18 Results - Structural fronts: Approval of the JR plan and Debt Restructuring Approval of the JR plan enables the reduction of financial indebtedness by more than R$ 36 billion and the strengthening of the Company's balance sheet FINANCIAL DEBT RESTRUCTURING NEW SHAREHOLDING STRUCTURE³ BNDES Bond
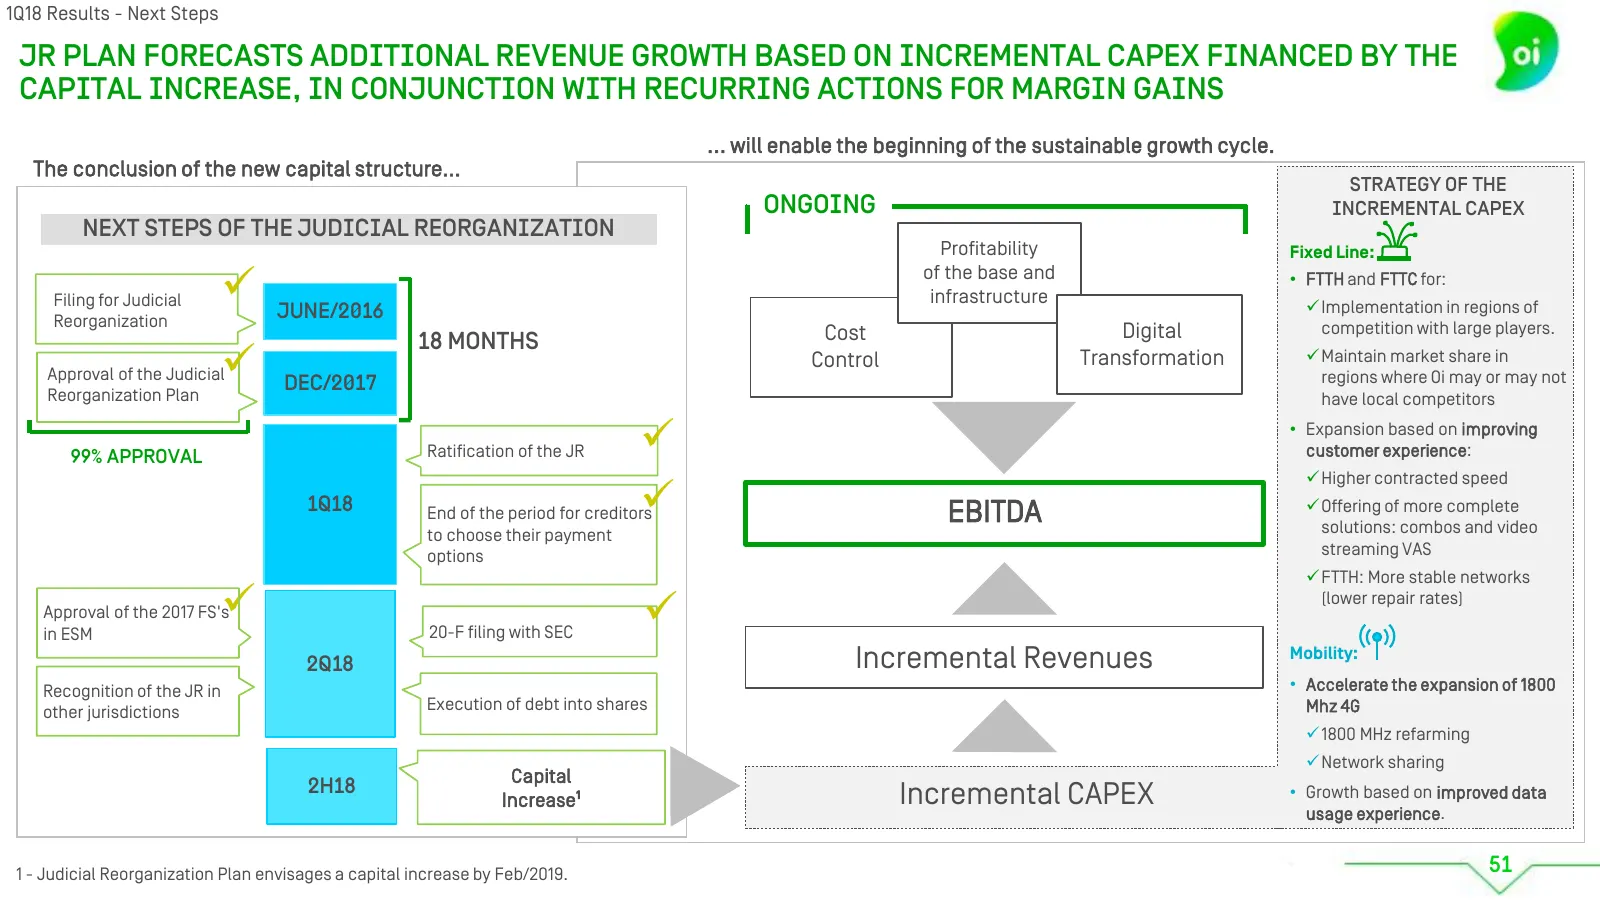
Slide 52: 1Q18 Results - Next Steps
1Q18 Results - Next Steps JR Plan forecasts additional revenue growth based on incremental capex financed by the capital increase, in conjunction with recurring actions for margin gains ... will enable the beginning of the sustainable growth cycle. The conclusion of the new capital structure... Stra
Source: Internet Archive copy of pharol.pt