Atlantic Capital Bancshares Inc
Atlantic Capital Bancshares — Shareholder Meeting (May 2018)
14 slides from Atlantic Capital Bancshares's shareholder meeting presentation, May 17, 2018
Slide 1: 2018 Annual Shareholders Meeting
NASDAQ TICKER: ACBI 2018 ANNUAL SHAREHOLDERS MEETING
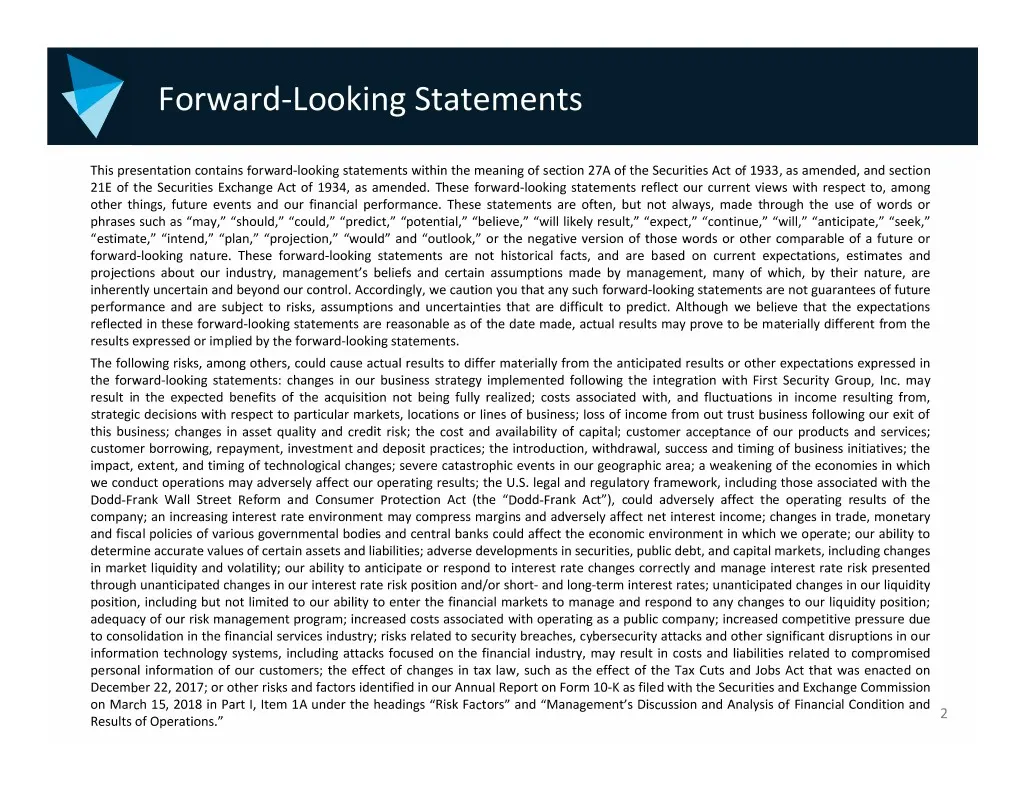
Slide 2: Forward-Looking Statements
Forward‐Looking Statements This presentation contains forward‐looking statements within the meaning of section 27A of the Securities Act of 1933, as amended, and section 21E of the Securities Exchange Act of 1934, as amended. These forward‐looking statements reflect our current views with respect to
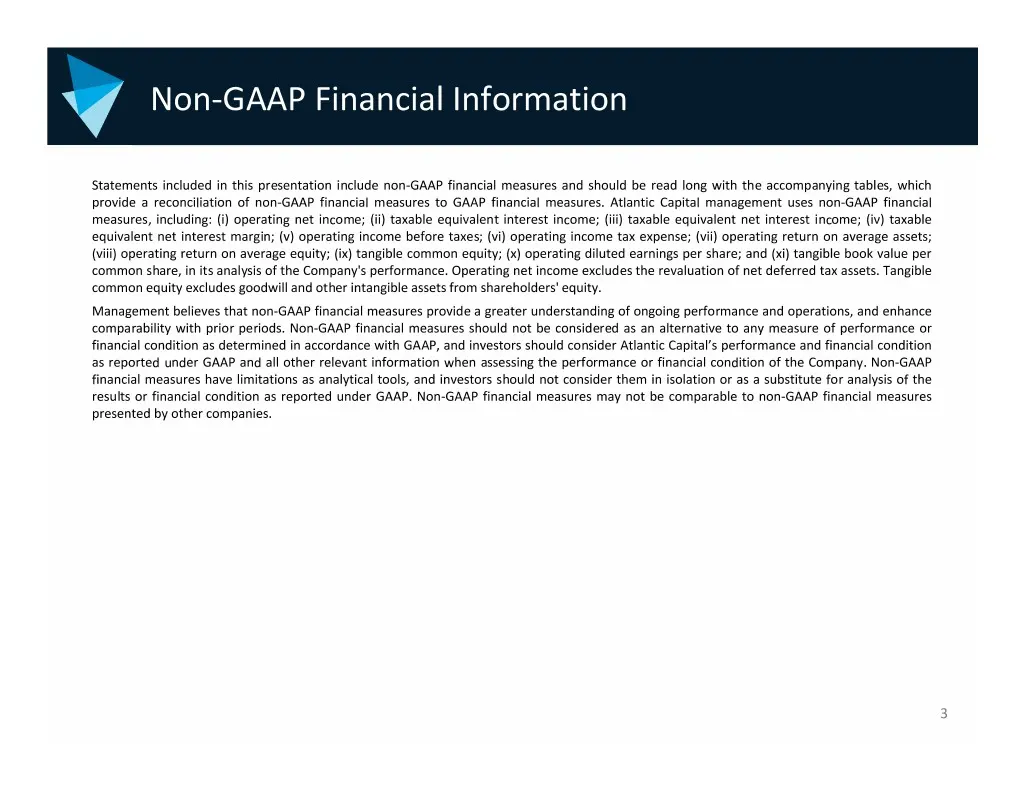
Slide 3: Non-GAAP Financial Information
Non‐GAAP Financial Information Statements included in this presentation include non‐GAAP financial measures and should be read long with the accompanying tables, which provide a reconciliation of non‐GAAP financial measures to GAAP financial measures. Atlantic Capital management uses non‐GAAP financ
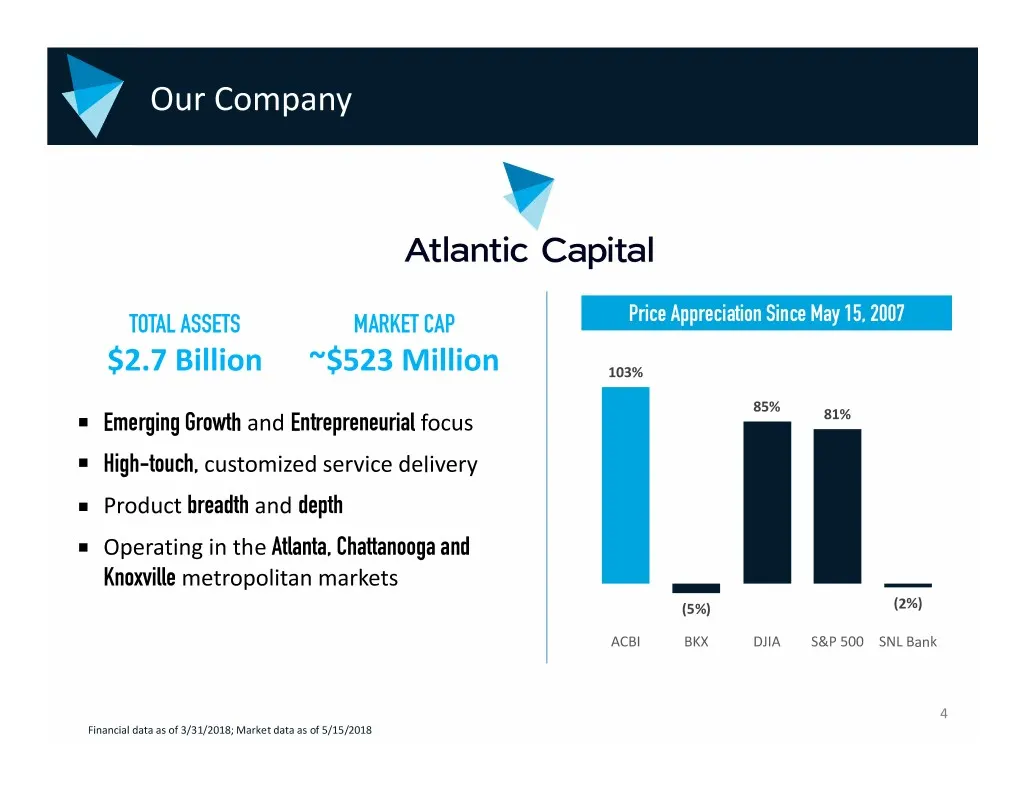
Slide 4: Our Company
Our Company TOTAL ASSETS MARKET CAP Price Appreciation Since May 15, 2007 $2.7 Billion ~$523 Million 103% 85% Emerging Growth and Entrepreneurial focus 81% High-touch, customized service delivery Product breadth and depth Operating in the Atlanta, Chattanooga and Knoxville metropolitan markets (5%)
Slide 5: 2017 Results
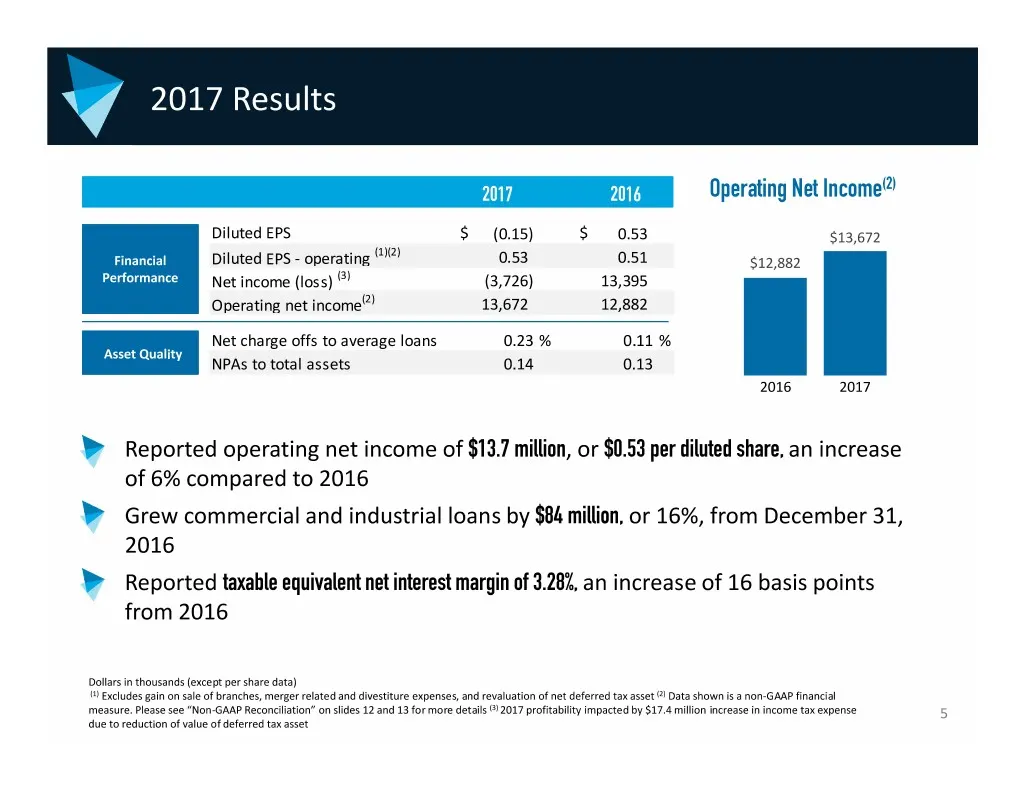
2017 Results (2) 2017 2016 Operating Net Income Diluted EPS $ (0.15) $ 0.53 $13,672 (1)(2) Financial Diluted EPS ‐ operating 0.53 0.51 $12,882 Performance Net income (loss) (3) (3,726) 13,395 Operating net income(2) 13,672 12,882 Net charge offs to average loans 0.23 % 0.11 % Asset Quality NPAs to t
Slide 6: First Quarter 2018 Financial Highlights
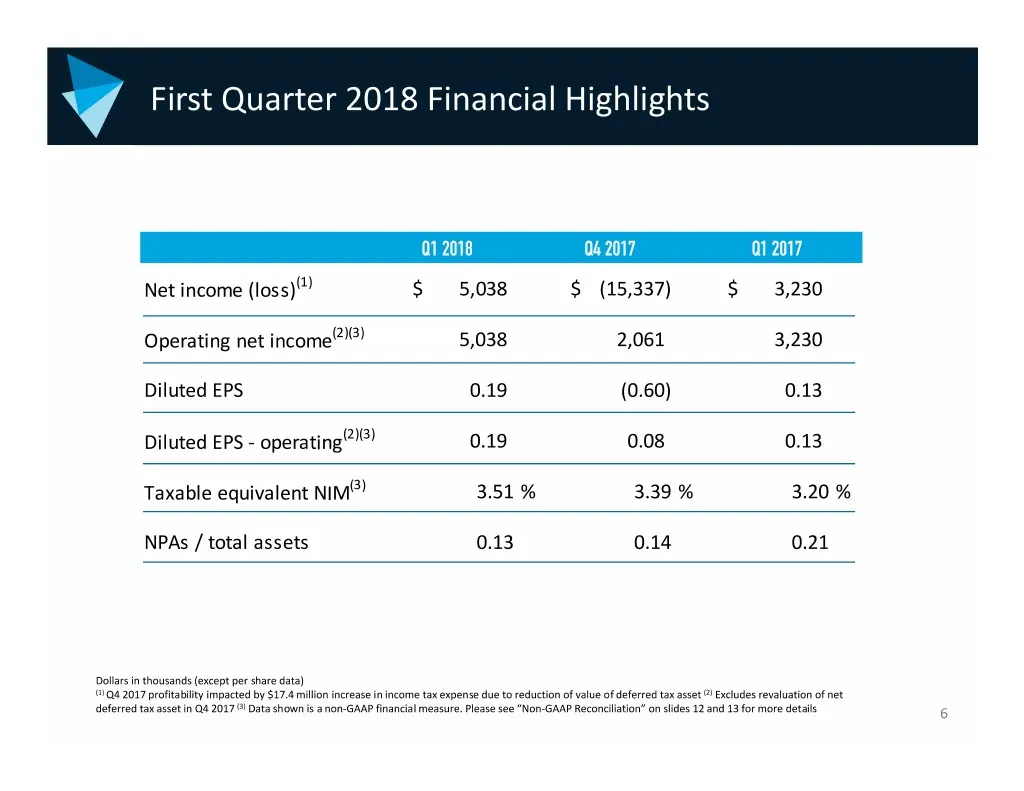
First Quarter 2018 Financial Highlights Q1 2018 Q4 2017 Q1 2017 Net income (loss)(1) $5,038 $ (15,337) $ 3,230 Operating net income(2)(3) 5,038 2,061 3,230 Diluted EPS 0.19 (0.60) 0.13 Diluted EPS ‐ operating(2)(3) 0.19 0.08 0.13 Taxable equivalent NIM(3) 3.51 % 3.39 % 3.20 % NPAs / total assets 0.1
Slide 7: 2018 Priorities
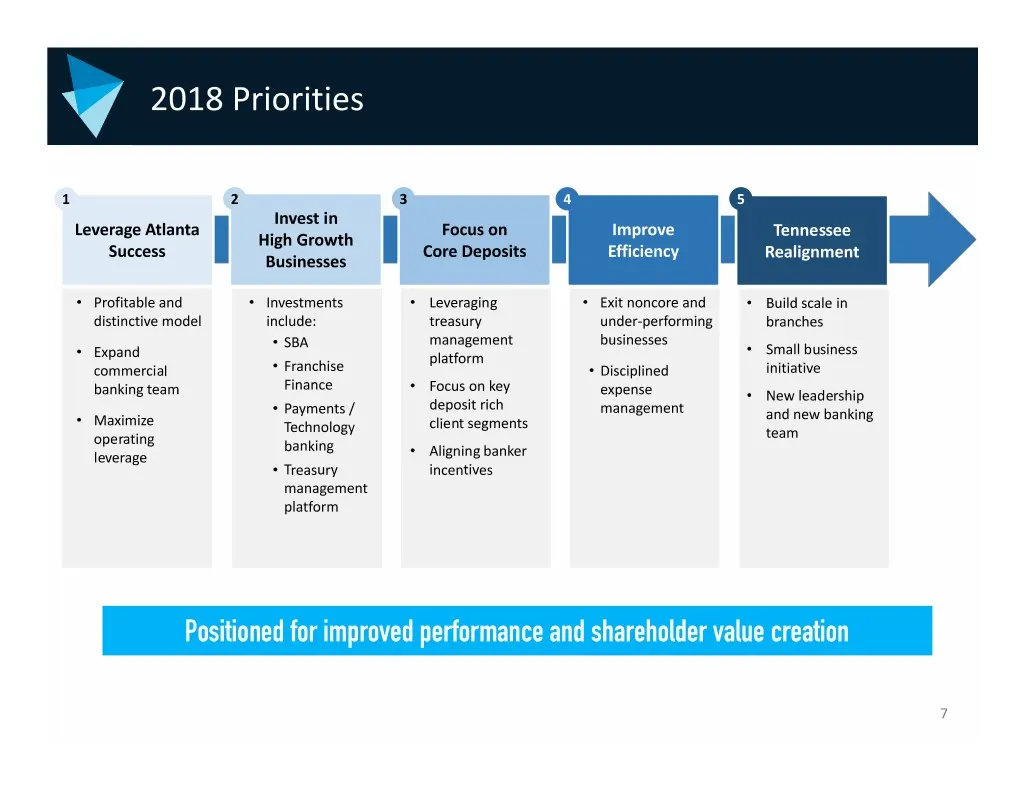
2018 Priorities 1 2 3 4 5 Invest in Leverage Atlanta Focus on Improve Tennessee High Growth Success Core Deposits Efficiency Realignment Businesses • Profitable and • Investments • Leveraging • Exit noncore and • Build scale in distinctive model include: treasury under‐performing branches management
Slide 8: Leverage Atlanta Success
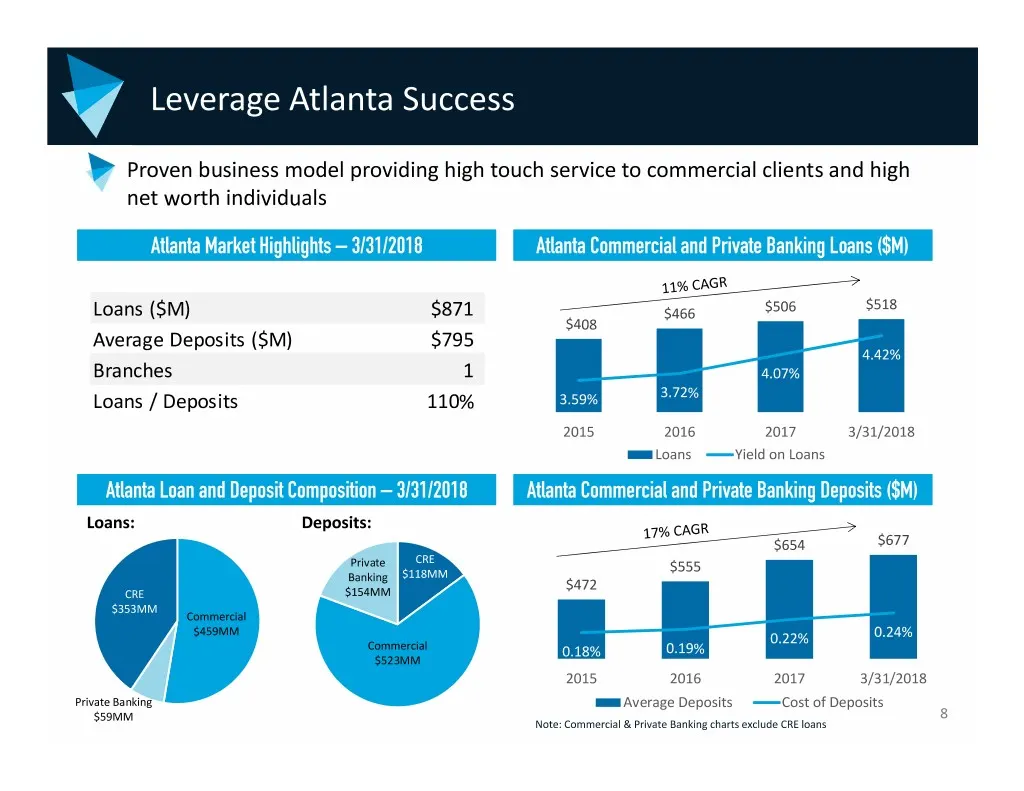
Leverage Atlanta Success Proven business model providing high touch service to commercial clients and high net worth individuals Atlanta Market Highlights – 3/31/2018 Atlanta Commercial and Private Banking Loans ($M) $518 Loans ($M) $871 $466 $506 $408 Average Deposits ($M) $795 4.42% Branches 1 4.0
Slide 9: Investing in High Growth Businesses
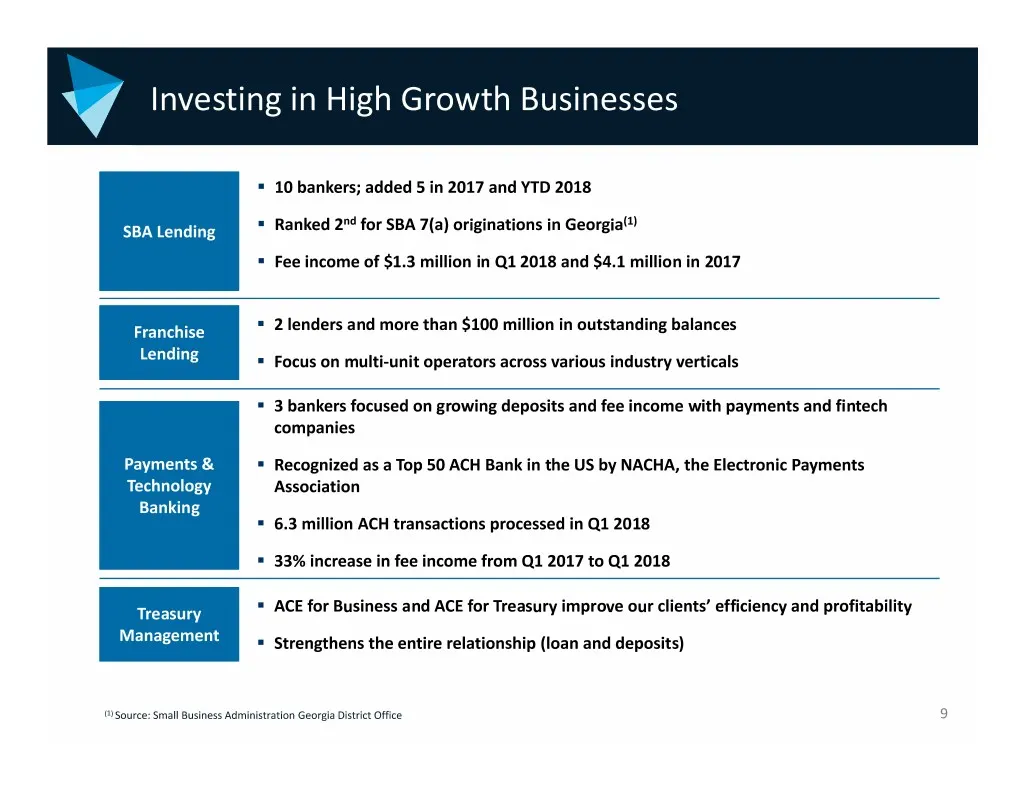
Investing in High Growth Businesses . 10 bankers; added 5 in 2017 and YTD 2018 nd (1) SBA Lending . Ranked 2 for SBA 7(a) originations in Georgia . Fee income of $1.3 million in Q1 2018 and $4.1 million in 2017 Franchise . 2 lenders and more than $100 million in outstanding balances Lending . Focus
Slide 10: We Serve Growth Markets
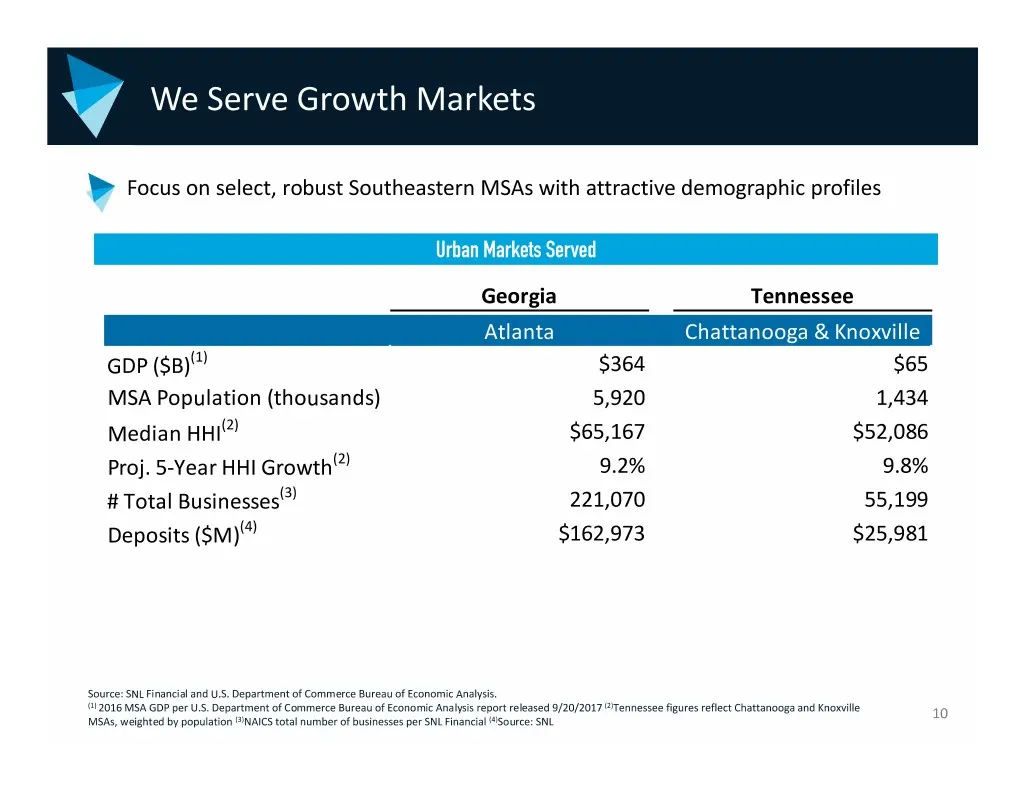
We Serve Growth Markets Focus on select, robust Southeastern MSAs with attractive demographic profiles Urban Markets Served Georgia Tennessee Atlanta Chattanooga & Knoxville GDP ($B)(1) $364 $65 MSA Population (thousands) 5,920 1,434 Median HHI(2) $65,167 $52,086 Proj. 5‐Year HHI Growth(2) 9.2% 9.8%
Slide 11: Achievable Operating Leverage
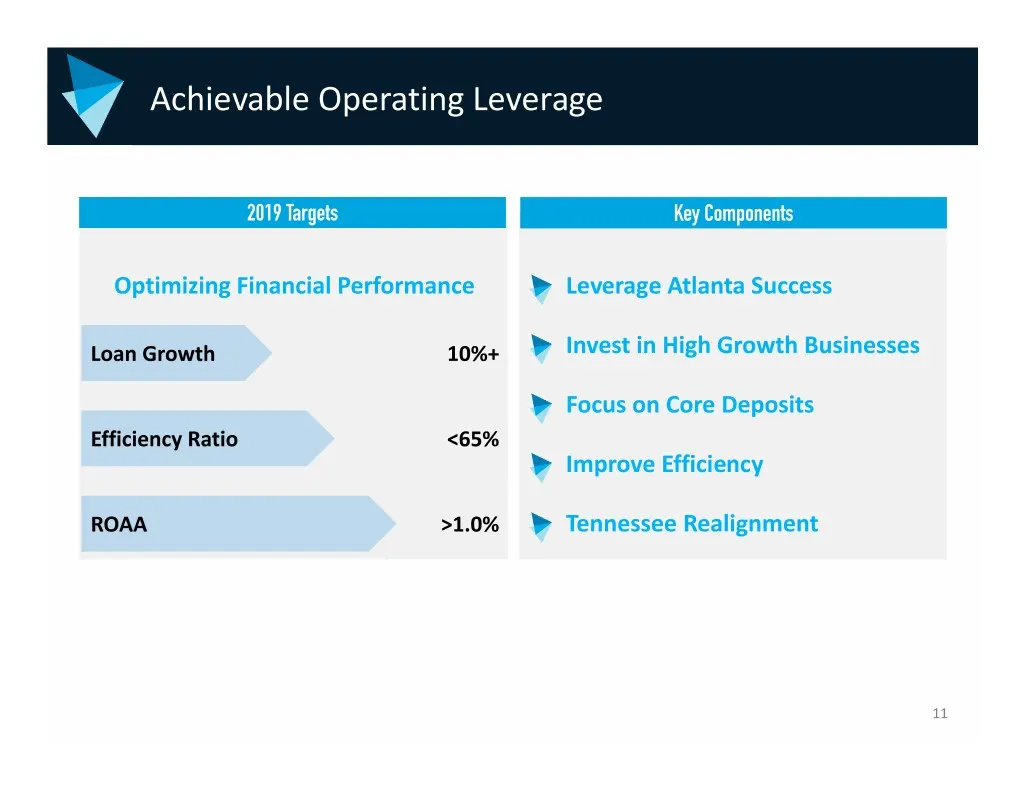
Achievable Operating Leverage 2019 Targets Key Components Optimizing Financial Performance Leverage Atlanta Success Loan Growth 10%+ Invest in High Growth Businesses Focus on Core Deposits Efficiency Ratio <65% Improve Efficiency ROAA >1.0% Tennessee Realignment 11
Slide 12: Non-GAAP Reconciliation
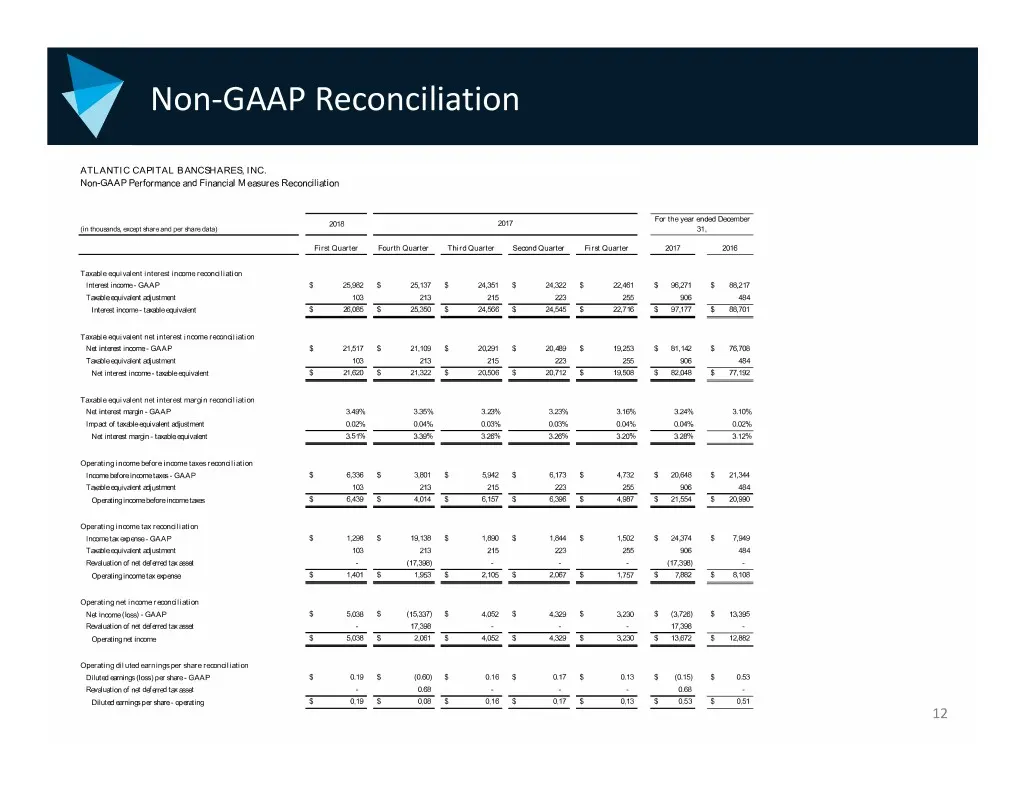
Non‐GAAP Reconciliation ATLANTIC CAPITAL BANCSHARES, INC. Non-GAAP Performance and Financial Measures Reconciliation For the year ended December 2018 2017 (in thousands, except share and per share data) 31, First Quarter Fourth Quarter Third Quarter Second Quarter First Quarter 2017 2016 Taxable equ
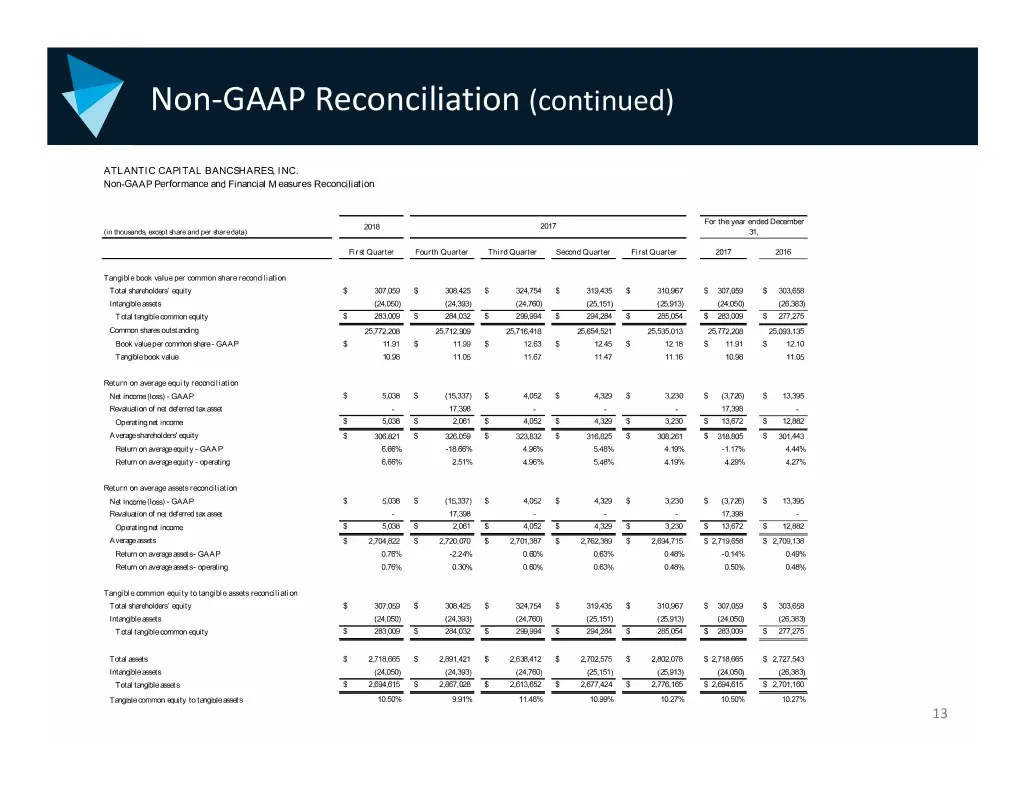
Slide 13: Non-GAAP Reconciliation (continued)
Non‐GAAP Reconciliation (continued) ATLANTIC CAPITAL BANCSHARES, INC. Non-GAAP Performance and Financial Measures Reconciliation For the year ended December 2018 2017 (in thousands, except share and per share data) 31, First Quarter Fourth Quarter Third Quarter Second Quarter First Quarter 2017 2016
Slide 14: Appendix
APPENDIX INVESTOR PRESENTATION MARCH 2018 THE SOUTHEAST’S BUSINESS BANK
Source: SEC EDGAR · 8-K filed May 17, 2018
More decks from Atlantic Capital Bancshares Inc
 Q4 2021 Earnings Presentation27 slides · Jan 24, 2022
 Q3 2021 Earnings Presentation30 slides · Oct 27, 2021
 Q3 2021 Earnings Presentation40 slides · Oct 27, 2021
 Q2 2021 Earnings Presentation33 slides · Jul 23, 2021
 Merger or Acquisition (July 2021)16 slides · Jul 23, 2021
 Q2 2021 Earnings Presentation39 slides · Jul 23, 2021