Atlantic Capital Bancshares Inc
Atlantic Capital Bancshares — Q2 2021 Earnings Presentation
39 slides from Atlantic Capital Bancshares's earnings presentation, Jul 23, 2021
Slide 1: Earnings Call 2Q 2021
Earnings Call 2Q 2021 Friday, July 23, 2021 Exhibit 99.2
Slide 2: Disclaimer
DISCLAIMER 2 Statements included in this communication, which are not historical in nature are intended to be, and are hereby identified as, forward-looking statements for purposes of the safe harbor provided by Section 27A of the Securities Act of 1933 and Section 21E of the Securities Exchange Act
Slide 3: Overview of Franchise
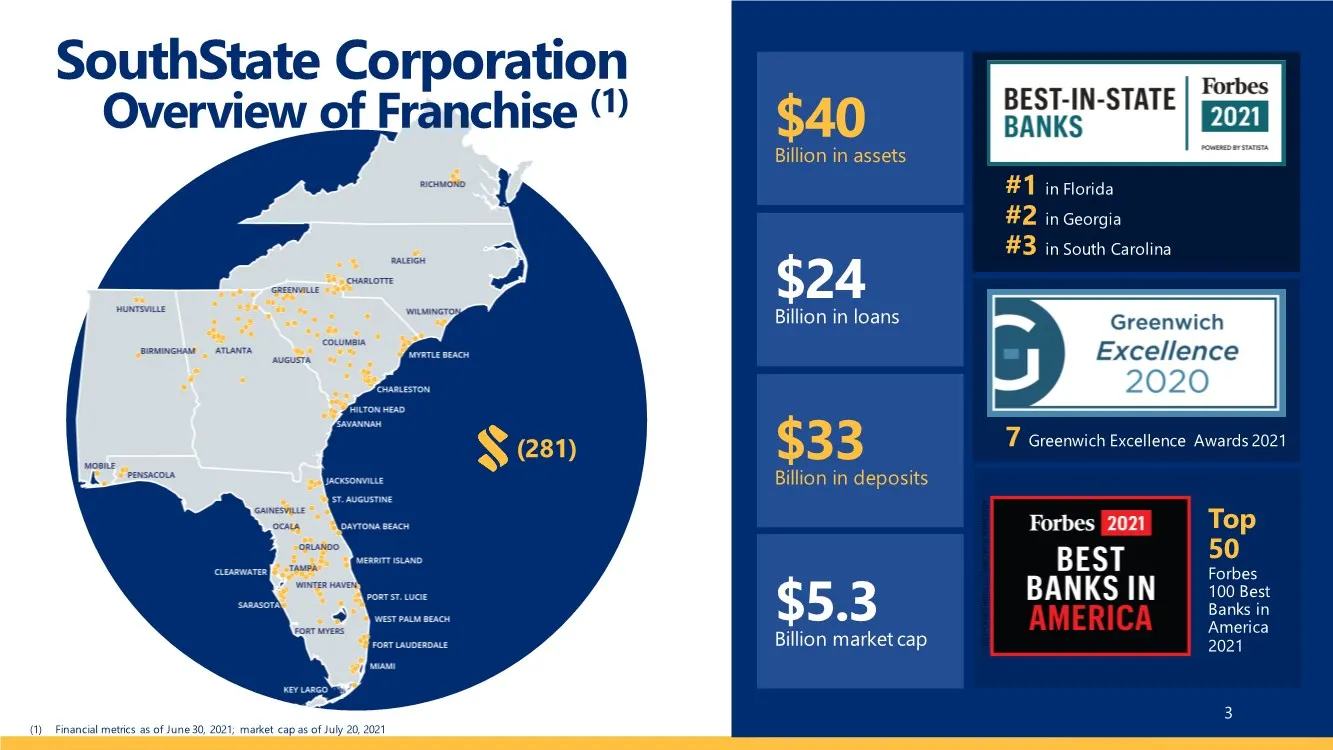
$33 Billion in deposits $24 Billion in loans $40 Billion in assets $5.3 Billion market cap (1) Financial metrics as of June 30, 2021; market cap as of July 20, 2021 SouthState Corporation Overview of Franchise (1) 3 (281) 7 Greenwich Excellence Awards 2021 #1 in Florida #2 in Georgia #3 in South Car

Slide 4: Guiding Principles
Local Market Leadership Our business model supports the unique character of the communities we serve and encourages decision making by the banker that is closest to the customer. Long-Term Horizon We think and act like owners and measure success over entire economic cycles. We prioritize soundness b
Slide 5: Investment Thesis
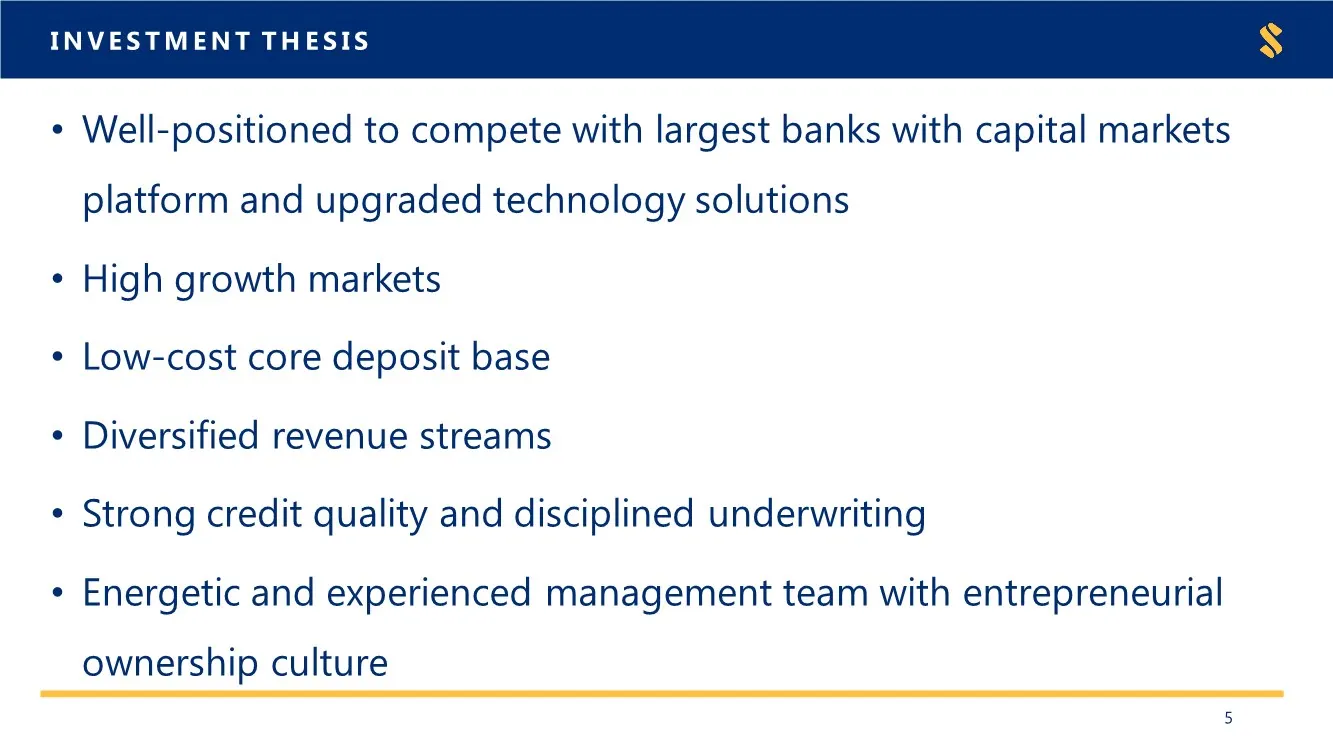
INVESTMENT THESIS 5 • Well-positioned to compete with largest banks with capital markets platform and upgraded technology solutions • High growth markets • Low-cost core deposit base • Diversified revenue streams • Strong credit quality and disciplined underwriting • Energetic and experienced manage
Slide 6: Quarterly Results
Quarterly Results Ga
Slide 7: Highlights | Linked Quarter
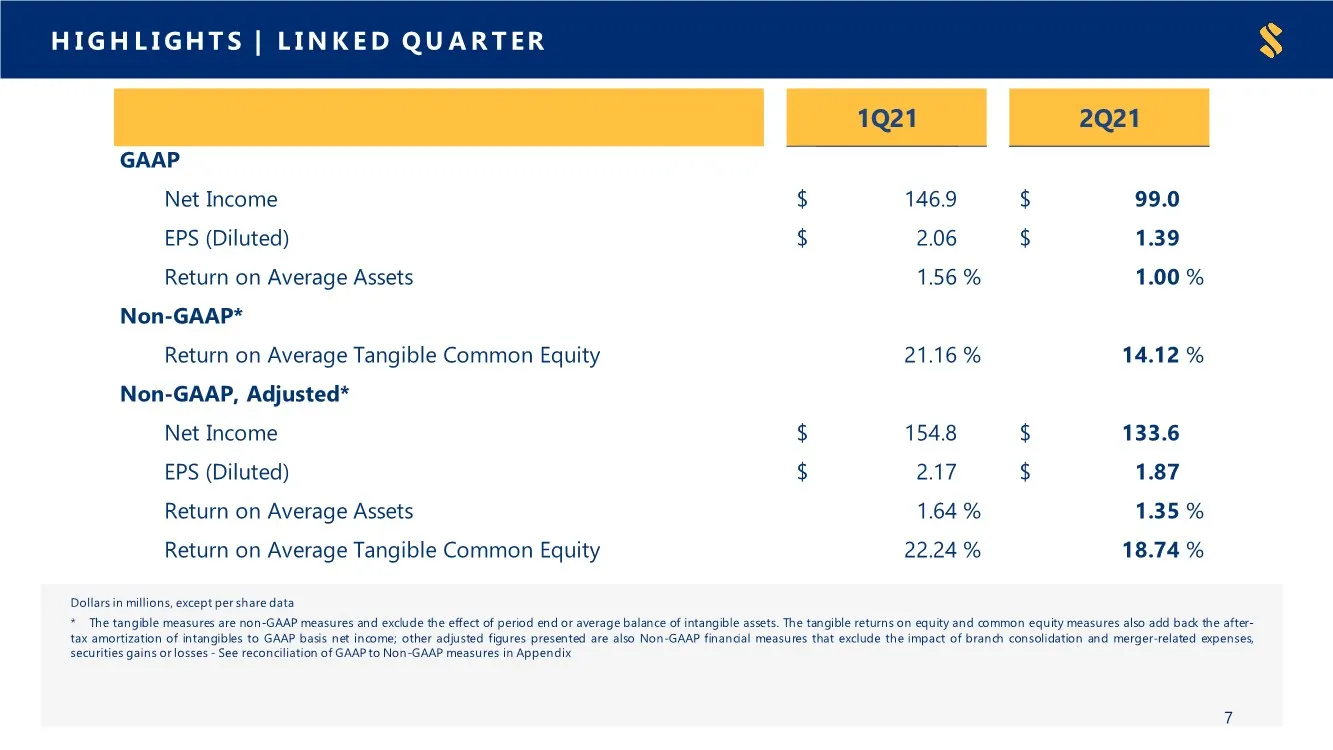
HIGHLIGHTS | LINKED QUARTER Dollars in millions, except per share data * The tangible measures are non-GAAP measures and exclude the effect of period end or average balance of intangible assets. The tangible returns on equity and common equity measures also add back the after- tax amortization of in
Slide 8: Second quarter financial highlights
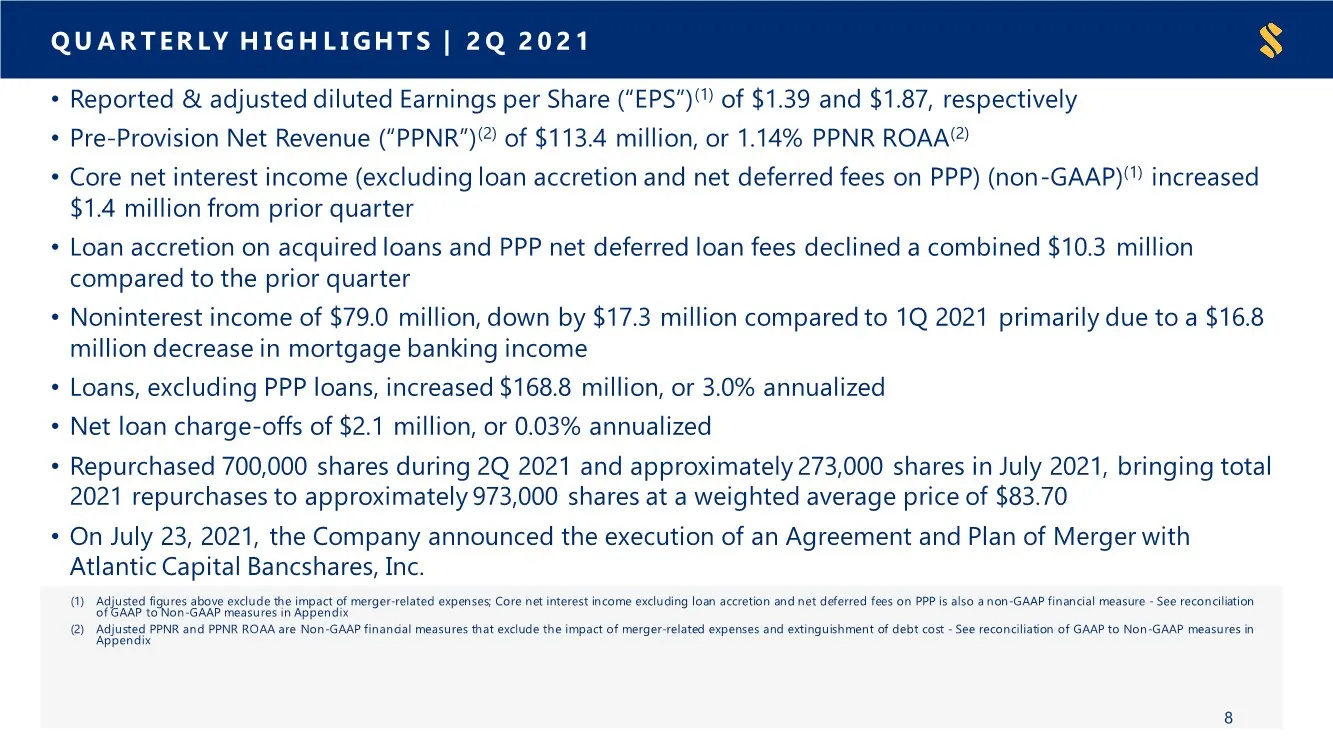
(1) Adjusted figures above exclude the impact of merger-related expenses; Core net interest income excluding loan accretion and net deferred fees on PPP is also a non-GAAP financial measure - See reconciliation of GAAP to Non-GAAP measures in Appendix (2) Adjusted PPNR and PPNR ROAA are Non-GAAP fin
Slide 9: PPNR Bridge from 1Q21 to 2Q21
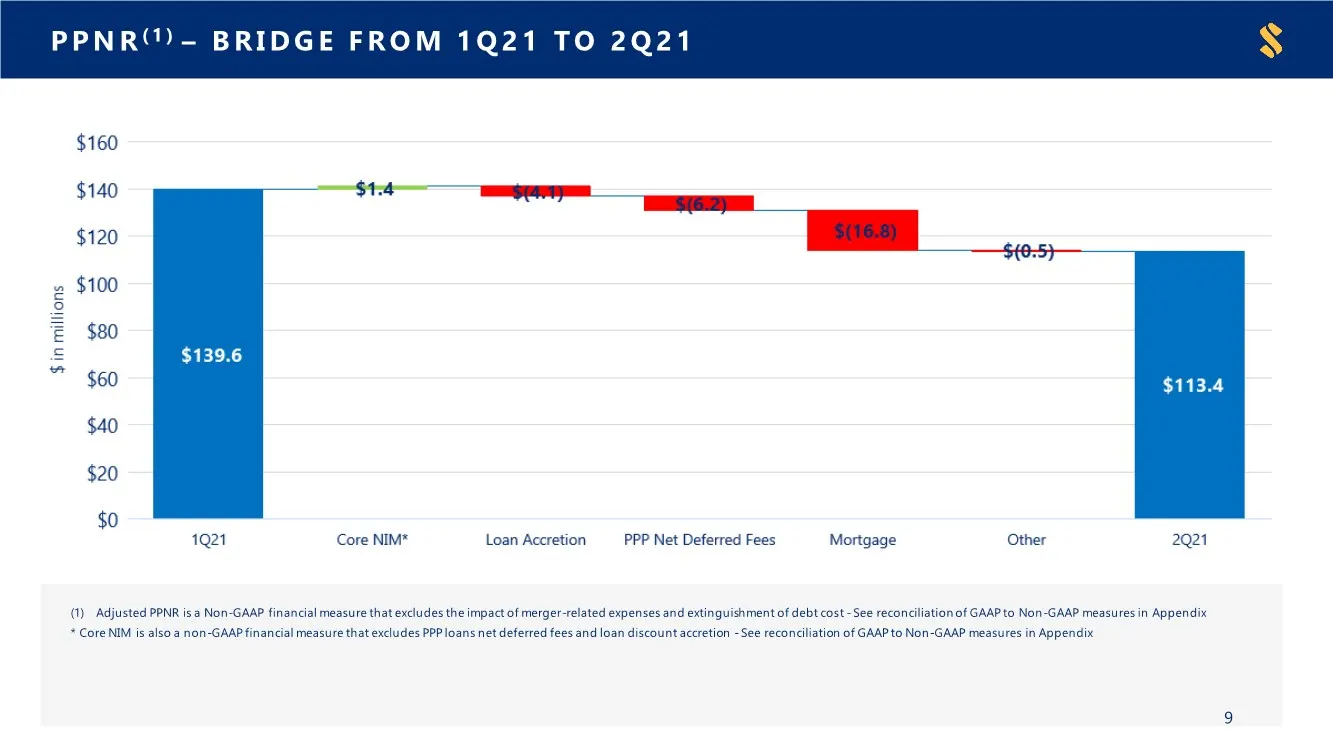
PPNR( 1 ) – BRIDGE FROM 1Q21 TO 2Q21 (1) Adjusted PPNR is a Non-GAAP financial measure that excludes the impact of merger-related expenses and extinguishment of debt cost -See reconciliation of GAAP to Non-GAAP measures in Appendix * Core NIM is also a non-GAAP financial measure that excludes PPP lo
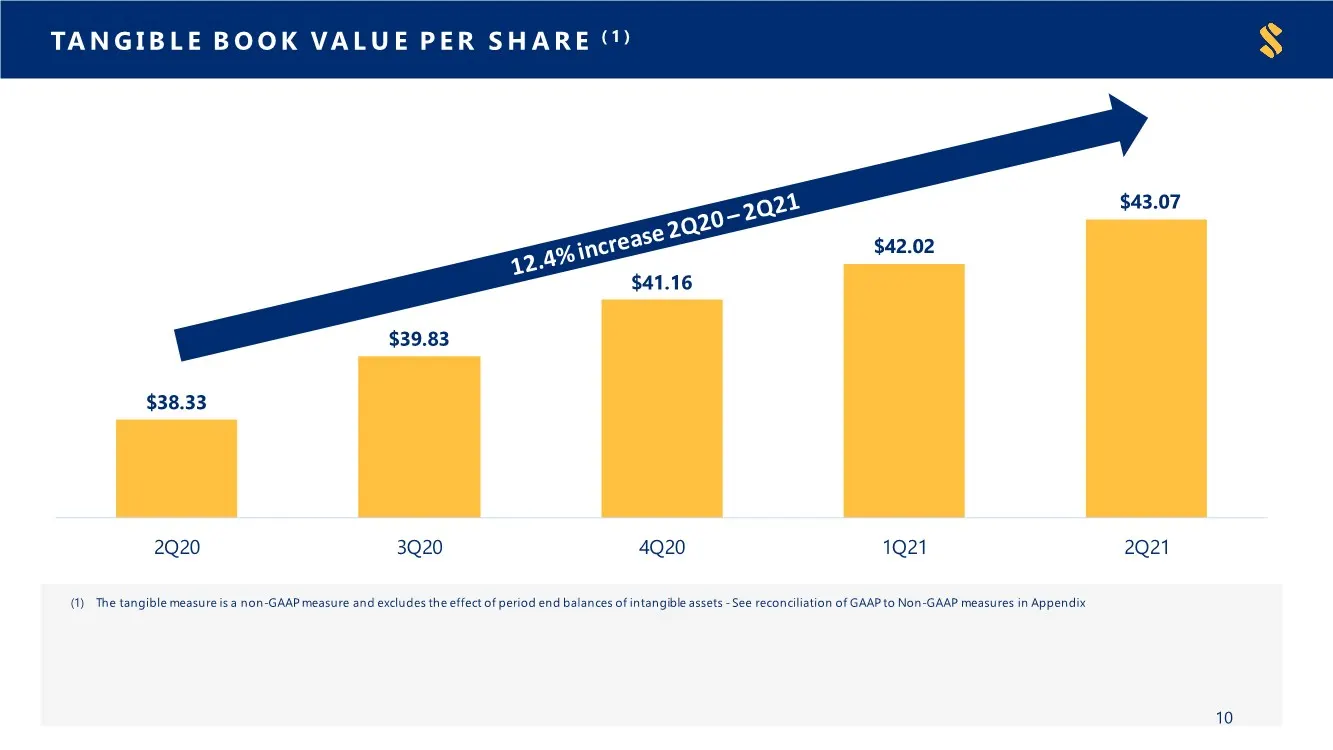
Slide 10: Tangible Book Value Per Share
TANGIBLE BOOK VALUE PER SHARE ( 1 ) (1) The tangible measure is a non-GAAP measure and excludes the effect of period end balances of intangible assets -See reconciliation of GAAP to Non-GAAP measures in Appendix $38.33 $39.83 $41.16 $42.02 $43.07 $36.00 $37.00 $38.00 $39.00 $40.00 $41.00 $42.00 $43.
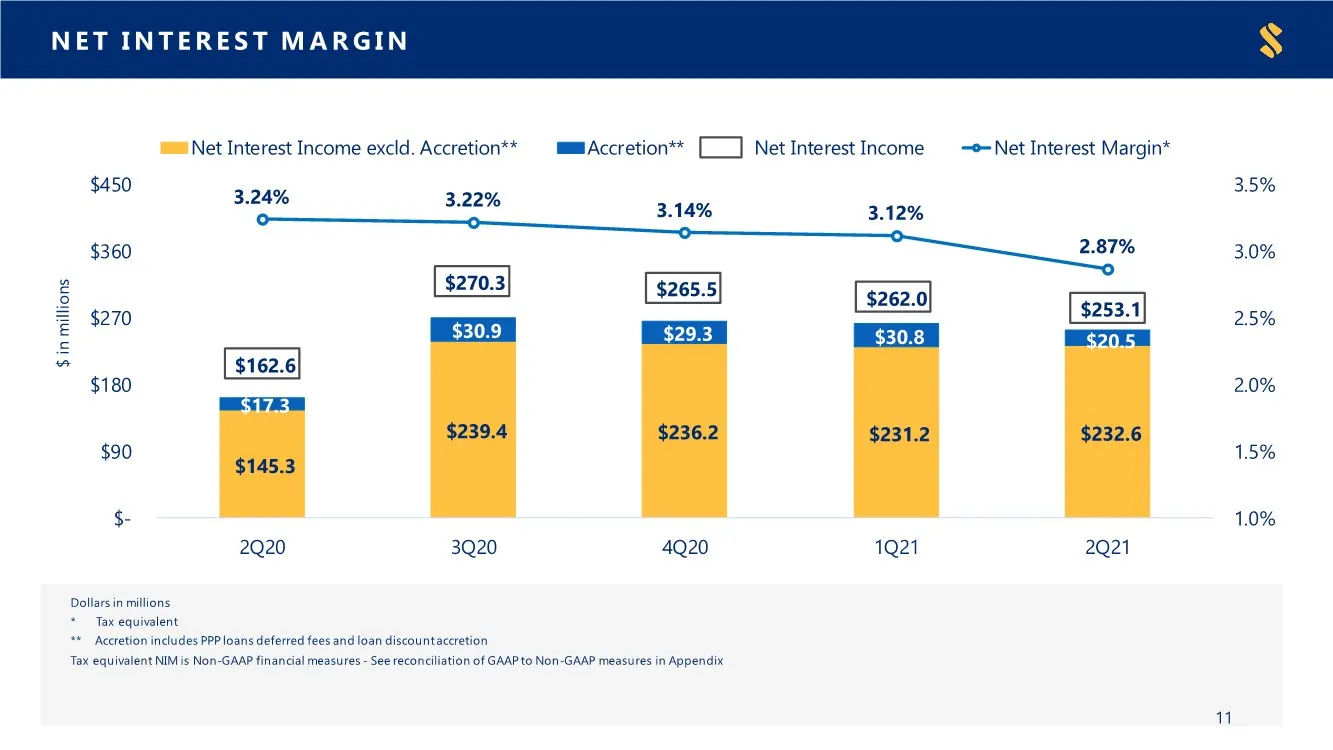
Slide 11: Net Interest Margin
NET INTEREST MARGIN Dollars in millions * Tax equivalent ** Accretion includes PPP loans deferred fees and loan discountaccretion Tax equivalent NIM is Non-GAAP financial measures - See reconciliation of GAAP to Non-GAAP measures in Appendix 11 $145.3 $239.4 $236.2 $231.2 $232.6 $17.3 $30.9 $29.3 $3
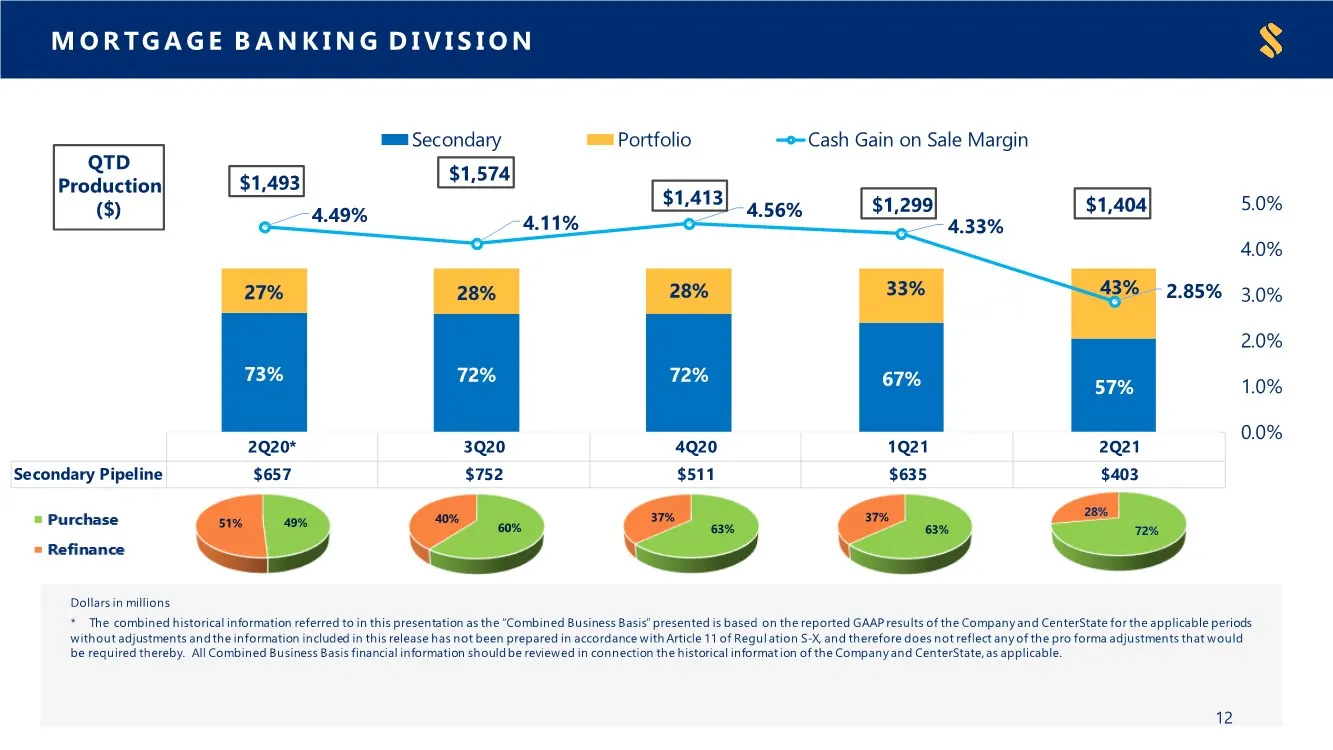
Slide 12: Mortgage Banking Division
2Q20* 3Q20 4Q20 1Q21 2Q21 Secondary Pipeline $657 $752 $511 $635 $403 0.0% 1.0% 2.0% 3.0% 4.0% 5.0% 73% 72% 72% 67% 57% 27% 28% 28% 33% 43% 4.49% 4.11% 4.56% 4.33% 2.85% 0.0% 1.0% 2.0% 3.0% 4.0% 5.0% 0% 20% 40% 60% 80% 100% 120% 140% Secondary Portfolio Cash Gain on Sale Margin MORTGAGE BANKING DIVI
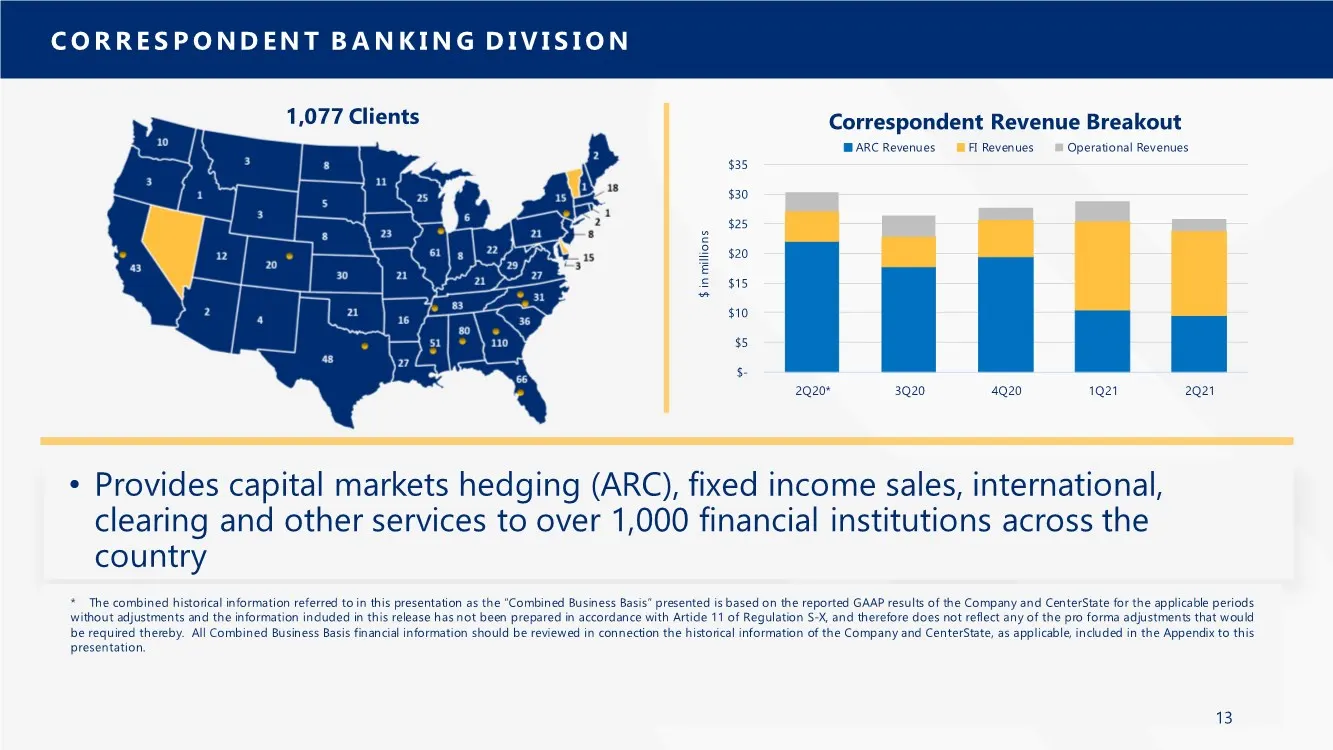
Slide 13: Correspondent Banking Division
• Provides capital markets hedging (ARC), fixed income sales, international, clearing and other services to over 1,000 financial institutions across the country CORRESPONDENT BANKING DIVISION 1,077 Clients $- $5 $10 $15 $20 $25 $30 $35 2Q20* 3Q20 4Q20 1Q21 2Q21 $ in millions Correspondent Revenue Br
Slide 14: Interest Rate Sensitivity
Interest Rate Sensitivity Go
Slide 15: Cash & Securities
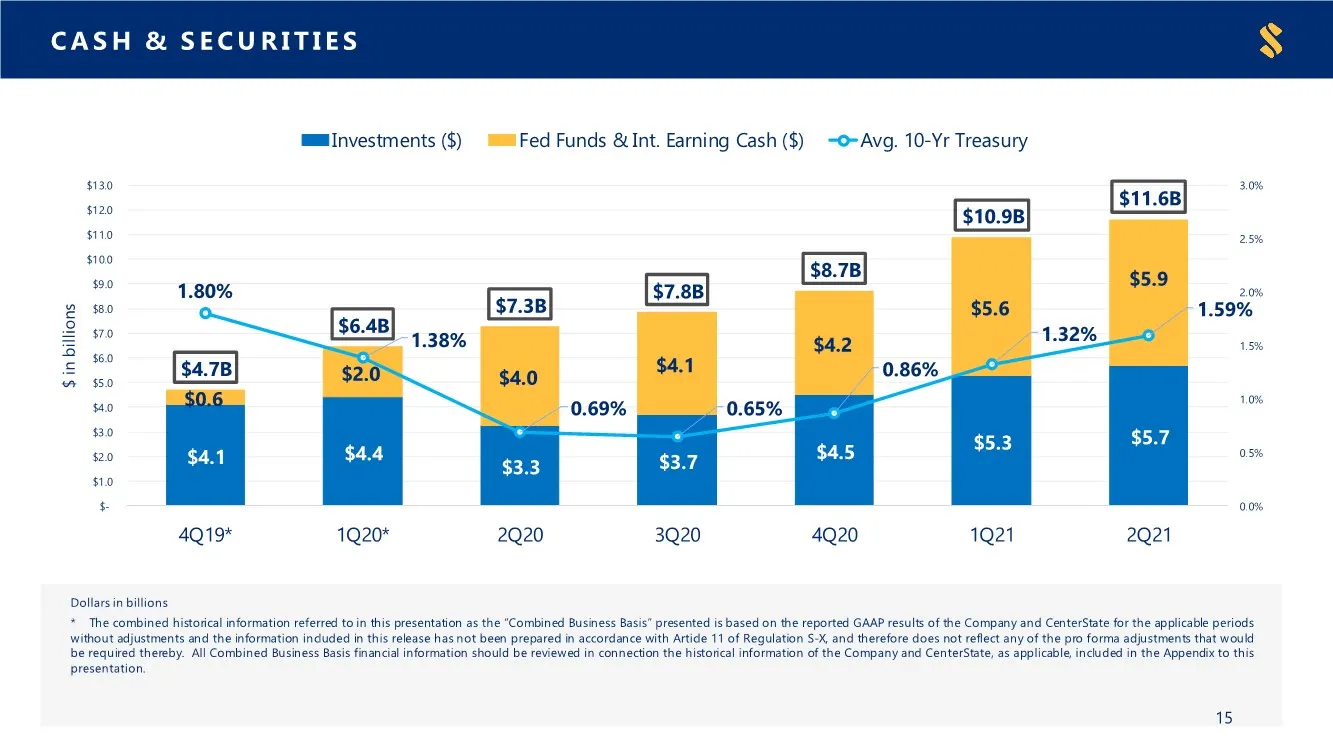
CASH & SECURITIES Dollars in billions * The combined historical information referred to in this presentation as the “Combined Business Basis” presented is based on the reported GAAP results of the Company and CenterState for the applicable periods without adjustments and the information included in
Slide 16: Excess Liquidity Provides Significant Tailwind
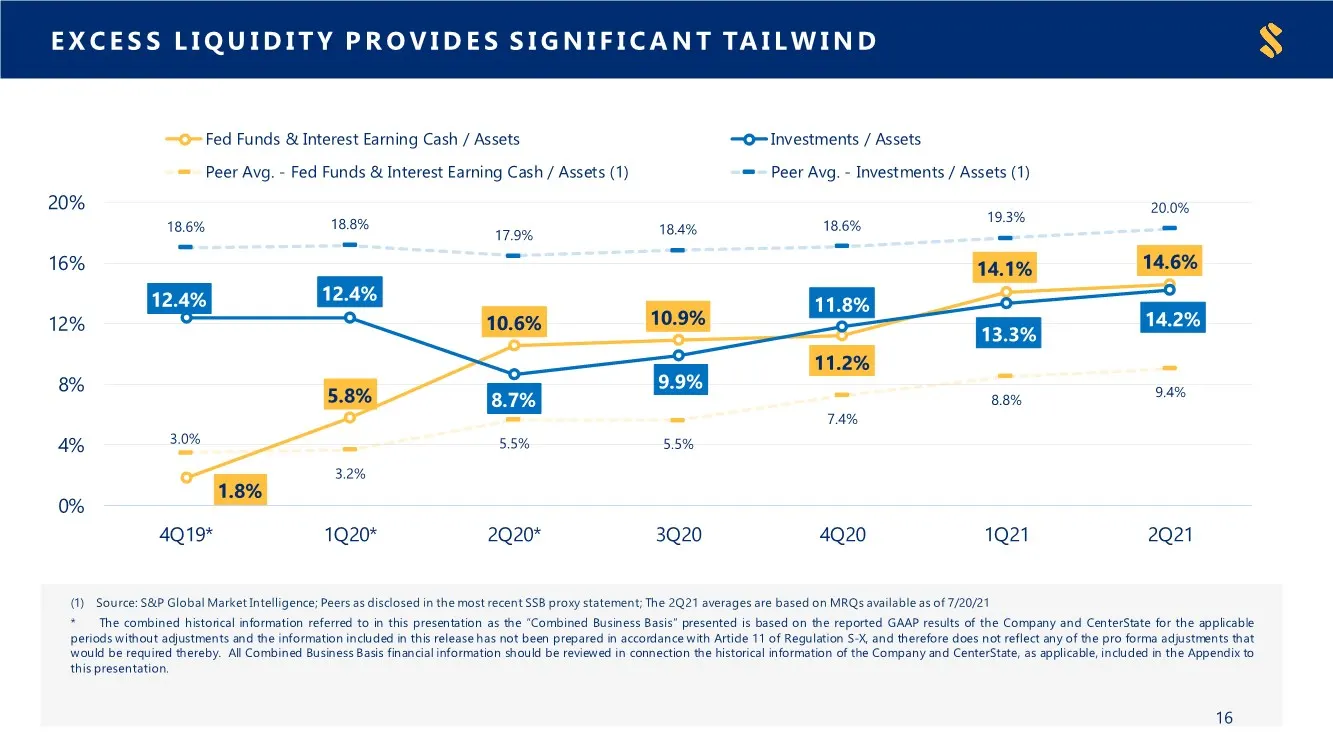
EXCESS LIQUIDITY PROVIDES SIGNIFICANT TAILWIND (1) Source: S&P Global Market Intelligence; Peers as disclosed in the most recent SSB proxy statement; The 2Q21 averages are based on MRQs available as of 7/20/21 * The combined historical information referred to in this presentation as the “Combined Bu
Slide 17: Interest Rate Risk Profile
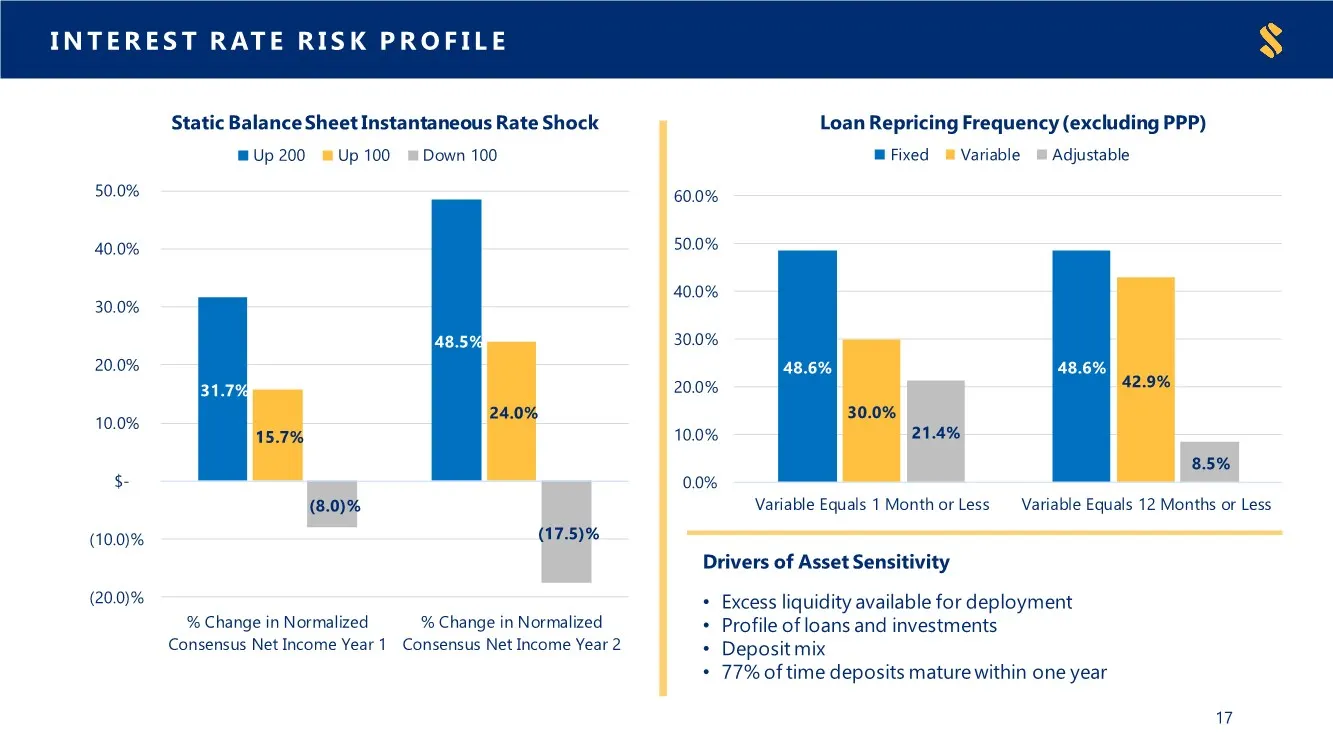
INTEREST RATE RISK PROFILE 31.7% 48.5% 15.7% 24.0% (8.0)% (17.5)% (20.0)% (10.0)% $- 10.0% 20.0% 30.0% 40.0% 50.0% % Change in Normalized Consensus Net Income Year 1 % Change in Normalized Consensus Net Income Year 2 Static Balance Sheet Instantaneous Rate Shock Up 200 Up 100 Down 100 17 48.6% 48.6%

Slide 18: Balance Sheet Strength
Balance Sheet Strength Ga
Slide 19: Loan and Deposit Trend
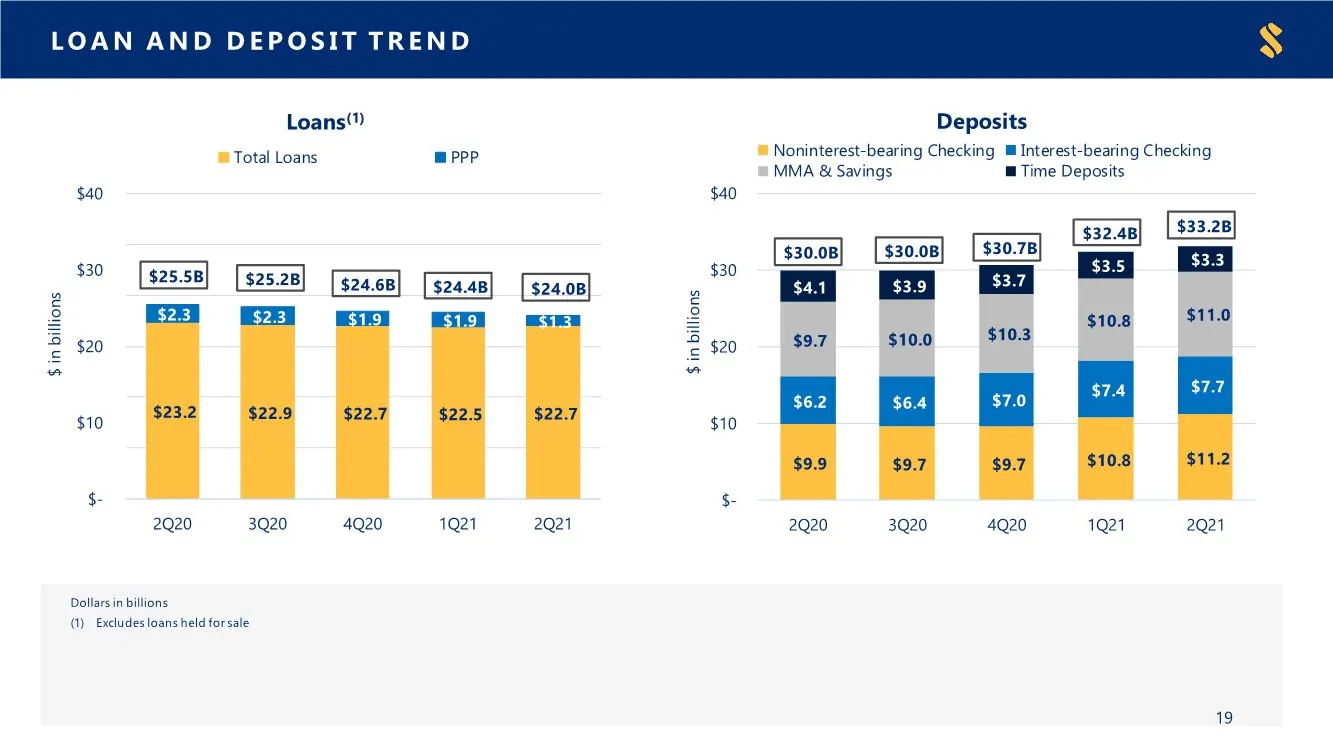
LOAN AND DEPOSIT TREND $23.2 $22.9 $22.7 $22.5 $22.7 $2.3 $2.3 $1.9 $1.9 $1.3 $25.5B $25.2B $24.6B $24.4B $24.0B $23.0B $23.5B $24.0B $24.5B $25.0B $25.5B $26.0B $- $10 $20 $30 $40 2Q20 3Q20 4Q20 1Q21 2Q21 $ in billions Loans(1) Total Loans PPP Dollars in billions (1) Excludes loans held forsale 19
Slide 20: Total Loan Portfolio
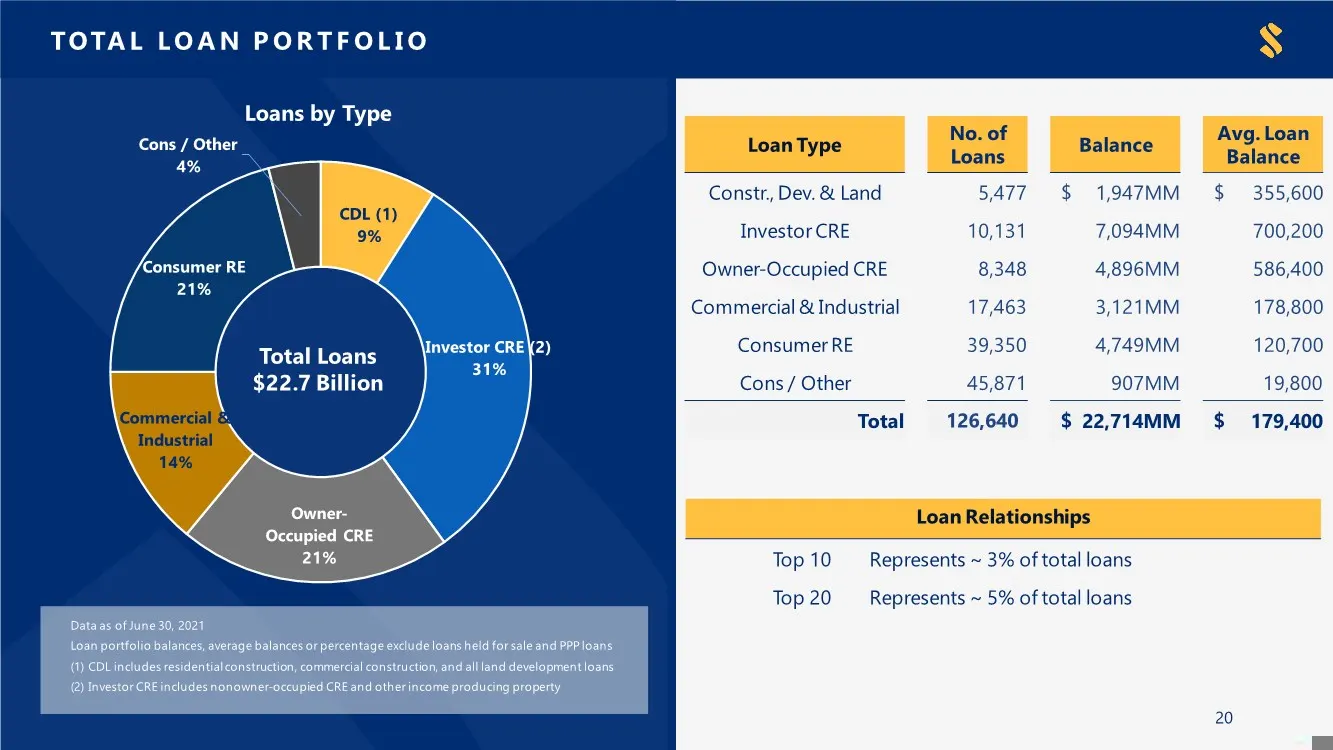
CDL (1) 9% Investor CRE (2) 31% Owner- Occupied CRE 21% Commercial & Industrial 14% Consumer RE 21% Cons / Other 4% TOTAL LOAN PORTFOLIO 20 Data as of June 30, 2021 Loan portfolio balances, average balances or percentage exclude loans held for sale and PPP loans (1) CDL includes residential construc
Slide 21: Premium Core Deposit Franchise
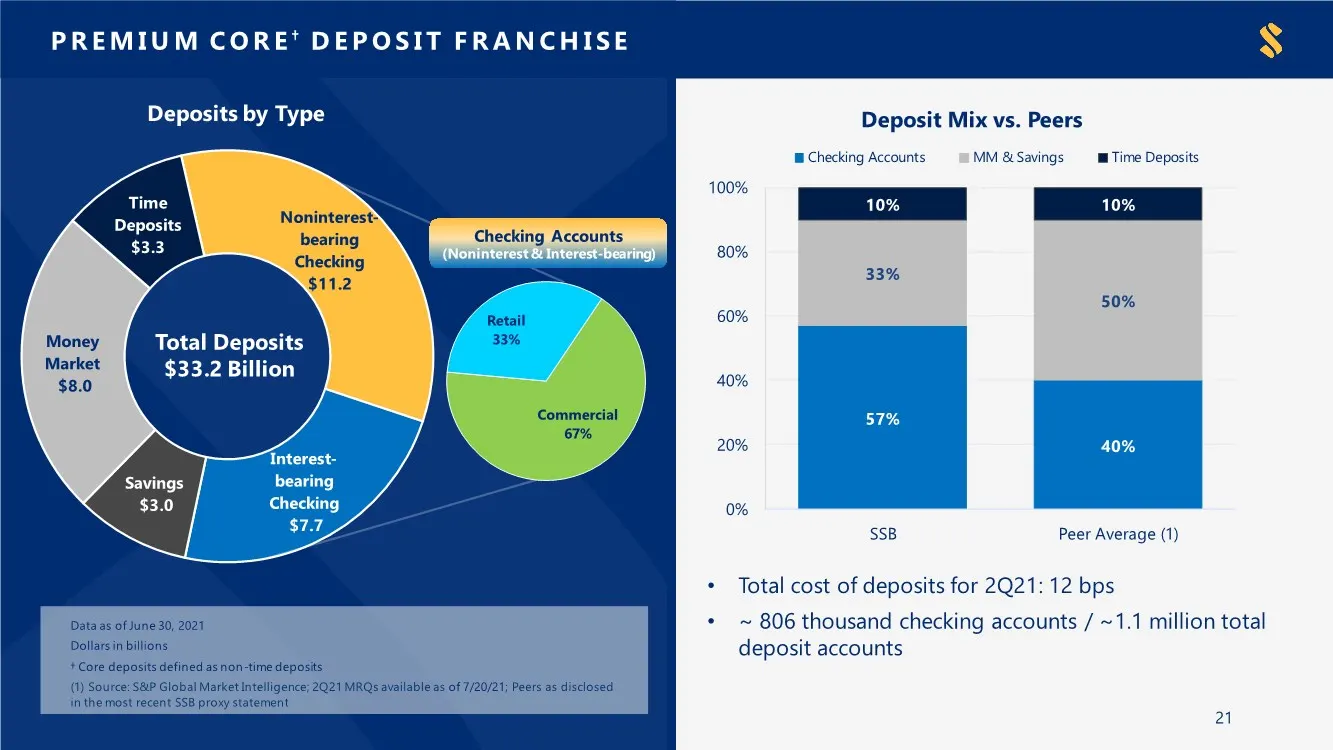
57% 40% 33% 50% 10% 10% 0% 20% 40% 60% 80% 100% SSB Peer Average (1) Deposit Mix vs. Peers Checking Accounts MM & Savings Time Deposits PREMIUM CORE † DEPOSIT FRANCHISE Noninterest- bearing Checking $11.2 Interest- bearing Checking $7.7 Savings $3.0 Money Market $8.0 Time Deposits $3.3 21 Data as of
Slide 22: Loan Production vs Loan Growth
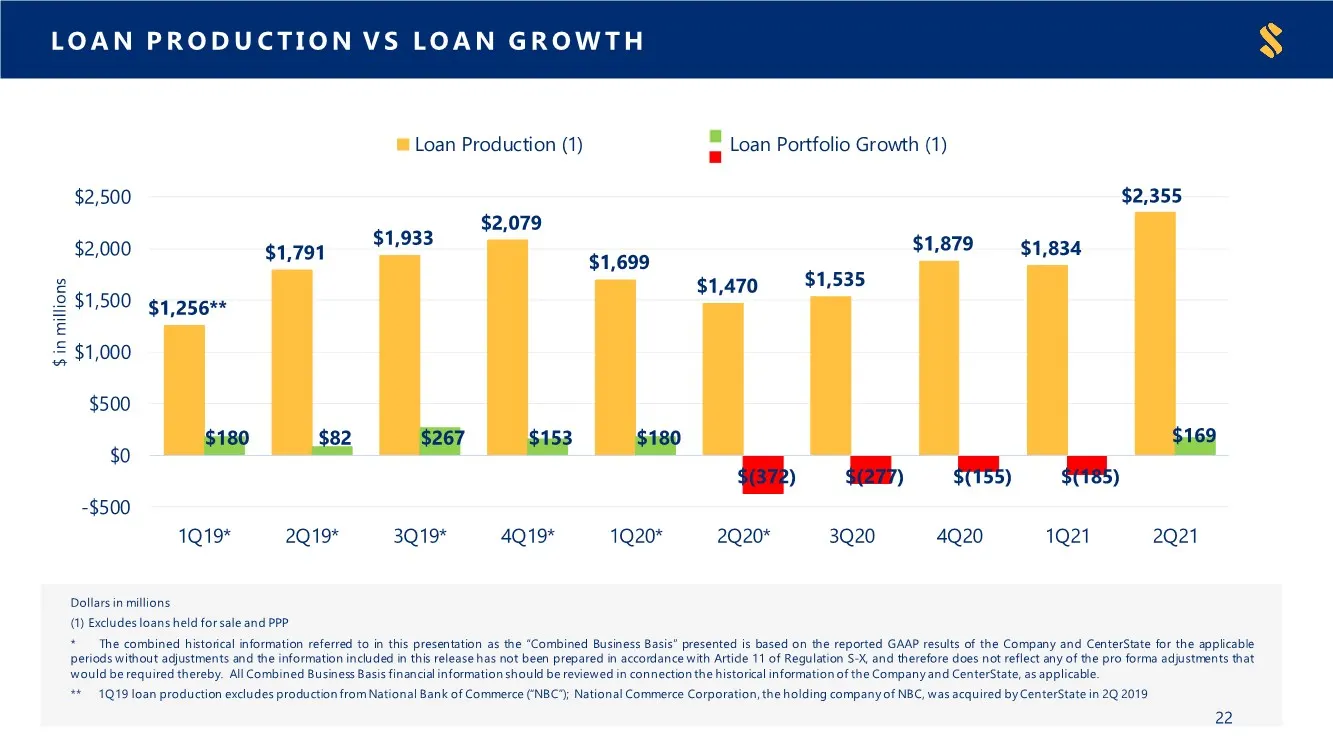
LOAN PRODUCTION VS LOAN GROWTH Dollars in millions (1) Excludes loans held forsale and PPP * The combined historical information referred to in this presentation as the “Combined Business Basis” presented is based on the reported GAAP results of the Company and CenterState for the applicable periods
Slide 23: Asset Quality
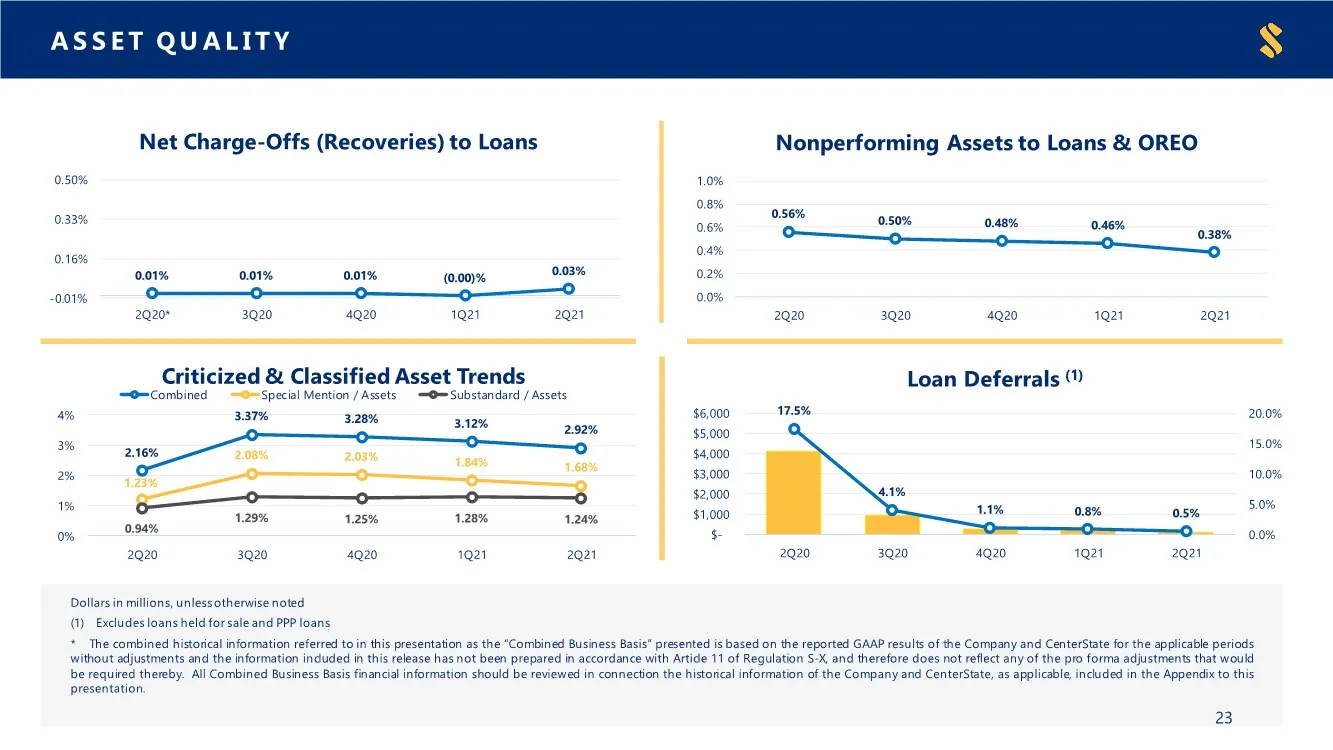
ASSET QUALITY Dollars in millions, unlessotherwise noted (1) Excludes loans held forsale and PPP loans * The combined historical information referred to in this presentation as the “Combined Business Basis” presented is based on the reported GAAP results of the Company and CenterState for the applic
Slide 24: Capital Ratios
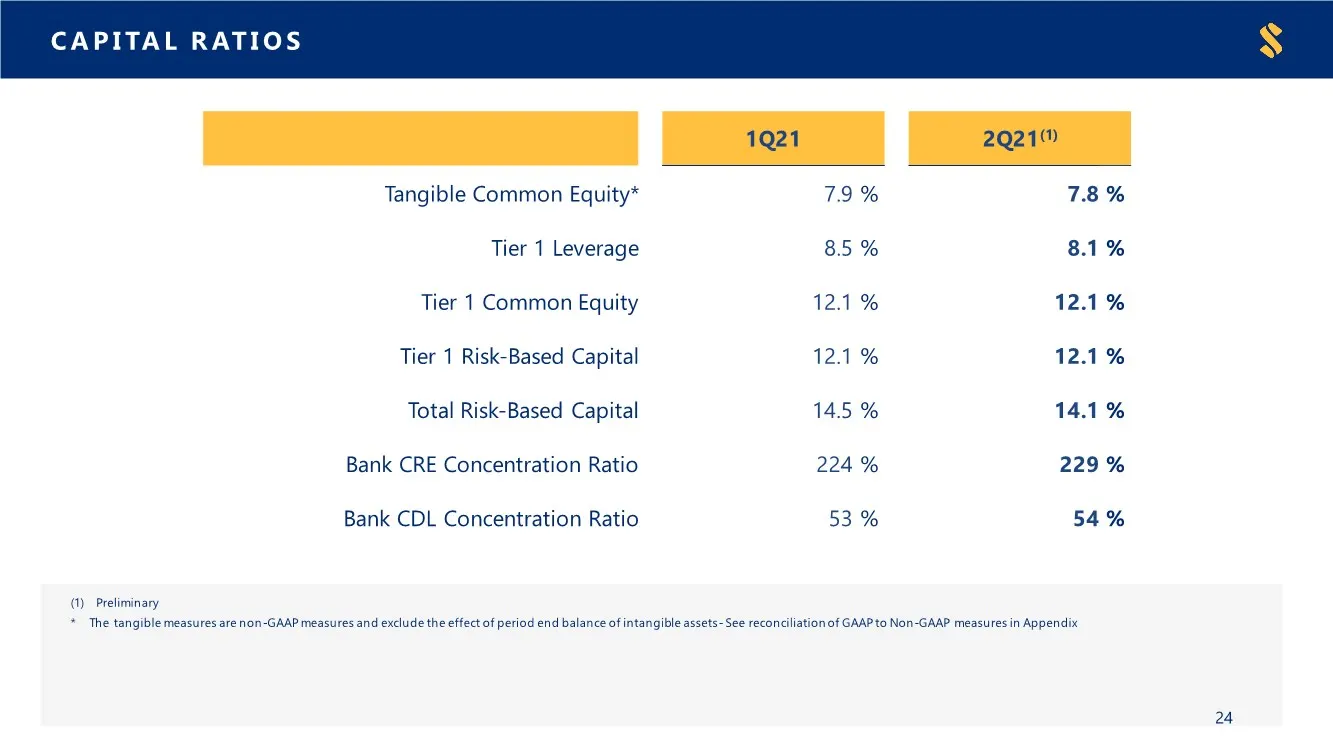
CAPITAL RATIOS (1) Preliminary * The tangible measures are non-GAAP measures and exclude the effect of period end balance of intangible assets -See reconciliation of GAAP to Non-GAAP measures in Appendix 24 1Q21 2Q21(1) Tangible Common Equity* 7.9 % 7.8 % Tier 1 Leverage 8.5 % 8.1 % Tier 1 Common Eq
Slide 25: Branch Optimization
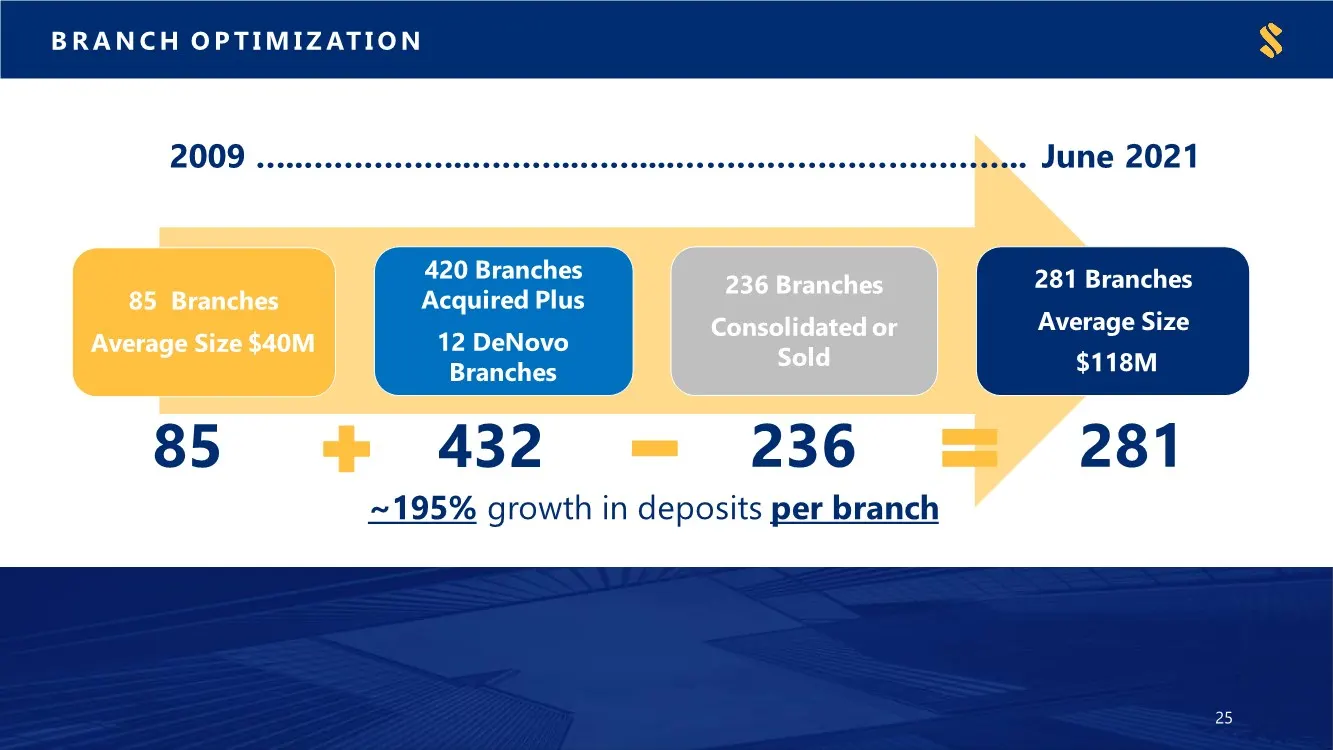
BRANCH OPTIMIZATION 85 Branches Average Size $40M 420 Branches Acquired Plus 12 DeNovo Branches 236 Branches Consolidated or Sold 281 Branches Average Size $118M ~195% growth in deposits per branch 85 432 236 281 2009 …..……………..………..……....…………………………….. June 2021 25

Slide 26: Appendix
Appendix Ga
Slide 27: Current & Historical - Qtr Performance
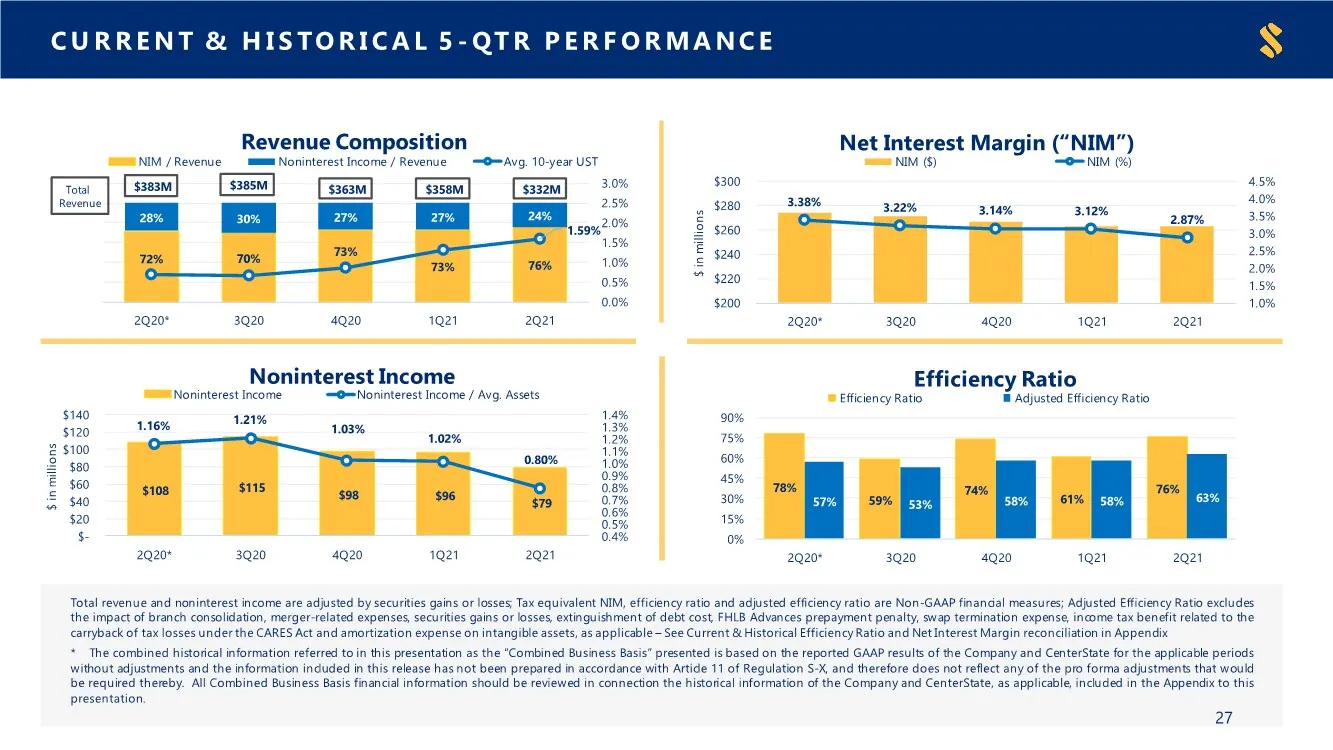
CURRENT & HISTORICAL 5 - QTR PERFORMANCE Total revenue and noninterest income are adjusted by securities gains or losses; Tax equivalent NIM, efficiency ratio and adjusted efficiency ratio are Non-GAAP financial measures; Adjusted Efficiency Ratio excludes the impact of branch consolidation, merger-
Slide 28: Loss Absorption Capacity | 2Q 2021
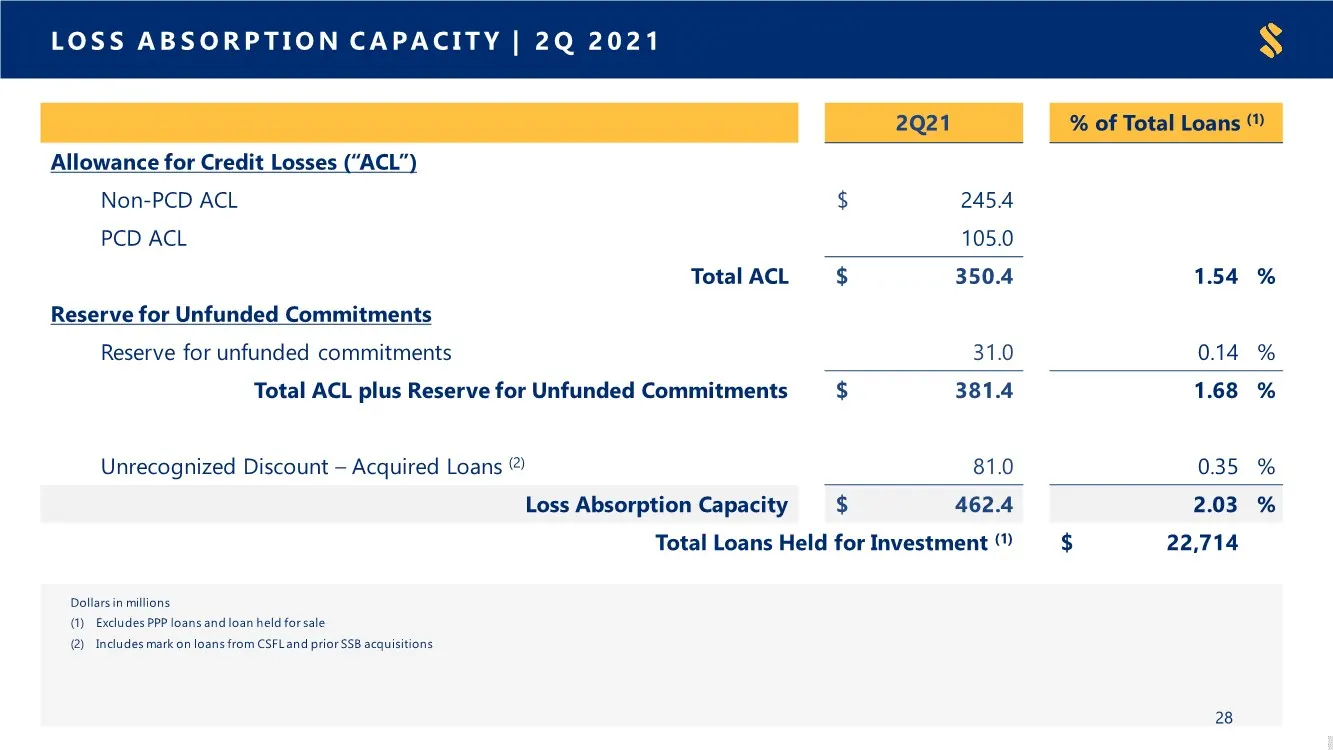
LOSS ABSORPTION CAPACITY | 2Q 2021 Dollars in millions (1) Excludes PPP loans and loan held for sale (2) Includes mark on loans from CSFL and prior SSB acquisitions 28 2Q21 % of Total Loans (1) Allowance for Credit Losses (“ACL”) Non-PCD ACL $ 245.4 PCD ACL 105.0 Total ACL $ 350.4 1.54 % Reserve for
Slide 29: Merger-Related Expenses/Deal Costs
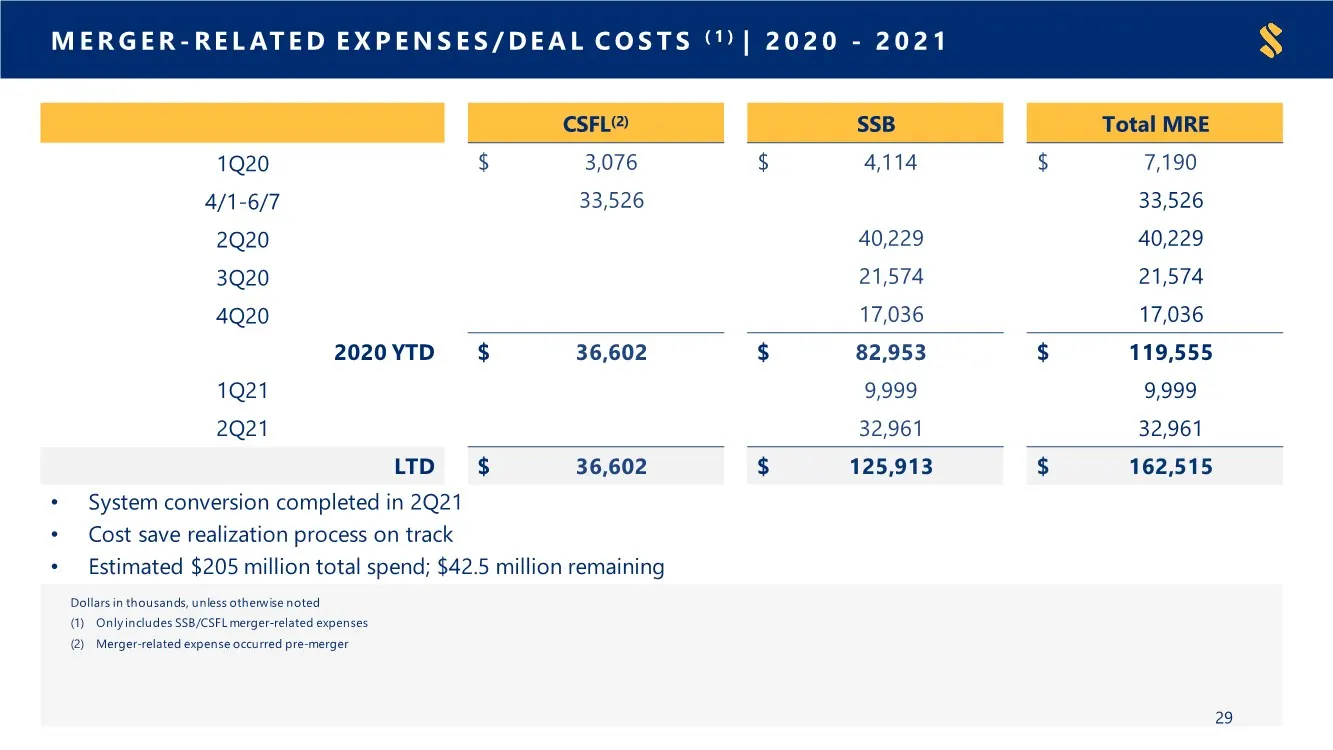
MERGER- RELATED EXPENSES/DEAL COSTS ( 1 ) | 2 0 2 0 - 2021 Dollars in thousands, unless otherwise noted (1) Only includes SSB/CSFL merger-related expenses (2) Merger-related expense occurred pre-merger • System conversion completed in 2Q21 • Cost save realization process on track • Estimated $205 mi
Slide 30: PPP Update
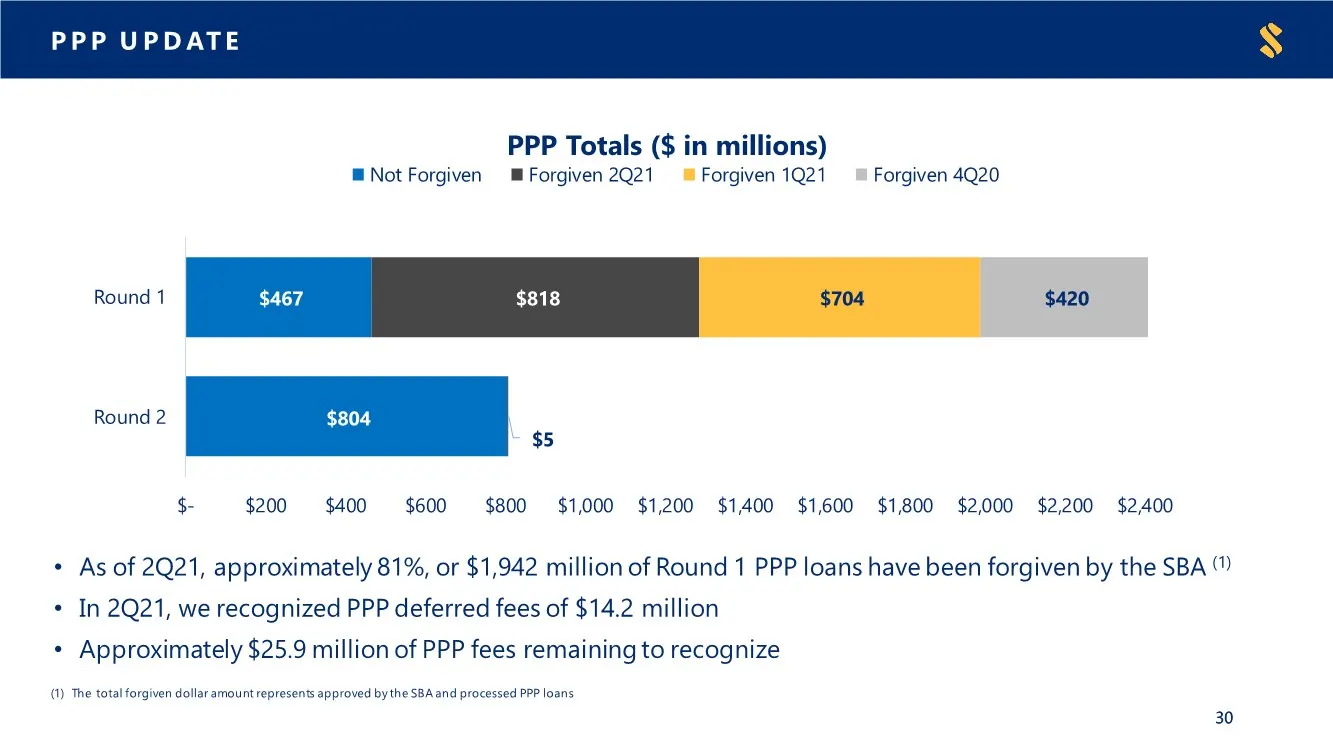
P P P U P D AT E 30 30 $804 $467 $5 $818 $704 $420 $- $200 $400 $600 $800 $1,000 $1,200 $1,400 $1,600 $1,800 $2,000 $2,200 $2,400 Round 2 Round 1 PPP Totals ($ in millions) Not Forgiven Forgiven 2Q21 Forgiven 1Q21 Forgiven 4Q20 • As of 2Q21, approximately 81%, or $1,942 million of Round 1 PPP loans
Slide 31: Non-GAAP Reconciliations: Efficiency Ratios & Net Interest Margin
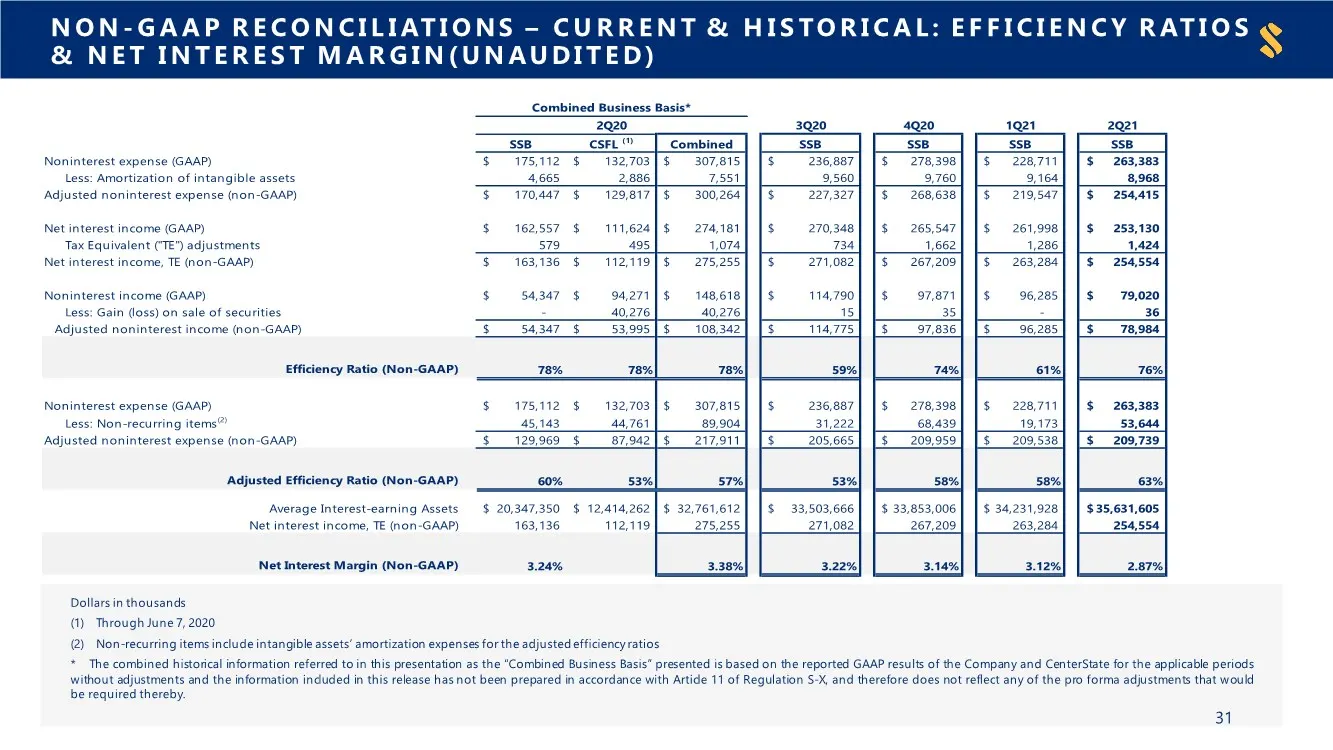
NON- GAAP RECONCILIATIONS – CURRENT & HISTORICAL: EFFICIENCY RATIOS & NET INTEREST MARGIN(UNAUDITED) Dollars in thousands (1) Through June 7, 2020 (2) Non-recurring items include intangible assets’ amortization expenses forthe adjustedefficiency ratios * The combined historical information referred
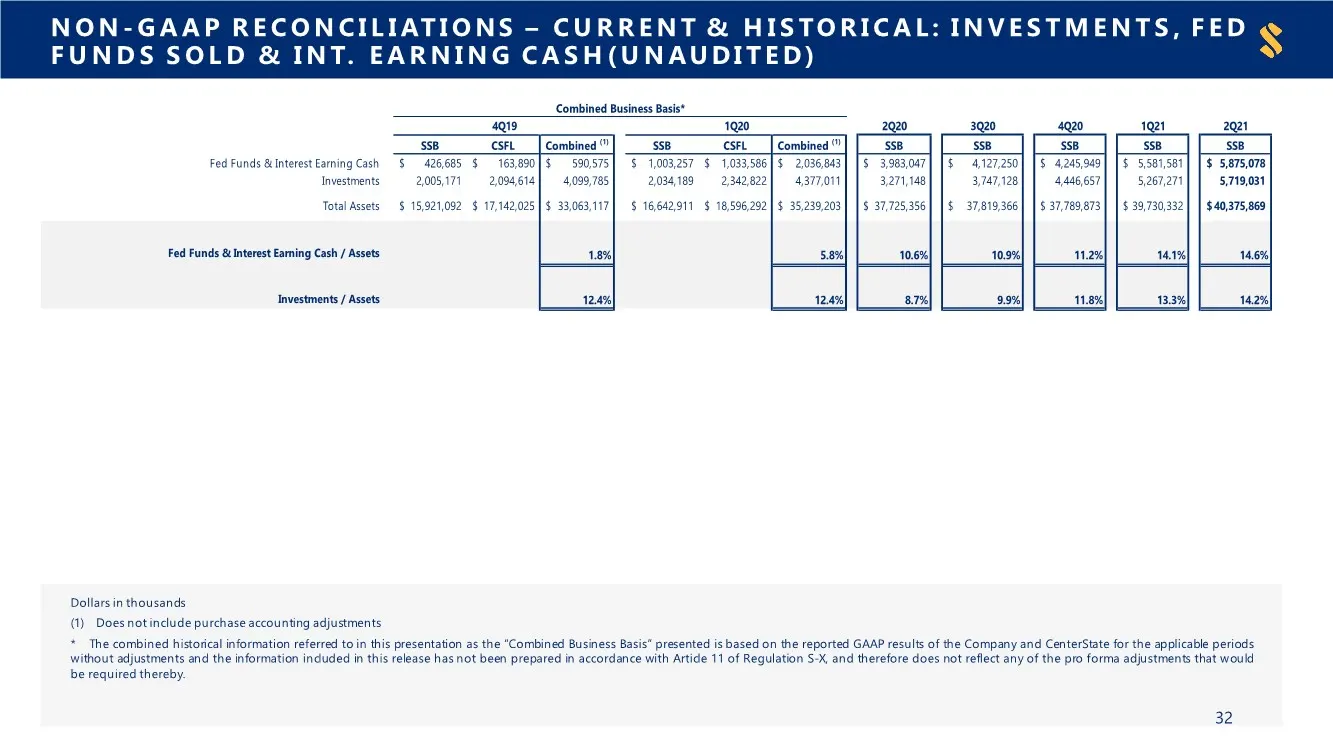
Slide 32: Non-GAAP Reconciliations: Investments, Fed Funds Sold & Cash
NON- GAAP RECONCILIATIONS – CURRENT & HISTORICAL: INVESTMENTS, FED FUNDS SOLD & INT. EARNING CASH(UNAUDITED) Dollars in thousands (1) Does not include purchase accounting adjustments * The combined historical information referred to in this presentation as the “Combined Business Basis” presented is
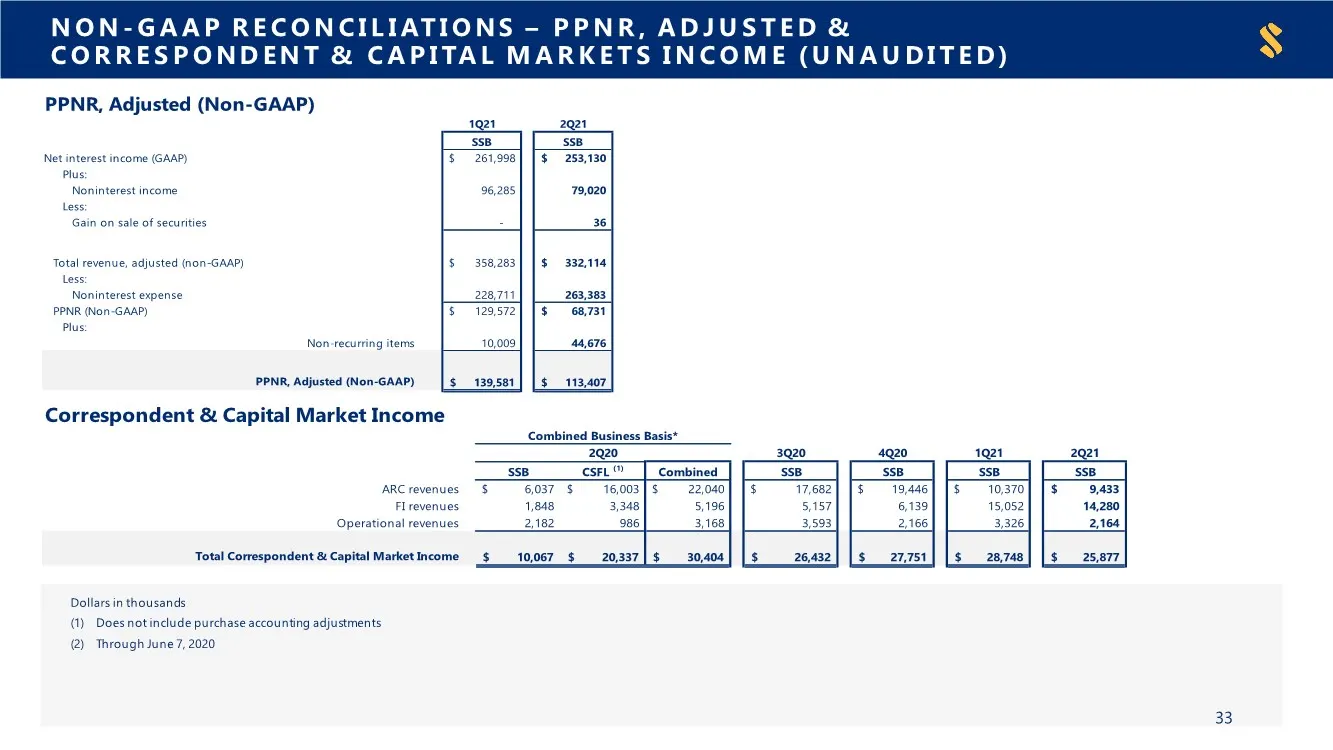
Slide 33: Non-GAAP Reconciliations: PPNR & Correspondent Income
NON- GAAP RECONCILIATIONS – PPNR, ADJUSTED & CORRESPONDENT & CAPITAL MARKETS INCOME (UNAUDITED) Dollars in thousands (1) Does not include purchase accounting adjustments (2) Through June 7, 2020 33 PPNR, Adjusted (Non-GAAP) 1Q21 2Q21 SSB SSB Net interest income (GAAP) 261,998 $ 253,130 $ Plus: Nonin
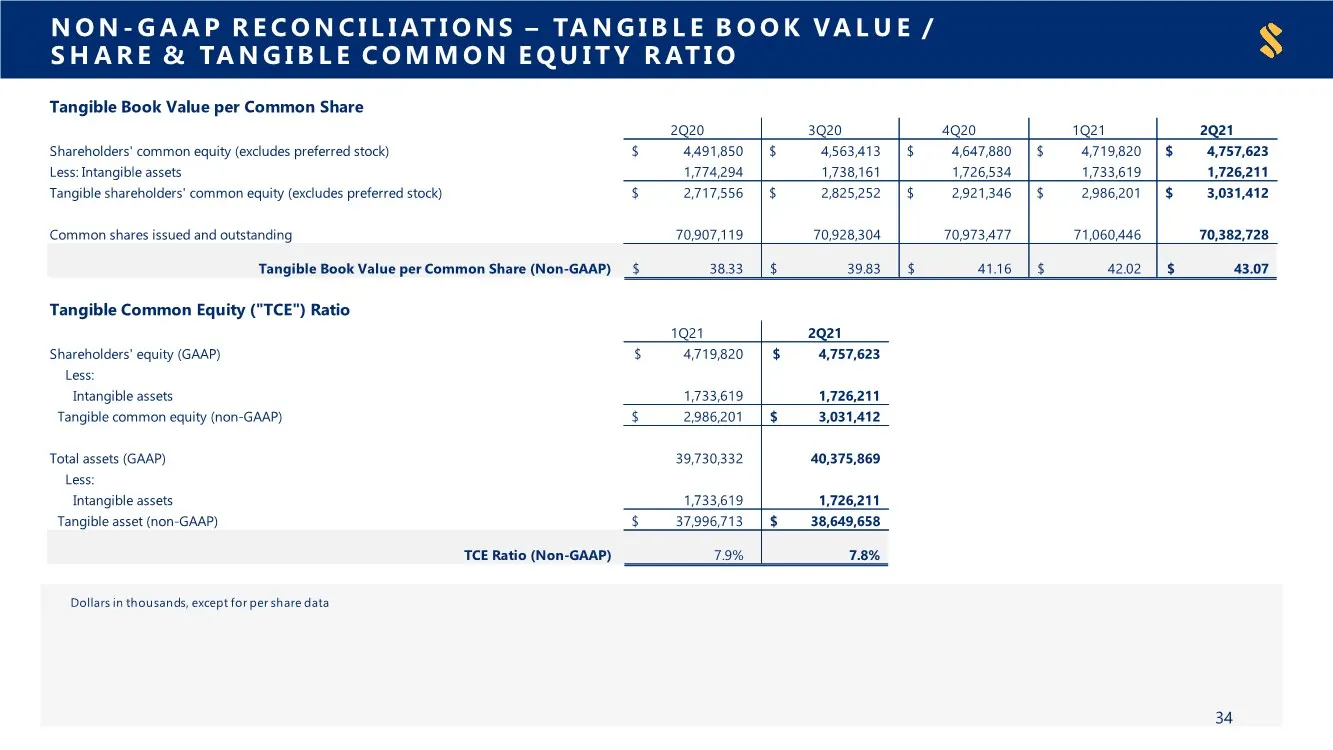
Slide 34: Non-GAAP Reconciliations: Tangible Book Value & TCE Ratio
NON- GAAP RECONCILIATIONS – TANGIBLE BOOK VALUE / SHARE & TANGIBLE COMMON EQUITY RATIO Dollars in thousands, except forper share data 34 Tangible Book Value per Common Share 2Q20 3Q20 4Q20 1Q21 2Q21 Shareholders' common equity (excludes preferred stock) 4,491,850 $ 4,563,413 $ 4,647,880 $ 4,719,820
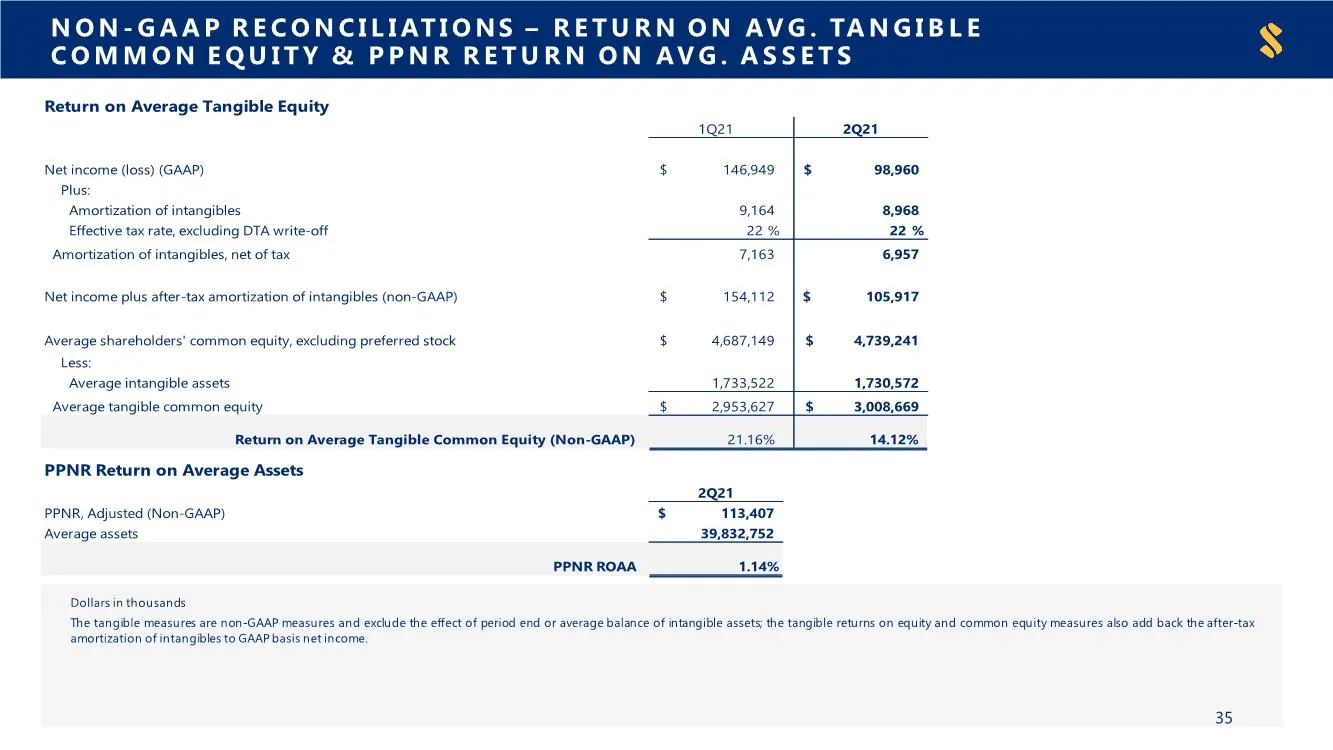
Slide 35: Non-GAAP Reconciliations: Return on Tangible Common Equity & PPNR ROAA
Dollars in thousands The tangible measures are non-GAAP measures and exclude the effect of period end or average balance of intangible assets; the tangible returns on equity and common equity measures also add back the after-tax amortization of intangibles to GAAP basis net income. 35 NON- GAAP RECO
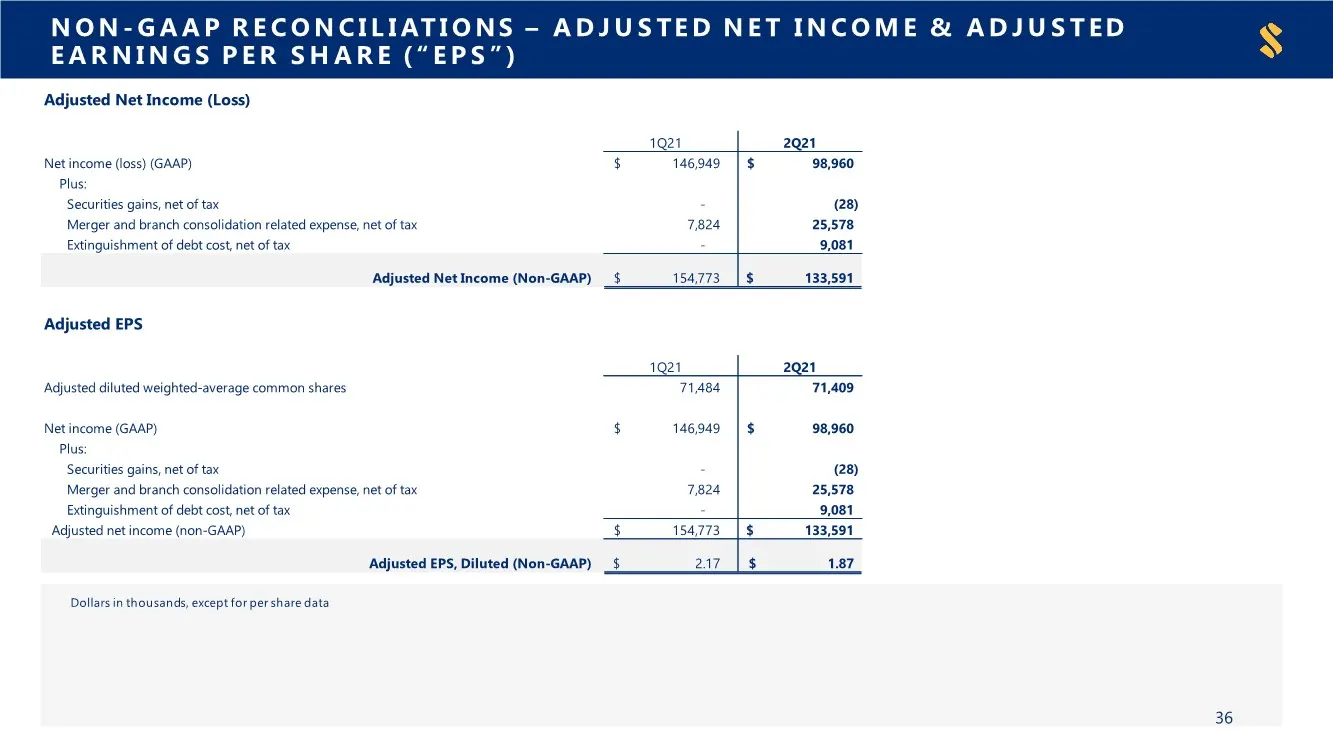
Slide 36: Non-GAAP Reconciliations: Adjusted Net Income & EPS
NON- GAAP RECONCILIATIONS – ADJUSTED NET INCOME & ADJUSTED EARNINGS PER SHARE (“EPS”) Dollars in thousands, except forper share data 36 Adjusted Net Income (Loss) 1Q21 2Q21 Net income (loss) (GAAP) 146,949 $ 98,960 $ Plus: Securities gains, net of tax - (28) Merger and branch consolidation related e
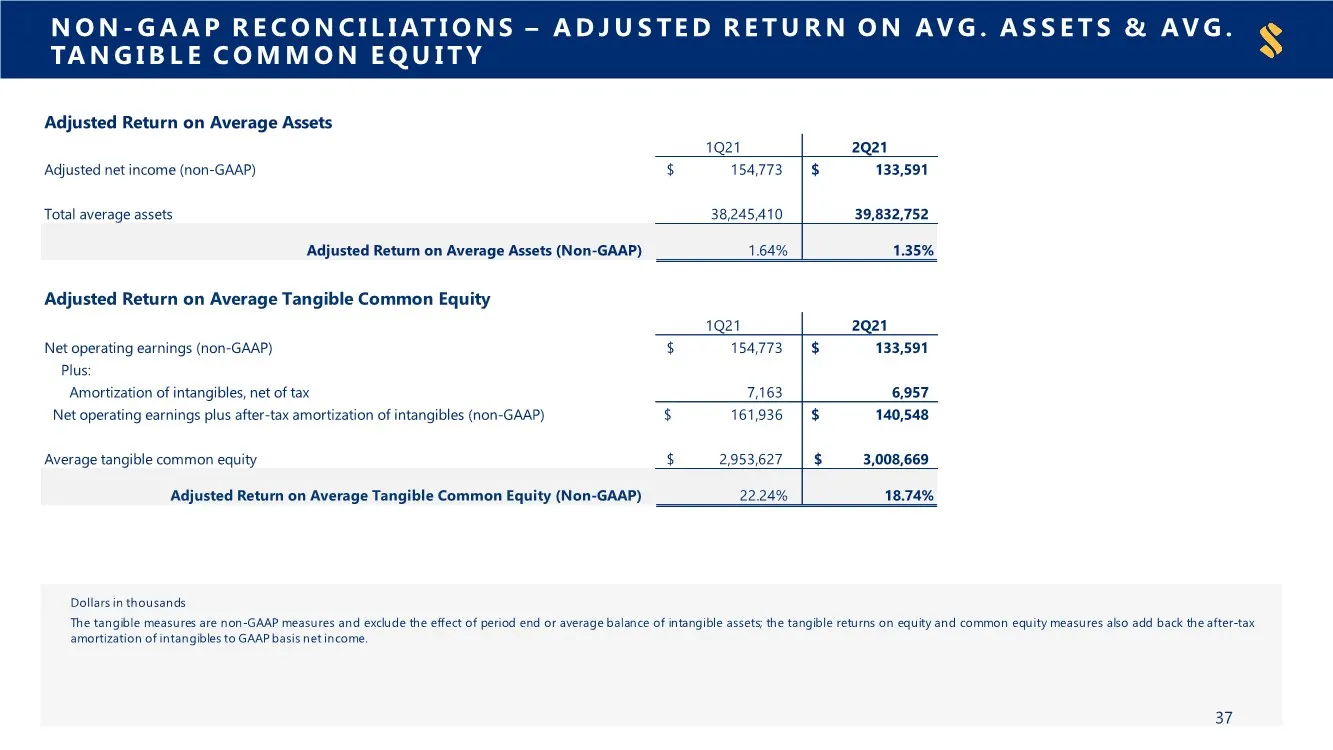
Slide 37: Non-GAAP Reconciliations: Adjusted ROAA & ROTCE
NON- GAAP RECONCILIATIONS – ADJUSTED RETURN ON AVG. ASSETS & AVG. TANGIBLE COMMON EQUITY Dollars in thousands The tangible measures are non-GAAP measures and exclude the effect of period end or average balance of intangible assets; the tangible returns on equity and common equity measures also add b
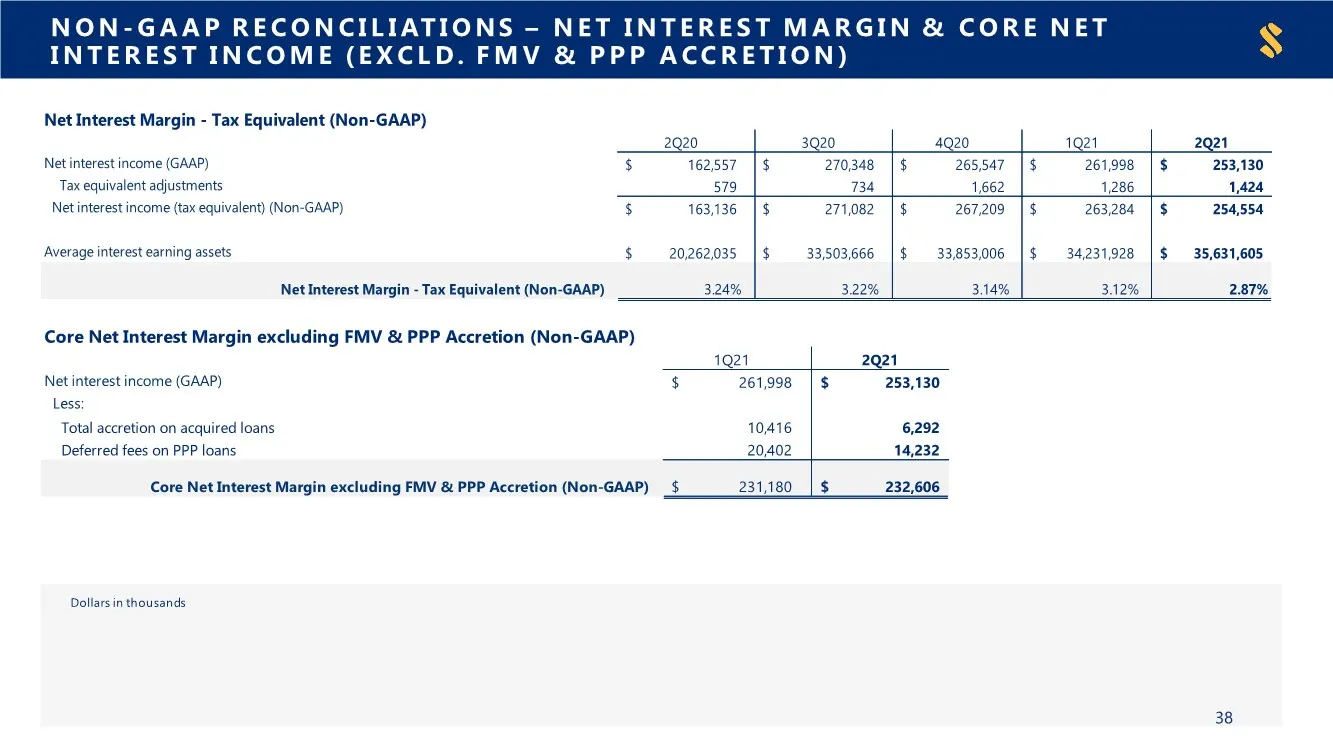
Slide 38: Non-GAAP Reconciliations: Net Interest Margin & Core NII
NON- GAAP RECONCILIATIONS – NET INTEREST MARGIN & CORE NET INTEREST INCOME (EXCLD. FMV & PPP ACCRETION) Dollars in thousands Dollars in thousands, except for per share data 38 Net Interest Margin - Tax Equivalent (Non-GAAP) 2Q20 3Q20 4Q20 1Q21 2Q21 Net interest income (GAAP) 162,557 $ 270,348 $ 265,

Slide 39: SouthState
S SouthState
Source: SEC EDGAR · 425 filed Jul 23, 2021
More decks from Atlantic Capital Bancshares Inc
 Q4 2021 Earnings Presentation27 slides · Jan 24, 2022
 Q3 2021 Earnings Presentation30 slides · Oct 27, 2021
 Q3 2021 Earnings Presentation40 slides · Oct 27, 2021
 Q2 2021 Earnings Presentation33 slides · Jul 23, 2021
 Merger or Acquisition (July 2021)16 slides · Jul 23, 2021
 Q1 2021 Earnings Presentation33 slides · Apr 22, 2021