TECSYS Inc. · TSX:TCS
TECSYS — Investor Presentation (December 2013)
22 slides from TECSYS's investor presentation, December 2013
Slide 1: Investing in TECSYS
Investing in TECSYS Peter Brereton President & CEO TECSYS Inc. December, 2013
Slide 2: Agenda and Safe Harbor
Agenda TECSYS today Performance Healthcare market Moving forward Safe Harbor The statements in this presentation relating to matters that are not historical fact are forward looking statements that are based on management's beliefs and assumptions. Such statements are not guarantees of future perfor
Slide 3: TECSYS Today
TECSYS Today Market-leading provider of supply chain execution solutions Dominant provider to health systems Five of Gartner’s top healthcare supply chains 30%+ of revenue derived from healthcare “Visionary” in Gartner’s Magic Quadrant Report 29%+ market share – North America’s Caterpillar dealers T
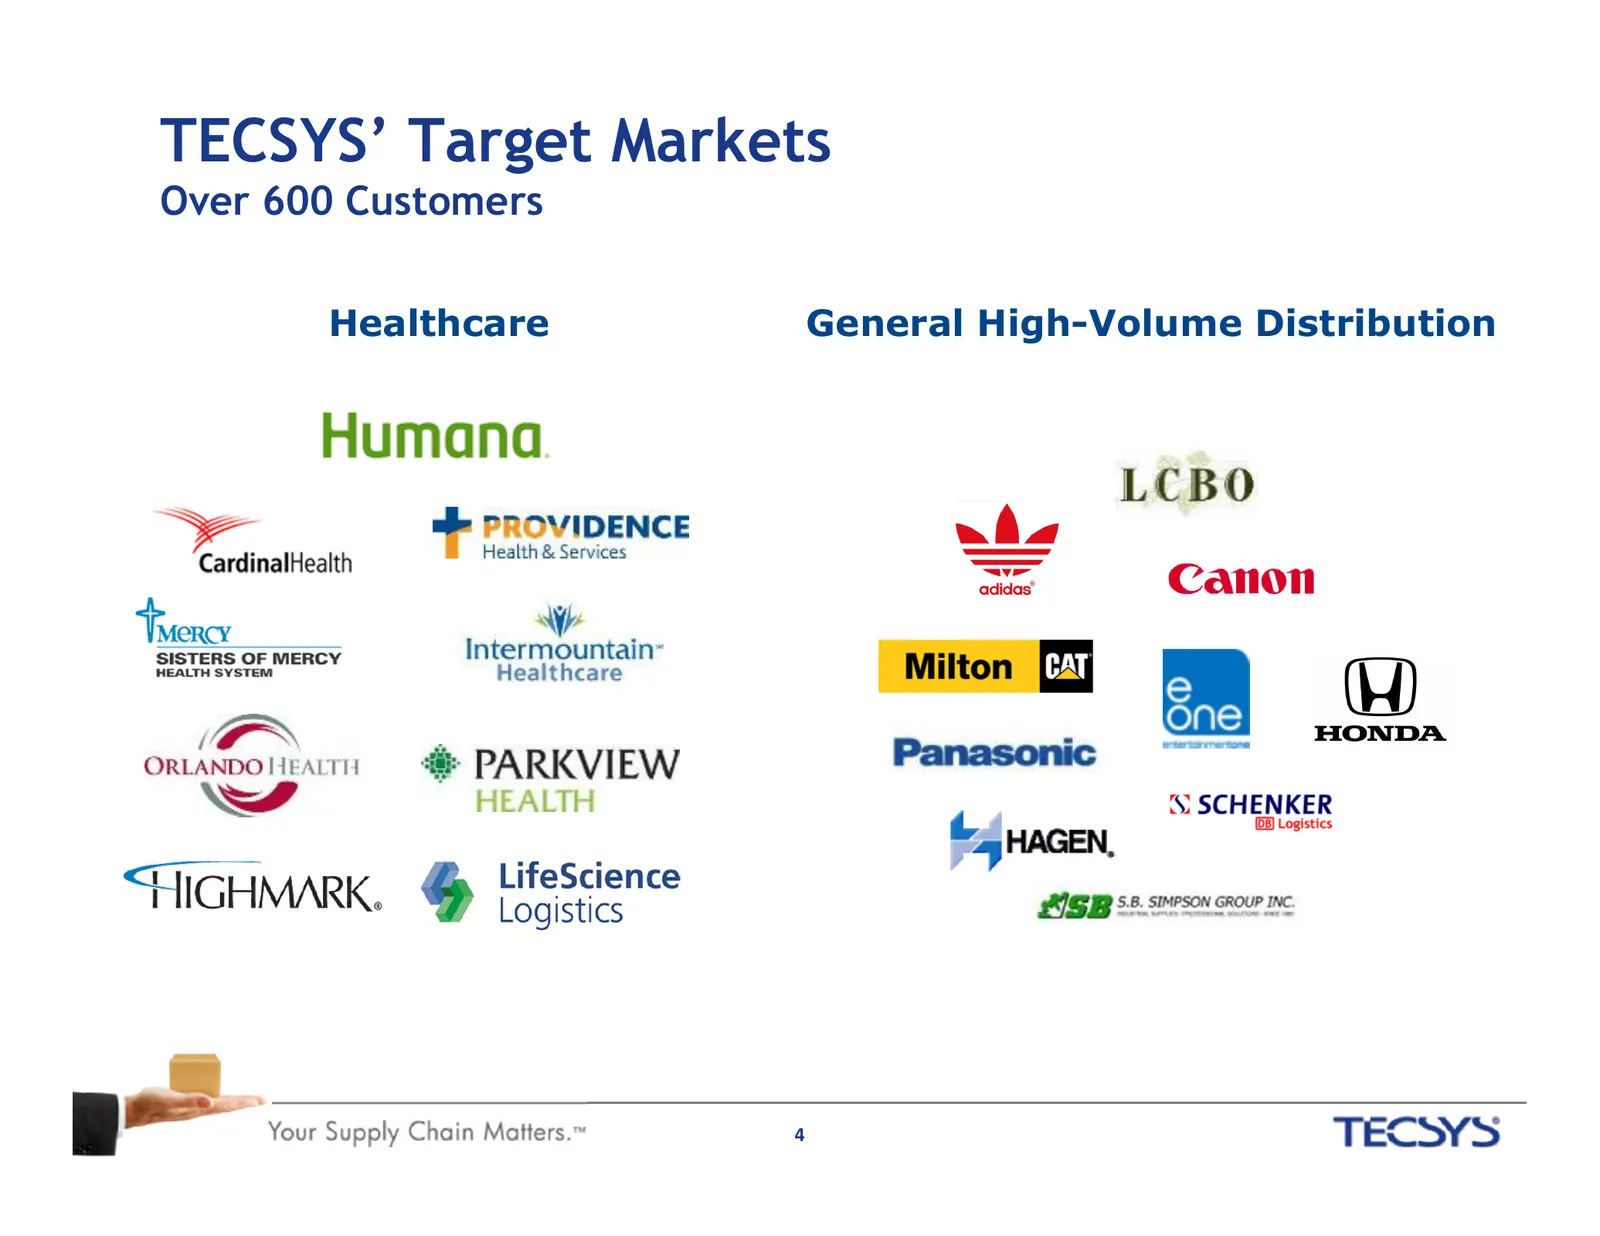
Slide 4: TECSYS' Target Markets
TECSYS’ Target Markets Over 600 Customers Healthcare General High-Volume Distribution 4
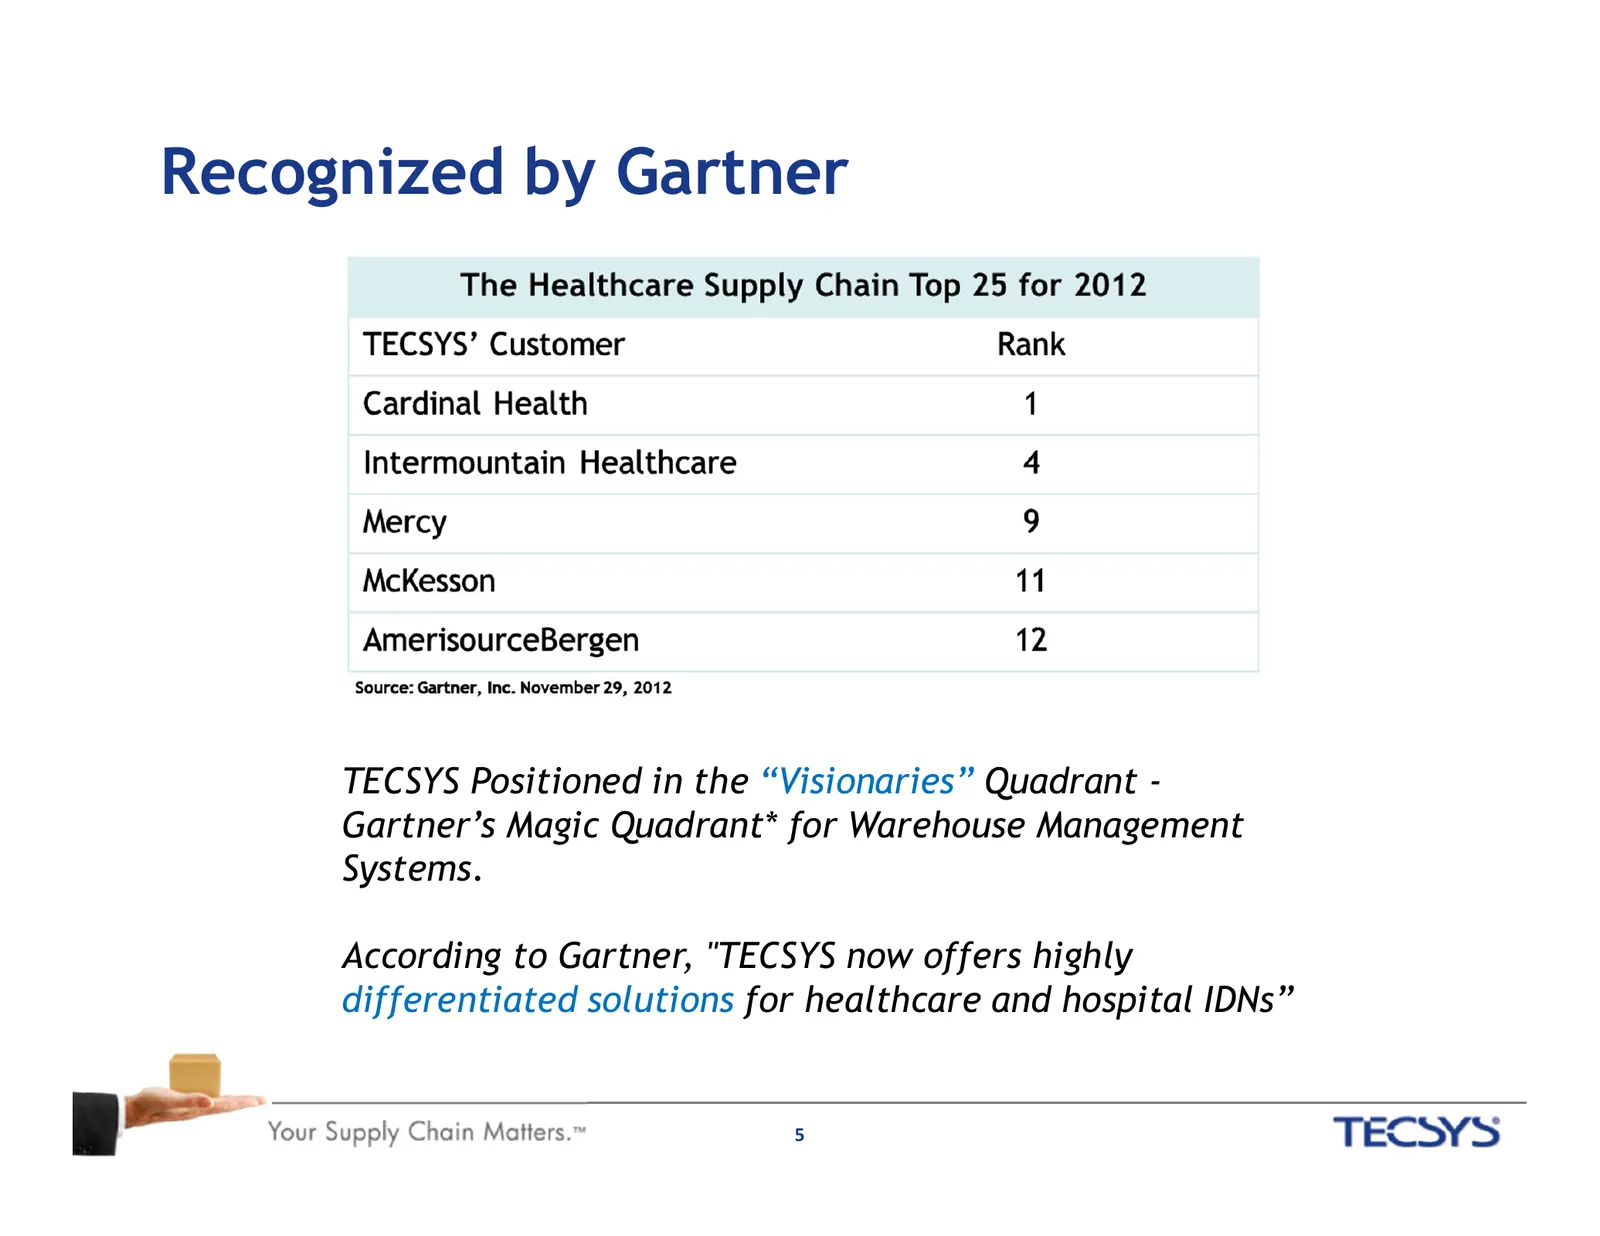
Slide 5: Recognized by Gartner
Recognized by Gartner TECSYS Positioned in the “Visionaries” Quadrant - Gartner’s Magic Quadrant* for Warehouse Management Systems. According to Gartner, "TECSYS now offers highly differentiated solutions for healthcare and hospital IDNs” 5
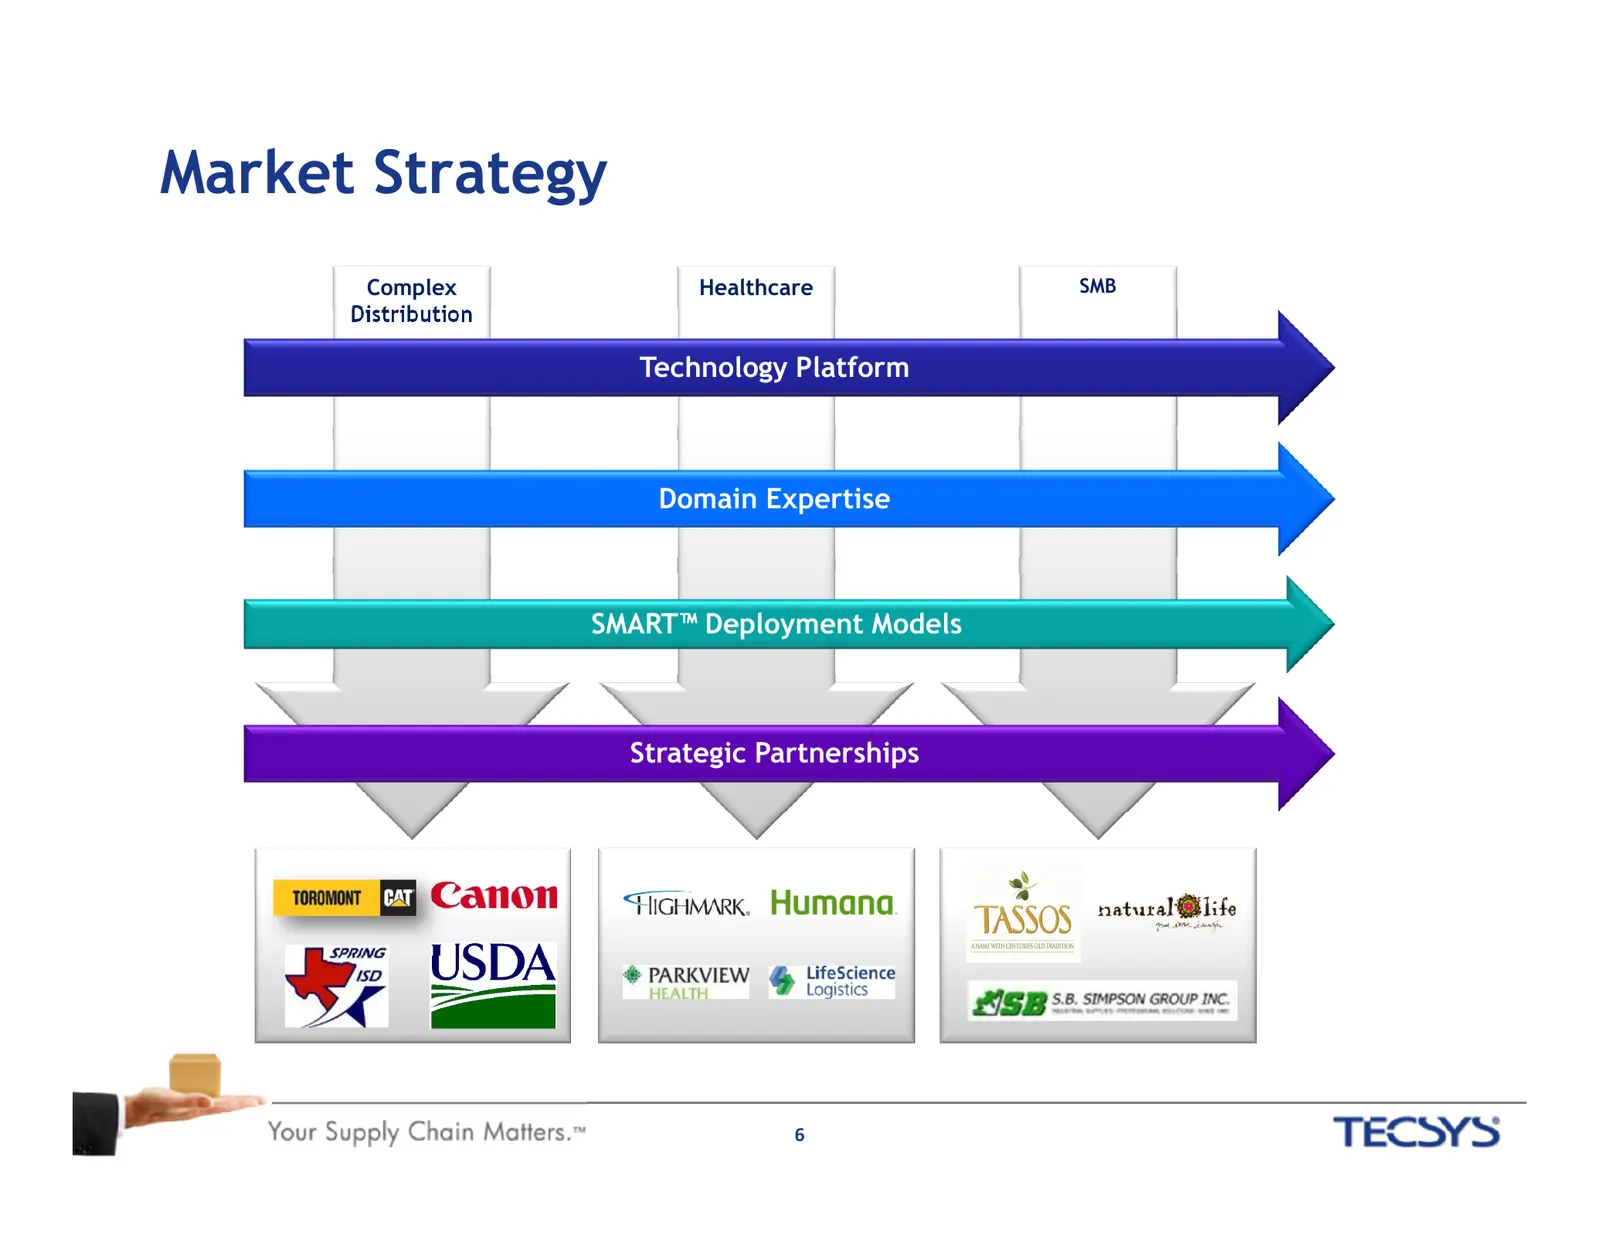
Slide 6: Market Strategy
Market Strategy Complex Healthcare SMB Distribution Technology Platform Domain Expertise SMART™ Deployment Models Strategic Partnerships 6
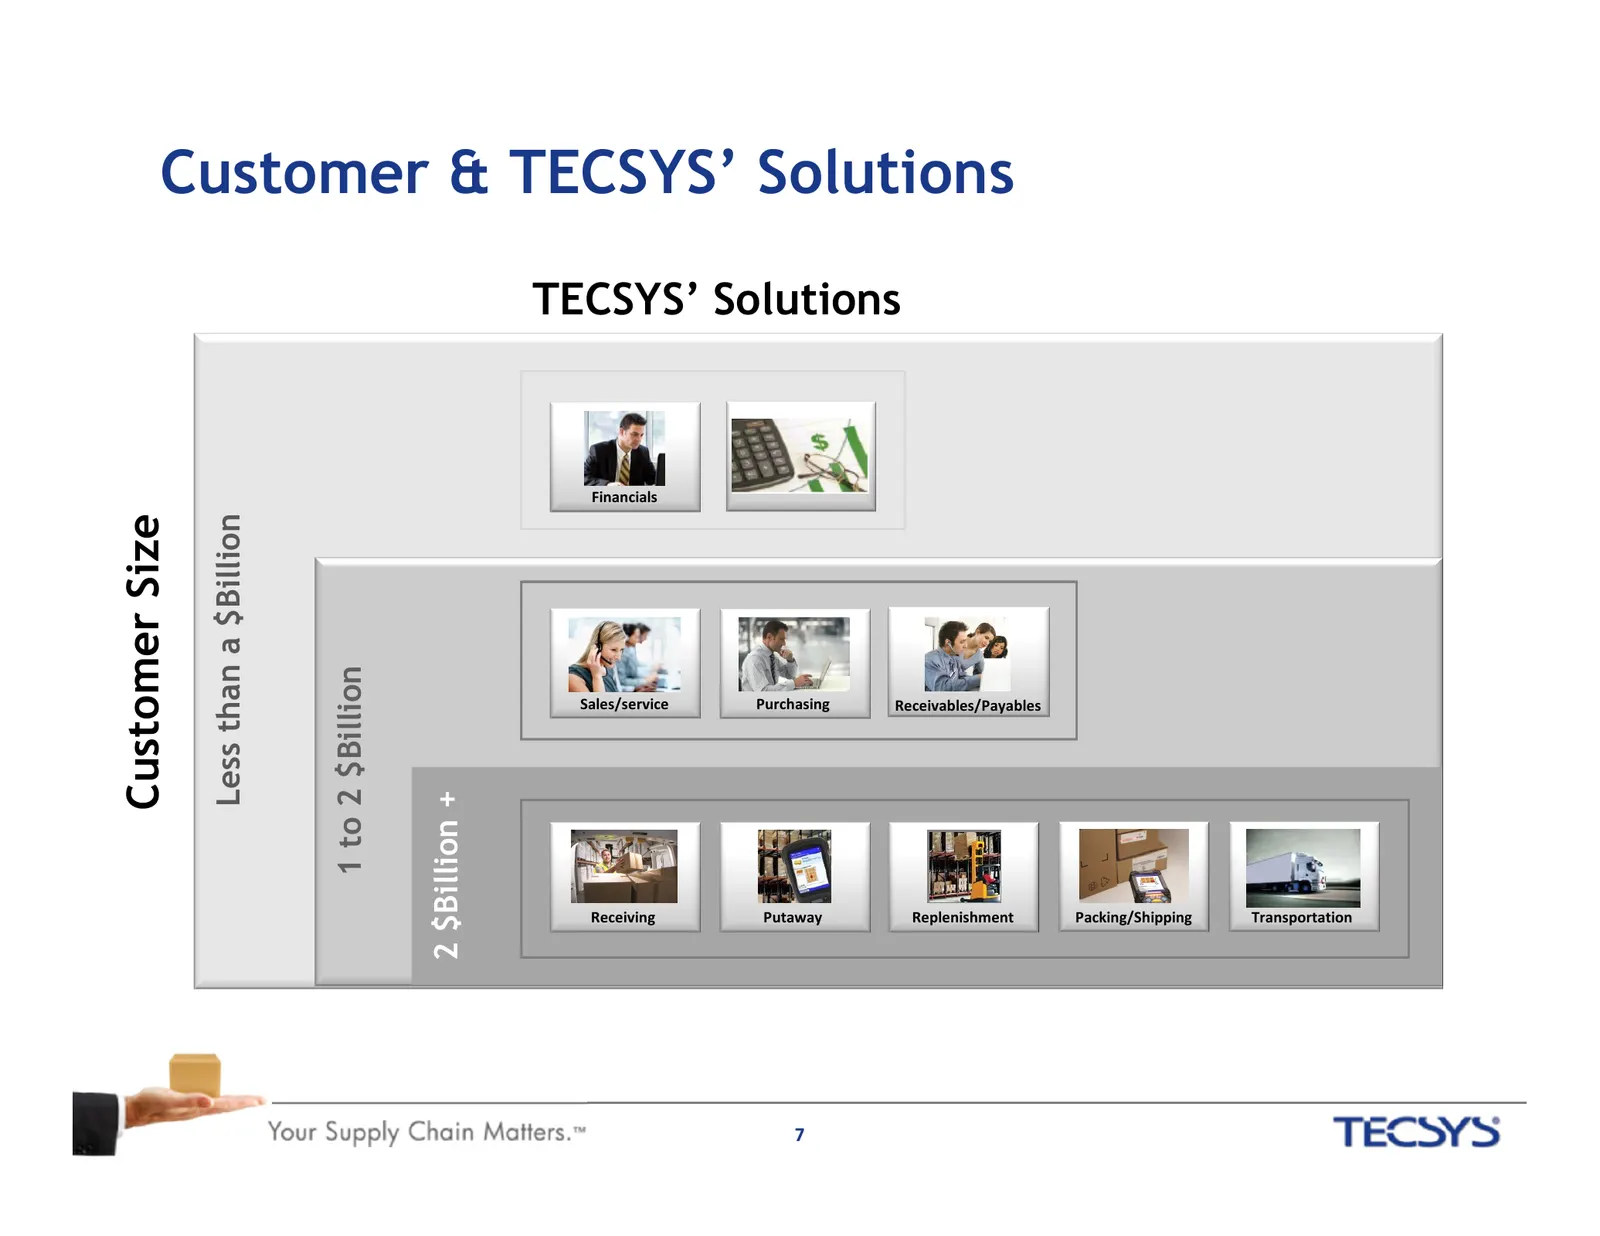
Slide 7: Customer & TECSYS' Solutions
Customer & TECSYS’ Solutions TECSYS’ Solutions Financials Customer Size Less than a $Billion 1 to 2 $Billion Sales/service Purchasing Receivables/Payables 2 $Billion + Receiving Putaway Replenishment Packing/Shipping Transportation 7
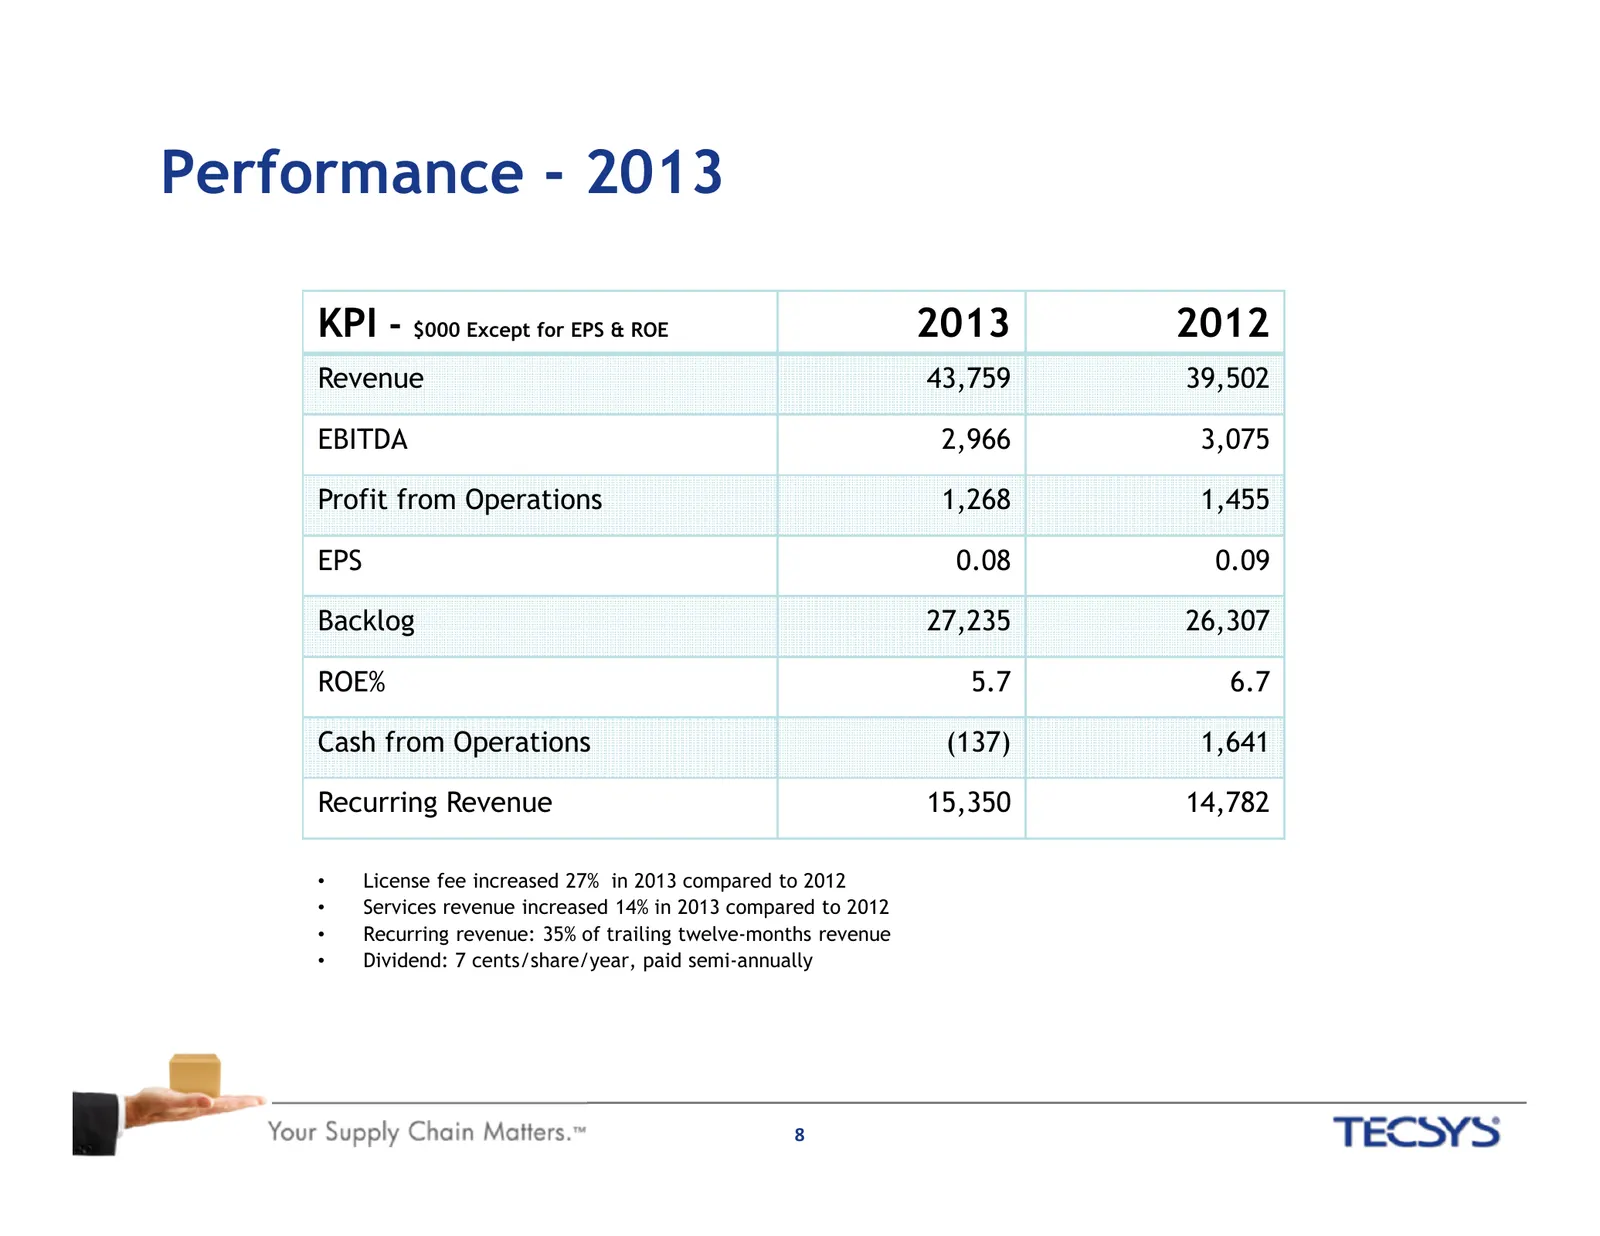
Slide 8: Performance - 2013
Performance - 2013 KPI - $000 Except for EPS & ROE 2013 2012 Revenue 43,759 39,502 EBITDA 2,966 3,075 Profit from Operations 1,268 1,455 EPS 0.08 0.09 Backlog 27,235 26,307 ROE% 5.7 6.7 Cash from Operations (137) 1,641 Recurring Revenue 15,350 14,782 • License fee increased 27% in 2013 compared to 2
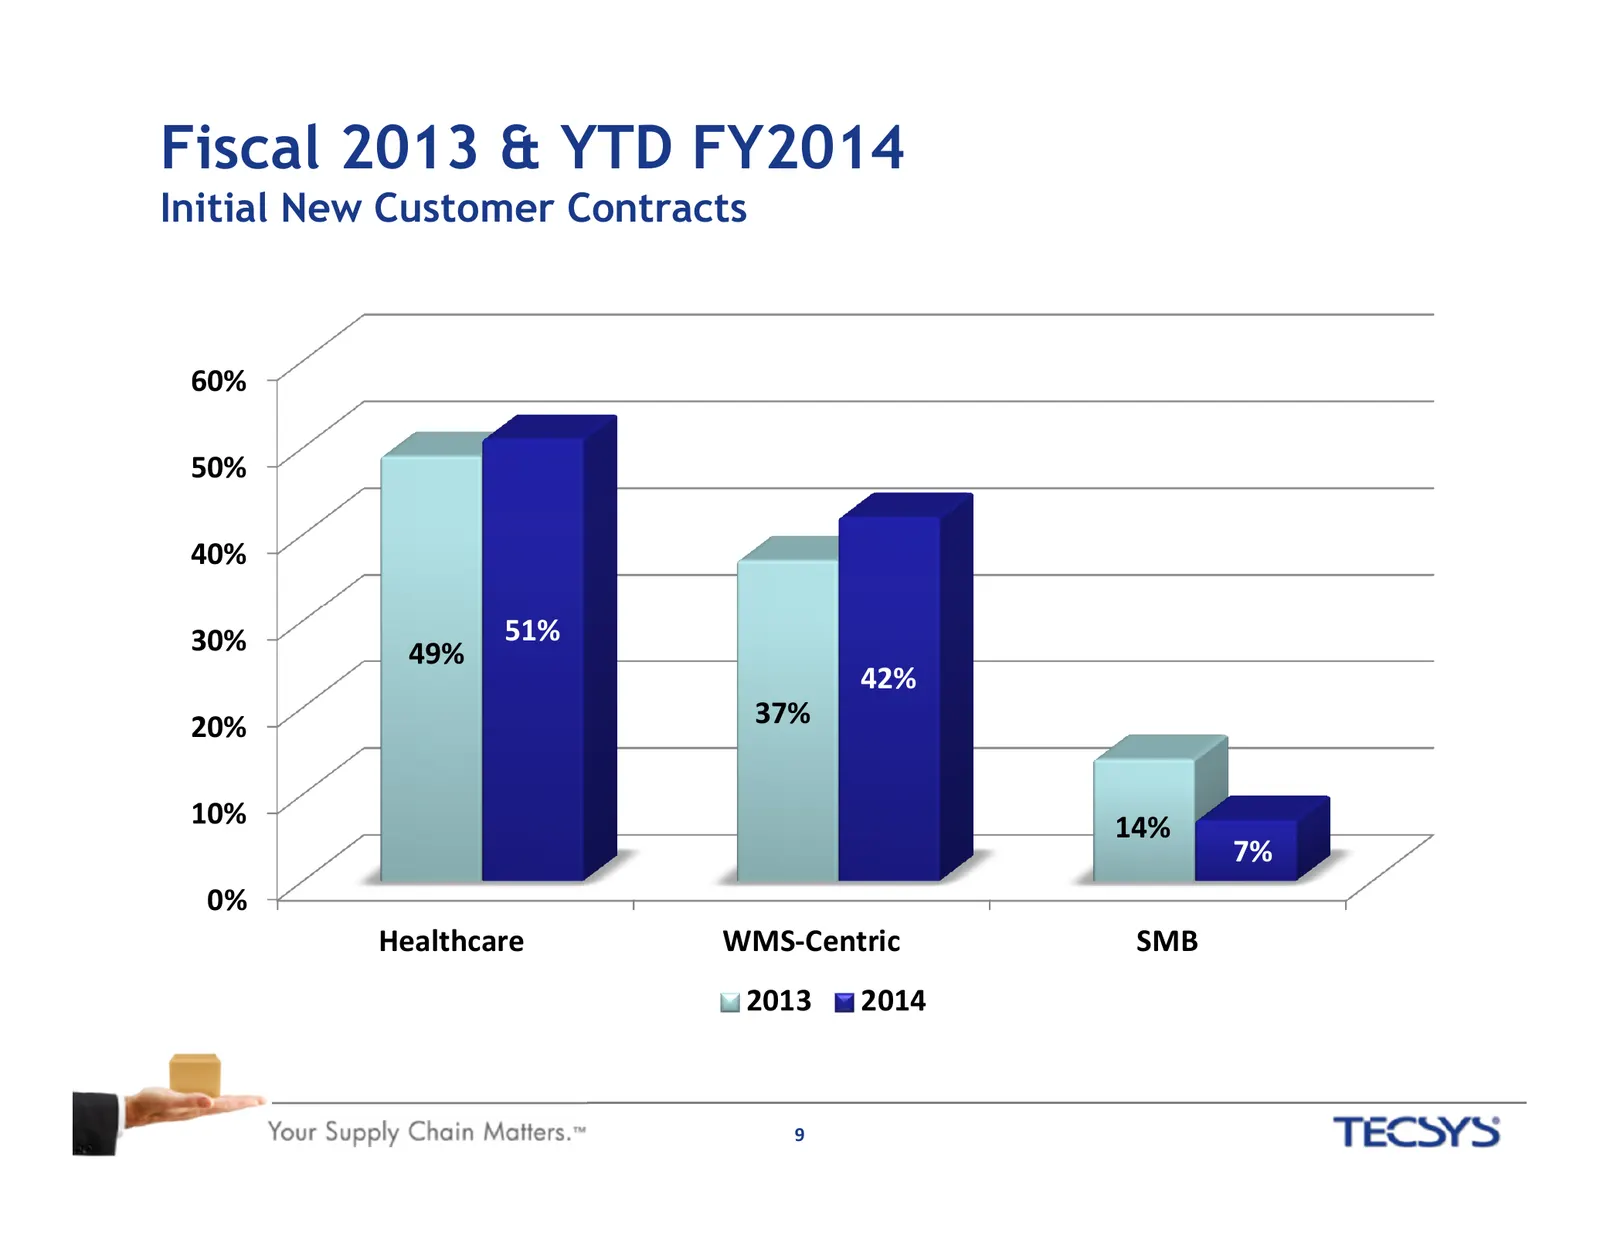
Slide 9: Fiscal 2013 & YTD FY2014
Fiscal 2013 & YTD FY2014 Initial New Customer Contracts 60% 50% 40% 30% 51% 49% 42% 20% 37% 10% 14% 7% 0% Healthcare WMS-Centric SMB 2013 2014 9
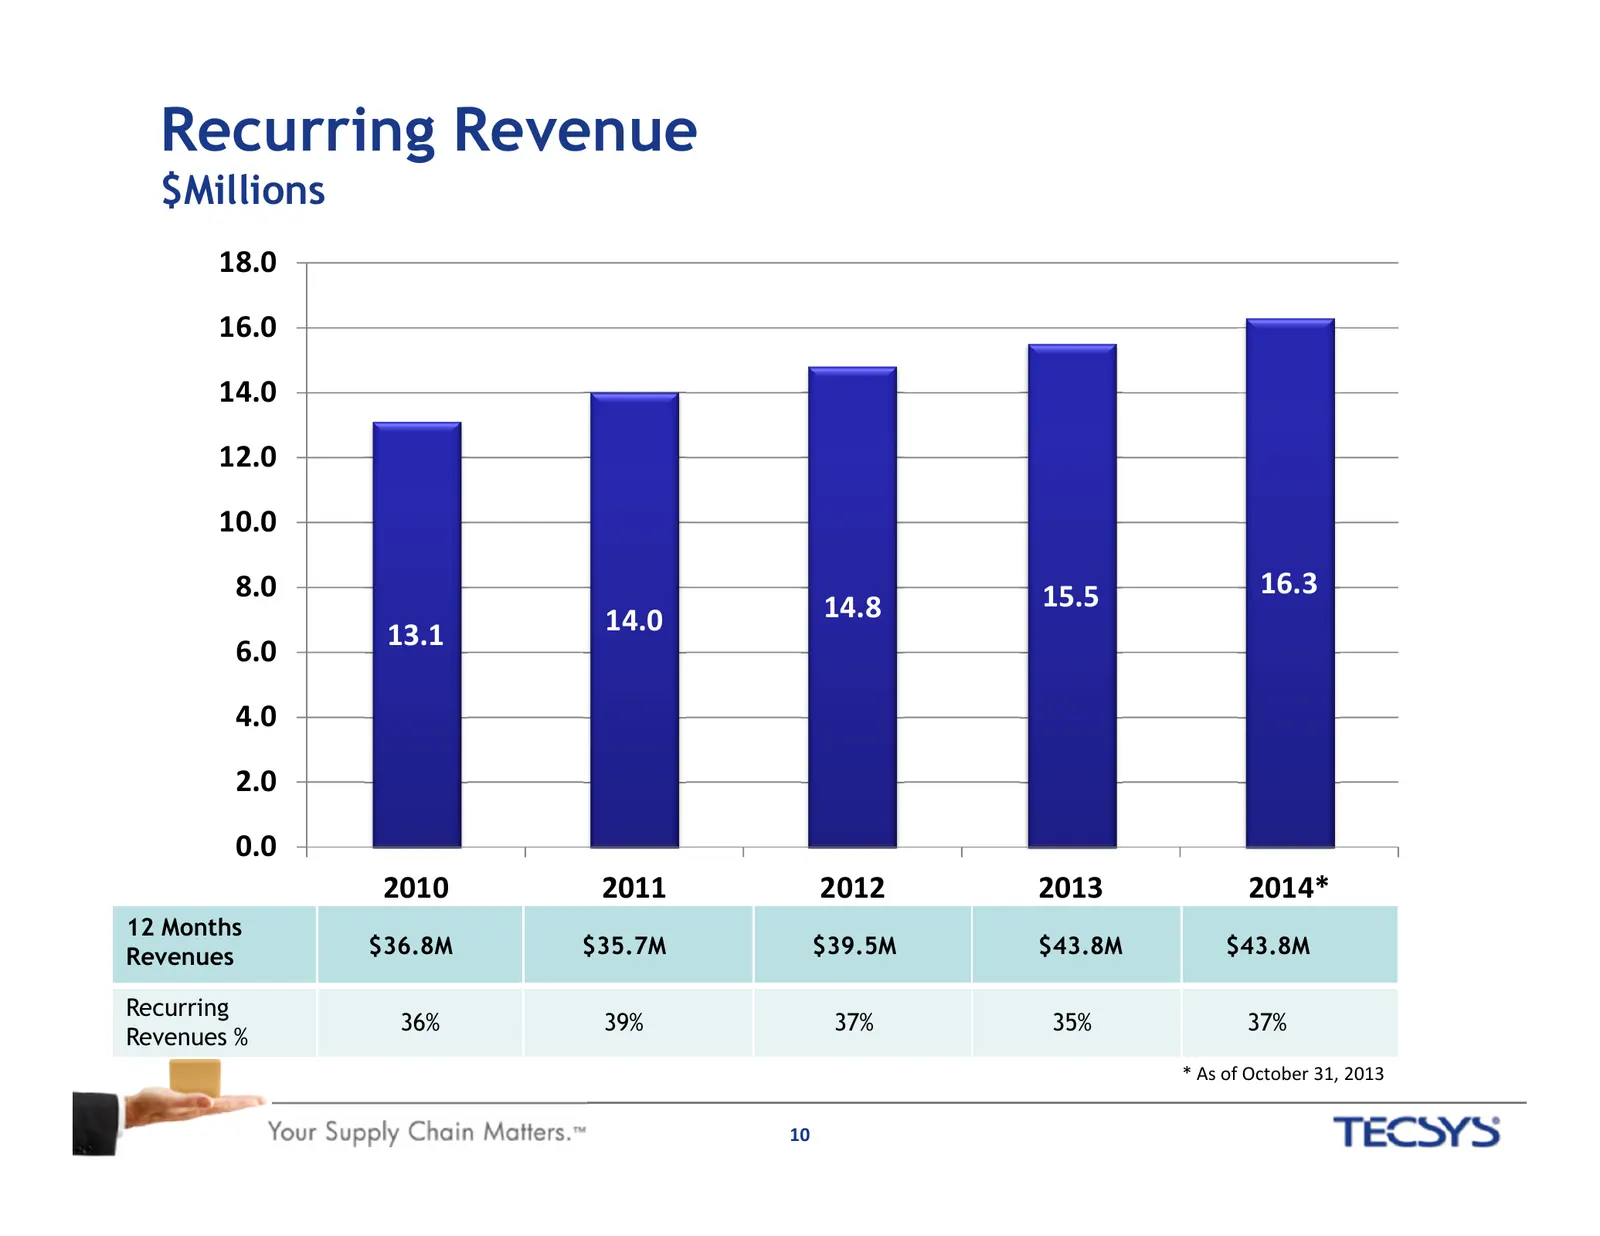
Slide 10: Recurring Revenue
Recurring Revenue $Millions 18.0 16.0 14.0 12.0 10.0 8.0 15.5 16.3 14.0 14.8 13.1 6.0 4.0 2.0 0.0 2010 2011 2012 2013 2014* 12 Months Revenues $36.8M $35.7M $39.5M $43.8M $43.8M Recurring 36% 39% 37% 35% 37% Revenues % * As of October 31, 2013 10
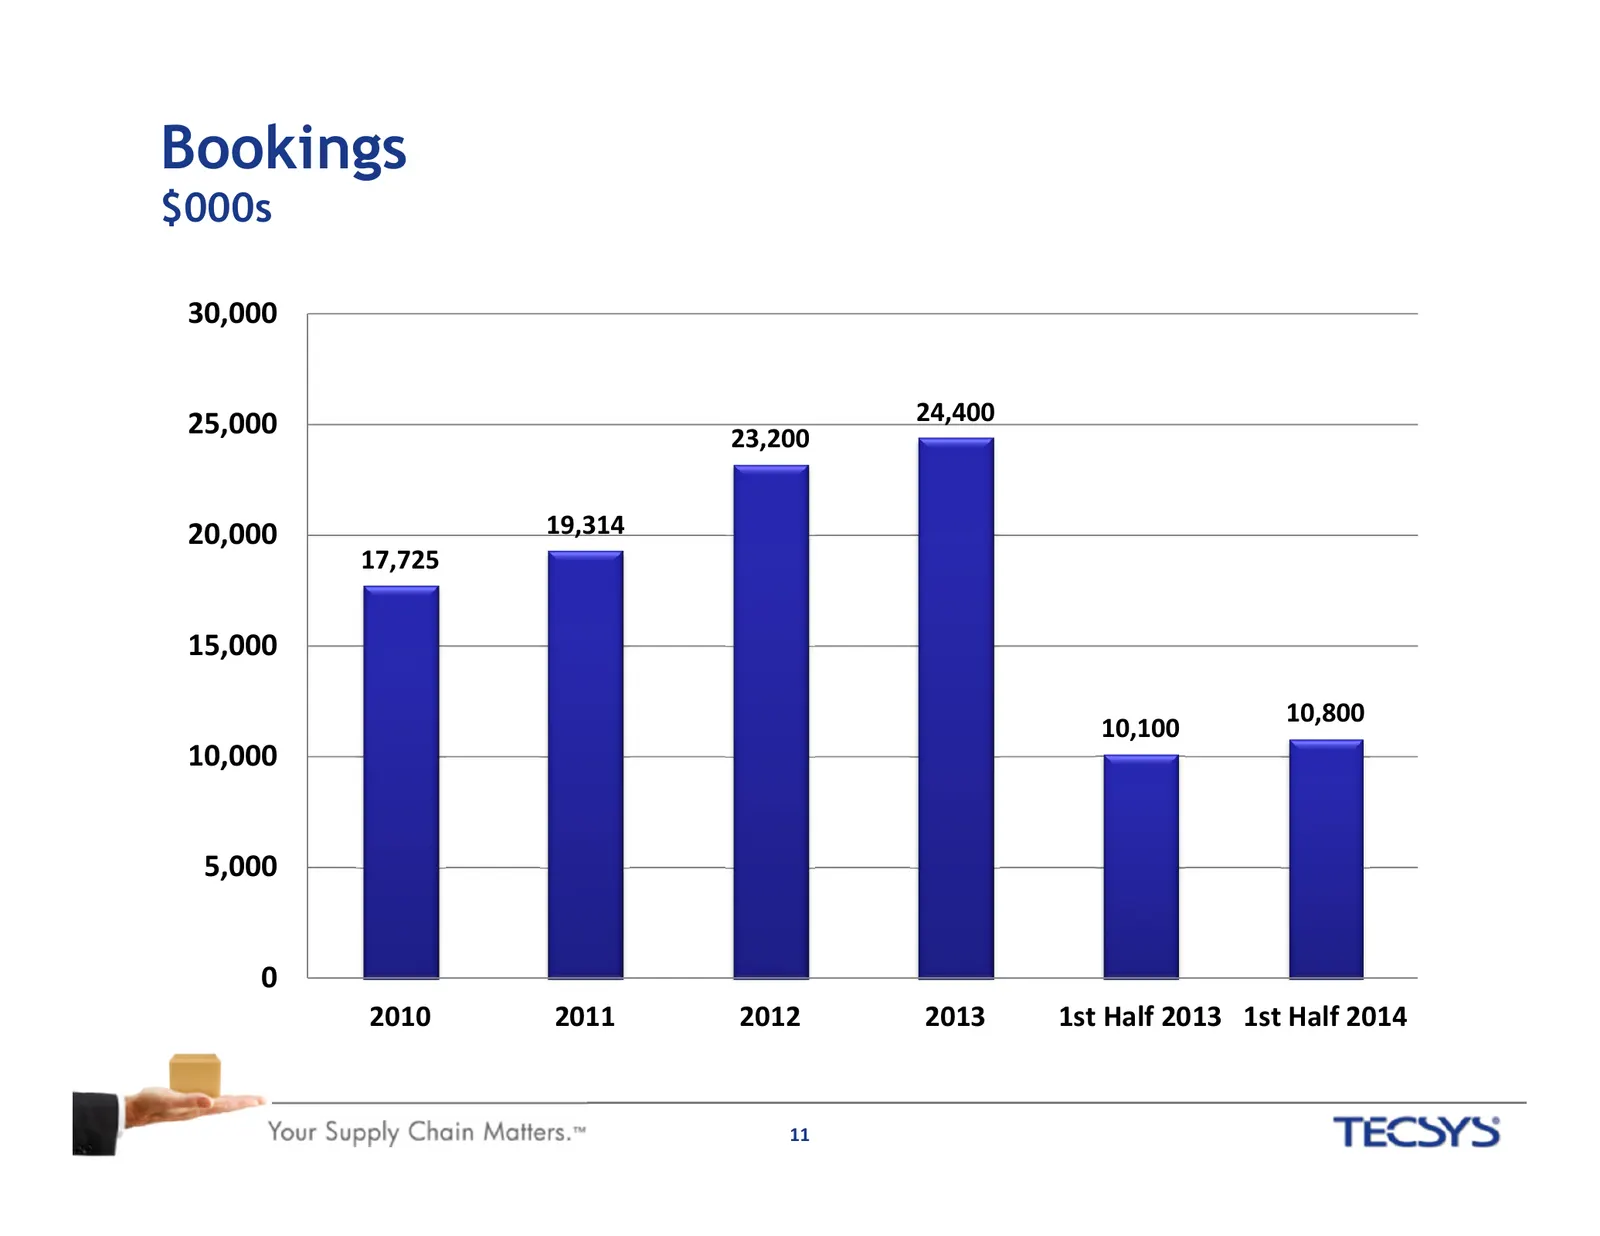
Slide 11: Bookings
Bookings $000s 30,000 25,000 24,400 23,200 20,000 19,314 17,725 15,000 10,800 10,100 10,000 5,000 0 2010 2011 2012 2013 1st Half 2013 1st Half 2014 11
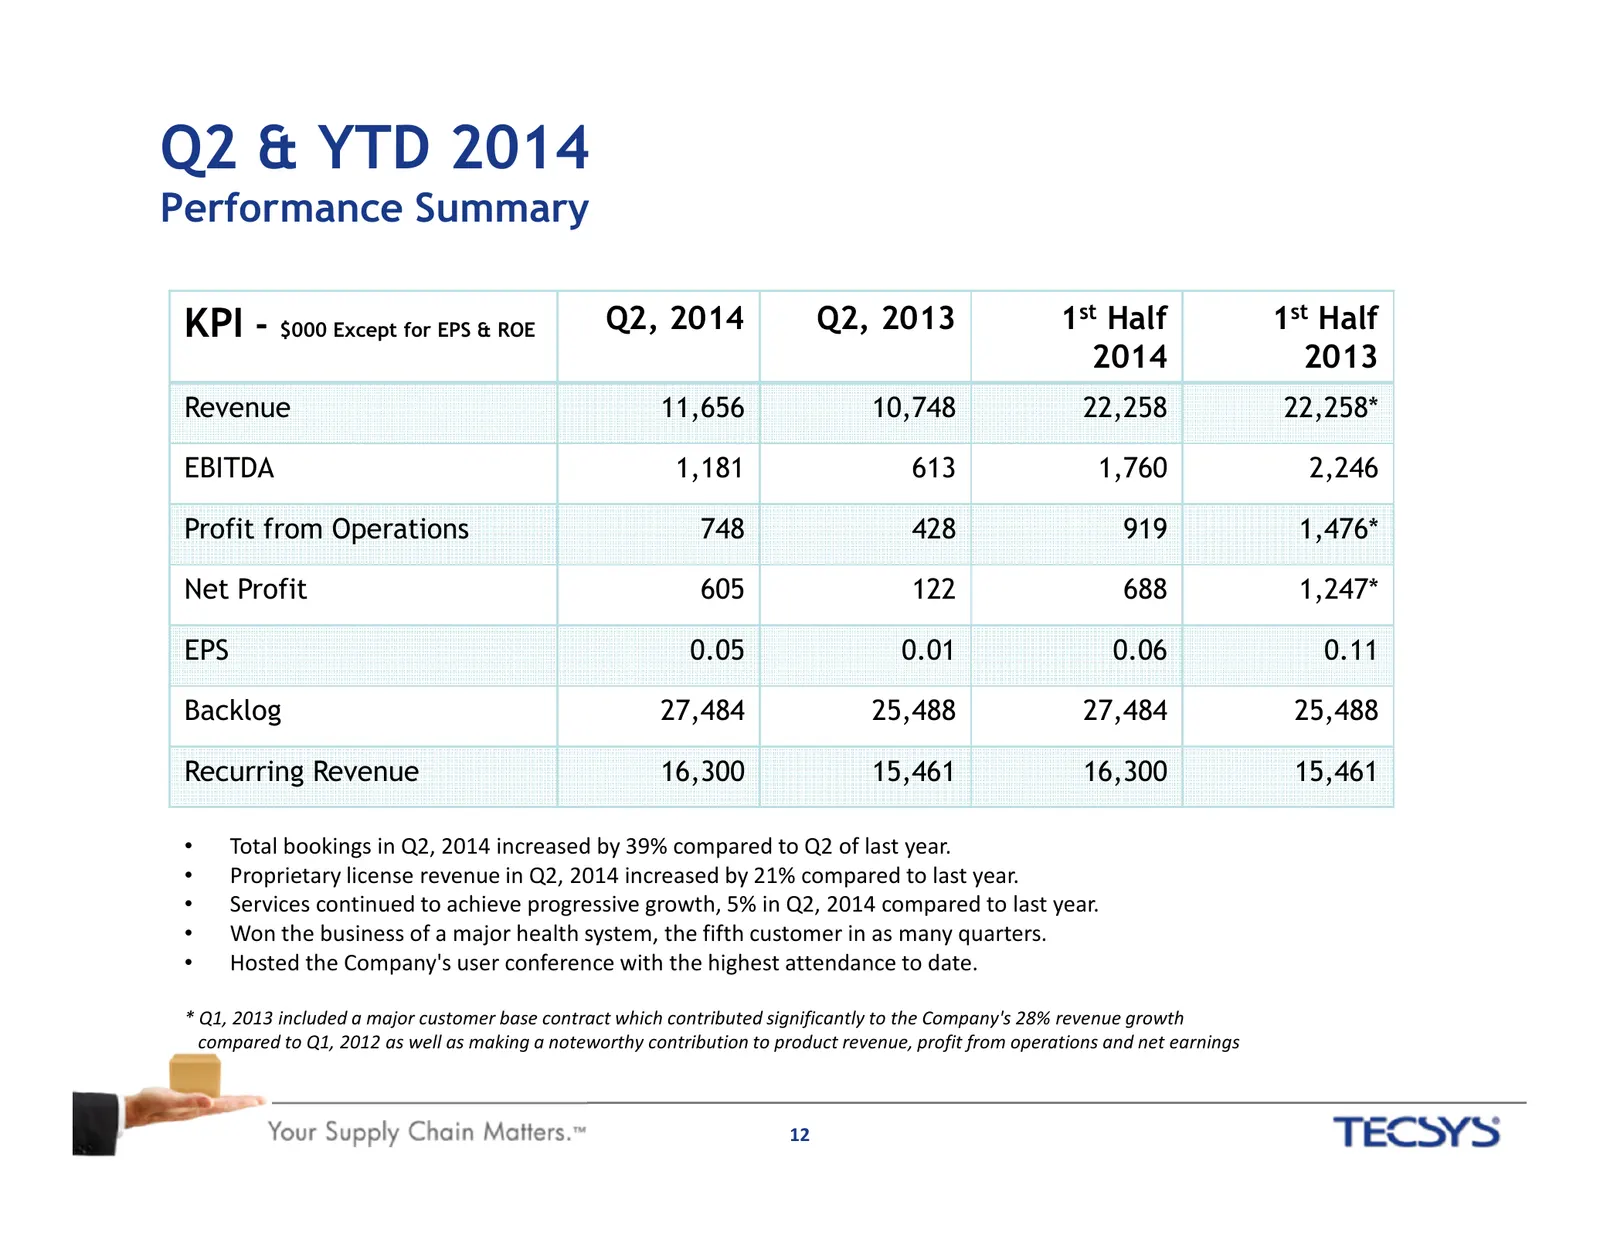
Slide 12: Q2 & YTD 2014
Q2 & YTD 2014 Performance Summary KPI - $000 Except for EPS & ROE Q2, 2014 Q2, 2013 1st Half 1st Half 2014 2013 Revenue 11,656 10,748 22,258 22,258* EBITDA 1,181 613 1,760 2,246 Profit from Operations 748 428 919 1,476* Net Profit 605 122 688 1,247* EPS 0.05 0.01 0.06 0.11 Backlog 27,484 25,488 27,4
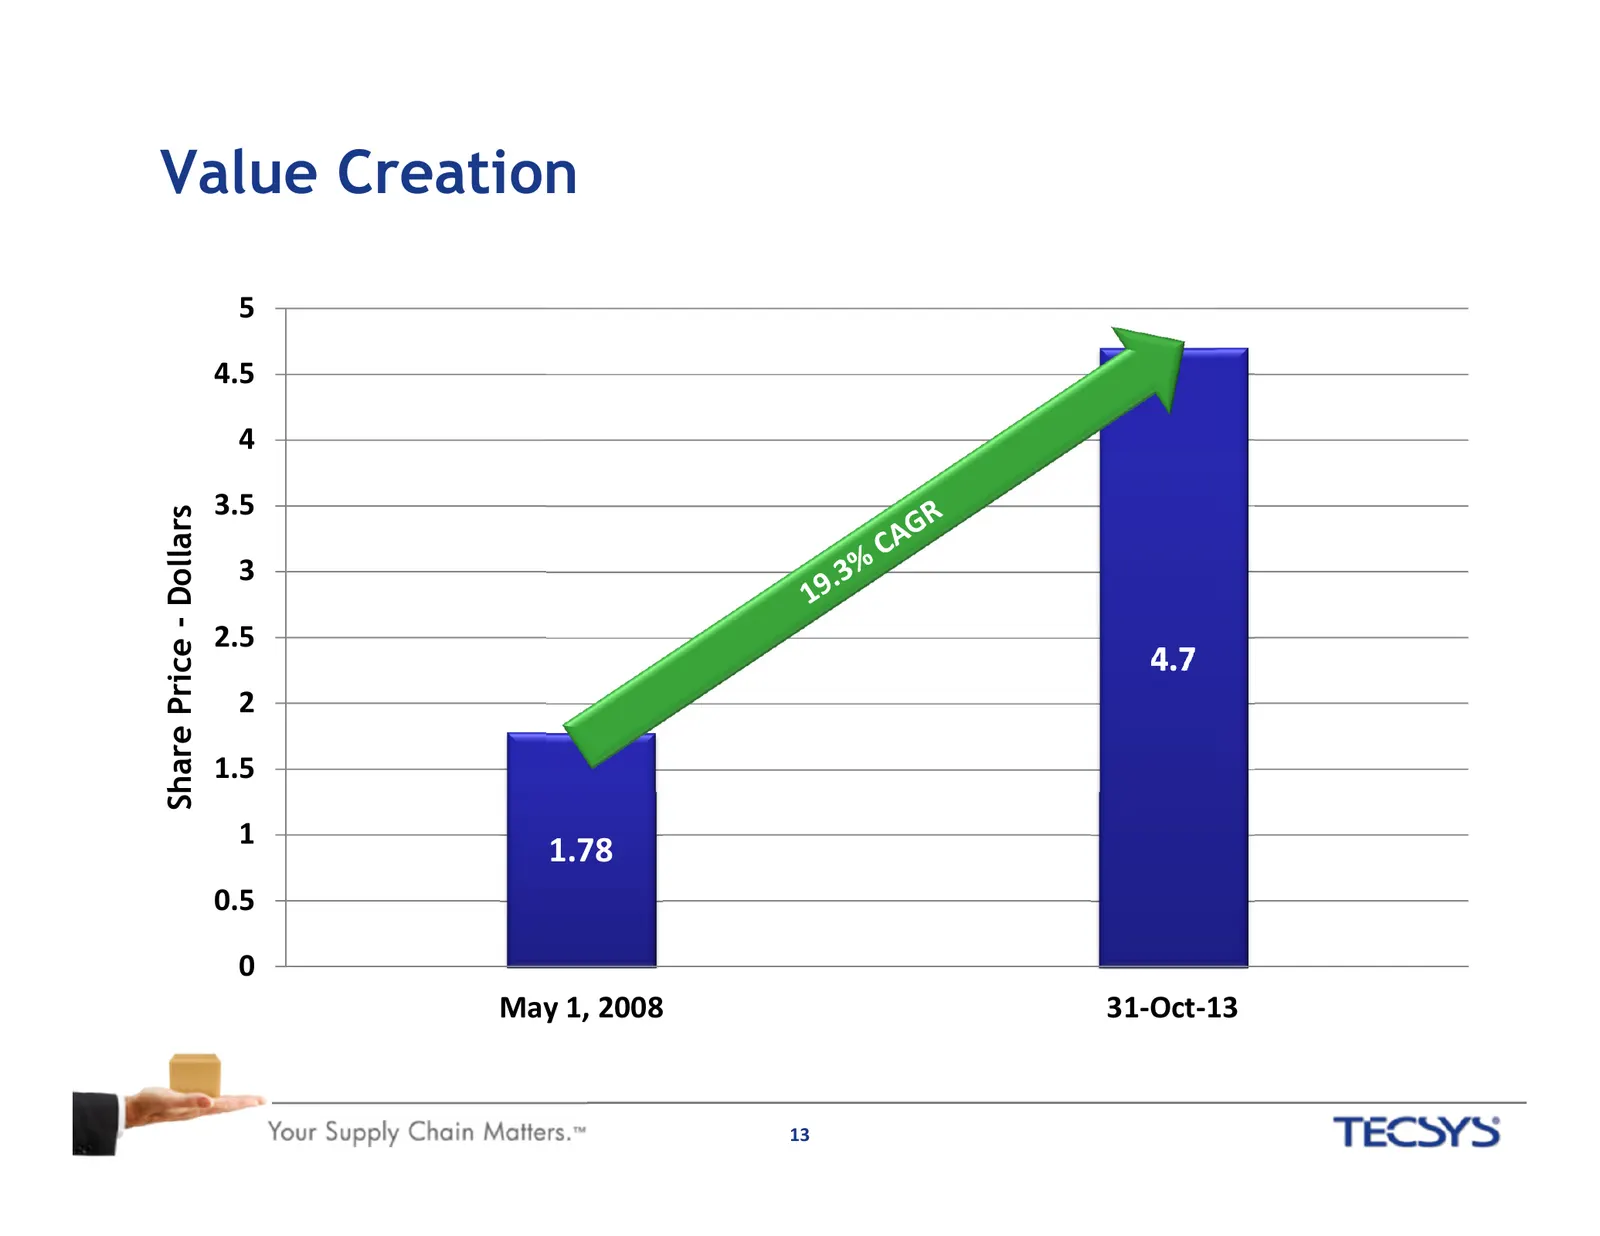
Slide 13: Share Price - Value Creation
Value Creation 5 4.5 4 3.5 Share Price - Dollars 3 2.5 4.7 2 1.5 1 1.78 0.5 0 May 1, 2008 31-Oct-13 13
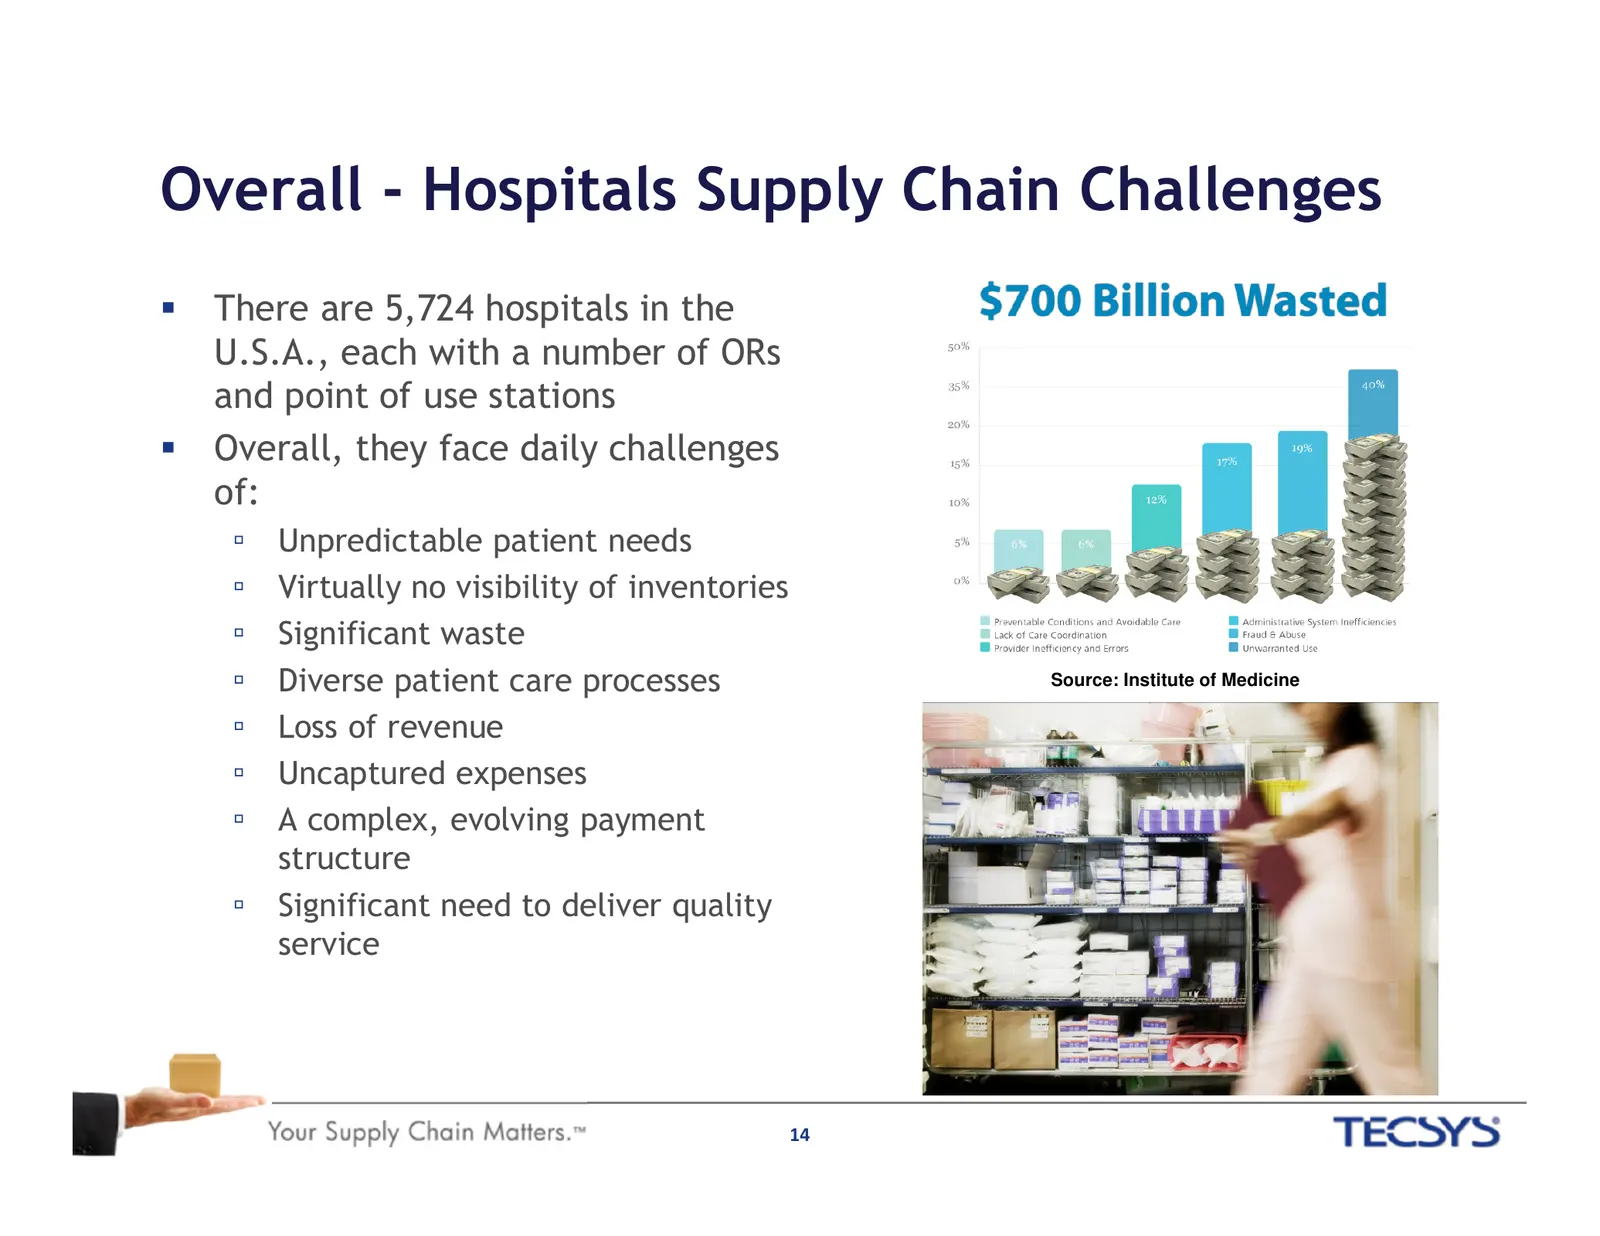
Slide 14: Overall - Hospitals Supply Chain Challenges
Overall - Hospitals Supply Chain Challenges There are 5,724 hospitals in the U.S.A., each with a number of ORs and point of use stations Overall, they face daily challenges of: ▫ Unpredictable patient needs ▫ Virtually no visibility of inventories ▫ Significant waste ▫ Diverse patient care processes
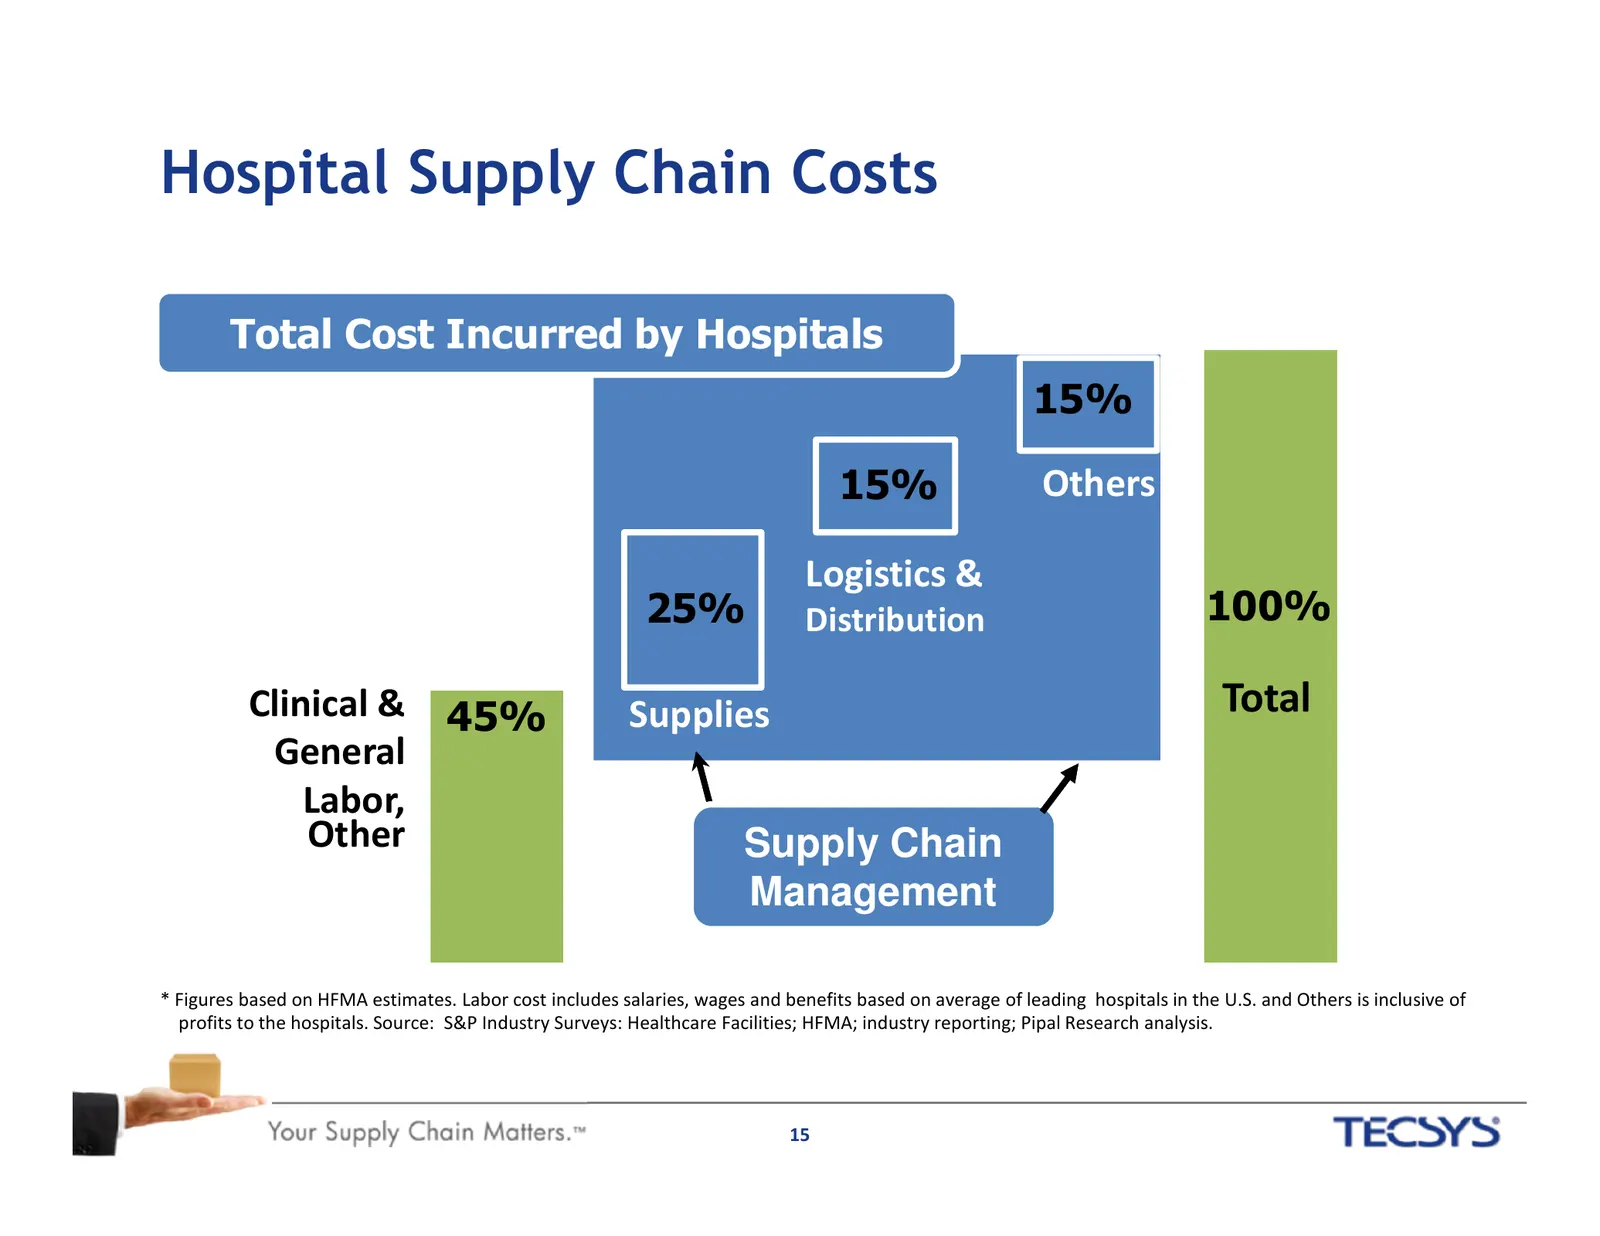
Slide 15: Hospital Supply Chain Costs
Hospital Supply Chain Costs Total Cost Incurred by Hospitals 15% 15% Others Logistics & 25% Distribution 100% Clinical & 45% Supplies Total General Labor, Other Supply Chain Management * Figures based on HFMA estimates. Labor cost includes salaries, wages and benefits based on average of leading hos
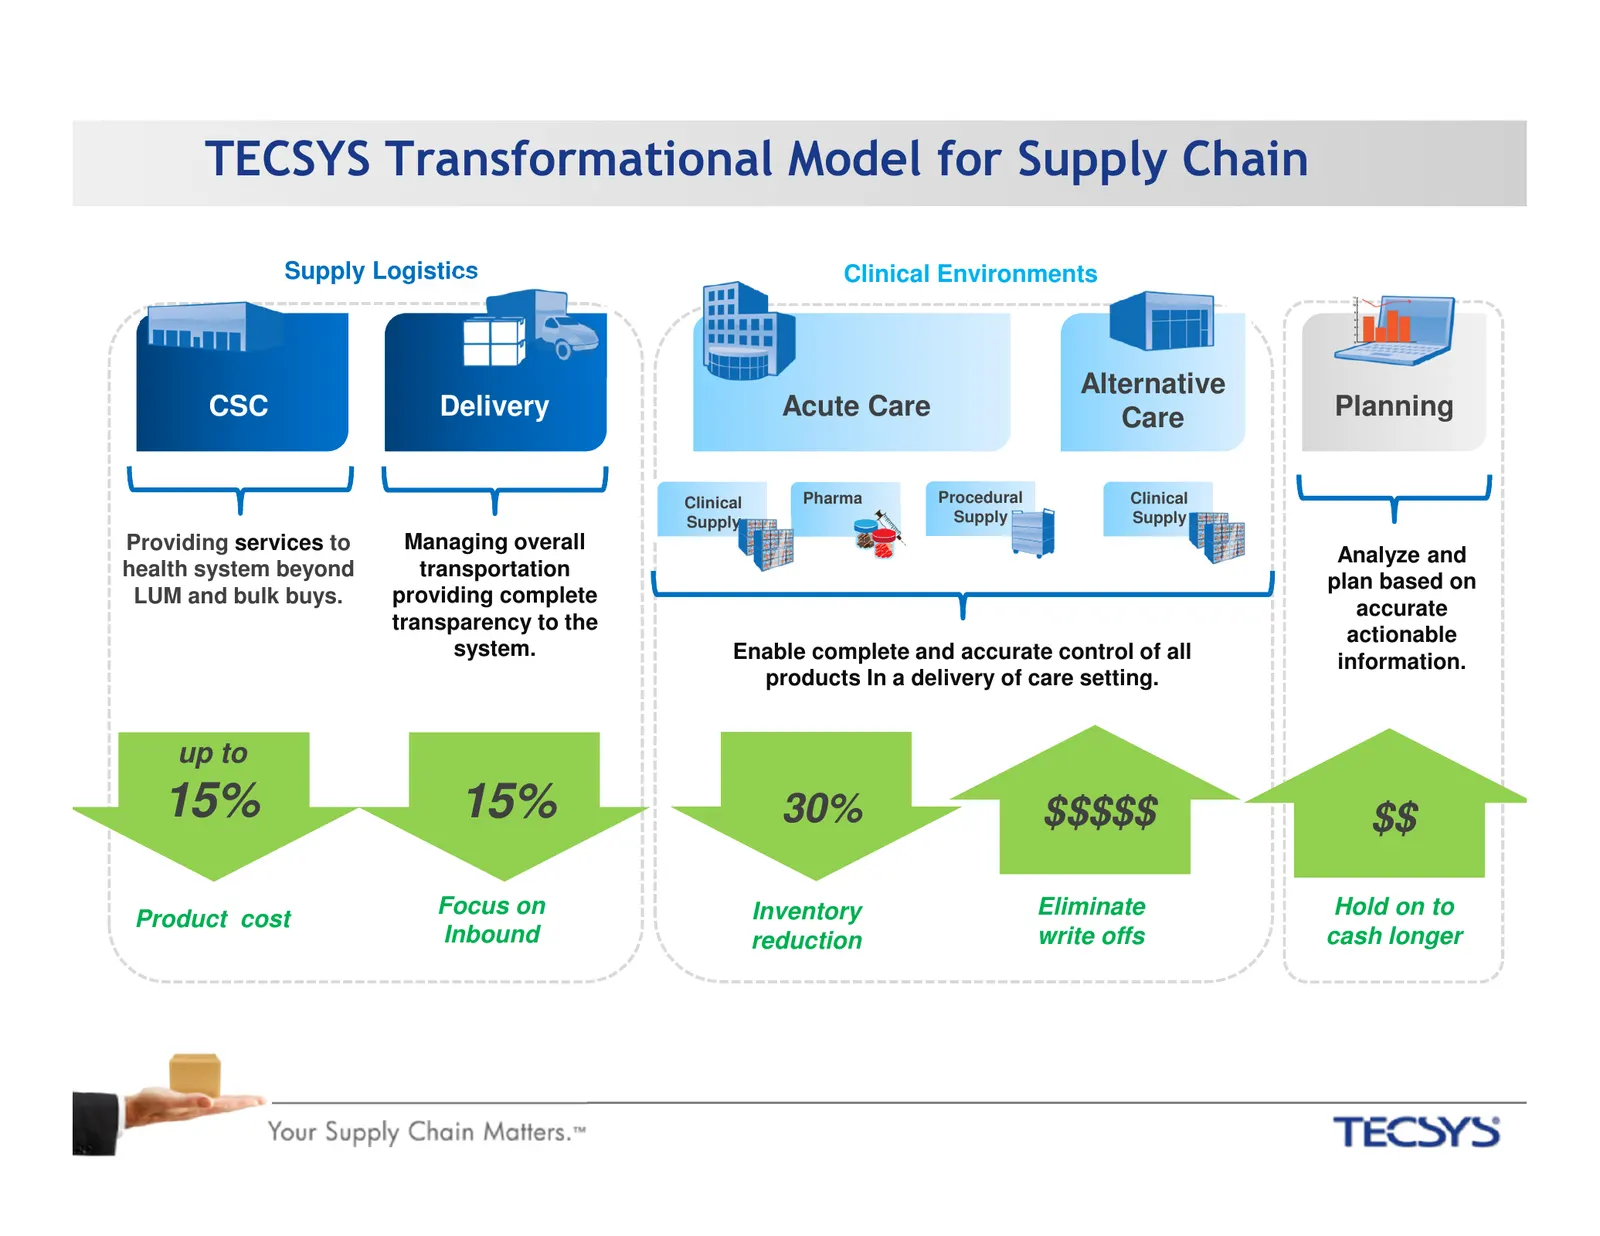
Slide 16: TECSYS Transformational Model for Supply Chain
TECSYS Transformational Model for Supply Chain Supply Logistics Clinical Environments Alternative CSC Delivery Acute Care Care Planning Clinical Pharma Procedural Clinical Supply Supply Supply Providing services to Managing overall Analyze and health system beyond transportation plan based on LUM an
Slide 17: Health System Customers
Health System Customers Mercy’ SHIGHMARK. — PARKVIEW HEALTH WW on _LEESAR_ Intermountain” ORLANDO HEALTH Ge Healthcare N\A > = WV Essentia Health PROVIDENCE e °| HEALTH Winnipeg Regional NORTH MISSISSIPPI Beaumont | sre Health Authority MEDICAL CENTER Caring for Health | iE Your Supply Chain Matters
Slide 18: Healthcare – Business Opportunities
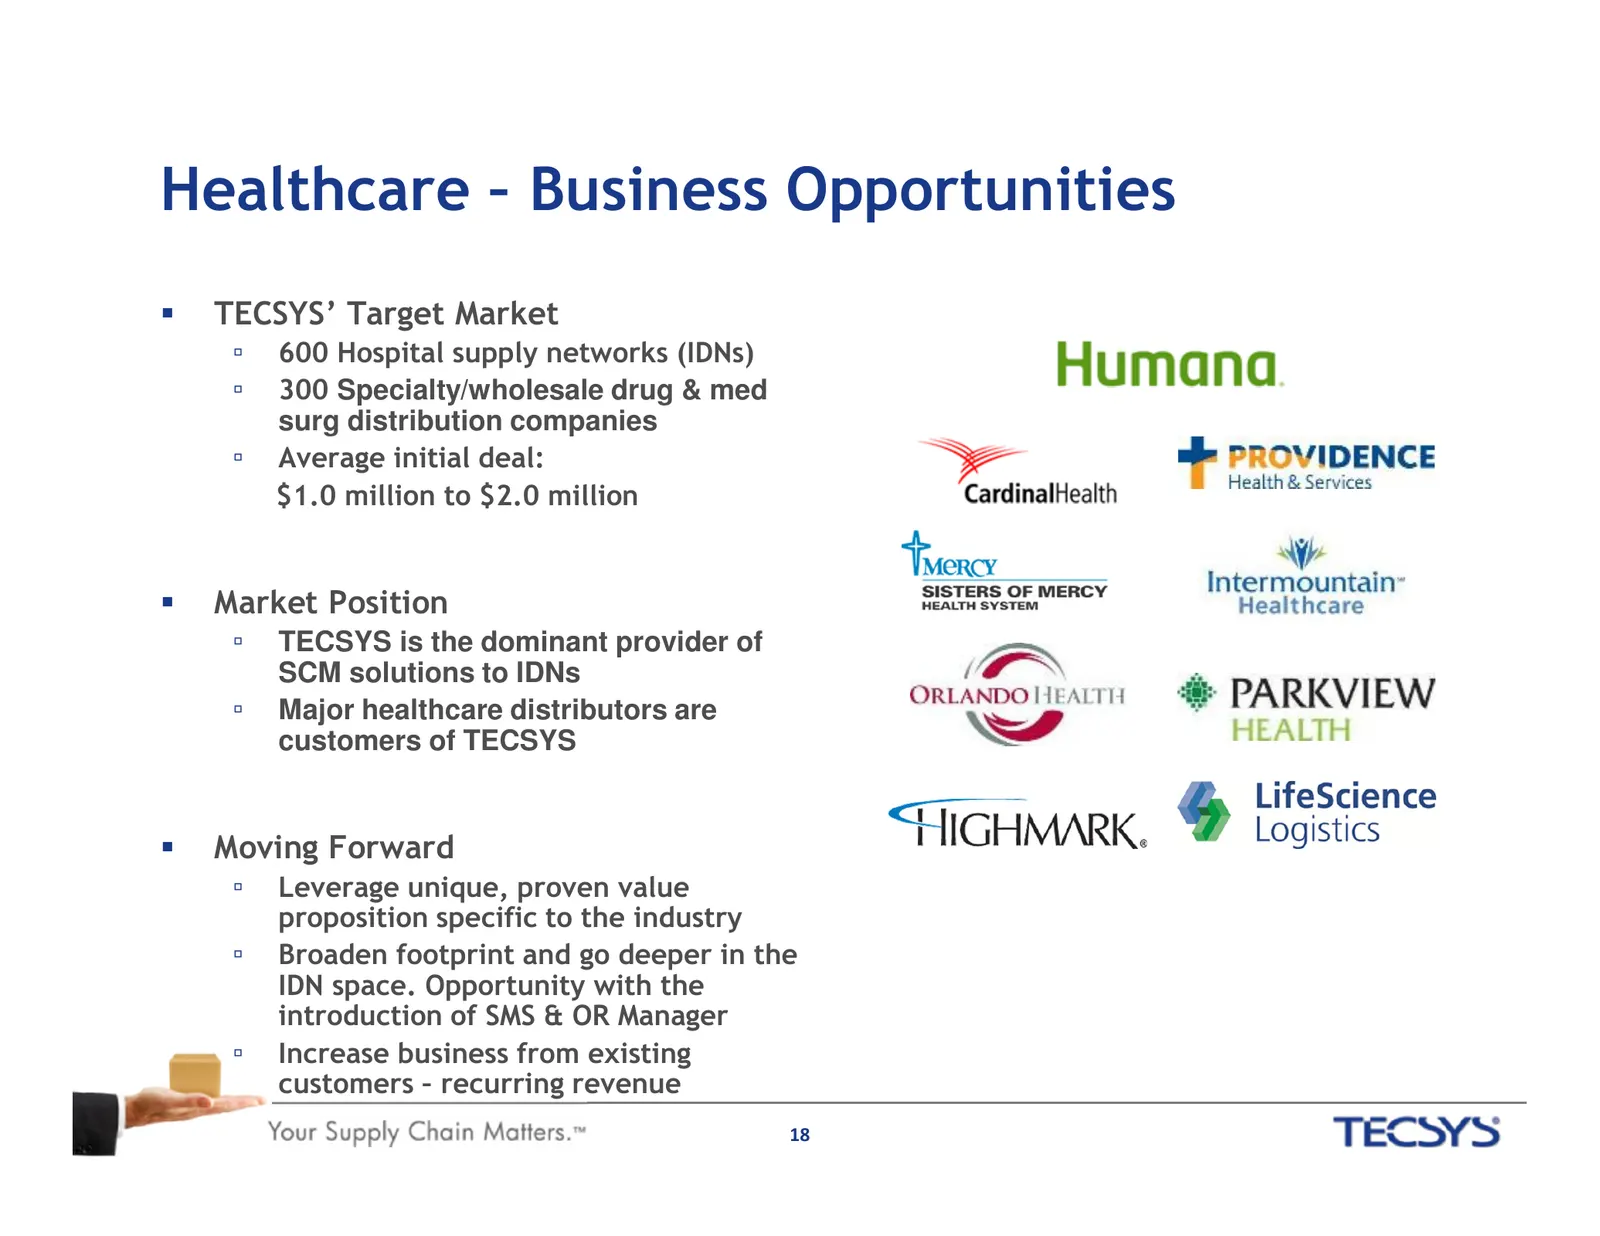
Healthcare – Business Opportunities TECSYS’ Target Market ▫ 600 Hospital supply networks (IDNs) ▫ 300 Specialty/wholesale drug & med surg distribution companies ▫ Average initial deal: $1.0 million to $2.0 million Market Position ▫ TECSYS is the dominant provider of SCM solutions to IDNs ▫ Major hea
Slide 19: The Parkview Health Story
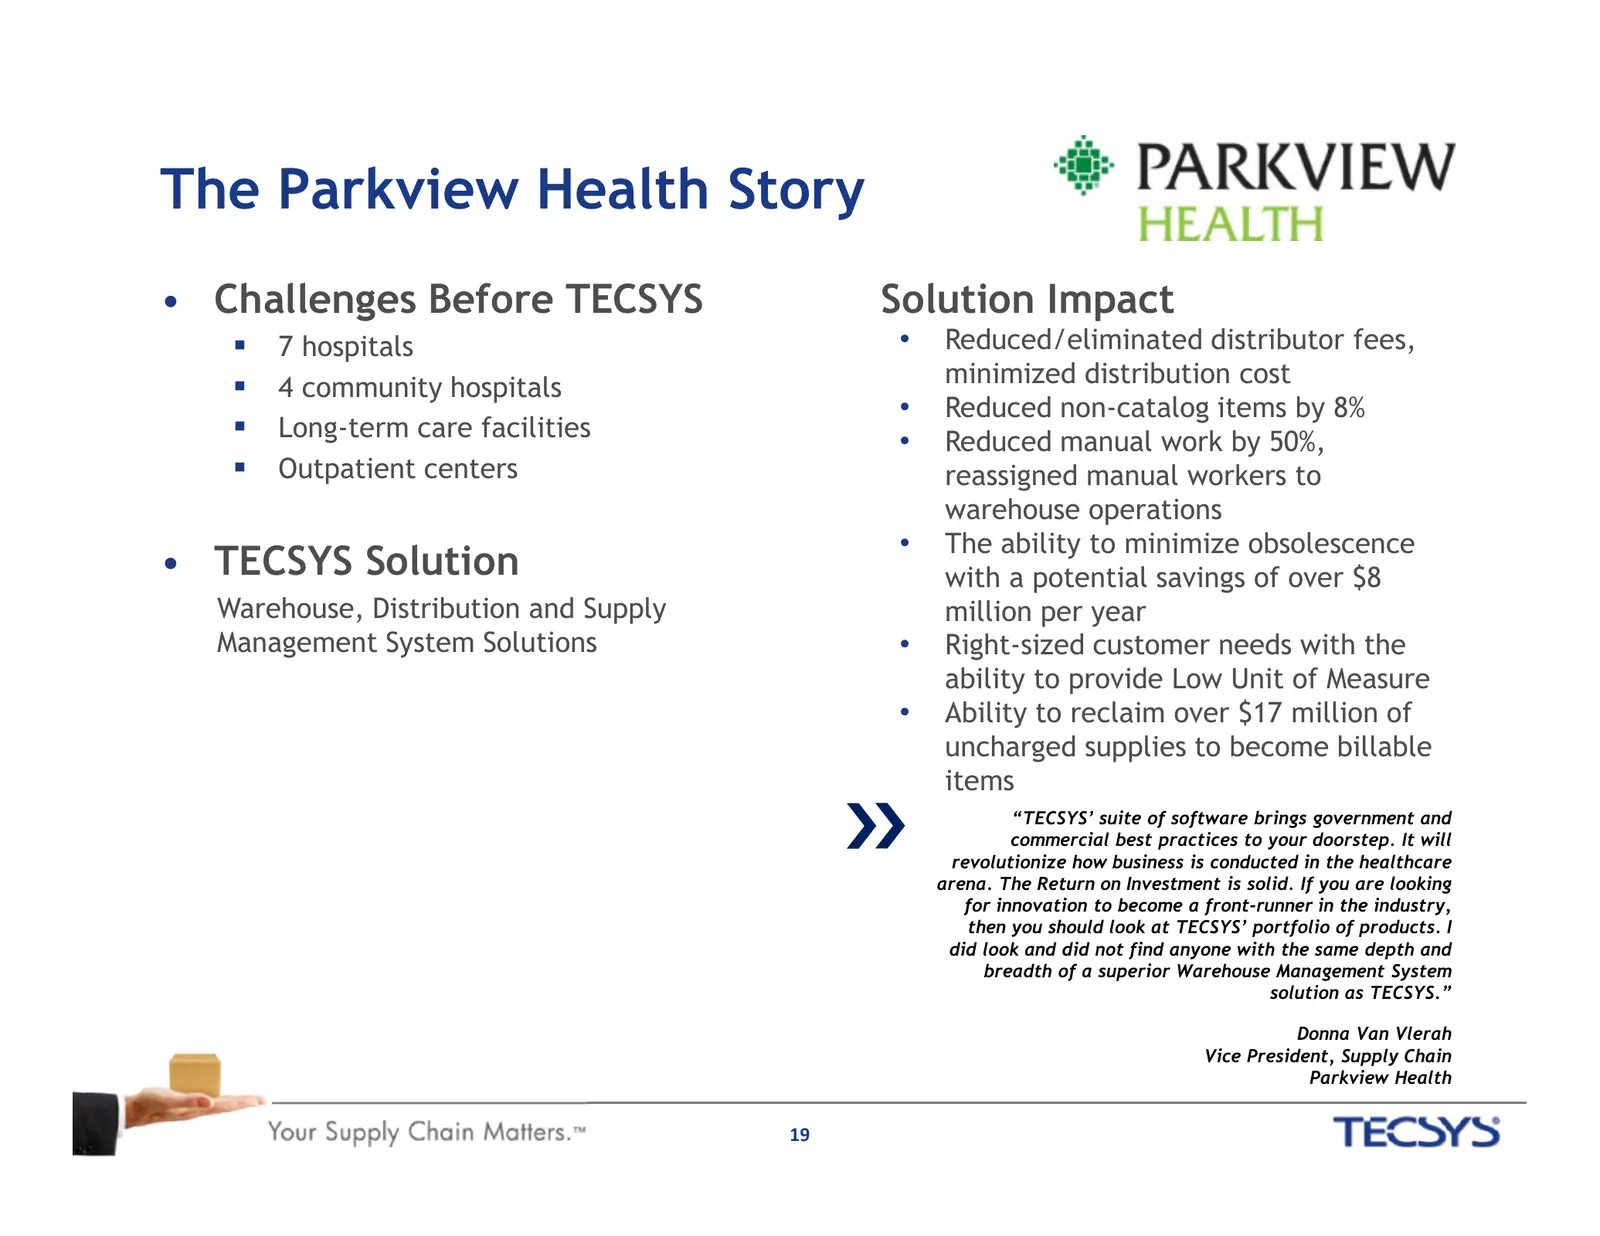
The Parkview Health Story • Challenges Before TECSYS Solution Impact 7 hospitals • Reduced/eliminated distributor fees, 4 community hospitals minimized distribution cost • Reduced non-catalog items by 8% Long-term care facilities • Reduced manual work by 50%, Outpatient centers reassigned manual wor
Slide 20: Supply Chain Management Market
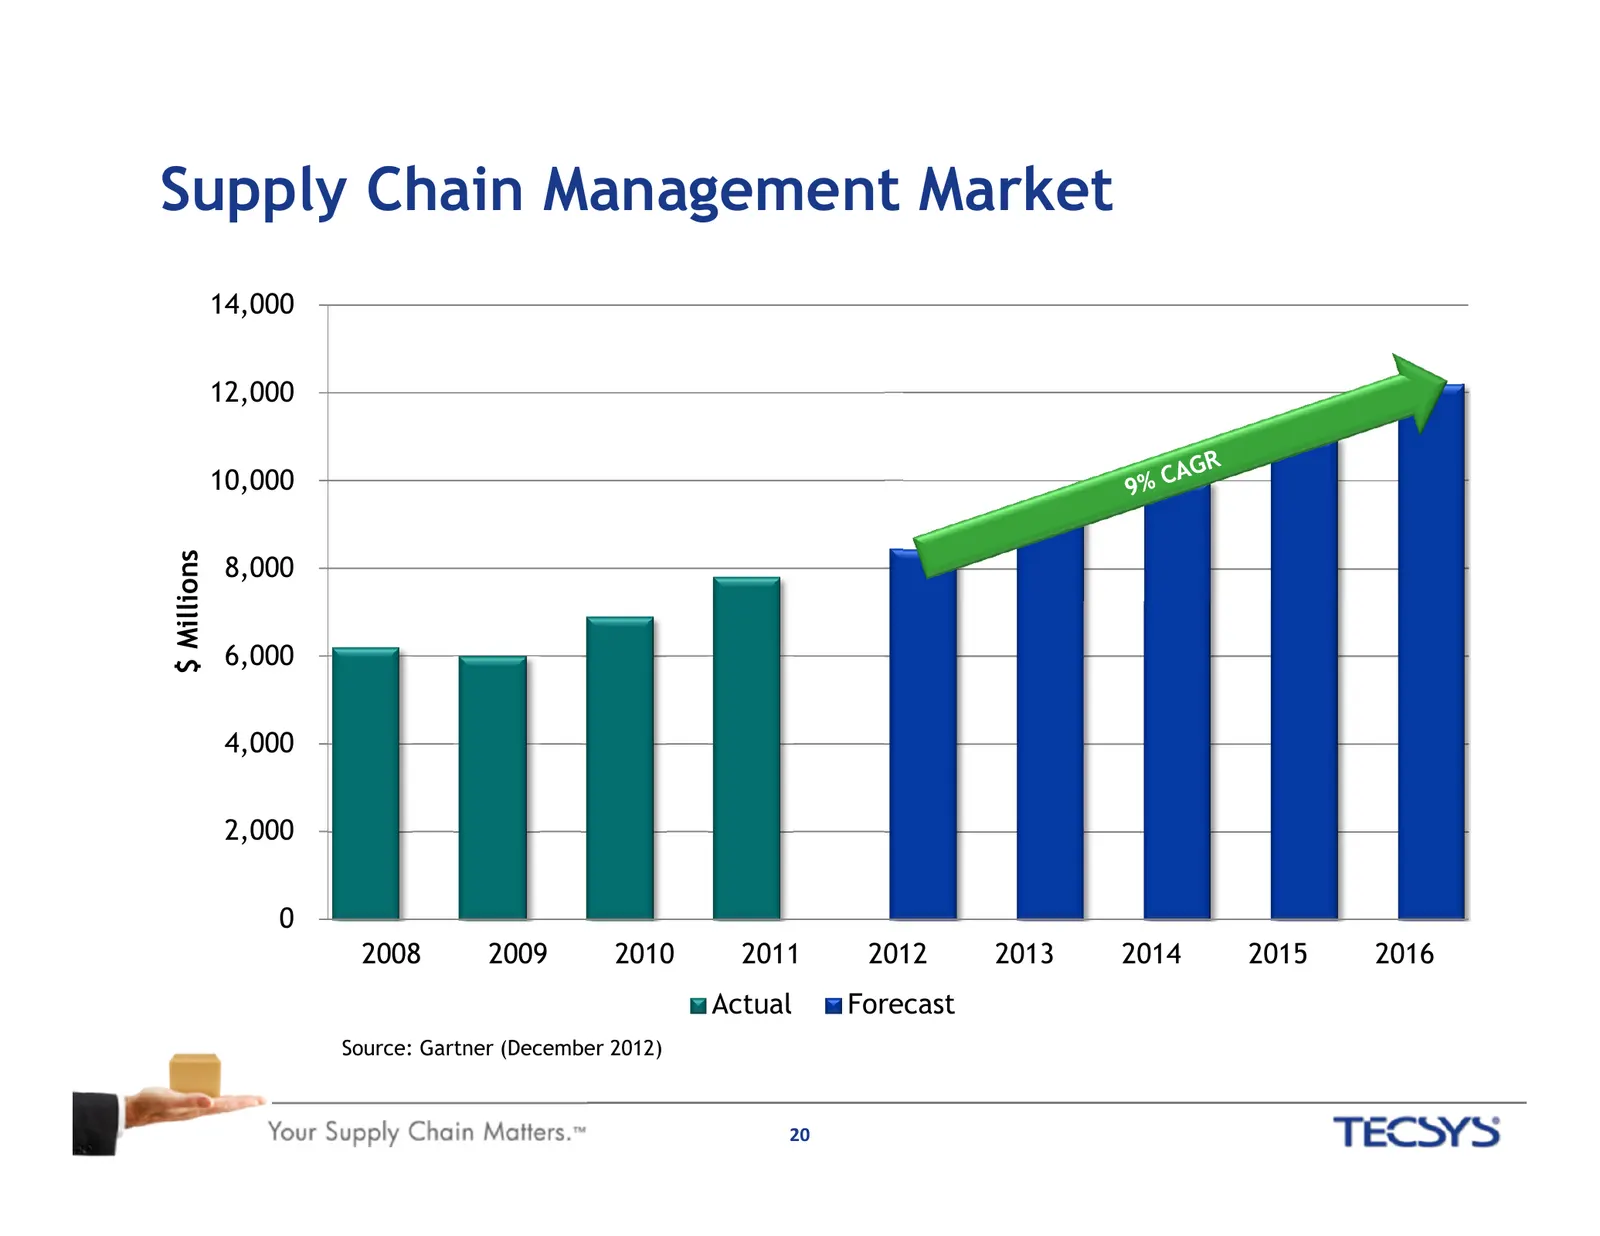
Supply Chain Management Market 14,000 12,000 10,000 $ Millions 8,000 6,000 4,000 2,000 0 2008 2009 2010 2011 2012 2013 2014 2015 2016 Actual Forecast Source: Gartner (December 2012) 20
Slide 21: TECSYS on Profitable Growth
TECSYS on Profitable Growth Solution to the right problem Focused on market sectors with deep pockets Right technology: – users love & accepted by their IT management Endorsed by the right analysts 21
Slide 22: Thank You!
Thank You! TECSYS Inc. 1 Place Alexis Nihon, Suite 800, Montreal, Quebec Canada H3Z 3B8 Toll Free: 1-800-922-8649 Tel: (514) 866-0001 info@tecsys.com www.tecsys.com 22
Source: Internet Archive copy of tecsys.com
More decks from TECSYS Inc.
 Q1 2027 Earnings Presentation22 slides · Sep 11, 2026
 Q4 2026 Earnings Presentation22 slides · Jun 30, 2026
 Q3 2026 Earnings Presentation23 slides · Mar 5, 2026
 Q2 FY2026 Earnings Presentation23 slides · December 2025
 Q1 2026 Earnings Presentation23 slides · Sep 5, 2025
 Q4 2025 Earnings Presentation21 slides · June 2025