Plains Exploration & Production Company
Plains Exploration & Production — Credit Suisse Energy Summit 2010
25 slides from Plains Exploration & Production's conference presentation, Feb 3, 2010

Slide 1: Credit Suisse Energy Summit February 2010
Credit Suisse Energy Summit February 2010 Exhibit 99.1
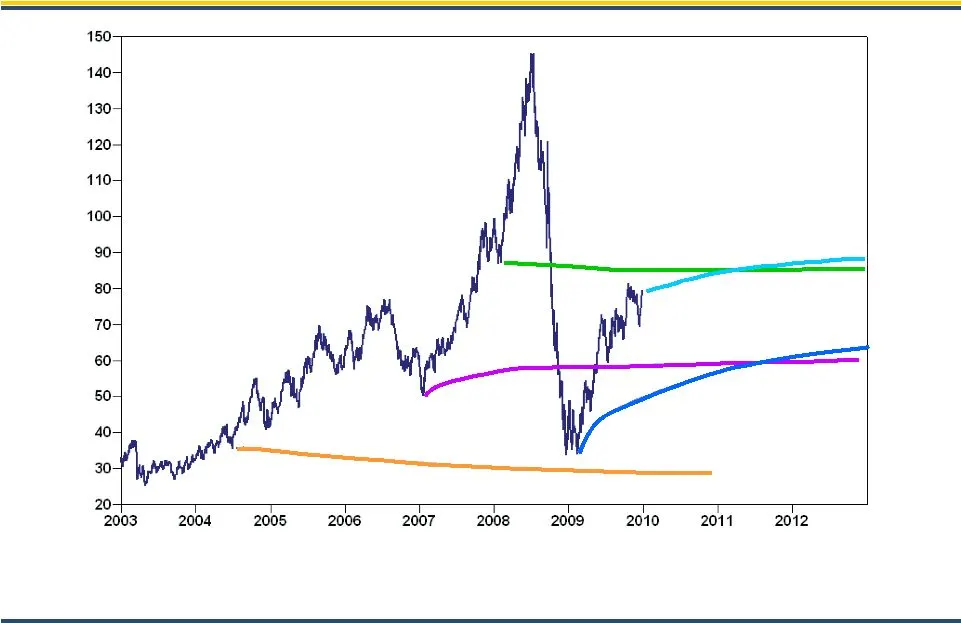
Slide 2: WTI Nymex Historical Prices and Forward Curves ($/bbl)
WTI Nymex Historical Prices and Forward Curves ($/bbl) February 6, 2008 June 29, 2004 January 18, 2007 Source: Goldman Sachs, NYMEX December 31, 2009 February 17, 2009

Slide 3: PXP Today
PXP Today • +$7 billion enterprise value (1) • 360 MMBOE proved reserves YE 2009 • 82,700 BOE per day production (2) • +2.0 billion BOE resource potential • 139 million shares outstanding (3) • 44% debt-to-total capitalization (3) (1) Reflects stock price as of January 29, 2010 and total debt. (2) R

Slide 4: PXP Strategy Detail
PXP Strategy Detail Operationally Balanced • Begin development of Diatomite, Non-Diatomite and Miocene projects to maintain oil production volumes • Accelerate Granite Wash potential in the Texas Panhandle • Accelerate Haynesville development to increase natural gas production • Develop high potenti
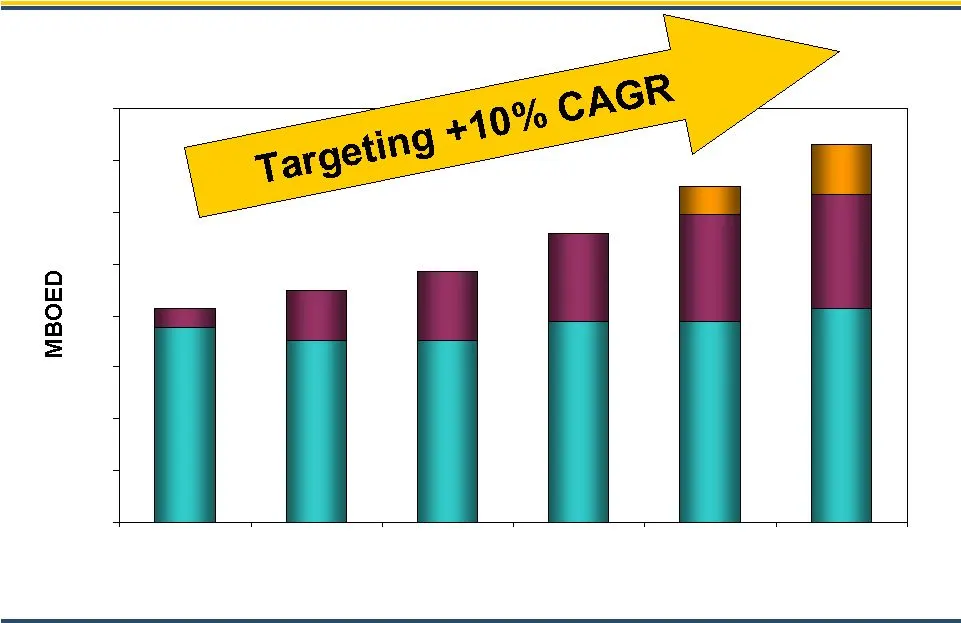
Slide 5: Production Target Growth in MBOED
7 H-Ville 19 H-Ville 27 H-Ville 34 H-Ville 41 H-Ville 44 H-Ville 11 Friesian 19 Friesian 2010e 2011e 2012e 2013e 2014e Production Target Growth in MBOED H-Ville H-Ville 82.7 (1) (1) 2010e production represents guidance mid-point. (2) Represents corporate targets. (2) (2) (2) (2) H-Ville H-Ville H-Vi
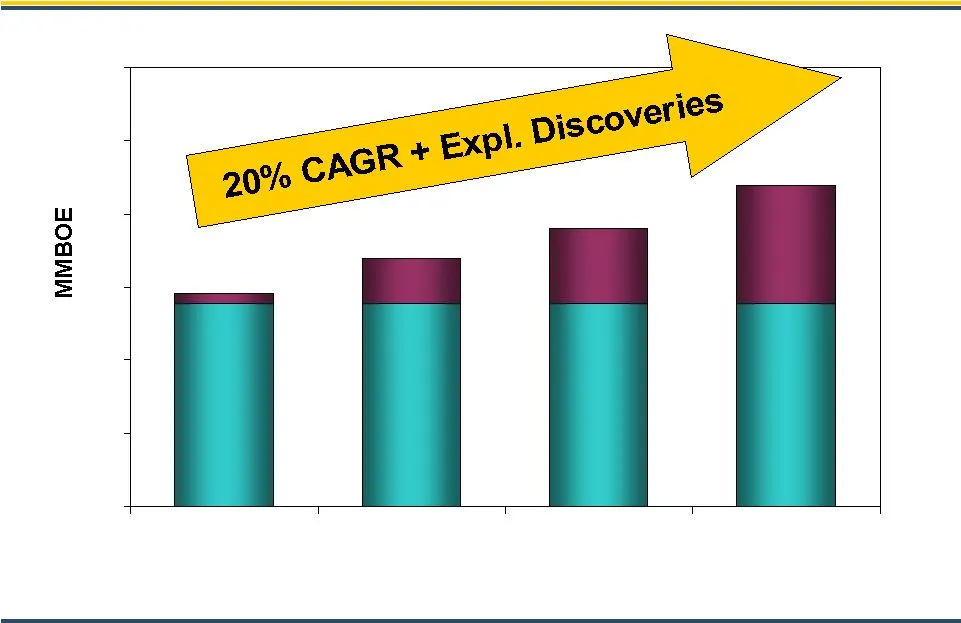
Slide 6: Proved Reserves Target Growth
277 15 H - Ville 62 H-Ville 298 104 H-Ville 317 162 H-Ville 338 Proved Reserves Target Growth $55.00 & $5.50 Flat NYMEX Pricing (1) (1) H-Ville H-Ville H-Ville (1) Illustrates estimated reserves using NYMEX pricing and recent historical average differentials of 15%.
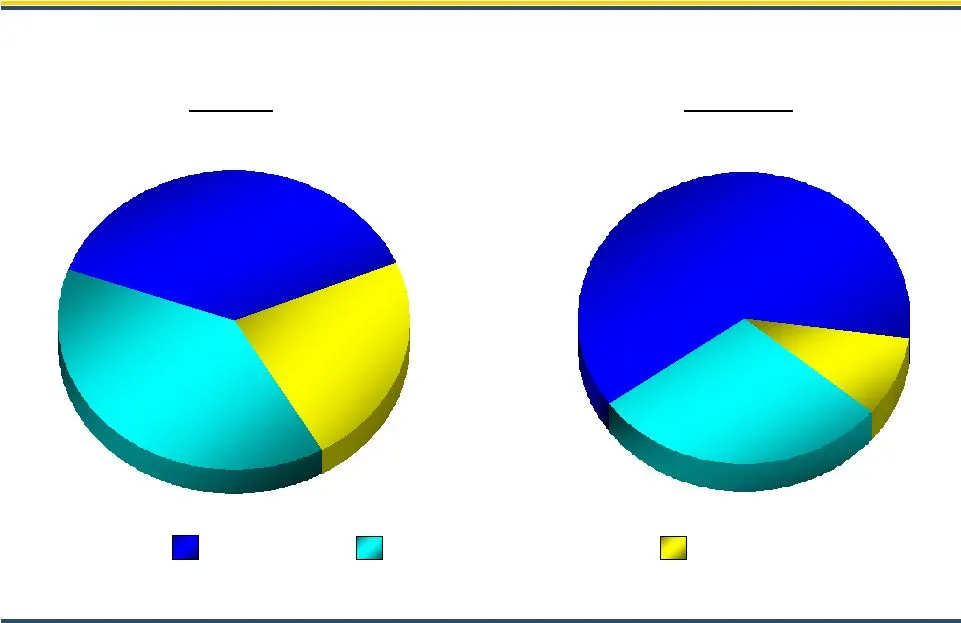
Slide 7: Capital Allocation
62% 38% Capital Allocation $1.55 billion 2010E ~$1.0 billion 29% 9% Development Capital Program Exploration 23% 39% Development capital includes exploitation, real estate, capitalized interest and G&A costs but does not include additional capital for exploratory successes. H'Ville H'Ville Developmen
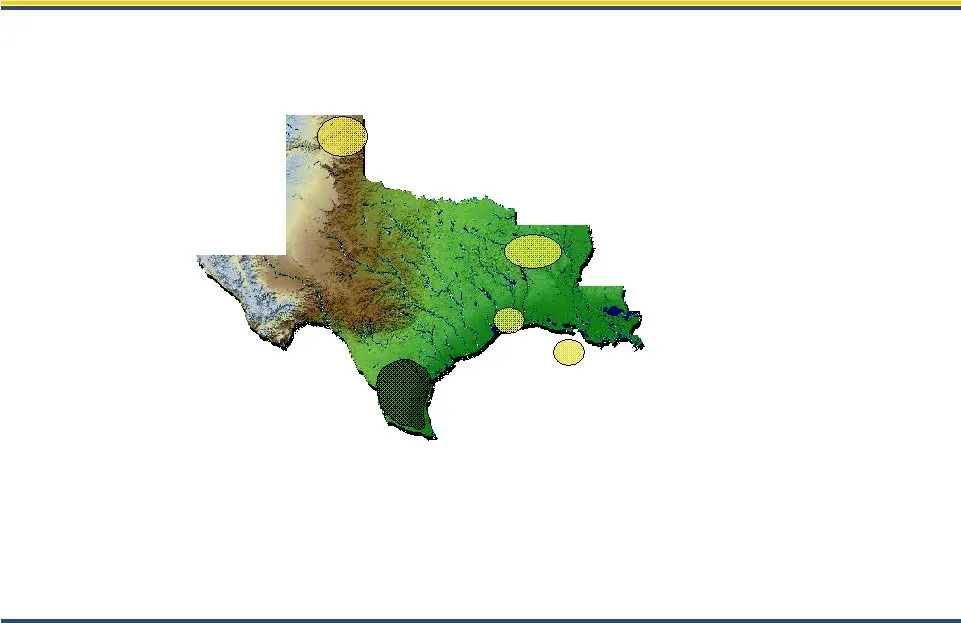
Slide 8
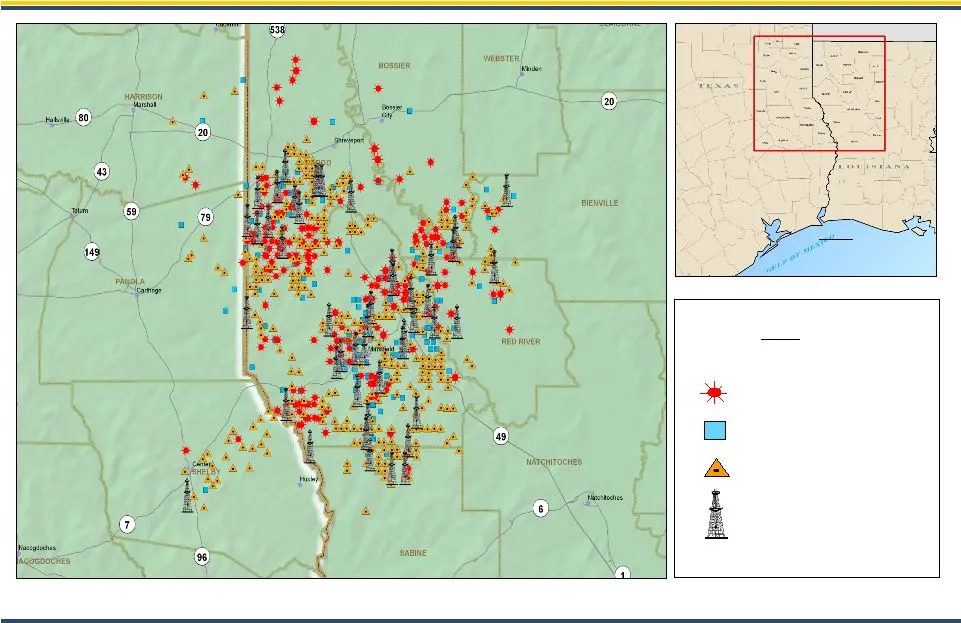
Slide 9: Haynesville Shale Leasehold and Activity Map
Legend PRODUCING WAIT ON COMPLETION 2010 DRILL LOCATIONS ACTIVE DRILLING Location Map Haynesville Shale Leasehold and Activity Map TEXAS LOUISIANA
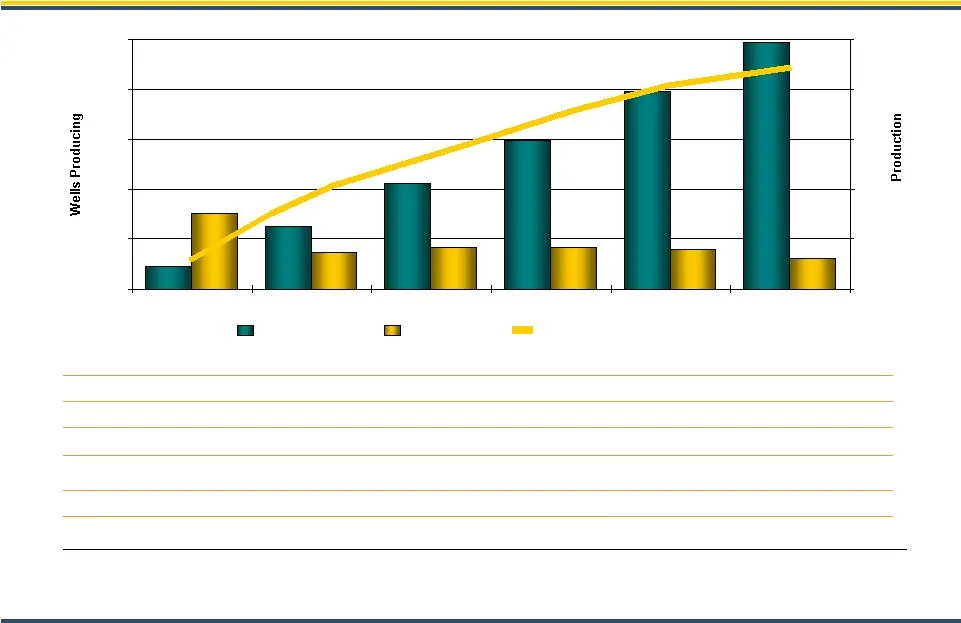
Slide 10: Haynesville Shale Economics
1,200 1,600 2,000 Haynesville Shale Economics $1.37 Mcfe or $8.24/BOE (2) January 1, 2010 Project Cost Forward F&D: (1) Assumes D&C costs for first 4 years = $7.5 MM per well, after 4 years = $6 MM per well. (2) Assumes flat NYMEX natural gas pricing of $5.50 per MMBTU. 6.5 Bcfe Est. Median Gross EU
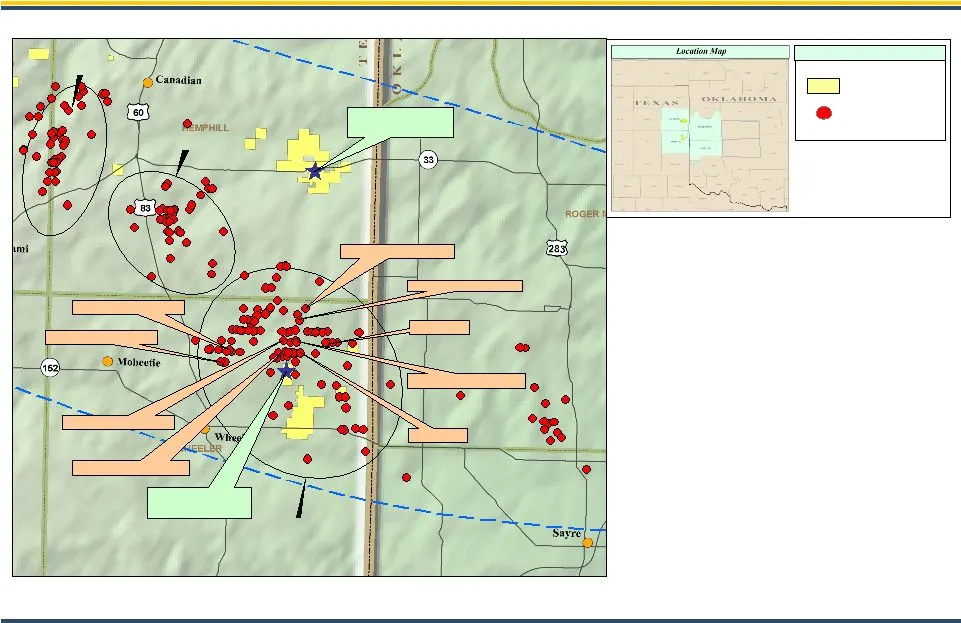
Slide 11: Granite Wash Horizontal Play
Granite Wash Horizontal Play Recent High-Rate Completions • PXP acreage position – 19,500 net acres • Expect to spud two horizontal tests 1Q 2010 • 58 Primary Granite Wash Locations (PXP WI 86%) • 50+ Additional Granite Wash Locations • Industry ROI 35% @ $5.00/mmbtu & $70/bbl • 2010 Plan - 14 wells
Slide 12: California
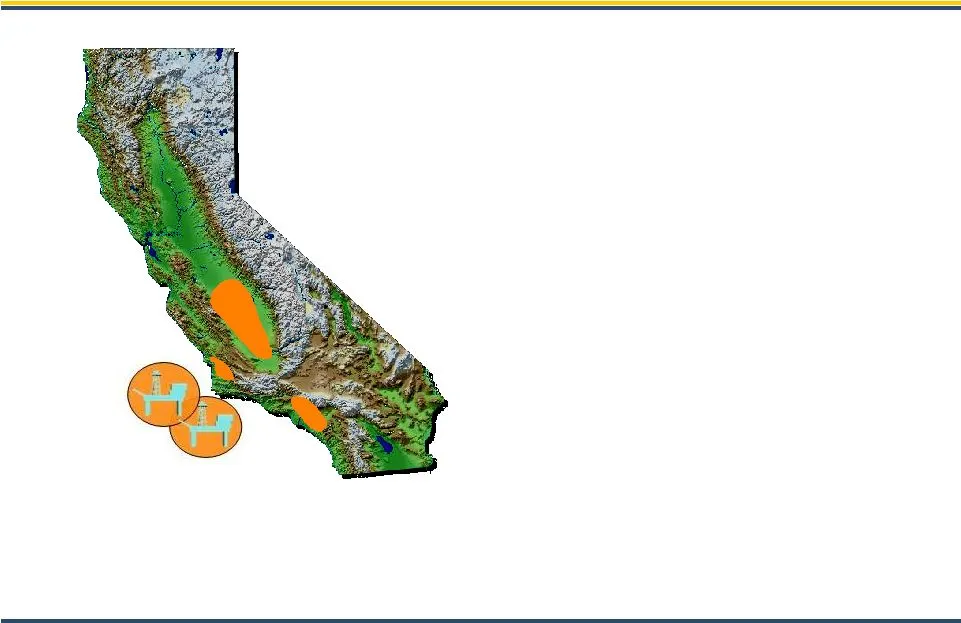
California Onshore/Offshore Los Angeles Basin Los Angeles Basin San Joaquin Valley San Joaquin Valley Arroyo Grande Arroyo Grande Pt Pedernales Pt Arguello • 215 MMBOE Net Proved Reserves • 275 MMBOE Net Resource Potential • 68% Proved Developed • 2009 Capex ~ $96 MM est. • 14 yr R/P • 2,500+ future
Slide 13: Diatomite/Non-Diatomite Onshore California
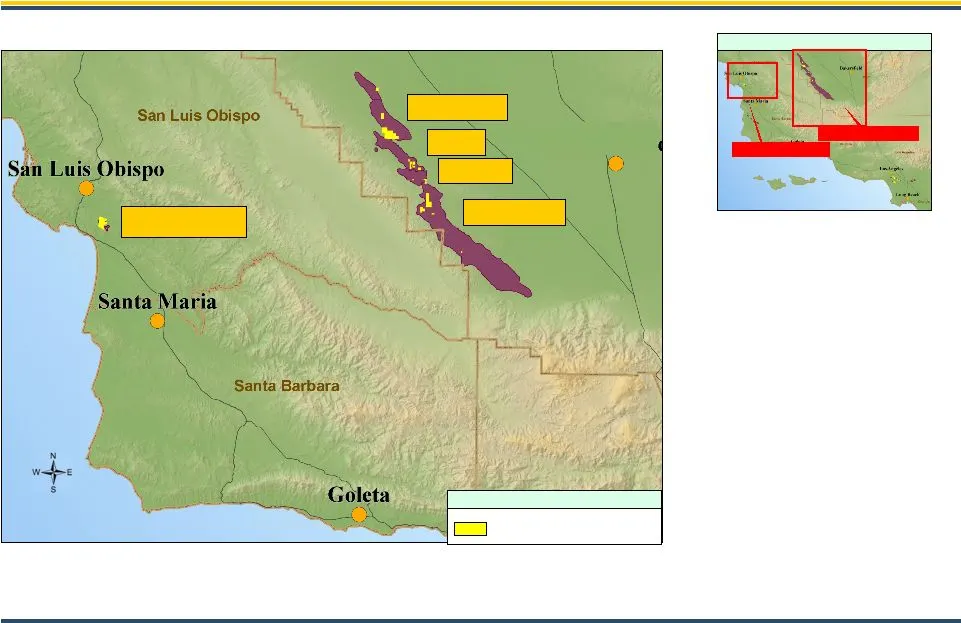
San Joaquin Valley Santa Maria Basin Projection: NAD 1927 CAL VII Location Map T:\California\Regional_CA\Graphics\ppt\\CA_Relief_maps.ppt Midway Sunset Cymric South Belridge McKittrick Legend PXP LEASES Diatomite/Non-Diatomite • Steam recovery • Development Resource ~ 165 MMBOE • Diatomite ~ 62 MMBO
Slide 14
Slide 15: Gulf of Mexico Exploration: Current Operations and Discoveries
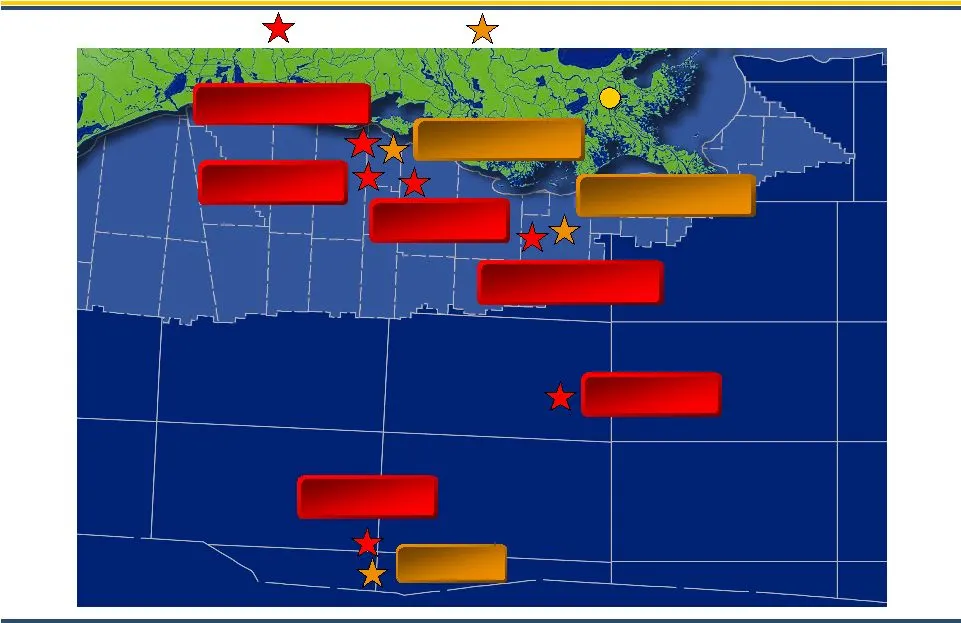
Davy Jones New Orleans Flatrock Field Blueberry Hill Blackbeard West Friesian Lucius John Paul Jones Phobos Blackbeard East Gulf of Mexico Exploration Current Operations and Discoveries Discoveries 2010-2011 Drilling
Slide 16: Gulf of Mexico – MMR Joint Venture
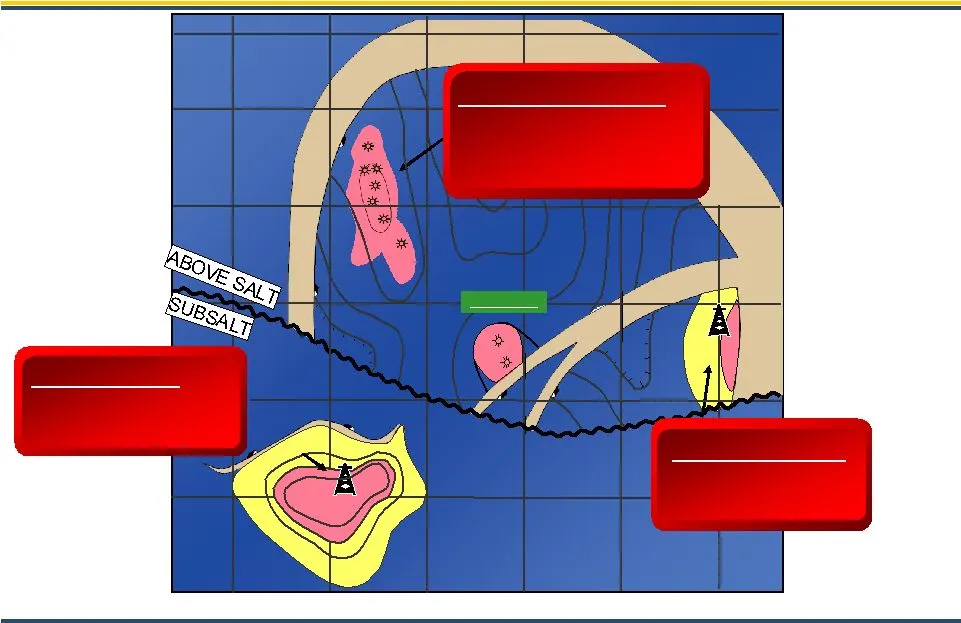
JB Mountain Davy Jones Miocene/Pre Miocene (2009) Drilling 28% WI / 22% NRI Flatrock Field Miocene Producing 220 MMcfd, 4750 bopd Net 7379 boepd 30% WI / 22% NRI Blueberry Hill Miocene (2009) Development 48% WI / 33% NRI Gulf of Mexico – MMR Joint Venture All other data as of October 31, 2009.
Slide 17: Friesian Project, Green Canyon Area, GOM
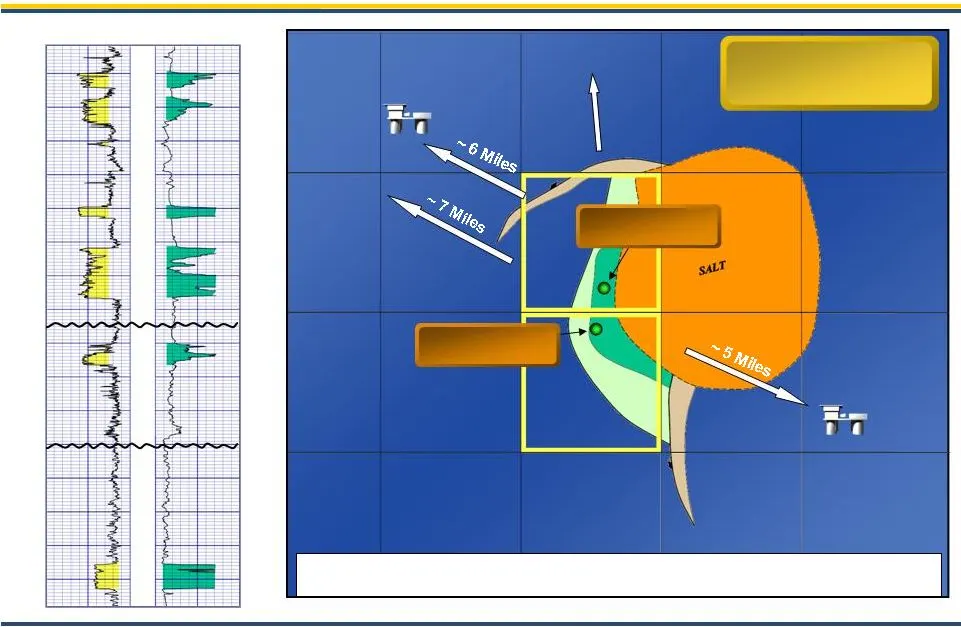
“Holstein” Friesian 2 Friesian 1 Potential Production Hub Tahiti Front Runner ~ 22 Miles Friesian Project Green Canyon Area, GOM Gross Reserve Potential Approx. 125-150 MMBOE Miocene Type Log Friesian
Slide 18: Lucius Project, Keathley Canyon Area, GOM
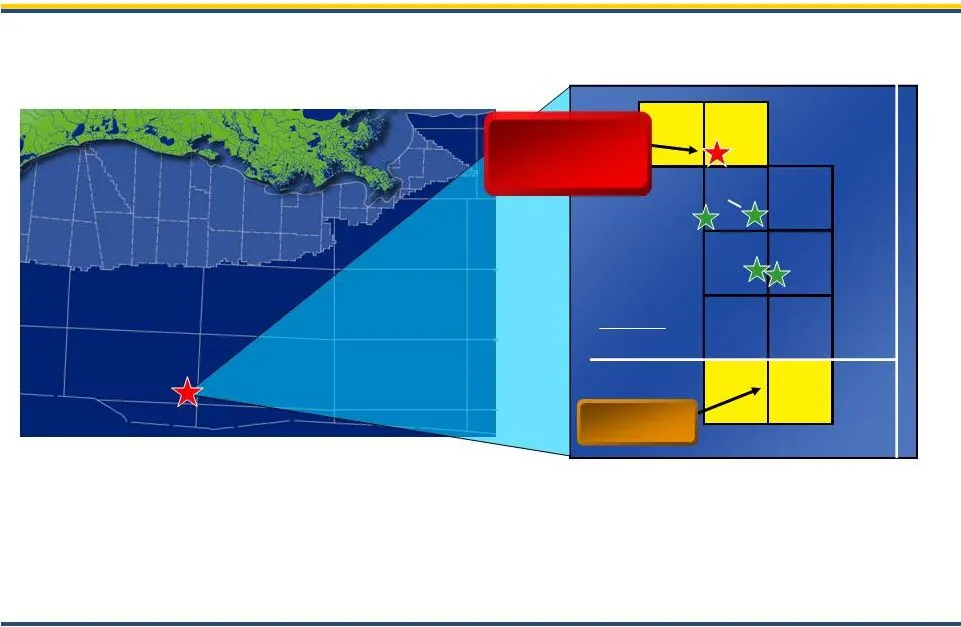
LOUISIANA Keathley Canyon Miles PHOBOS Prospect Lucius Discovery PXP WI 33% Lucius Project Keathley Canyon Area, GOM LOUISIANA 0 3 HADRIAN

Slide 19: +2.0 Billion BOE Resource Potential
950 MMBOE 275 MMBOE 100 MMBOE 110 MMBOE 10 MMBOE Haynesville California Panhandle/S. TX Gulf of Mexico Rockies 600 MMBOE Gulf of Mexico +2.0 Billion BOE Resource Potential Potential Reserves ~1.4 Billion BOE Development Resource Potential Region ~600 Million BOE Exploration Resource Potential Potent
Slide 20: Debt Maturity Profile: Strong Liquidity
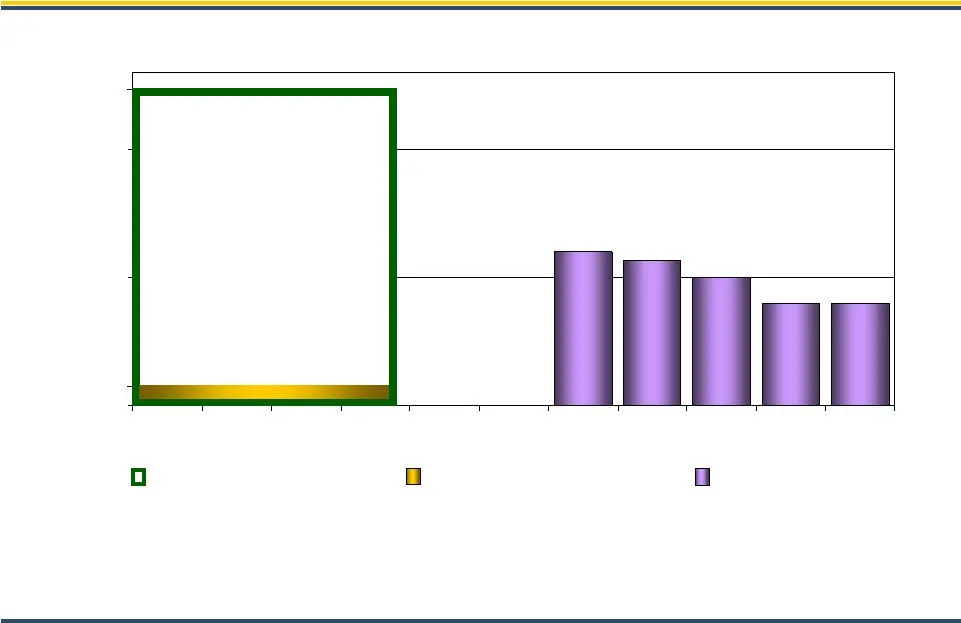
$1,220 $600 $400 $565 $400 $500 $0 $500 $1,000 Debt Maturity Profile Strong Liquidity With No Near Term Debt Maturities Revolver Availability Revolver Outstanding Senior Notes Millions $1,220 (1) As of September 30, 2009 the revolver had $75 million of borrowings and $1.3 million letters of credit o

Slide 21: PXP Targets Over Next Five Years
PXP Targets Over Next 5 Years • Double reserves of Company resulting in +20% average per year reserve growth from existing asset portfolio • Grow production 50% over the next 5 years • Efficiently manage business focusing on cost reduction and profitability • Maintain conservative balance sheet with

Slide 22: Addendum
Addendum

Slide 23: Continued Commodity Price Protection
Continued Commodity Price Protection Financial Settlement Derivatives Henry Hub $0.346 per MMBtu $10.00 Floor by $20.00 Ceiling 150,000 MMBtu Collars Oct – Dec 2009 WTI $3.38 per Bbl $55.00 Strike Price 32,500 Bbls Put Options Oct – Dec 2009 $0.034 per MMBtu $5.00 per Bbl AVERAGE DEFERRED PREMIUM IN

Slide 24: Income Statement Summary
87.3 - Legal Recovery (1.6) 4.4 Other Operating Income (Expense) $ 0.73 $ 0.30 Earnings Per Share - diluted $ 88.2 (2) $ 39.3 Net Income (1) $ 128.8 $ 72.6 Income Before Income Taxes $ 181.2 $ 74.8 Income From Operations (291.3) (105.3) DD&A & Accretion Expense (111.1) (36.4) General & Administrativ

Slide 25: Credit Suisse Energy Summit February 2010
Credit Suisse Energy Summit February 2010
Source: SEC EDGAR · 8-K filed Feb 3, 2010
More decks from Plains Exploration & Production Company
 Global Metals, Mining & Steel Conference 201333 slides · May 14, 2013
 Q1 2013 Earnings Presentation46 slides · Apr 19, 2013
 Merger or Acquisition (February 2013)35 slides · Feb 25, 2013
 2013 Credit Suisse Energy Summit10 slides · Feb 5, 2013
 Merger or Acquisition (January 2013)30 slides · Jan 17, 2013
 Credit Suisse 2012 Energy Summit32 slides · Feb 7, 2012