Atlantic Capital Bancshares Inc
Atlantic Capital Bancshares — Q4 2020 Earnings Presentation
36 slides from Atlantic Capital Bancshares's earnings presentation, Feb 19, 2021

Slide 1: Investor Presentation | Q4 2020
Investor Presentation | Q4 2020 atlanticcapitalbank.com NASDAQ TICKER: ACBI
Slide 2: Forward-Looking Statements Disclaimer and Non-GAAP Financial Information
atlanticcapitalbank.com Forward-Looking Statements Disclaimer and Non-GAAP Financial Information 2 This presentation contains forward-looking statements within the meaning of section 27A of the Securities Act of 1933, as amended, and 21E of the Securities Exchange Act of 1934, as amended (the “Excha
Slide 3: Our Company: We Fuel Prosperity
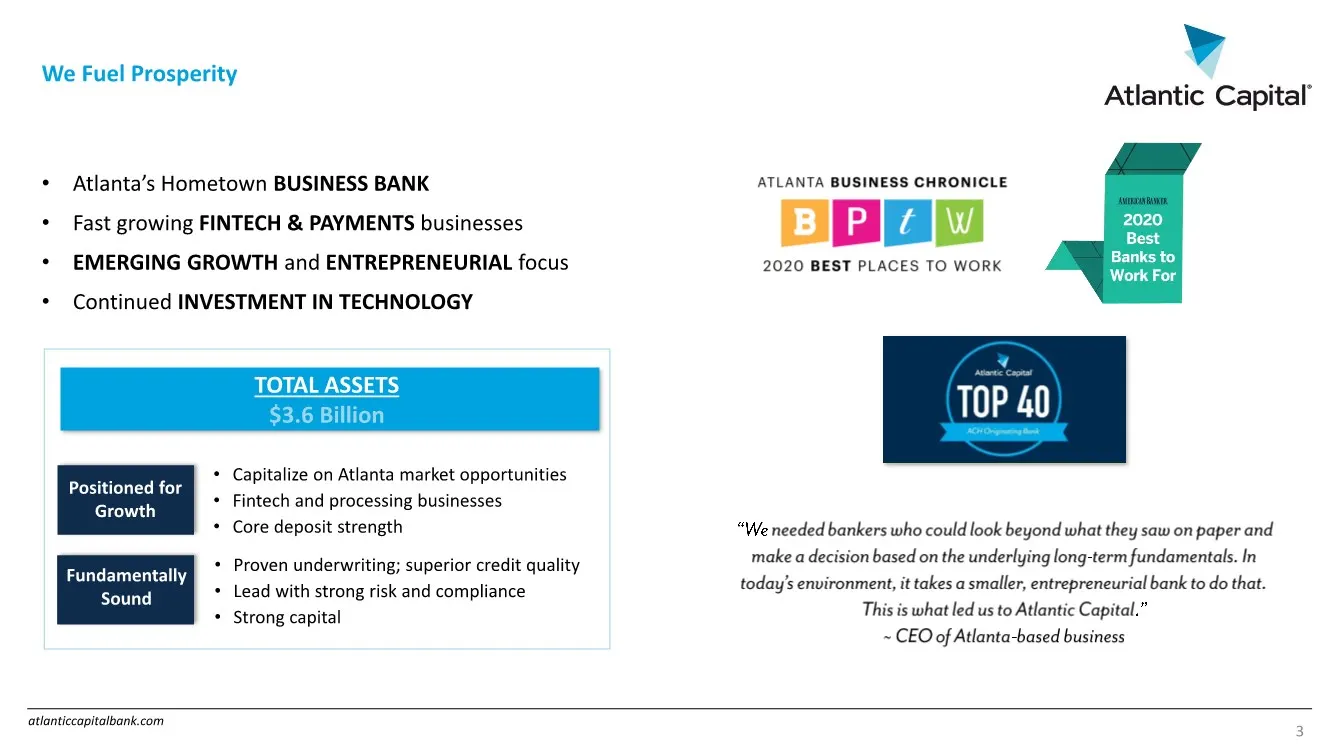
atlanticcapitalbank.com Atlantic Capital Our Company We Fuel Prosperity • Atlanta’s Hometown BUSINESS BANK • Fast growing FINTECH & PAYMENTS businesses • EMERGING GROWTH and ENTREPRENEURIAL focus • Continued INVESTMENT IN TECHNOLOGY 3 • Proven underwriting; superior credit quality • Lead with strong
Slide 4: Atlanta's Hometown Business Bank: Atlanta metro highlights
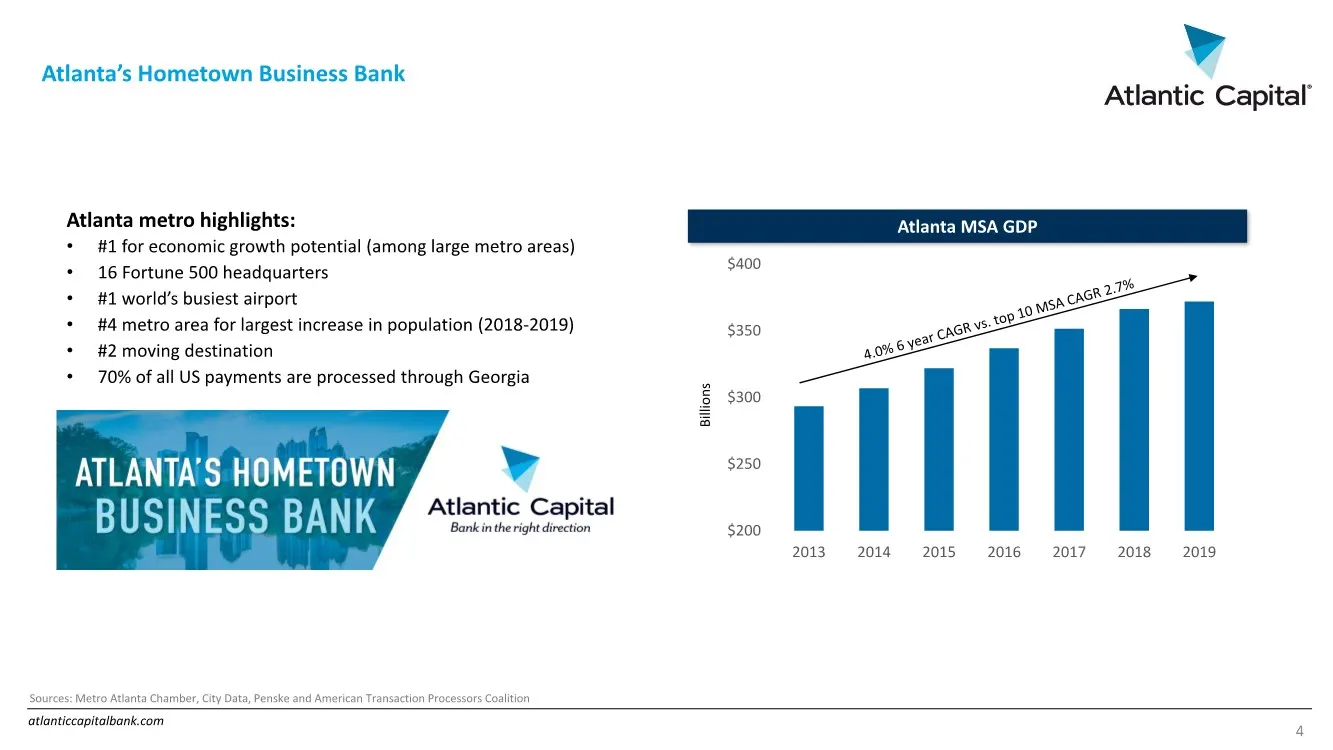
atlanticcapitalbank.com $200 $250 $300 $350 $400 2013 2014 2015 2016 2017 2018 2019 Atlanta’s Hometown Business Bank 4 Atlanta metro highlights: •#1 for economic growth potential (among large metro areas) • 16 Fortune 500 headquarters •#1 world’s busiest airport •#4 metro area for largest increase i
Slide 5: Atlanta's Hometown Business Bank
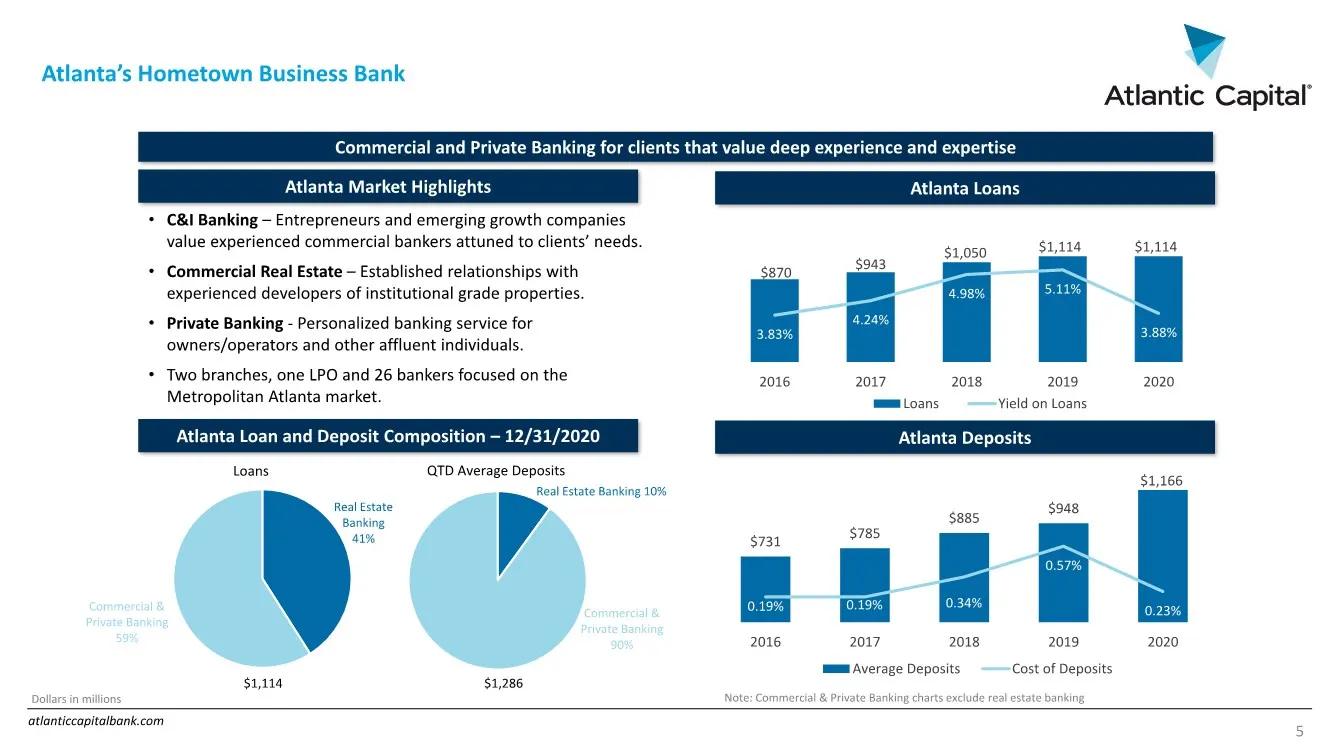
atlanticcapitalbank.com Atlanta’s Hometown Business Bank 5 • C&I Banking – Entrepreneurs and emerging growth companies value experienced commercial bankers attuned to clients’ needs. • Commercial Real Estate – Established relationships with experienced developers of institutional grade properties. •
Slide 6: Rapidly Growing Fintech & Payments Businesses
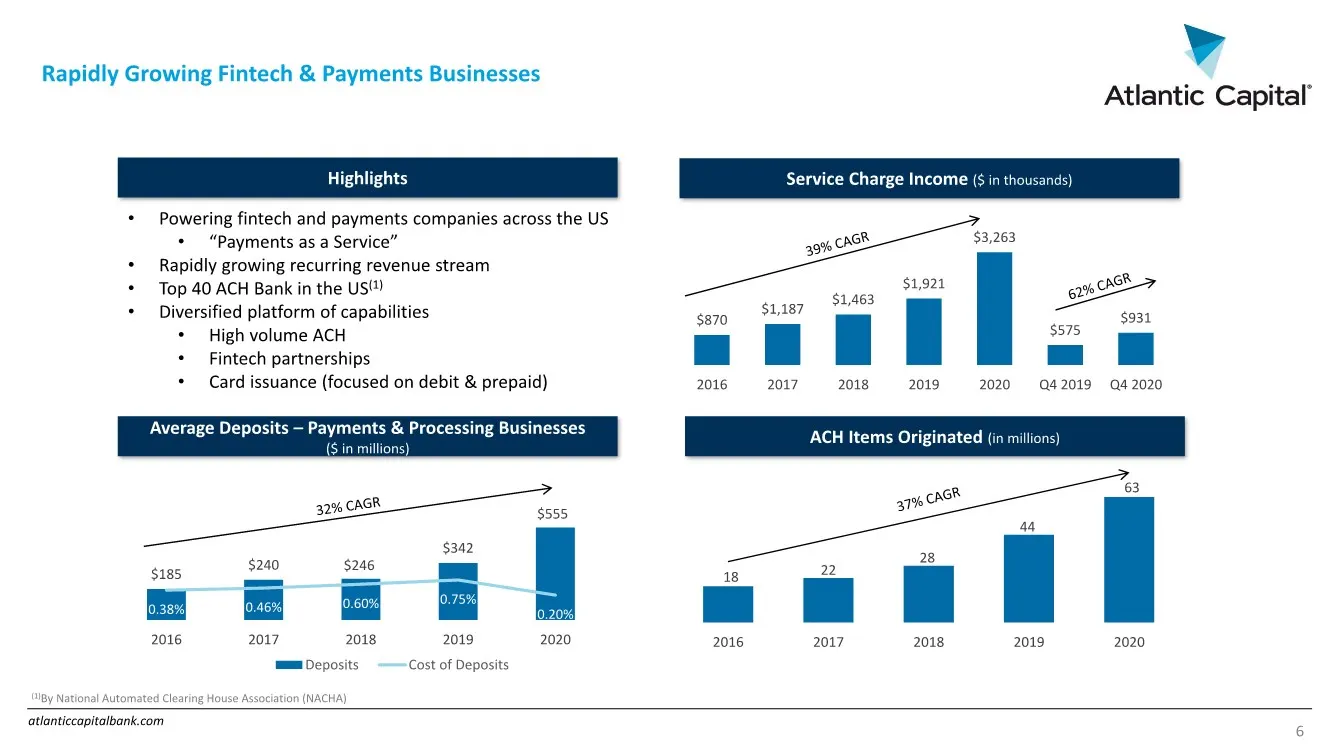
atlanticcapitalbank.com Rapidly Growing Fintech & Payments Businesses 6 • Powering fintech and payments companies across the US •“Payments as a Service” • Rapidly growing recurring revenue stream • Top 40 ACH Bank in the US(1) • Diversified platform of capabilities • High volume ACH • Fintech partne
Slide 7: Q4 2020 Overview
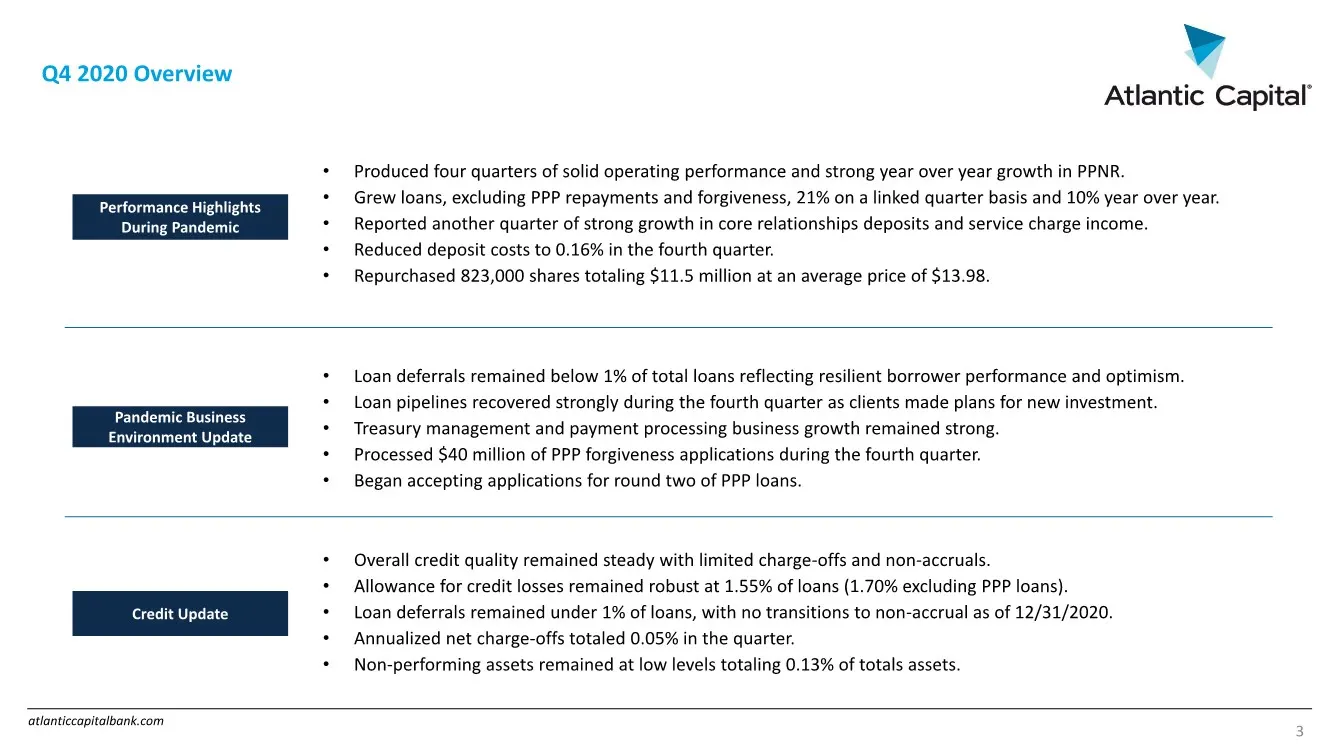
atlanticcapitalbank.com Q4 2020 Overview 3 Performance Highlights During Pandemic Pandemic Business Environment Update Credit Update • Produced four quarters of solid operating performance and strong year over year growth in PPNR. • Grew loans, excluding PPP repayments and forgiveness, 21% on a link
Slide 8: Financial Highlights
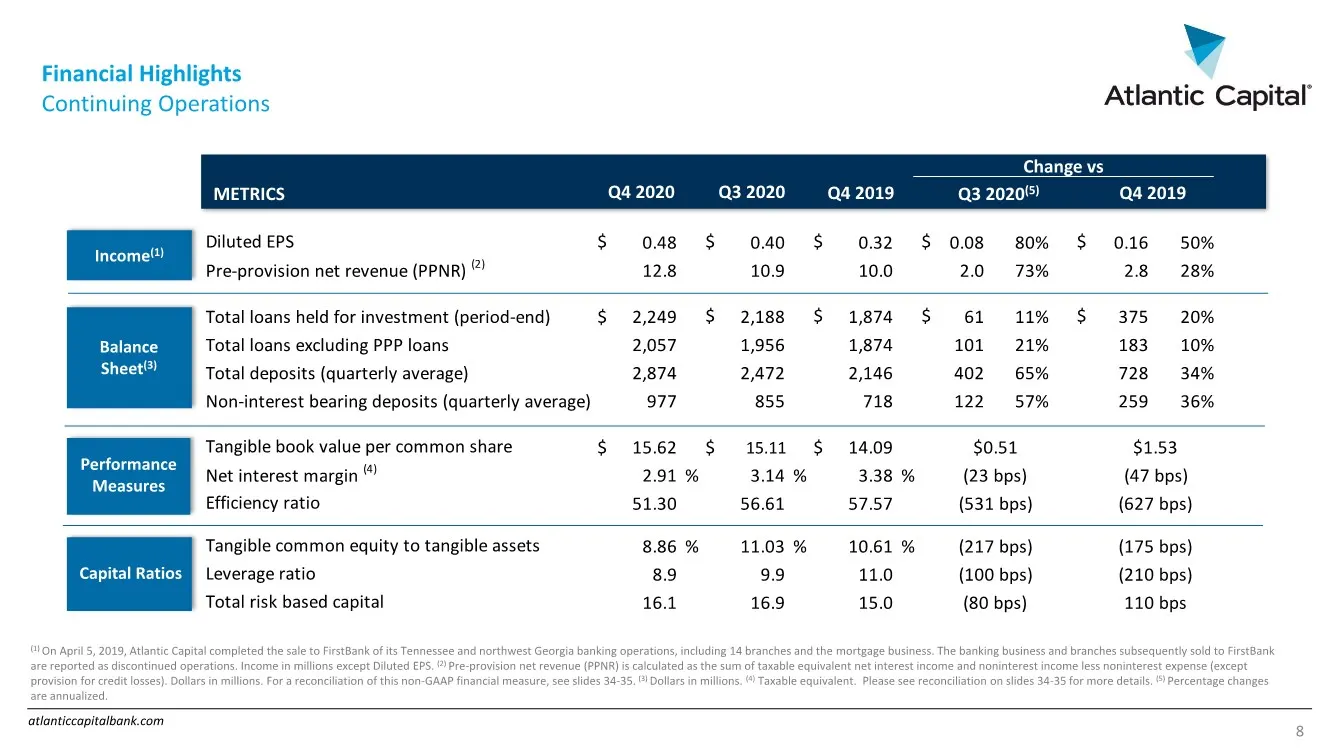
atlanticcapitalbank.com Financial Highlights Continuing Operations 8 (1) On April 5, 2019, Atlantic Capital completed the sale to FirstBank of its Tennessee and northwest Georgia banking operations, including 14 branches and the mortgage business. The banking business and branches subsequently sold
Slide 9: Summary of Loan Portfolio
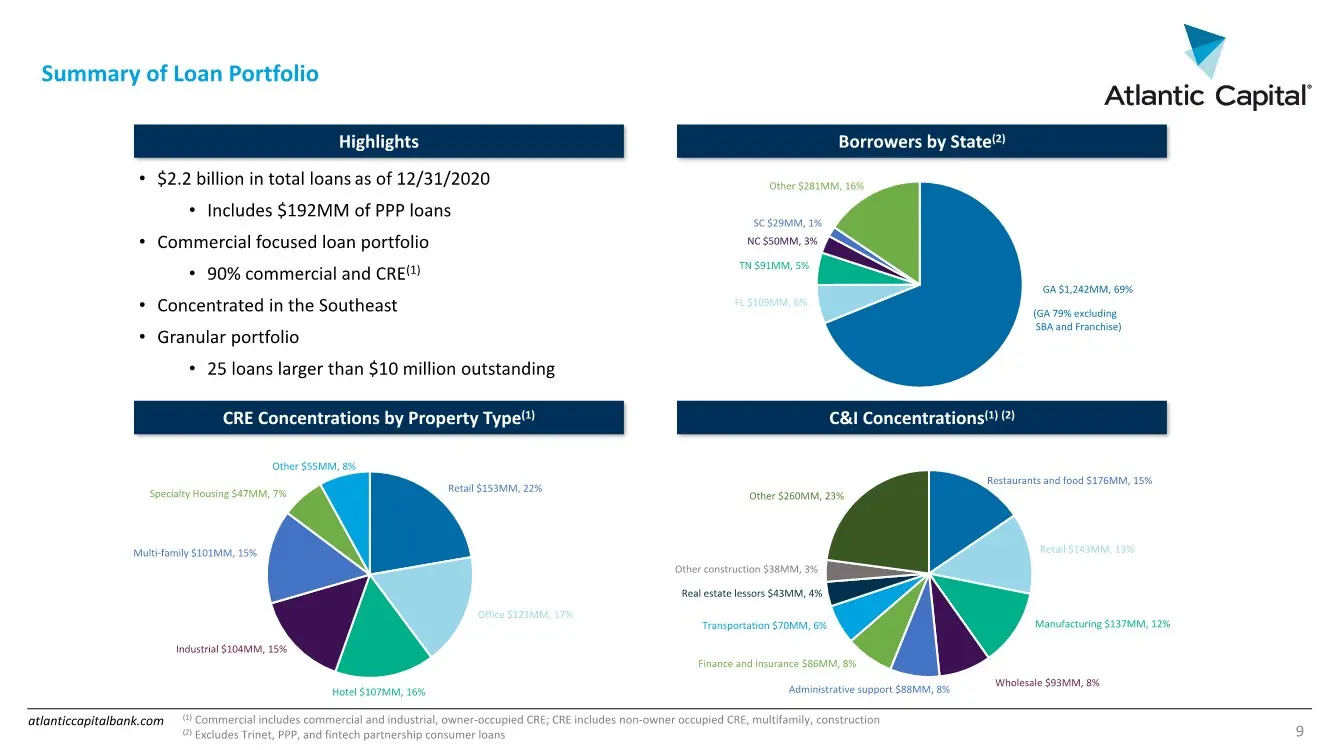
atlanticcapitalbank.com Summary of Loan Portfolio Borrowers by State(2) Highlights C&I Concentrations(1) (2) CRE Concentrations by Property Type(1) GA $1,242MM, 69% FL $109MM, 6% TN $91MM, 5% NC $50MM, 3% SC $29MM, 1% Other $281MM, 16% (GA 79% excluding SBA and Franchise) (1) Commercial includes com
Slide 10: Commercial Lending Focus
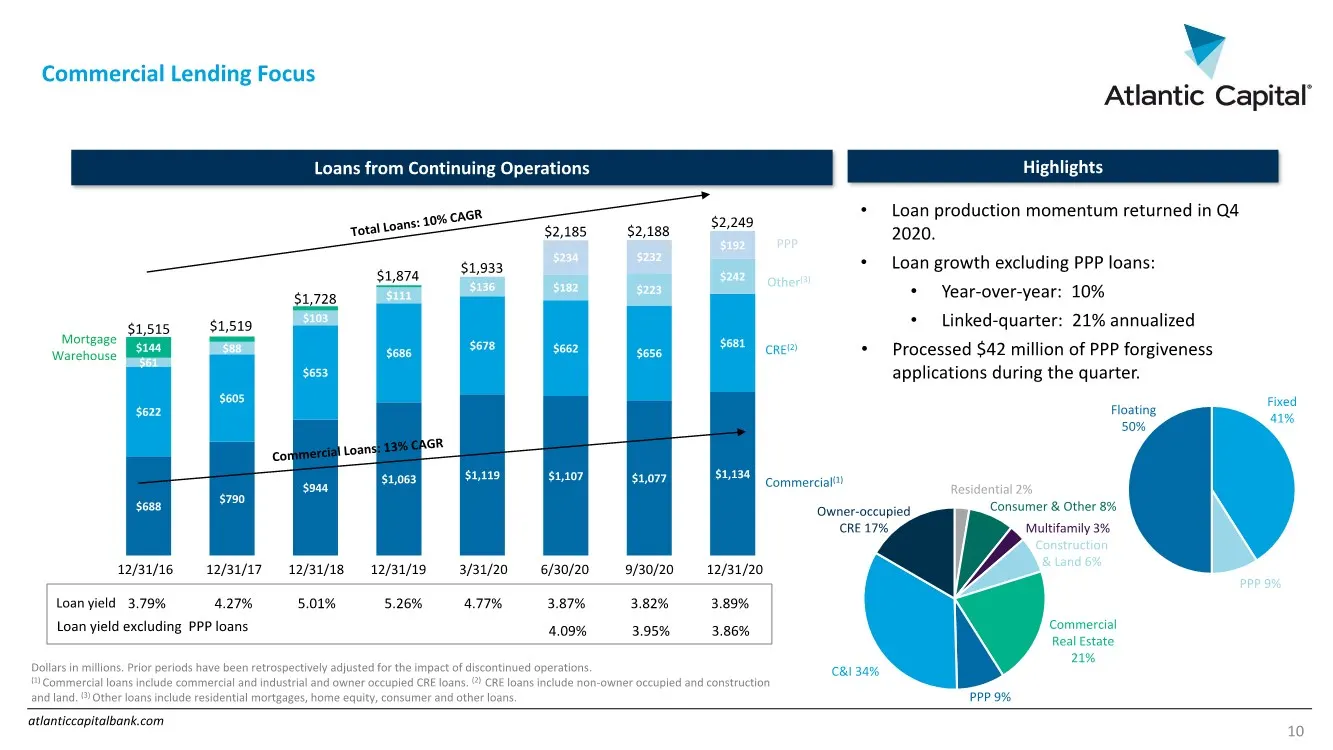
atlanticcapitalbank.com $688 $790 $944 $1,063 $1,119 $1,107 $1,077 $1,134 $622 $605 $653 $686 $678 $662 $656 $681 $61 $88 $103 $111 $136 $182 $223 $242 $144 $234 $232 $192 $1,519 Commercial Lending Focus 10 Loans from Continuing Operations Loan yield Residential 2% Construction & Land 6% Commercial
Slide 11: Strong Core Deposit Franchise
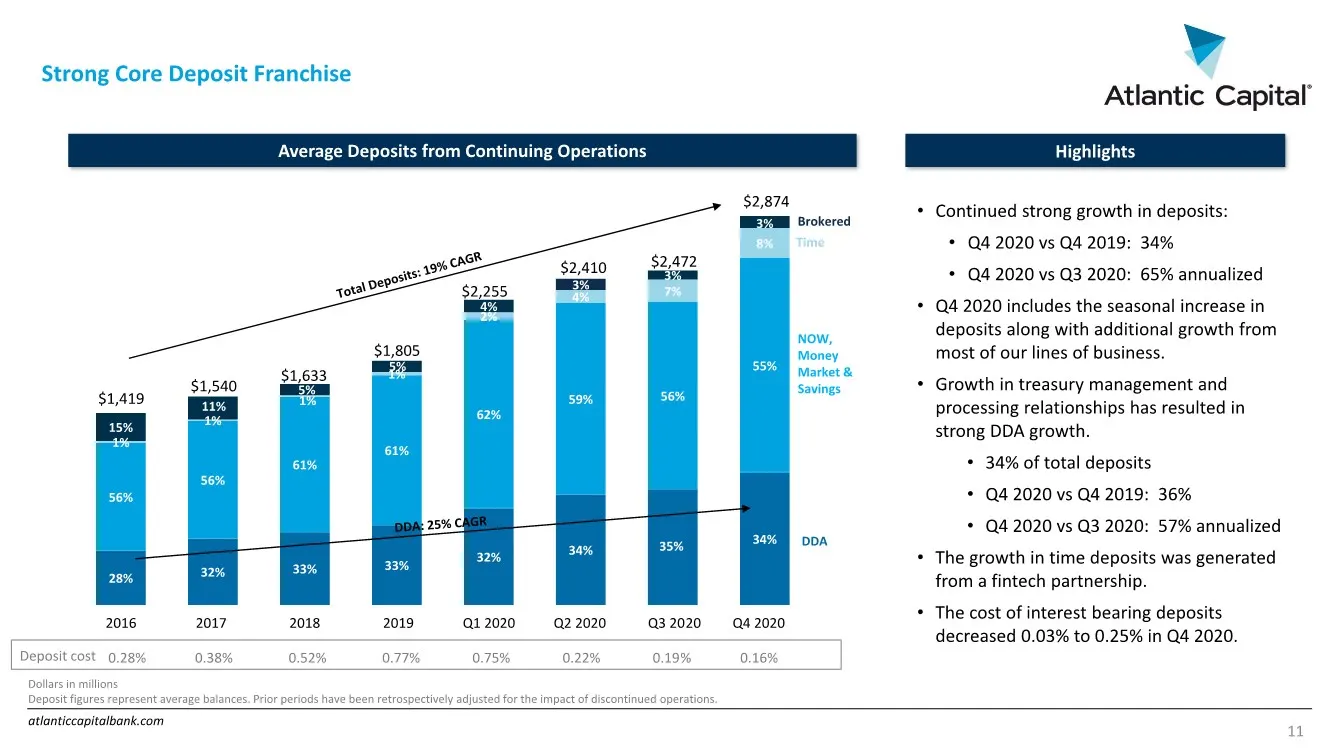
atlanticcapitalbank.com 28% 32% 33% 33% 32% 34% 35% 34% 56% 56% 61% 61% 62% 59% 56% 55% 1% 1% 1% 1% 2% 4% 7% 8% 15% 4% 3% 3% 3% 11% 5% Strong Core Deposit Franchise 11 Average Deposits from Continuing Operations Dollars in millions Deposit figures represent average balances. Prior periods have been
Slide 12: Financial Update: Q4 2020 Income Summary
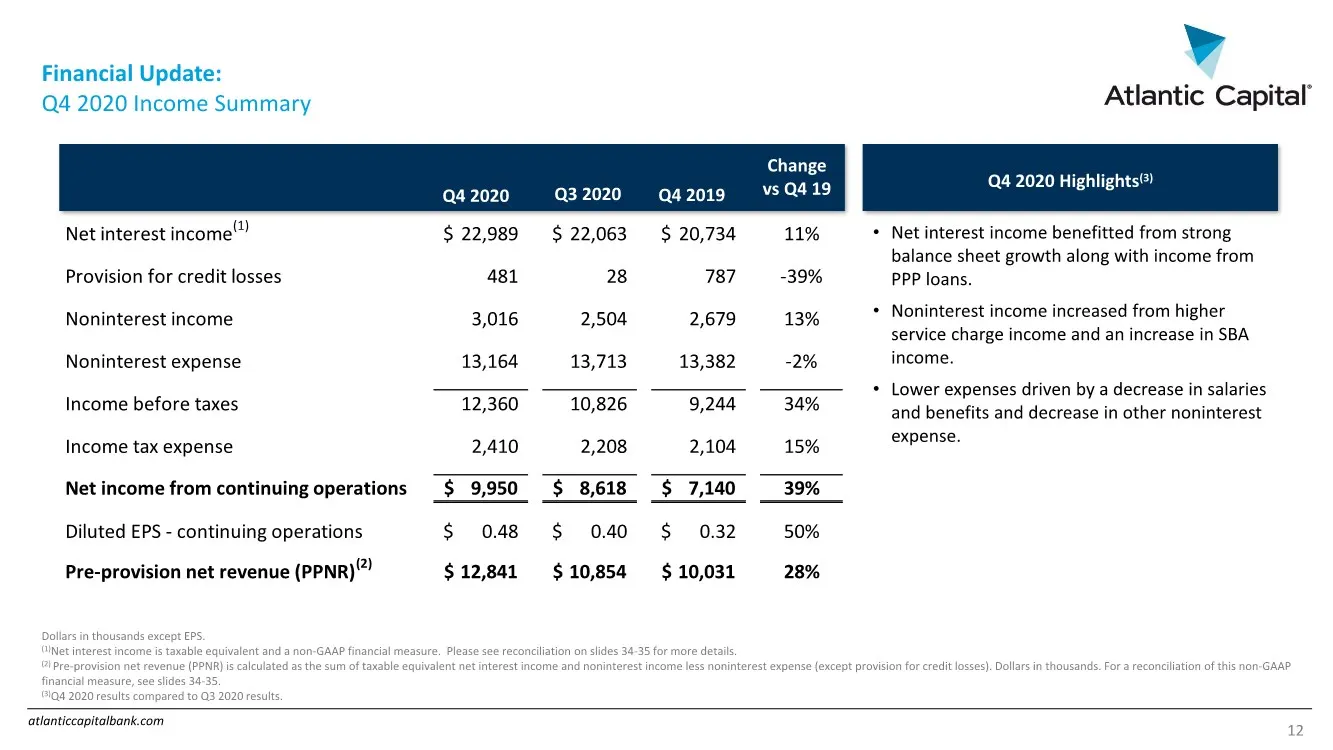
atlanticcapitalbank.com Net interest income(1) 22,989 $ 22,063 $ 20,734 $ 11% Provision for credit losses 481 28 787 -39% Noninterest income 3,016 2,504 2,679 13% Noninterest expense 13,164 13,713 13,382 -2% Income before taxes 12,360 10,826 9,244 34% Income tax expense 2,410 2,208 2,104 15% Net inc
Slide 13: Net Interest Margin
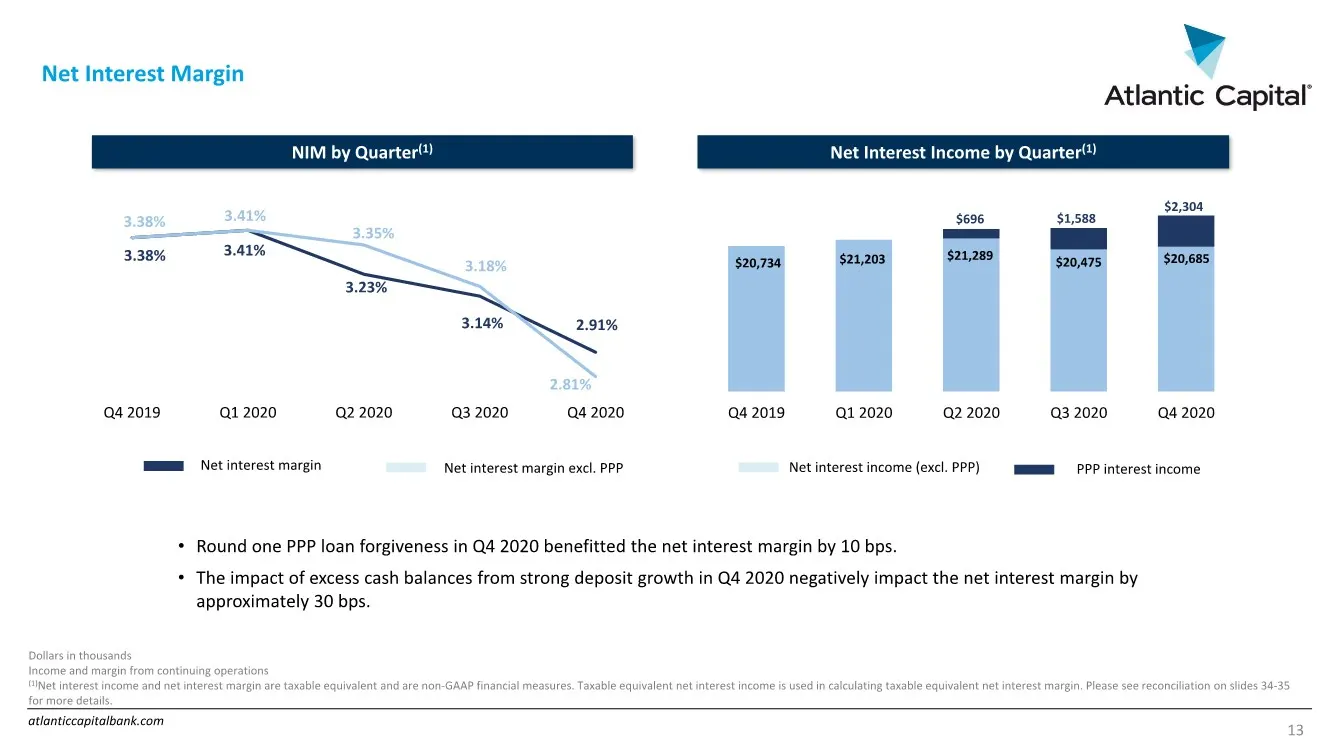
atlanticcapitalbank.com Net Interest Margin 13 NIM by Quarter(1) Net Interest Income by Quarter(1) Dollars in thousands Income and margin from continuing operations (1)Net interest income and net interest margin are taxable equivalent and are non-GAAP financial measures. Taxable equivalent net inter
Slide 14: Balance Sheet Liquidity
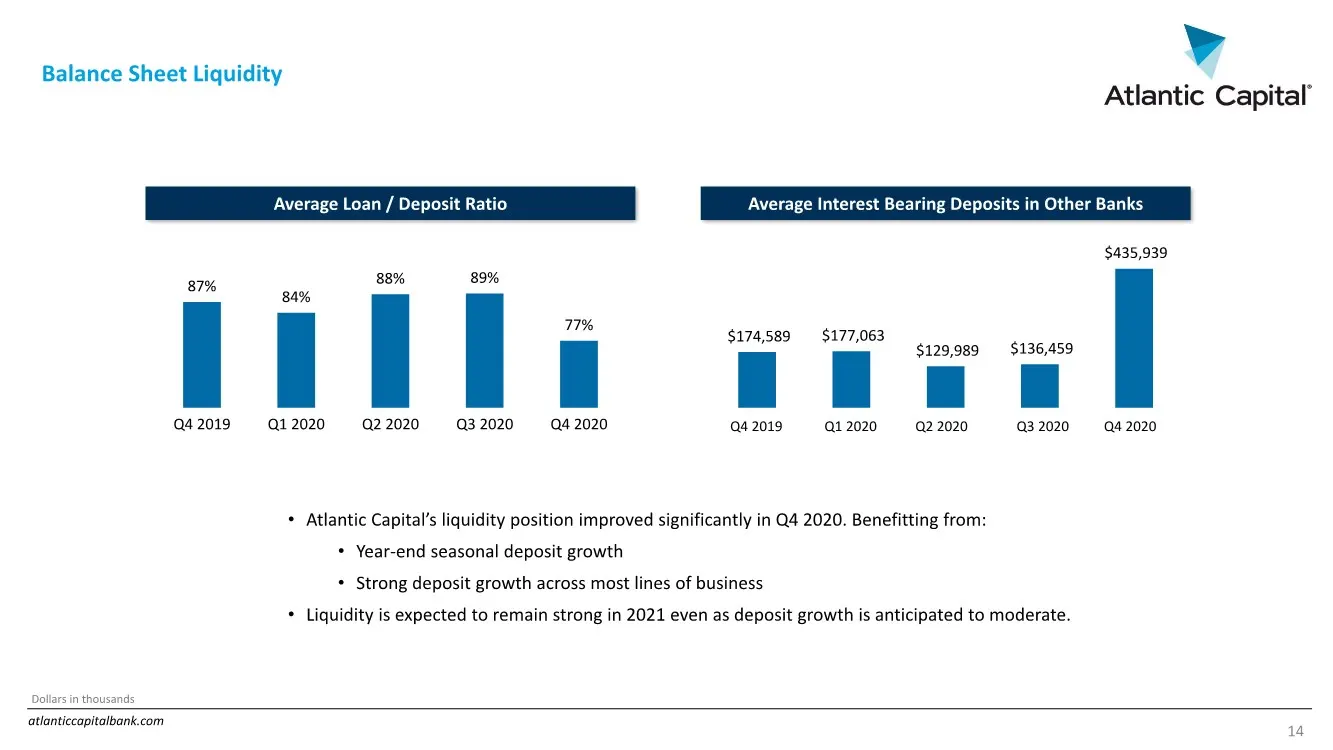
atlanticcapitalbank.com Balance Sheet Liquidity Average Loan / Deposit Ratio 87% 84% 88% 89% 77% Q4 2019 Q1 2020 Q2 2020 Q3 2020 Q4 2020 Average Interest Bearing Deposits in Other Banks $174,589 $177,063 $129,989 $136,459 $435,939 • Atlantic Capital’s liquidity position improved significantly in Q4
Slide 15: Paycheck Protection Program (PPP) Update
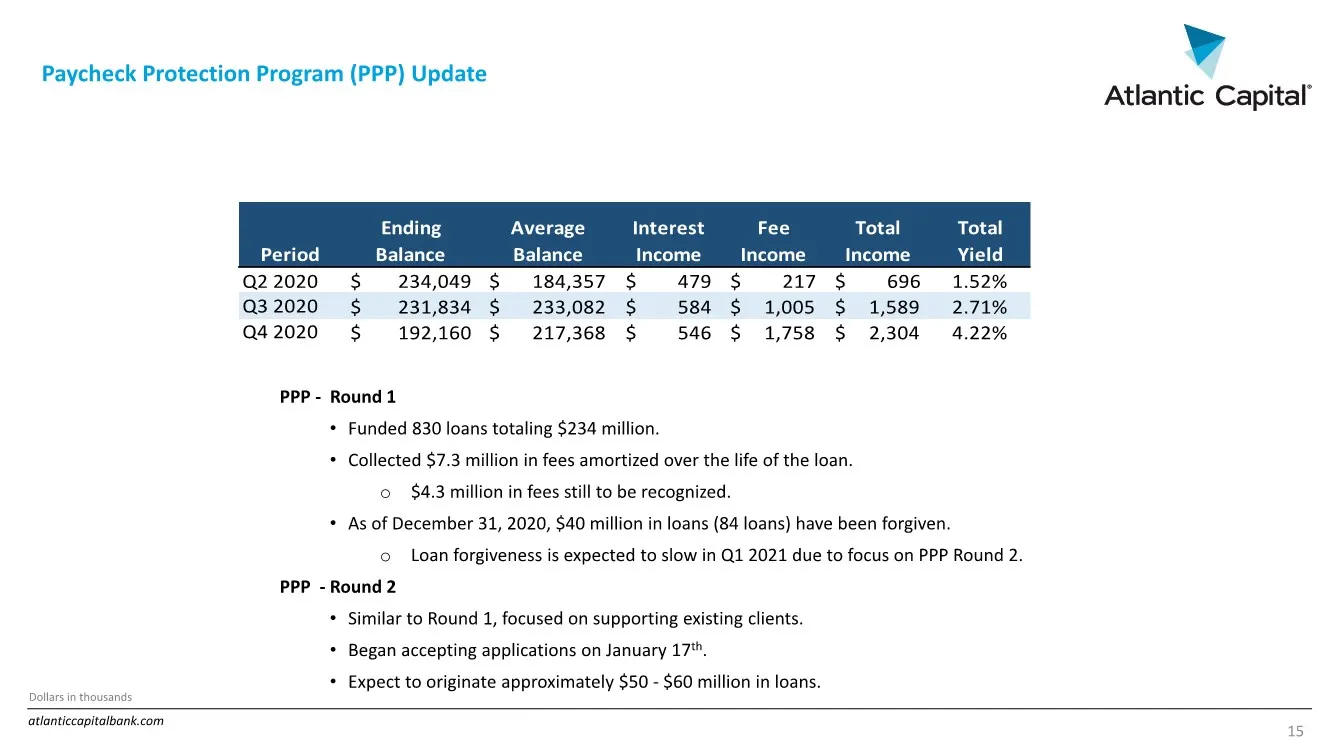
atlanticcapitalbank.com Paycheck Protection Program (PPP) Update 15 Dollars in thousands PPP - Round 1 • Funded 830 loans totaling $234 million. • Collected $7.3 million in fees amortized over the life of the loan. o $4.3 million in fees still to be recognized. • As of December 31, 2020, $40 million
Slide 16: 2021 Expectations: Disciplined Expense Management
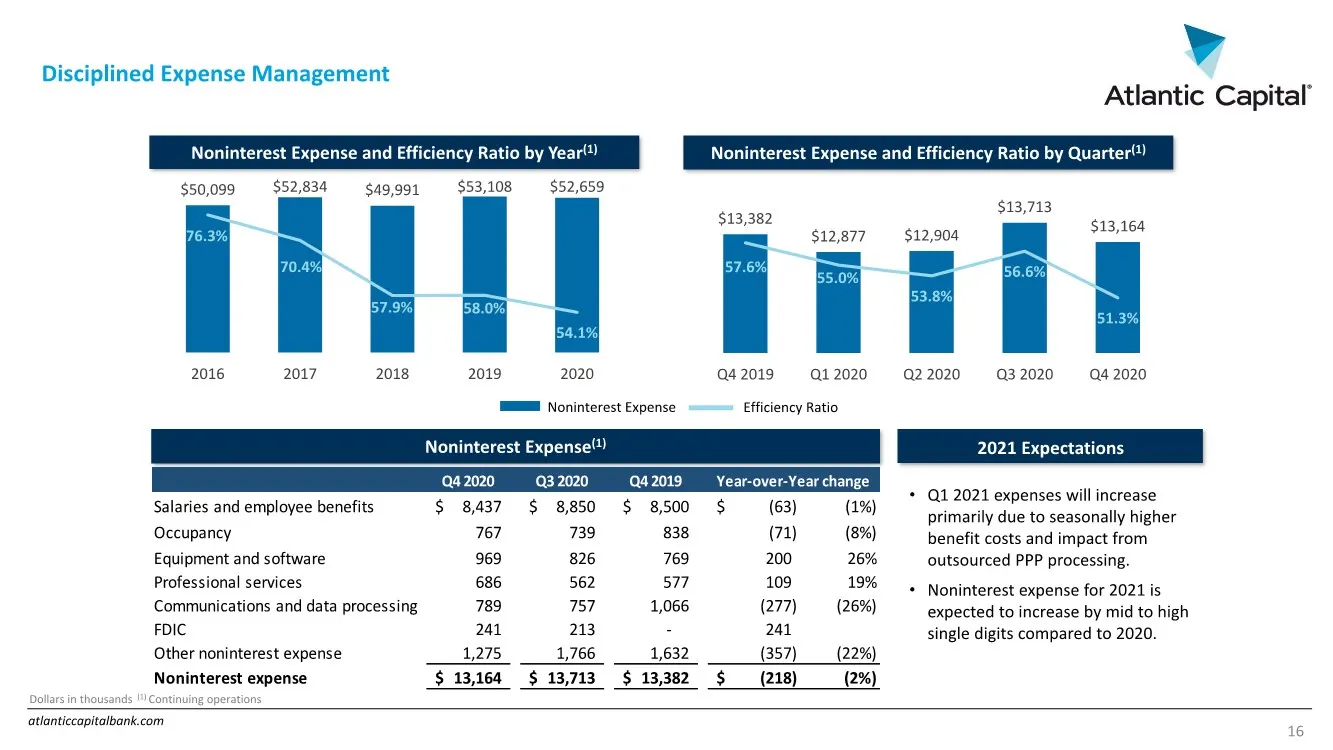
atlanticcapitalbank.com 2021 Expectations Disciplined Expense Management 16 Dollars in thousands (1) Continuing operations Noninterest Expense and Efficiency Ratio by Year(1) Noninterest Expense(1) Q4 2020 Q3 2020 Q4 2019 Salaries and employee benefits 8,437 $ 8,850 $ 8,500 $ (63) $ (1%) Occupancy 7
Slide 17: Strong Capital Position
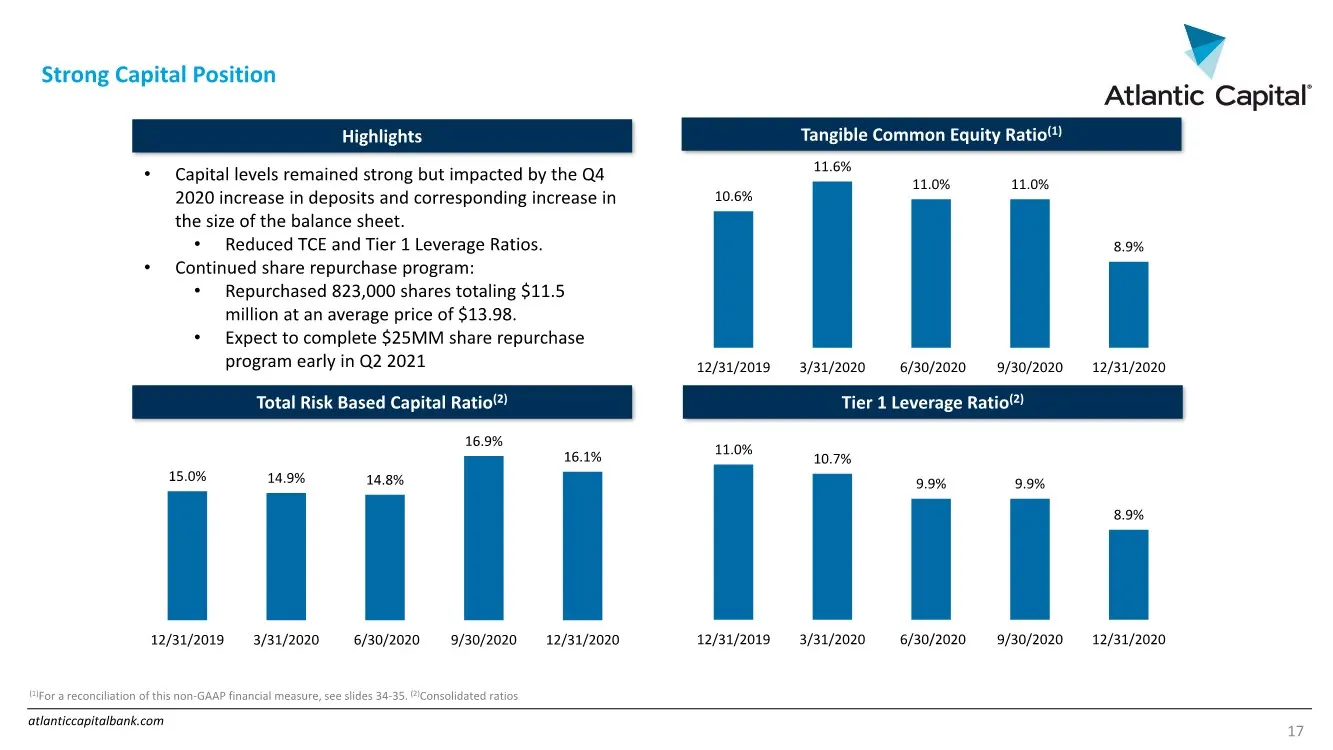
atlanticcapitalbank.com Strong Capital Position 17 15.0% 14.9% 14.8% 16.9% 16.1% 12/31/2019 3/31/2020 6/30/2020 9/30/2020 12/31/2020 Total Risk Based Capital Ratio(2) Tangible Common Equity Ratio(1) (1)For a reconciliation of this non-GAAP financial measure, see slides 34-35. (2)Consolidated ratios
Slide 18: Strong Historical Credit Quality
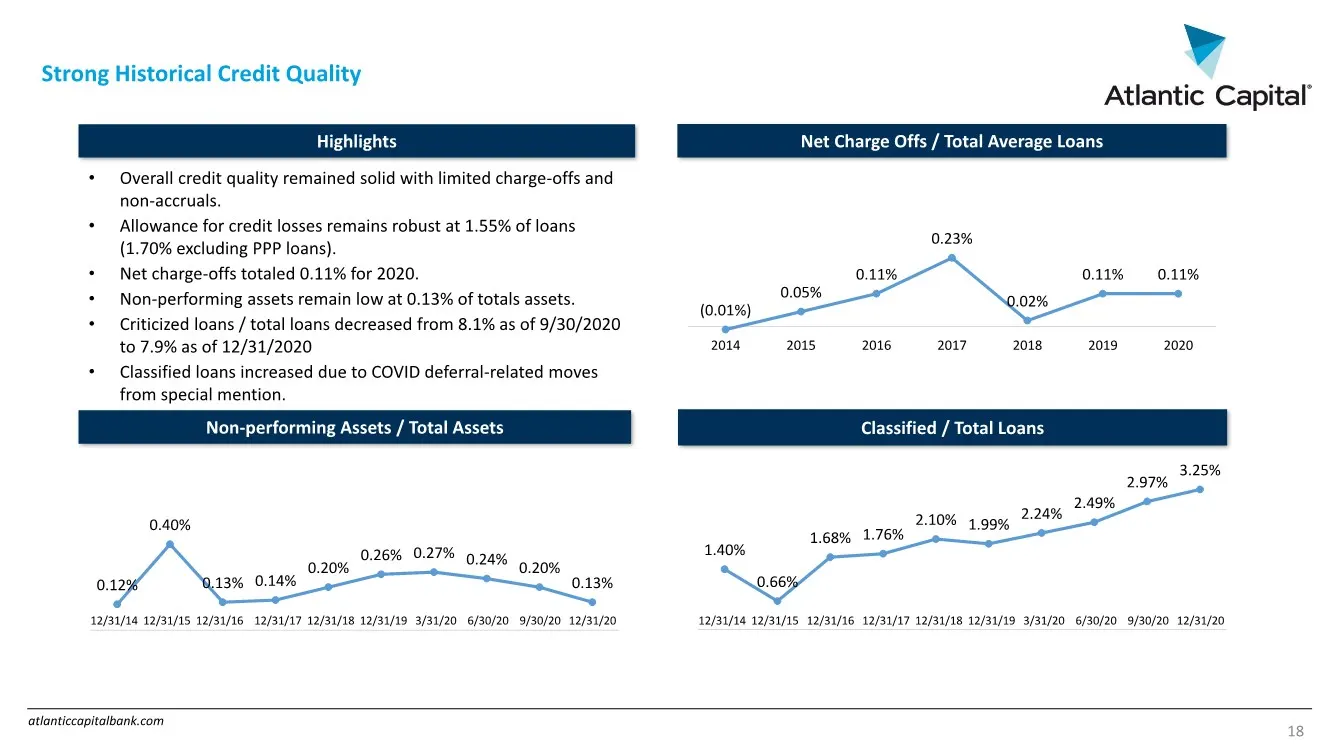
atlanticcapitalbank.com Strong Historical Credit Quality Non-performing Assets / Total Assets Net Charge Offs / Total Average Loans (0.01%) 0.05% 0.11% 0.23% 0.02% 0.11% 0.11% 2014 2015 2016 2017 2018 2019 2020 0.12% 0.40% 0.13% 0.14% 0.20% 0.26% 0.27% 0.24% 0.20% 0.13% 18 Highlights Classified / To
Slide 19: Current Expected Credit Losses (CECL)
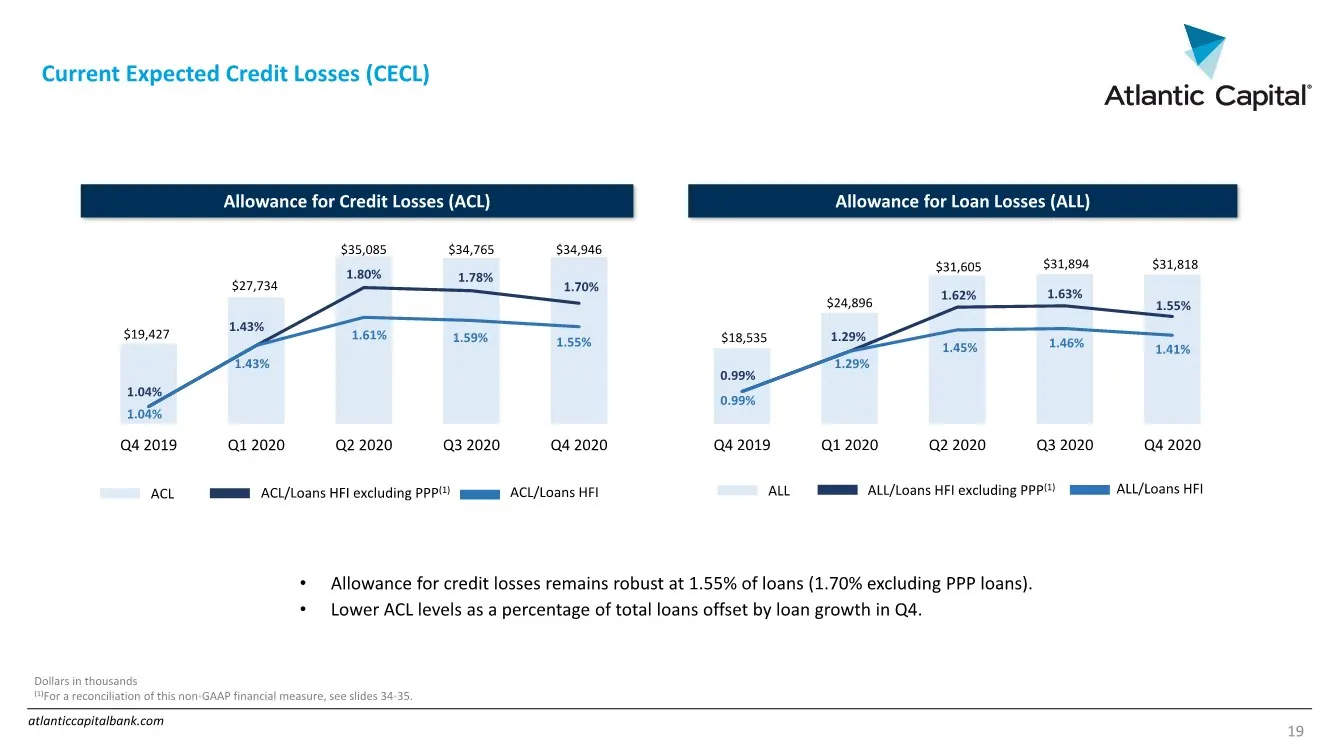
atlanticcapitalbank.com Current Expected Credit Losses (CECL) Allowance for Credit Losses (ACL) Allowance for Loan Losses (ALL) 19 • Allowance for credit losses remains robust at 1.55% of loans (1.70% excluding PPP loans). • Lower ACL levels as a percentage of total loans offset by loan growth in Q4
Slide 20: Borrower Assistance - Deferrals
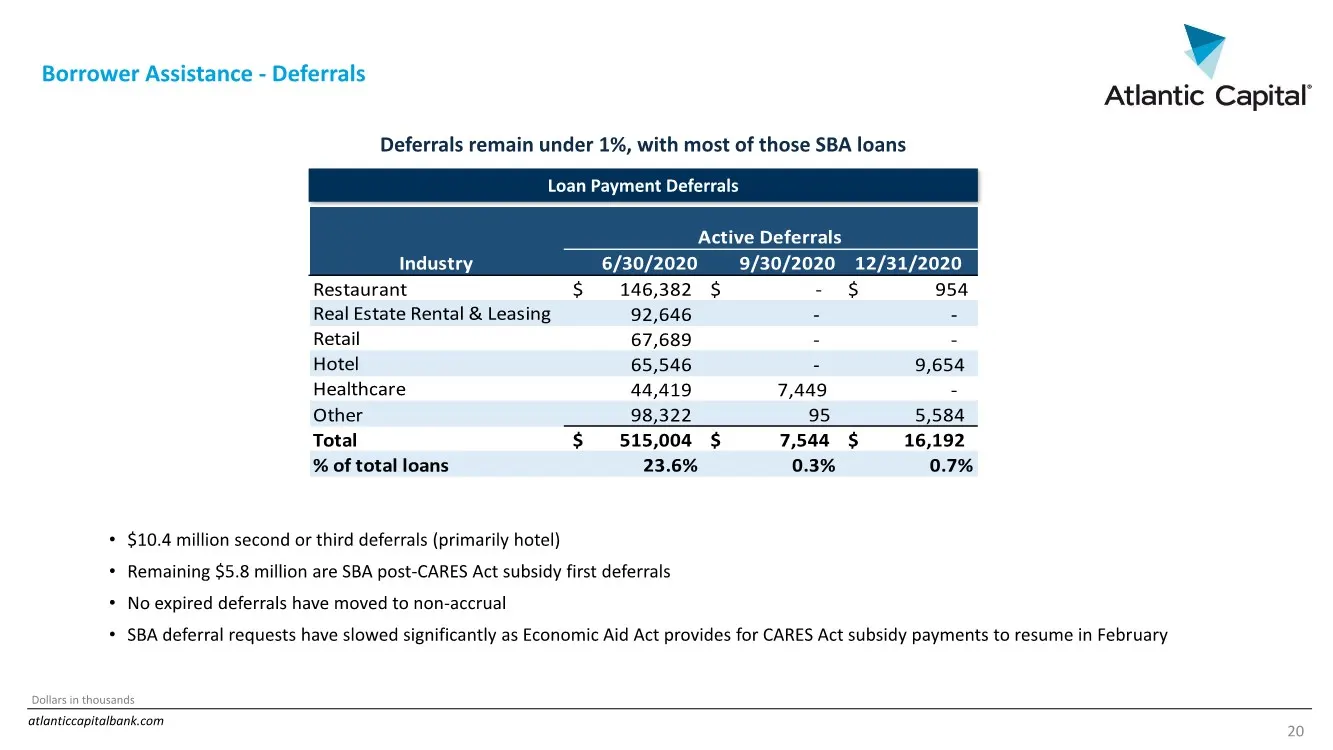
atlanticcapitalbank.com Borrower Assistance - Deferrals 20 Dollars in thousands Deferrals remain under 1%, with most of those SBA loans Loan Payment Deferrals Industry 6/30/2020 9/30/2020 12/31/2020 Restaurant $ 146,382 $ - $ 954 Real Estate Rental & Leasing 92,646 - - Retail 67,689 - - Hotel 65,546
Slide 21: COVID-Sensitive Industries
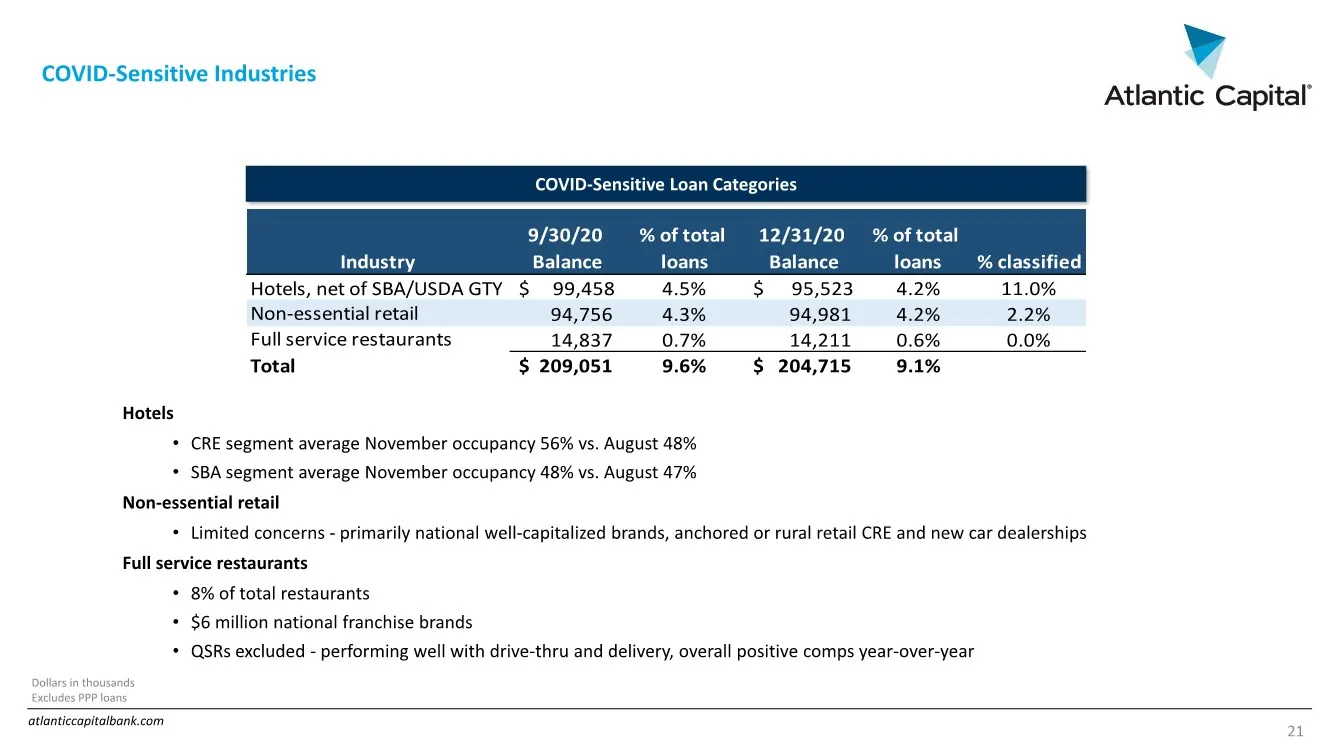
atlanticcapitalbank.com COVID-Sensitive Industries 21 Dollars in thousands Excludes PPP loans Industry 9/30/20 Balance % of total loans 12/31/20 Balance % of total loans % classified Hotels, net of SBA/USDA GTY $ 99,458 4.5% $ 95,523 4.2% 11.0% Non-essential retail 94,756 4.3% 94,981 4.2% 2.2% Full
Slide 22: Appendix
v Atlantic Capital’ Appendix
Slide 23: Management Biographies
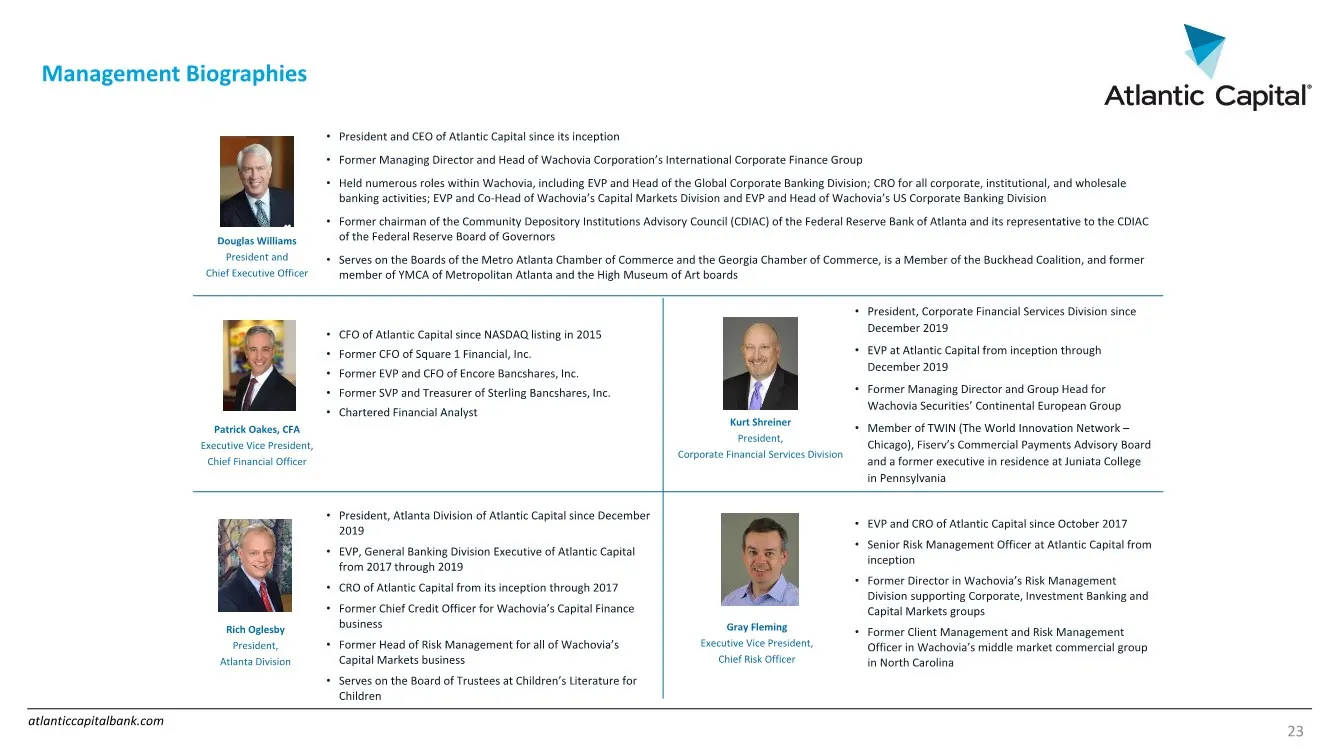
atlanticcapitalbank.com Management Biographies 23 Douglas Williams President and Chief Executive Officer • President and CEO of Atlantic Capital since its inception • Former Managing Director and Head of Wachovia Corporation’s International Corporate Finance Group • Held numerous roles within Wachov
Slide 24: Investment Portfolio
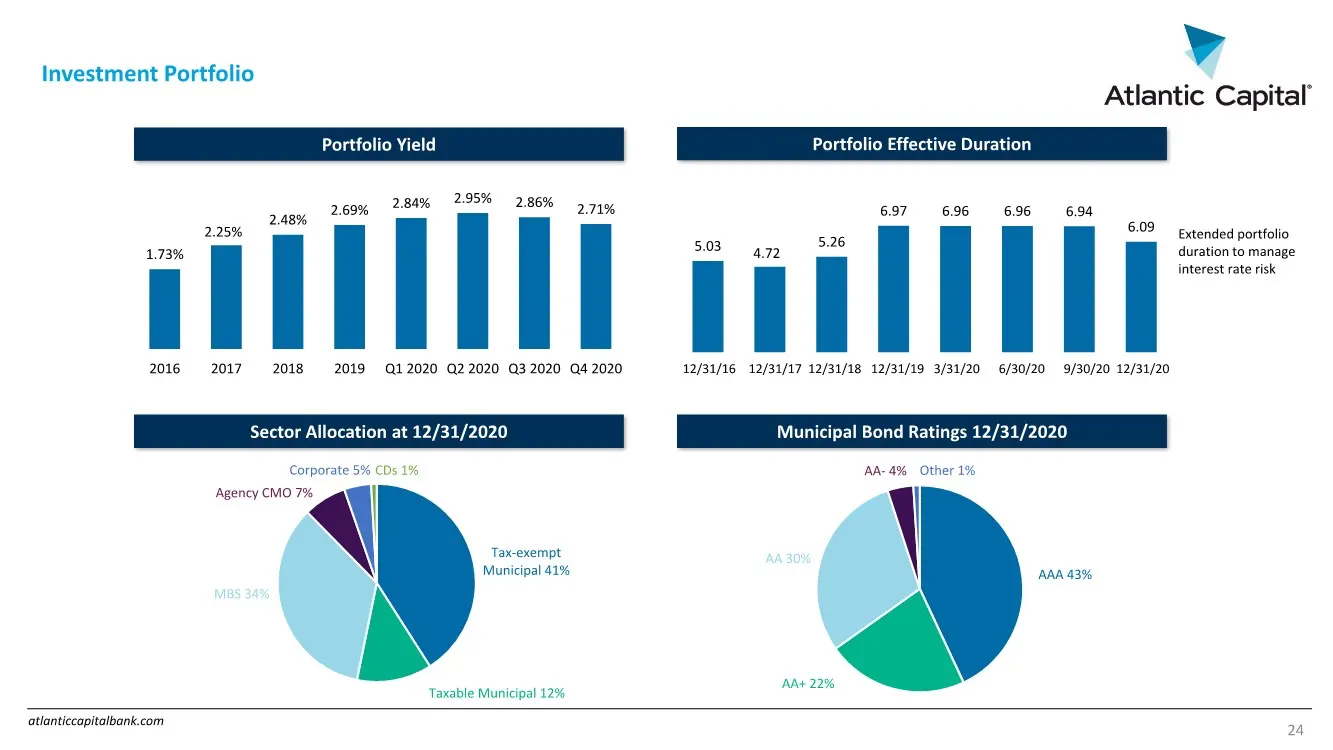
atlanticcapitalbank.com Investment Portfolio Portfolio Yield Tax-exempt Municipal 41% Taxable Municipal 12% MBS 34% Agency CMO 7% Corporate 5% CDs 1% Sector Allocation at 12/31/2020 1.73% 2.25% 2.48% 2.69% 2.84% 2.95% 2.86% 2.71% 2016 2017 2018 2019 Q1 2020 Q2 2020 Q3 2020 Q4 2020 Municipal Bond Rat
Slide 25: Loan Portfolio by Risk Rating
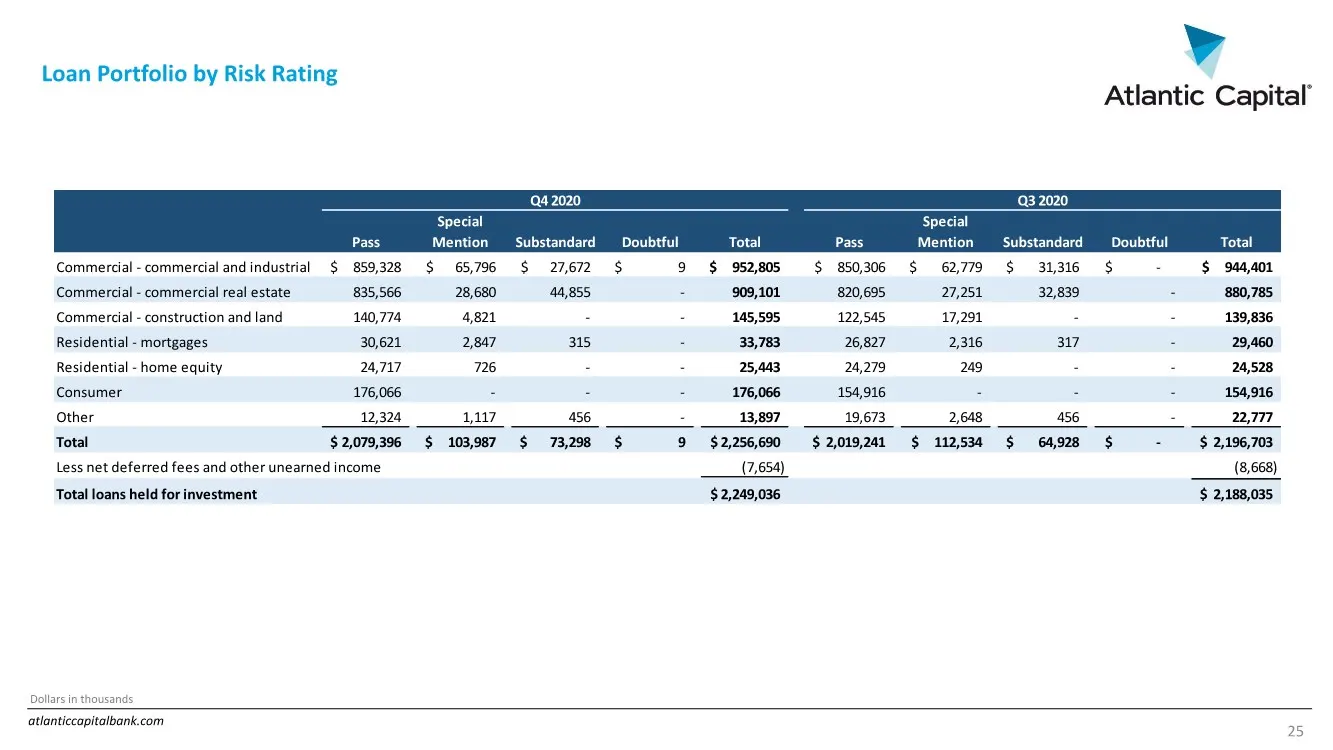
atlanticcapitalbank.com Loan Portfolio by Risk Rating 25 Dollars in thousands Pass Special Mention Substandard Doubtful Total Pass Special Mention Substandard Doubtful Total Commercial - commercial and industrial 859,328 $ 65,796 $ 27,672 $ 9 $ 952,805 $ 850,306 $ 62,779 $ 31,316 $ - $ 944,401 $ Com
Slide 26: Hotel Portfolio
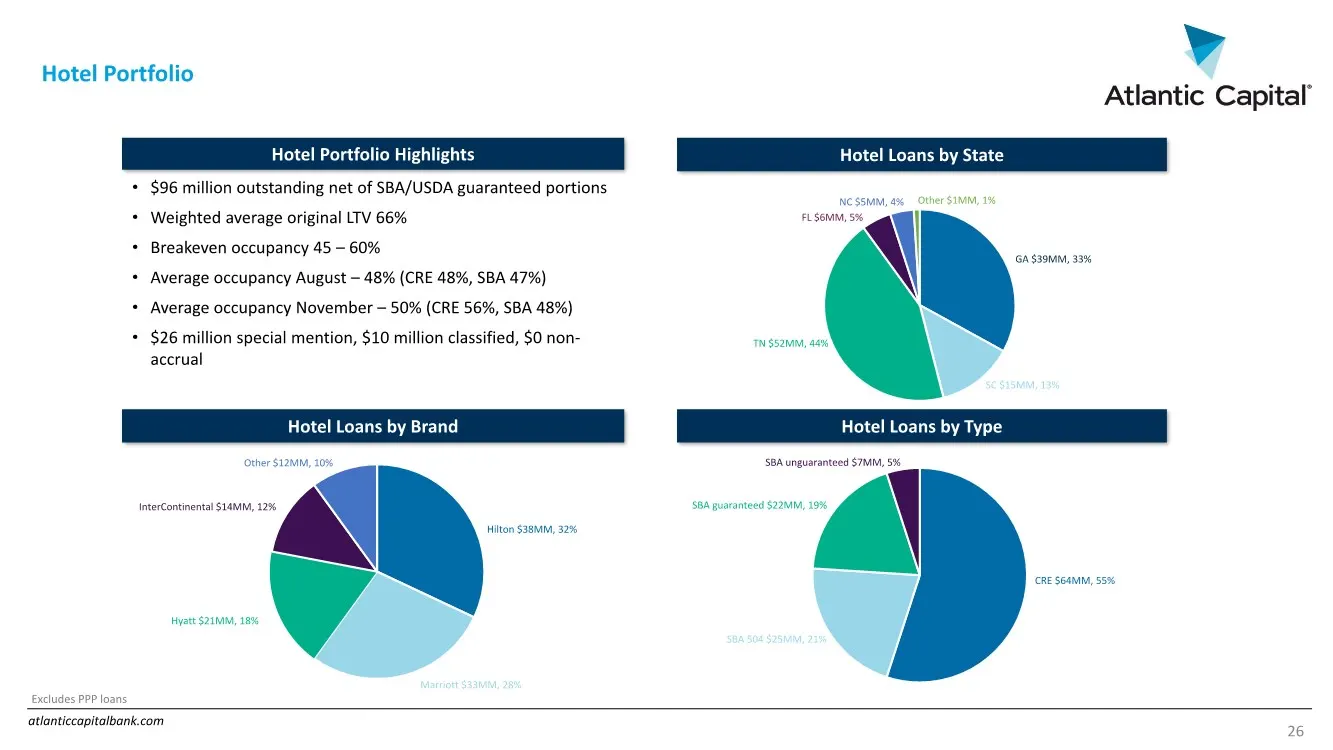
atlanticcapitalbank.com Hotel Portfolio • $96 million outstanding net of SBA/USDA guaranteed portions • Weighted average original LTV 66% • Breakeven occupancy 45 – 60% • Average occupancy August – 48% (CRE 48%, SBA 47%) • Average occupancy November – 50% (CRE 56%, SBA 48%) • $26 million special men
Slide 27: Restaurant Portfolio
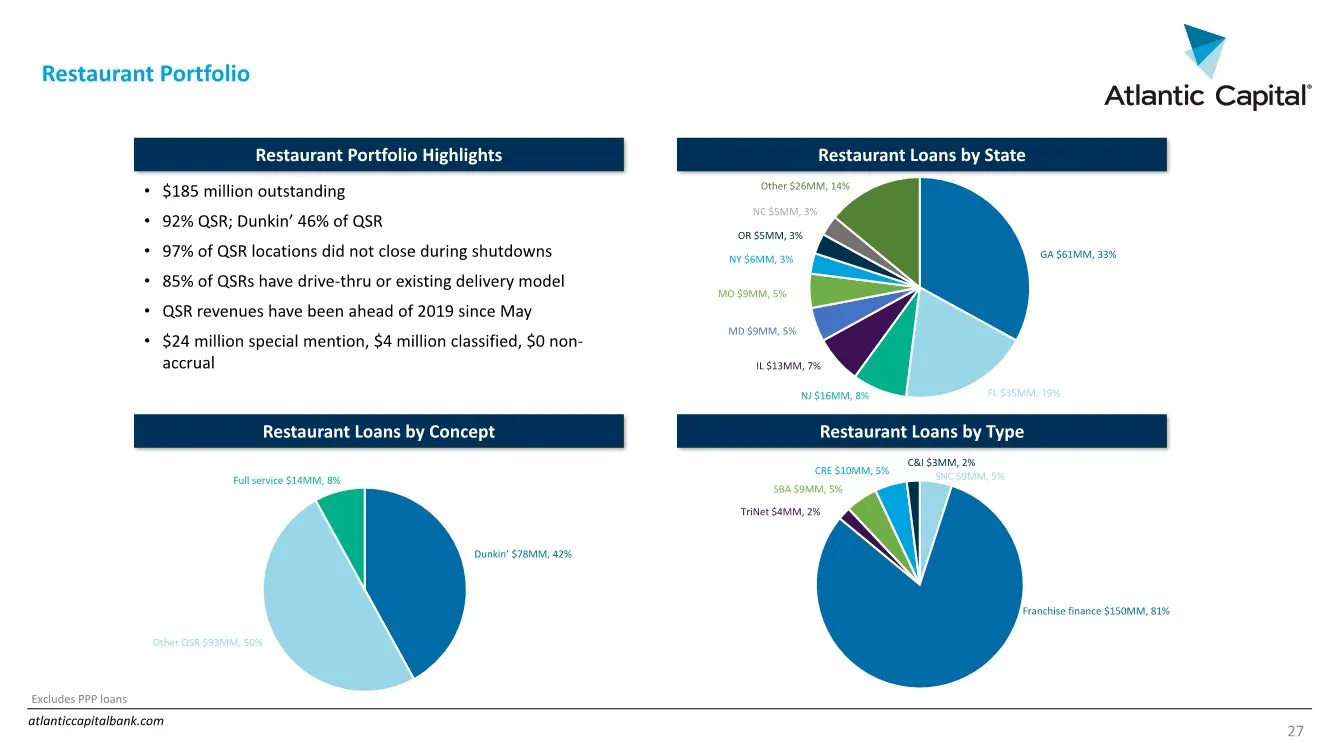
atlanticcapitalbank.com Restaurant Portfolio Restaurant Loans by State Restaurant Portfolio Highlights Restaurant Loans by Concept Restaurant Loans by Type • $185 million outstanding • 92% QSR; Dunkin’ 46% of QSR • 97% of QSR locations did not close during shutdowns • 85% of QSRs have drive-thru or
Slide 28: Retail Portfolio
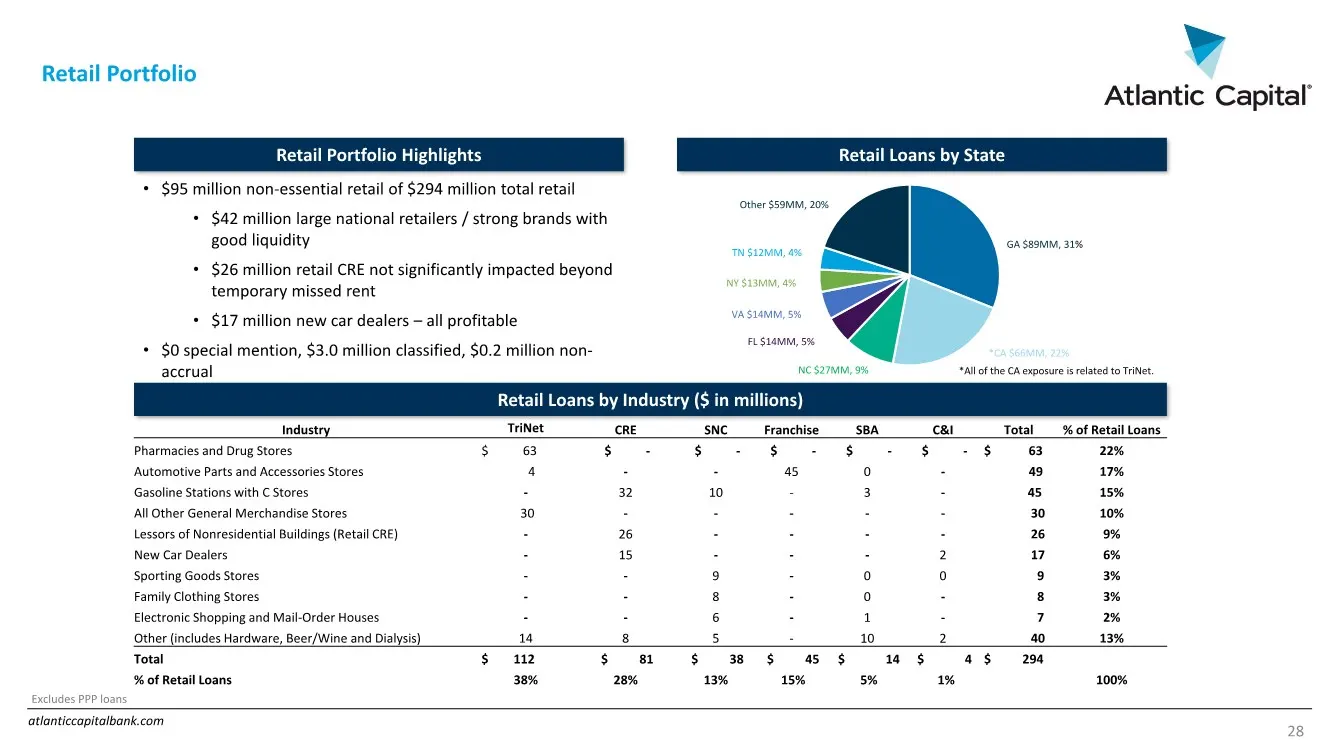
atlanticcapitalbank.com Retail Portfolio Retail Loans by State Retail Portfolio Highlights Retail Loans by Industry ($ in millions) GA $89MM, 31% *CA $66MM, 22% NC $27MM, 9% FL $14MM, 5% VA $14MM, 5% NY $13MM, 4% TN $12MM, 4% Other $59MM, 20% *All of the CA exposure is related to TriNet. Industry Tr
Slide 29: Shared National Credit Portfolio
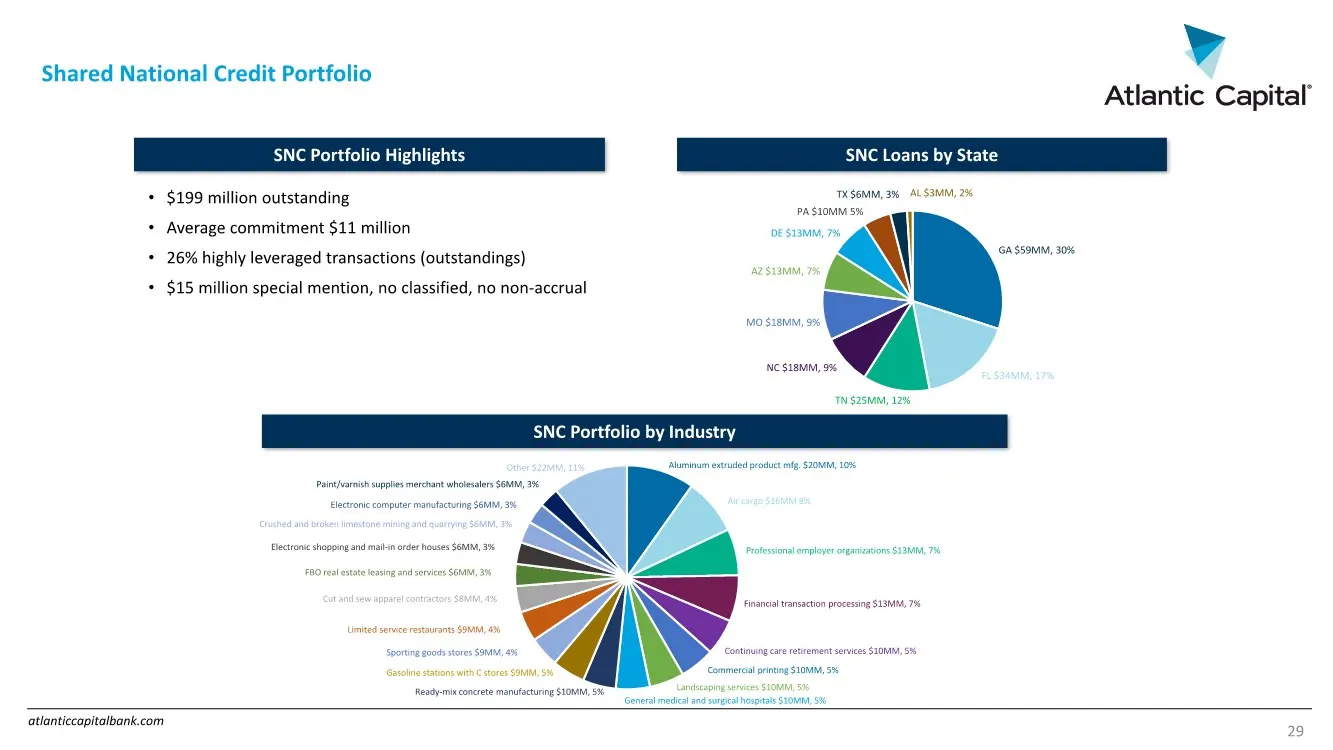
atlanticcapitalbank.com Shared National Credit Portfolio SNC Portfolio Highlights SNC Portfolio by Industry • $199 million outstanding • Average commitment $11 million • 26% highly leveraged transactions (outstandings) • $15 million special mention, no classified, no non-accrual Other $22MM, 11% Alu
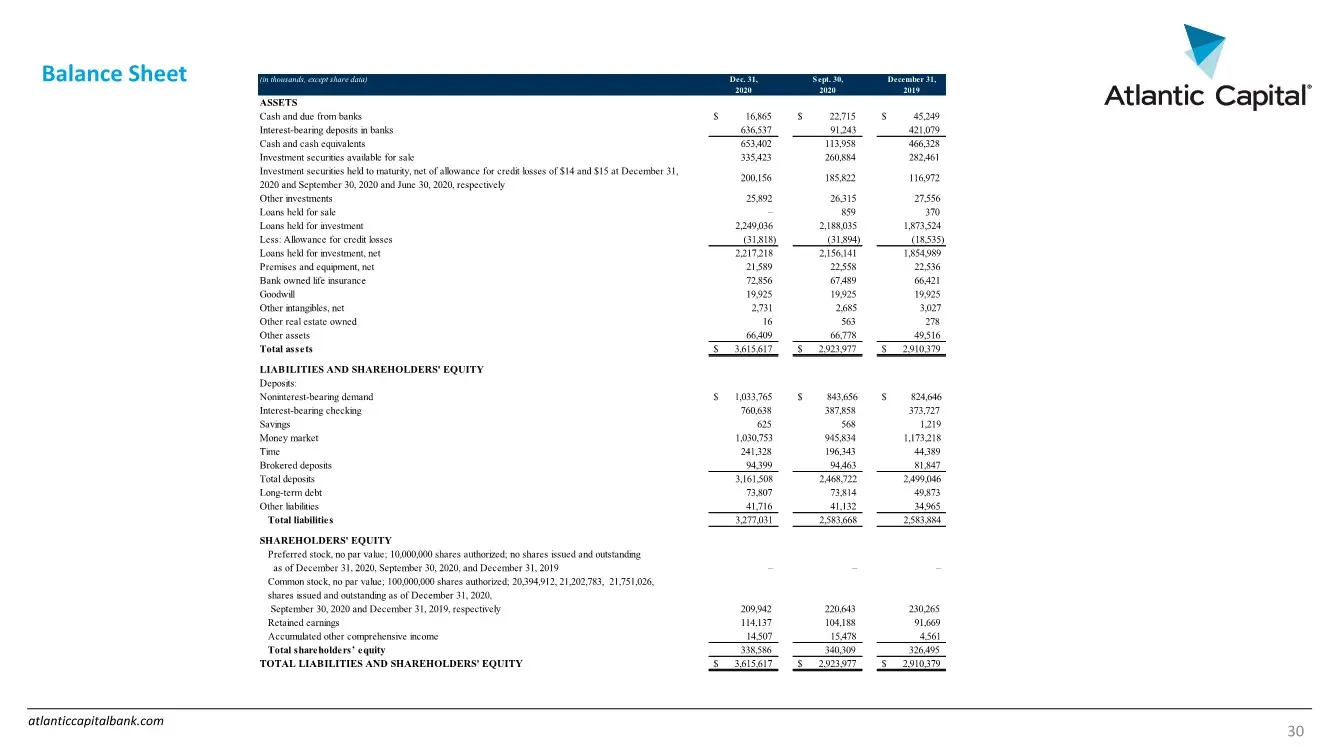
Slide 30: Balance Sheet
atlanticcapitalbank.com Balance Sheet 30 (in thousands, except share data) Dec. 31, Sept. 30, December 31, 2020 2020 2019 ASSETS Cash and due from banks $ 16,865 $ 22,715 $ 45,249 Interest-bearing deposits in banks 636,537 91,243 421,079 Cash and cash equivalents 653,402 113,958 466,328 Investment s
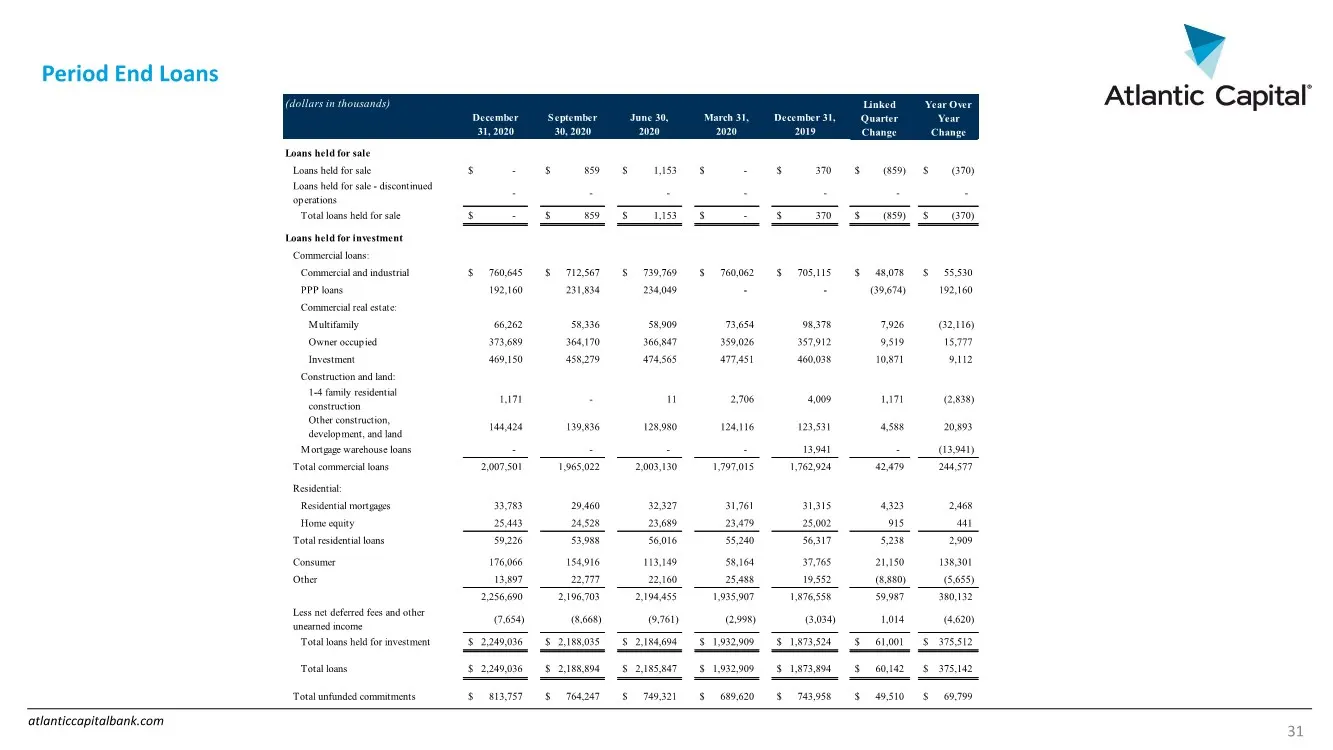
Slide 31: Period End Loans
atlanticcapitalbank.com Period End Loans 31 (dollars in thousands) December 31, 2020 September 30, 2020 June 30, 2020 March 31, 2020 December 31, 2019 Loans held for sale Loans held for sale $ - $ 859 $ 1,153 $ - $ 370 $ (859) $ (370) Loans held for sale - discontinued operations - - - - - - - Total
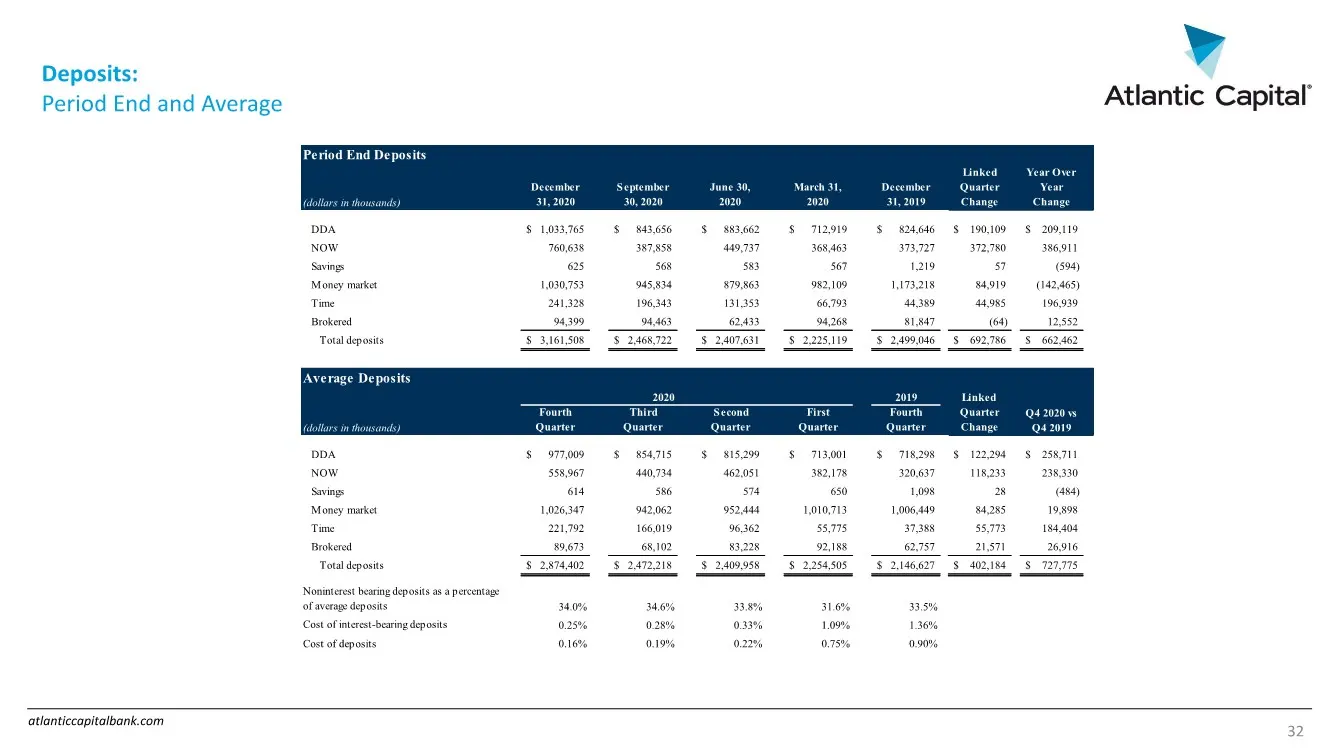
Slide 32: Deposits: Period End and Average
atlanticcapitalbank.com Deposits: Period End and Average 32 Period End Deposits (dollars in thousands) December 31, 2020 September 30, 2020 June 30, 2020 March 31, 2020 December 31, 2019 Linked Quarter Change Year Over Year Change DDA $ 1,033,765 $ 843,656 $ 883,662 $ 712,919 $ 824,646 $ 190,109 $ 2
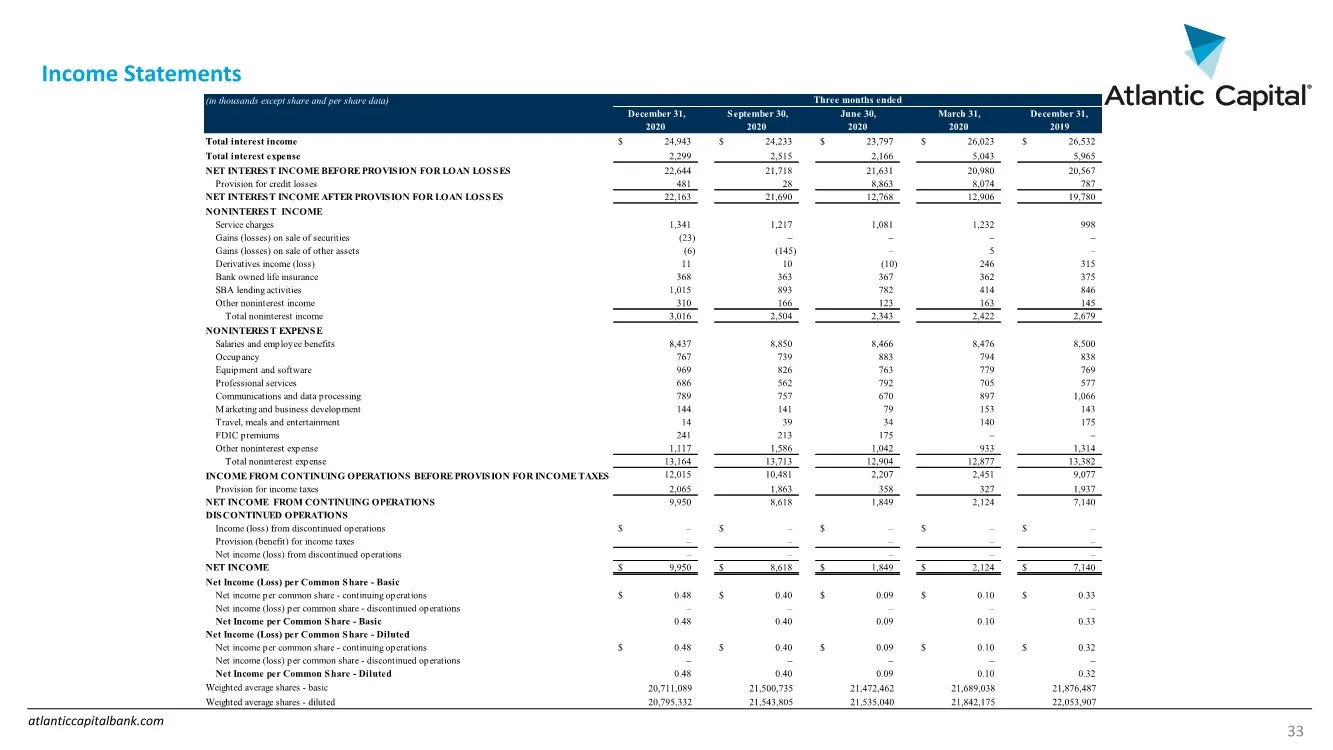
Slide 33: Income Statements
atlanticcapitalbank.com Income Statements 33 (in thousands except share and per share data) December 31, 2020 September 30, 2020 June 30, 2020 March 31, 2020 December 31, 2019 Total interest income $ 24,943 $ 24,233 $ 23,797 $ 26,023 $ 26,532 Total interest expense 2,299 2,515 2,166 5,043 5,965 NET
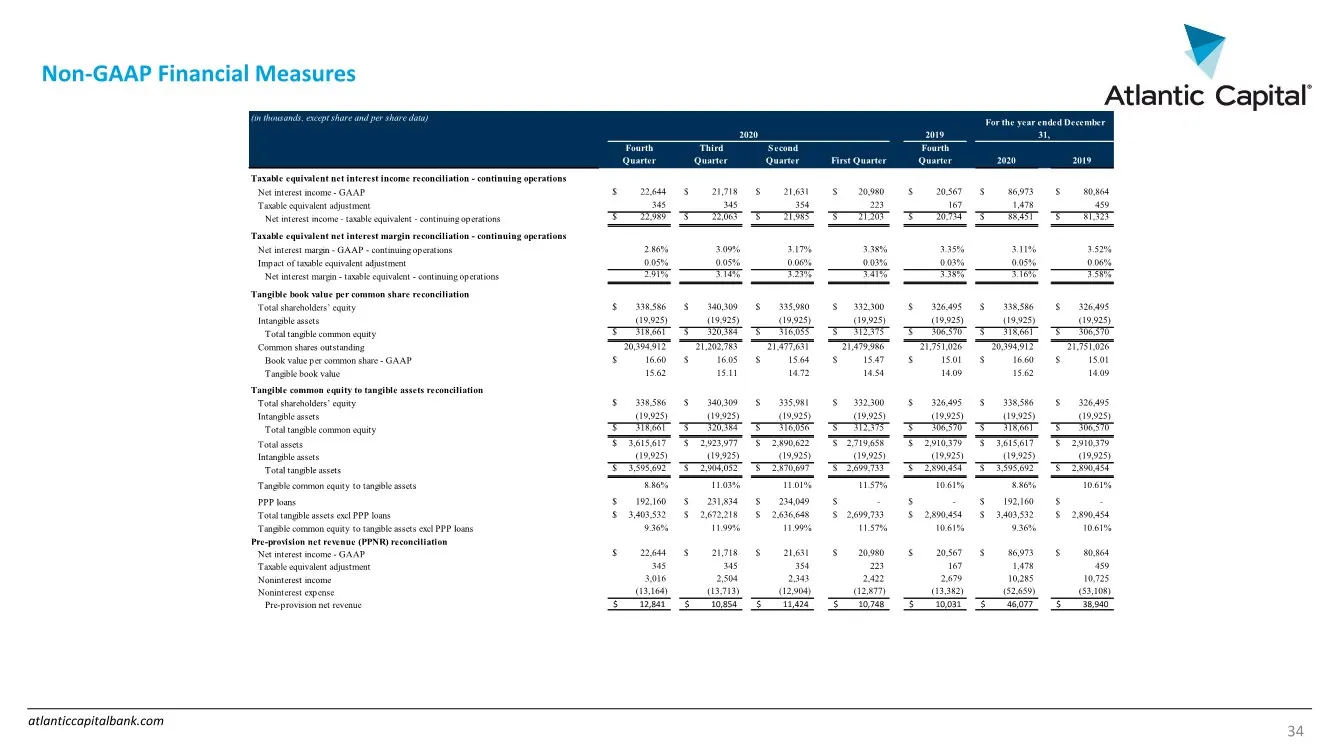
Slide 34: Non-GAAP Financial Measures
atlanticcapitalbank.com Non-GAAP Financial Measures 34 (in thousands, except share and per share data) Fourth Quarter Third Quarter Second Quarter First Quarter Fourth Quarter 2020 2019 Taxable equivalent net interest income reconciliation - continuing operations Net interest income - GAAP $ 22,644
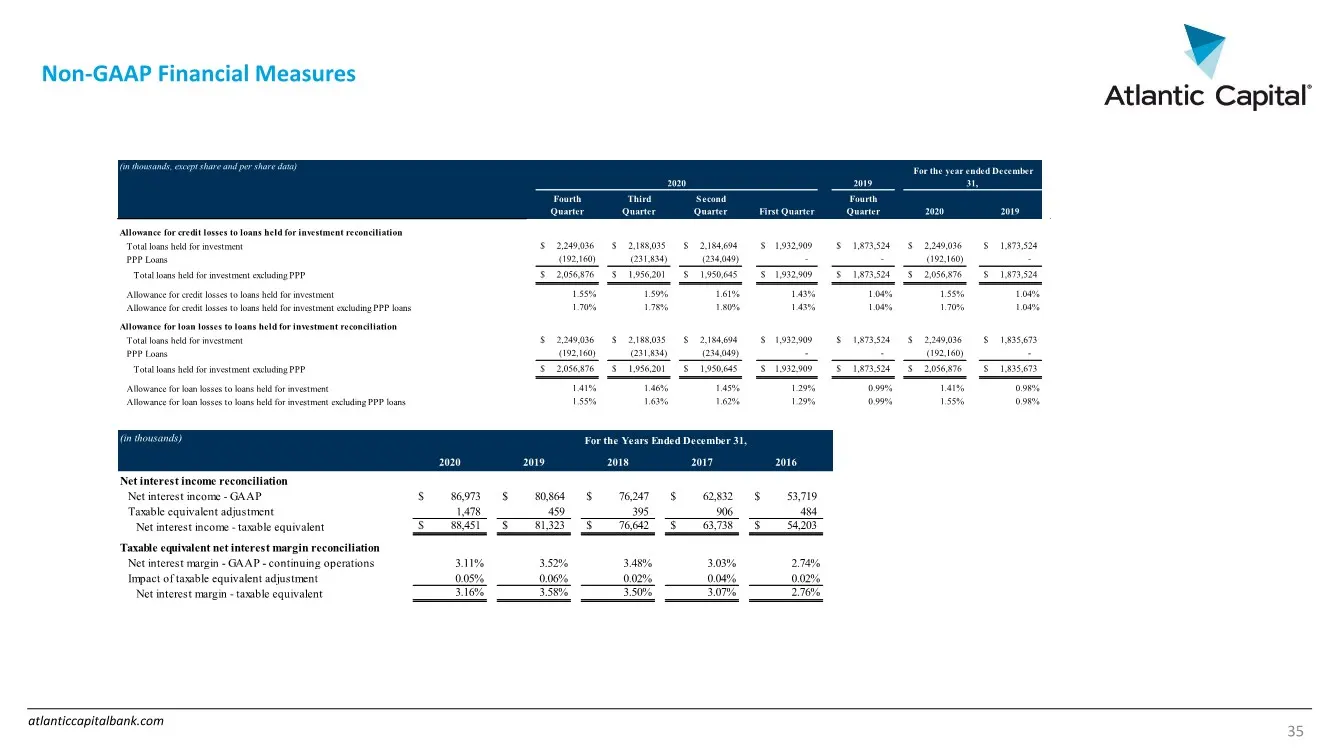
Slide 35: Non-GAAP Financial Measures
atlanticcapitalbank.com Non-GAAP Financial Measures 35 (in thousands, except share and per share data) Fourth Quarter Third Quarter Second Quarter First Quarter Fourth Quarter 2020 2019 Allowance for credit losses to loans held for investment reconciliation Total loans held for investment $ 2,249,03

Slide 36: Thank You
v Atlantic Capital’ Thank You
Source: SEC EDGAR · 8-K filed Feb 19, 2021
More decks from Atlantic Capital Bancshares Inc
 Q4 2021 Earnings Presentation27 slides · Jan 24, 2022
 Q3 2021 Earnings Presentation30 slides · Oct 27, 2021
 Q3 2021 Earnings Presentation40 slides · Oct 27, 2021
 Q2 2021 Earnings Presentation33 slides · Jul 23, 2021
 Merger or Acquisition (July 2021)16 slides · Jul 23, 2021
 Q2 2021 Earnings Presentation39 slides · Jul 23, 2021