Novelis — FY2015 Earnings Presentation
15 slides from Novelis's earnings presentation, May 12, 2015
Slide 1: Novelis Q4 Fiscal Year 2015 Earnings Conference Call
©2015Novelis Inc. 1 May 12, 2015 Steve Fisher Interim President and Chief Executive Officer Novelis Q4 Fiscal Year 2015 Earnings Conference Call Exhibit 99.2
Slide 2: Safe Harbor Statement
©2015Novelis Inc. 2 Safe Harbor Statement Forward-Looking Statements Statements made in this presentation which describe Novelis' intentions, expectations, beliefs or predictions may be forward-looking statements within the meaning of securities laws. Forward-looking statements include statements pr
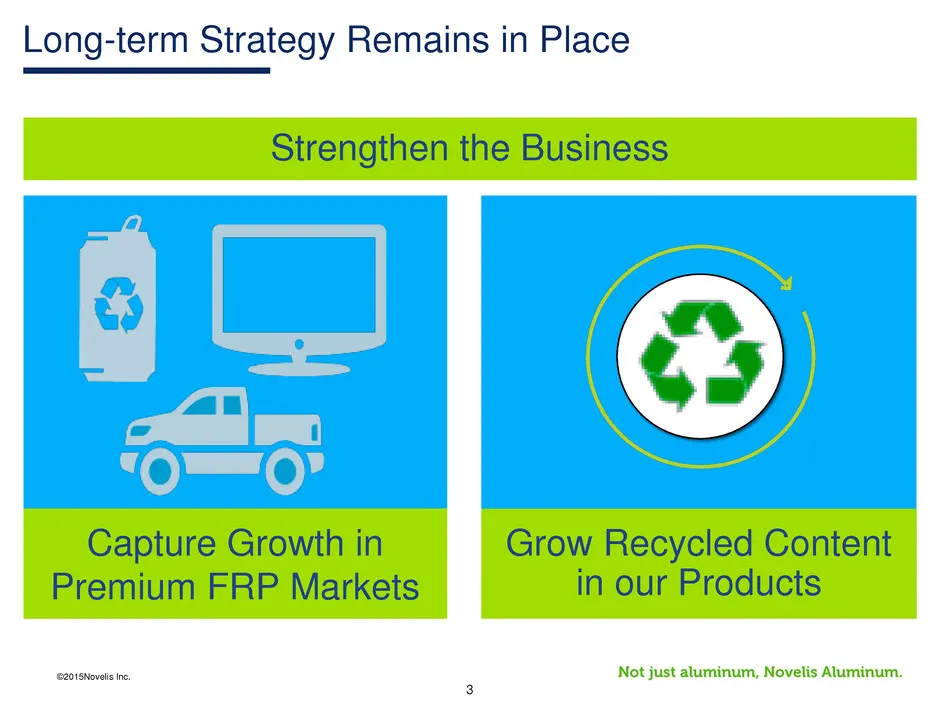
Slide 3: Strengthen the Business: Long-term Strategy Remains in Place
©2015Novelis Inc. 3 Strengthen the Business Long-term Strategy Remains in Place Grow Recycled Content in our Products Capture Growth in Premium FRP Markets
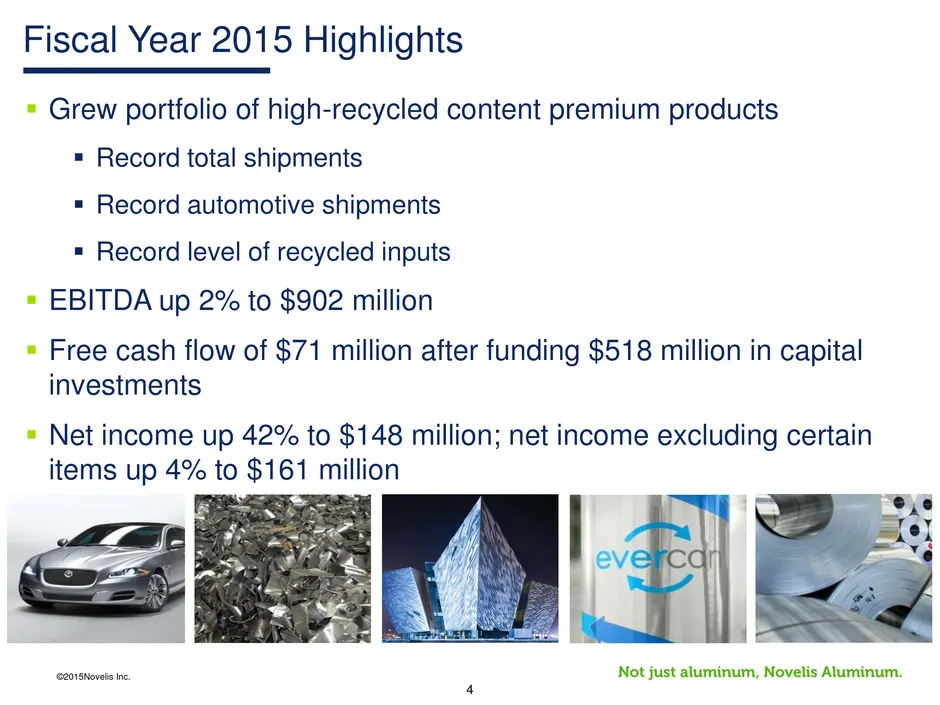
Slide 4: Fiscal Year 2015 Highlights
©2015Novelis Inc. 4 Fiscal Year 2015 Highlights Grew portfolio of high-recycled content premium products Record total shipments Record automotive shipments Record level of recycled inputs EBITDA up 2% to $902 million Free cash flow of $71 million after funding $518 million in capital inv
Slide 5: Captured Demand for Premium Products
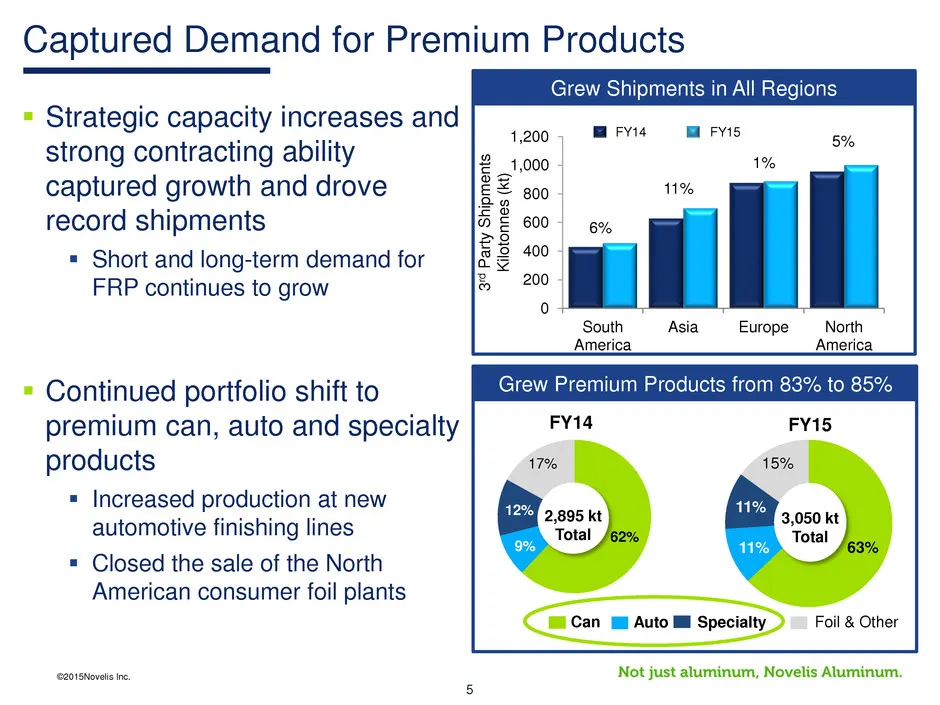
©2015Novelis Inc. 5 Captured Demand for Premium Products Strategic capacity increases and strong contracting ability captured growth and drove record shipments Short and long-term demand for FRP continues to grow Continued portfolio shift to premium can, auto and specialty products Increased
Slide 6: Focused on Executing Automotive Strategy
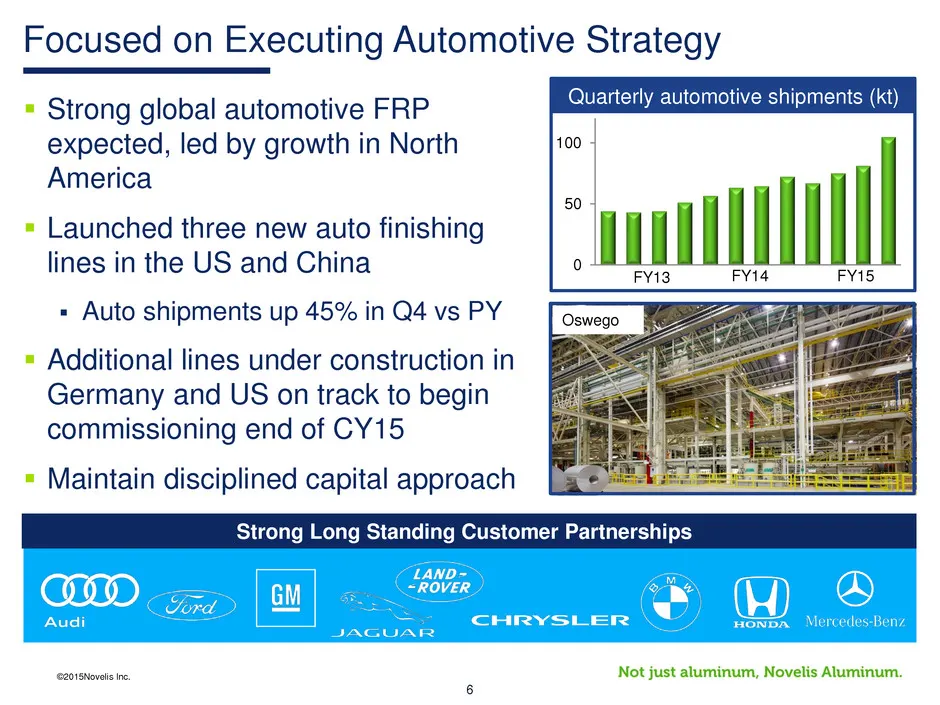
©2015Novelis Inc. 6 Focused on Executing Automotive Strategy Strong global automotive FRP expected, led by growth in North America Launched three new auto finishing lines in the US and China Auto shipments up 45% in Q4 vs PY Additional lines under construction in Germany and US on track to b
Slide 7: Grew Recycled Content to Record Levels
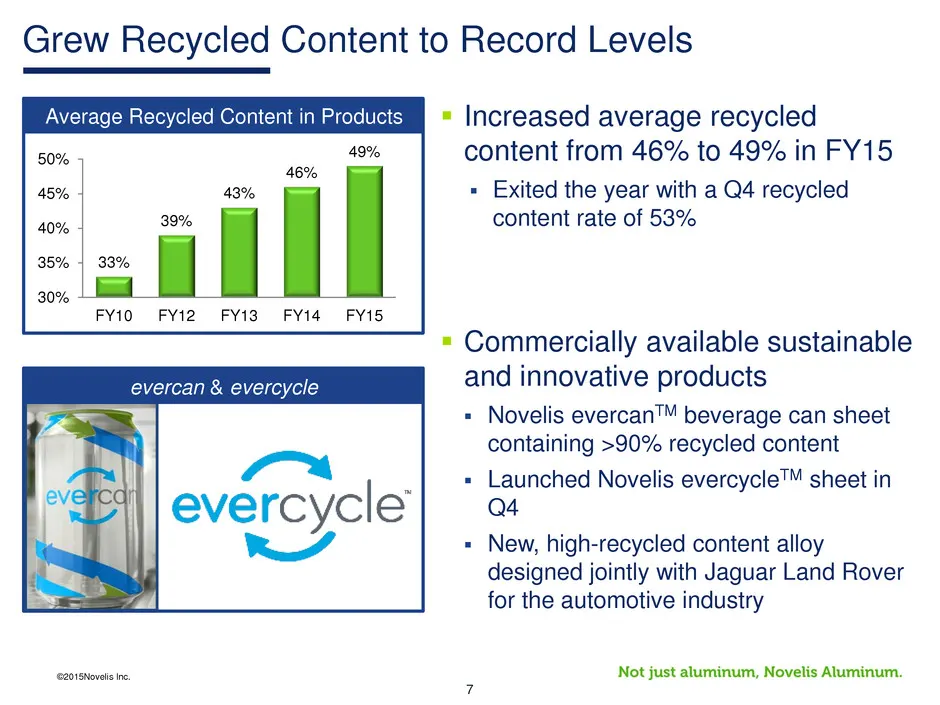
©2015Novelis Inc. 7 Grew Recycled Content to Record Levels Average Recycled Content in Products evercan & evercycle 33% 39% 43% 46% 49% 30% 35% 40% 45% 50% FY10 FY12 FY13 FY14 FY15 Increased average recycled content from 46% to 49% in FY15 Exited the year with a Q4 recycled content rate of 53%
Slide 8: FY15 EBITDA Bridge
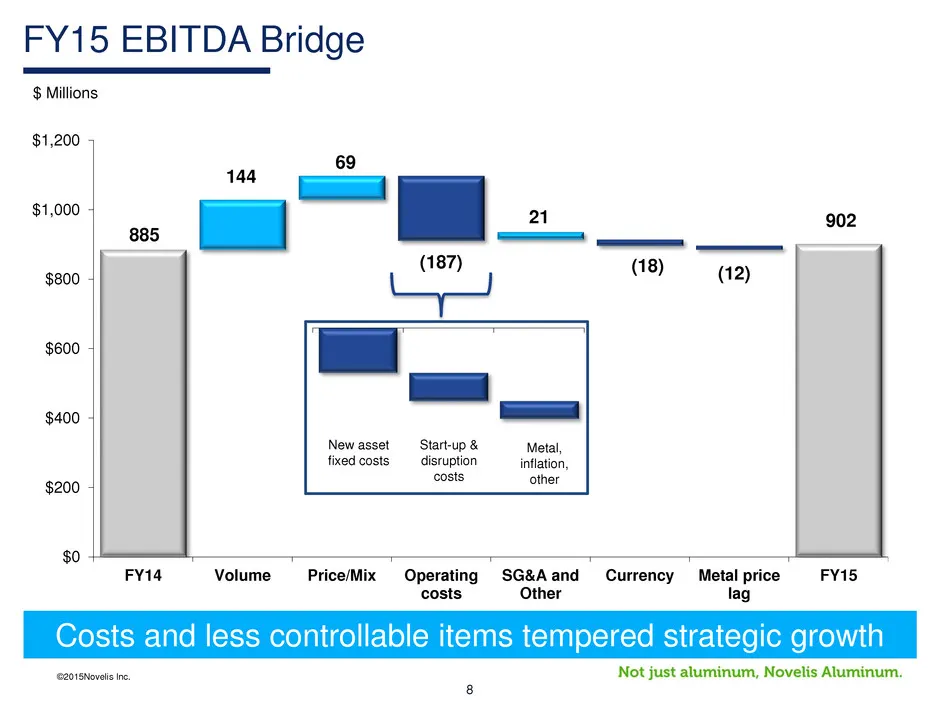
©2015Novelis Inc. 8 FY15 EBITDA Bridge Costs and less controllable items tempered strategic growth $ Millions 885 144 69 (187) 21 (18) (12) 902 $0 $200 $400 $600 $800 $1,000 $1,200 FY14 Volume Price/Mix Operating costs SG&A and Other Currency Metal price lag FY15 New asset fixed costs Start-up & dis
Slide 9: Fourth Quarter Highlights & Challenges
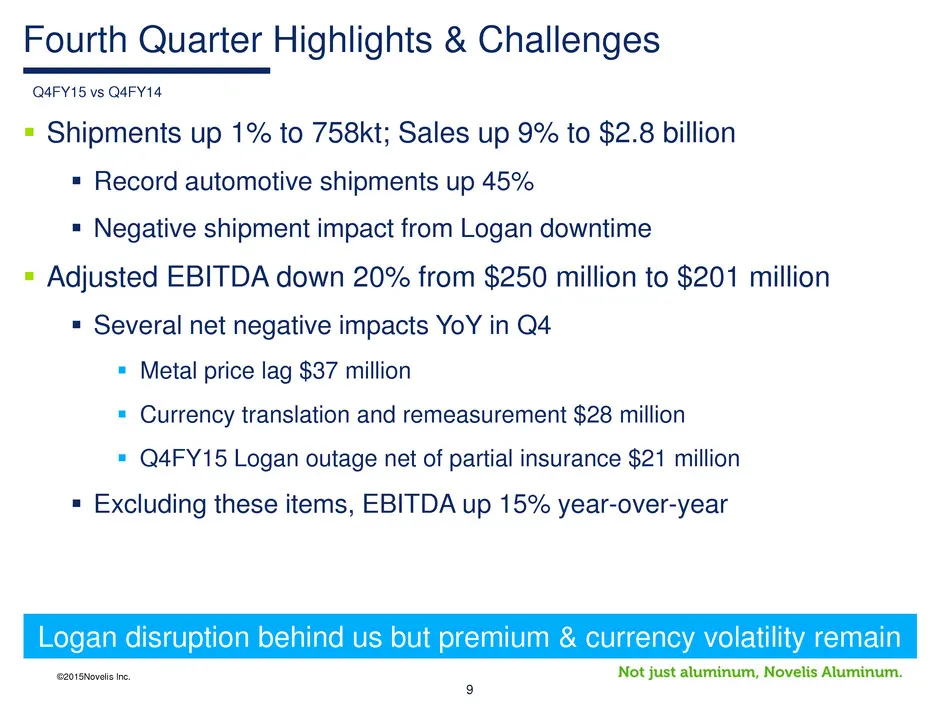
©2015Novelis Inc. 9 Fourth Quarter Highlights & Challenges Shipments up 1% to 758kt; Sales up 9% to $2.8 billion Record automotive shipments up 45% Negative shipment impact from Logan downtime Adjusted EBITDA down 20% from $250 million to $201 million Several net negative impacts YoY in Q4
Slide 10: Market Influences
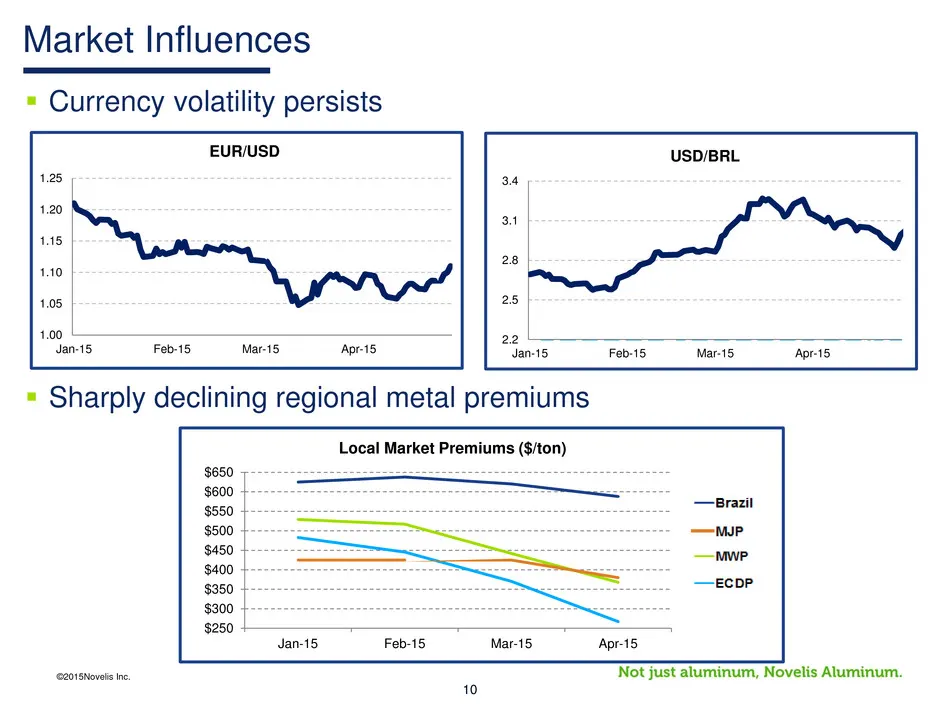
©2015Novelis Inc. 10 Currency volatility persists Sharply declining regional metal premiums Market Influences $250 $300 $350 $400 $450 $500 $550 $600 $650 Jan-15 Feb-15 Mar-15 Apr-15 Local Market Premiums ($/ton) EUR/USD 2.2 2.5 2.8 3.1 3.4 Jan-15 Feb-15 Mar-15 Apr-15 USD/BRL 1.00 1.05 1.10 1.15
Slide 11: Summary & Outlook
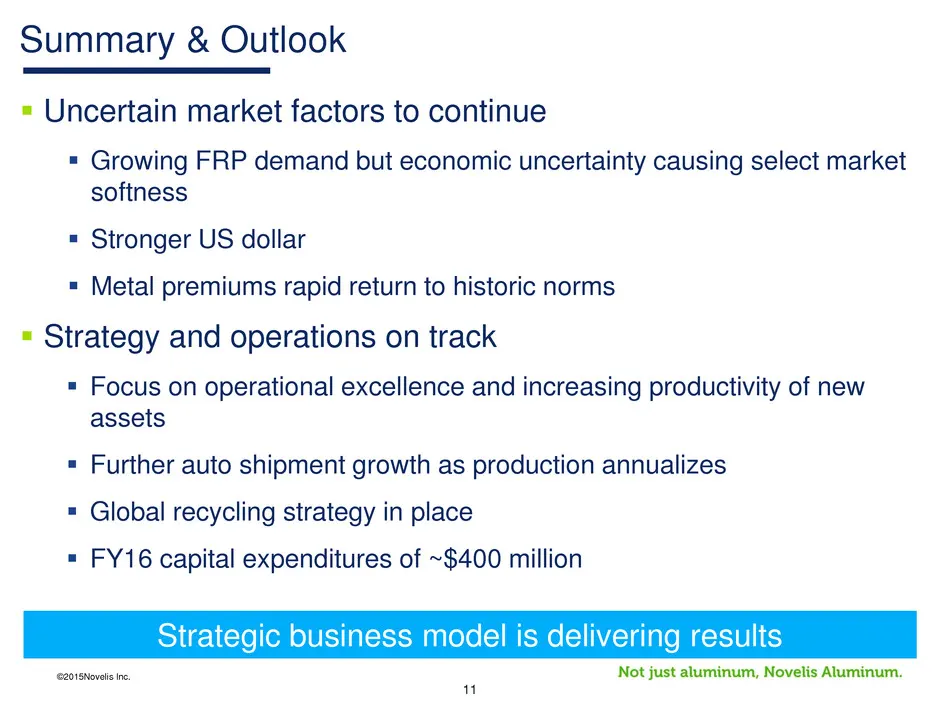
©2015Novelis Inc. 11 Uncertain market factors to continue Growing FRP demand but economic uncertainty causing select market softness Stronger US dollar Metal premiums rapid return to historic norms Strategy and operations on track Focus on operational excellence and increasing productivi

Slide 12: Questions & Answers
©2015Novelis Inc. 12 Questions & Answers

Slide 13: Appendix
©2015Novelis Inc. 13 Appendix
Slide 14: EBITDA Reconciliation
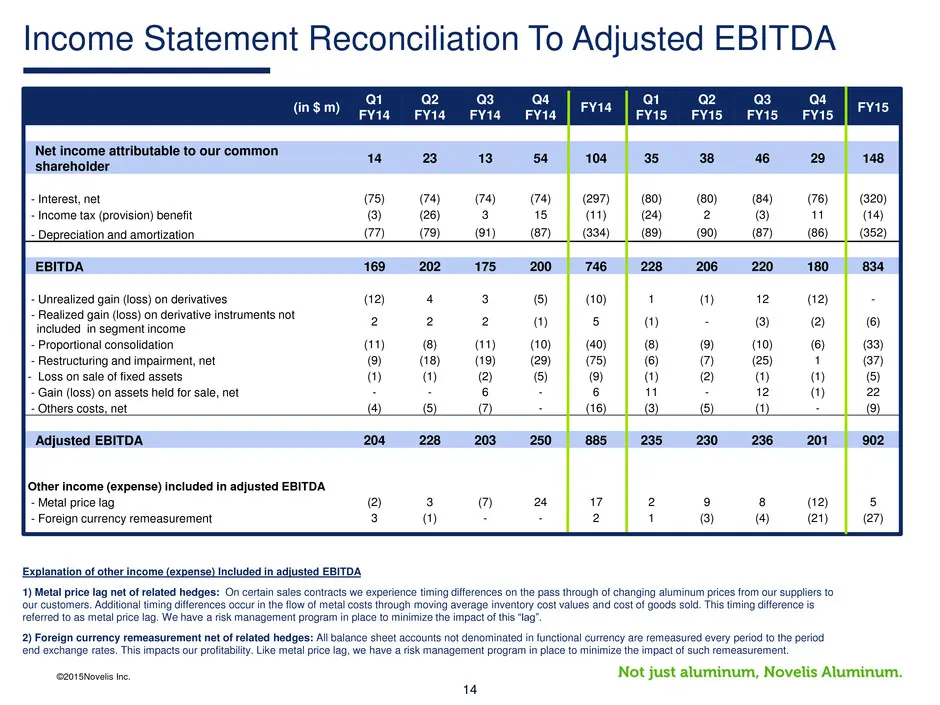
©2015Novelis Inc. 14 (in $ m) Q1 FY14 Q2 FY14 Q3 FY14 Q4 FY14 FY14 Q1 FY15 Q2 FY15 Q3 FY15 Q4 FY15 FY15 Net income attributable to our common shareholder 14 23 13 54 104 35 38 46 29 148 - Interest, net (75) (74) (74) (74) (297) (80) (80) (84) (76) (320) - Income tax (provision) benefit (3) (26) 3 15
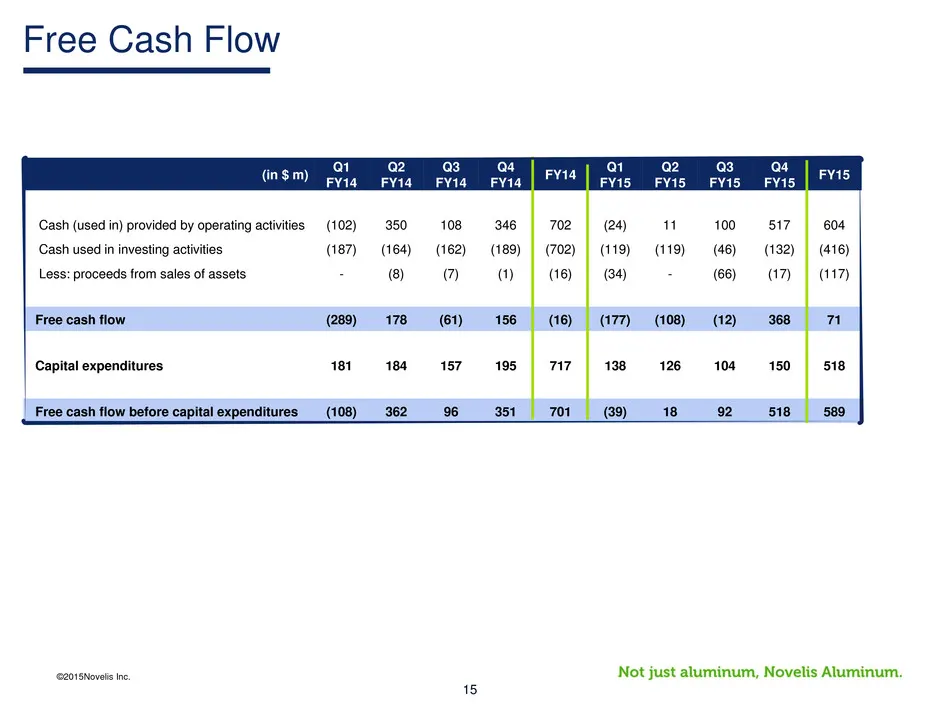
Slide 15: Free Cash Flow Reconciliation
©2015Novelis Inc. 15 (in $ m) Q1 FY14 Q2 FY14 Q3 FY14 Q4 FY14 FY14 Q1 FY15 Q2 FY15 Q3 FY15 Q4 FY15 FY15 Cash (used in) provided by operating activities (102) 350 108 346 702 (24) 11 100 517 604 Cash used in investing activities (187) (164) (162) (189) (702) (119) (119) (46) (132) (416) Less: proceed
Source: SEC EDGAR · 8-K filed May 12, 2015
More decks from Novelis Inc.
 Q2 FY2027 Earnings Presentation20 slides · Nov 5, 2026
 Q2 FY2027 Earnings Presentation31 slides · Nov 5, 2026
 Q1 FY2027 Earnings Presentation21 slides · Aug 5, 2026
 Q1 FY2027 Earnings Presentation31 slides · Aug 5, 2026
 Q4 FY2026 Earnings Presentation33 slides · May 19, 2026
 Q3 FY2026 Earnings Presentation33 slides · Feb 11, 2026