Plains Exploration & Production Company
Plains Exploration & Production — IPAA/OGIS London Conference (May 2009)
31 slides from Plains Exploration & Production's conference presentation, May 28, 2009

Slide 1: IPAA/OGIS London Conference
June IPAA/OGIS London Conference Exhibit 99.1
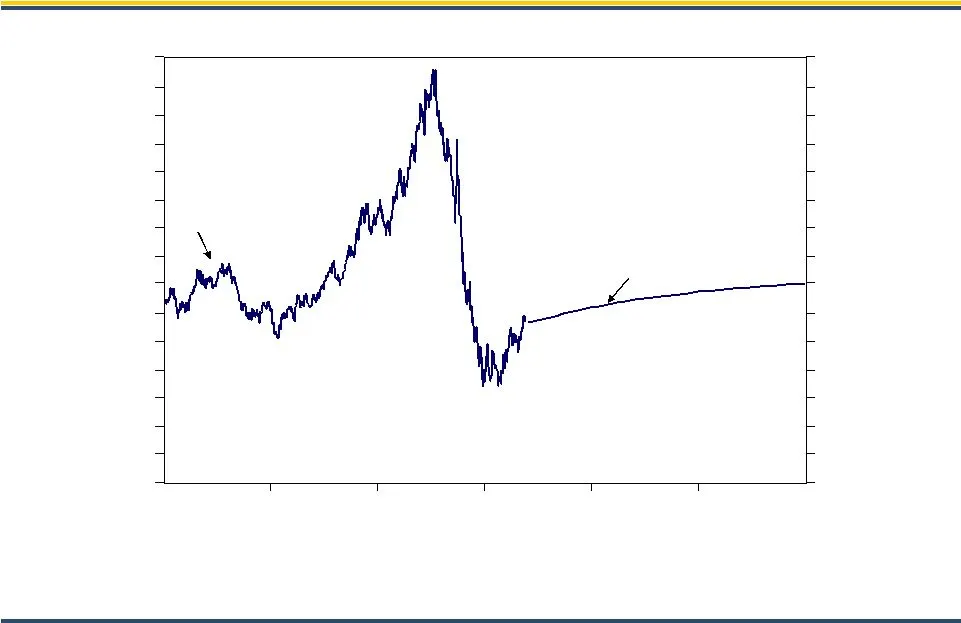
Slide 2: Historical Prices: WTI NYMEX and Forward Curve
Historical Prices WTI NYMEX and Forward Curve Source: Goldman Sachs, NYMEX NYMEX Oil Price $150 $ 0 $150 $ 0 May 15, 2009

Slide 3: PXP Today
PXP Today • $4.9 billion enterprise value (1) • MMBOE proved reserves (2) • 80,900 BOE per day production (3) • 2.2 billion BOE potential reserves • million shares outstanding (4) • 43% debt-to-total capitalization (1) Reflects stock price as of 5/18/09 and total debt. (2) YE 2008. (3) Reported aver

Slide 4: PXP Strategy - Times Like These
Conservative Financial Strategy Aggressive Operational Strategy PXP Strategy - "Times Like These" Conservative Financial Strategy Aggressive Operational Strategy
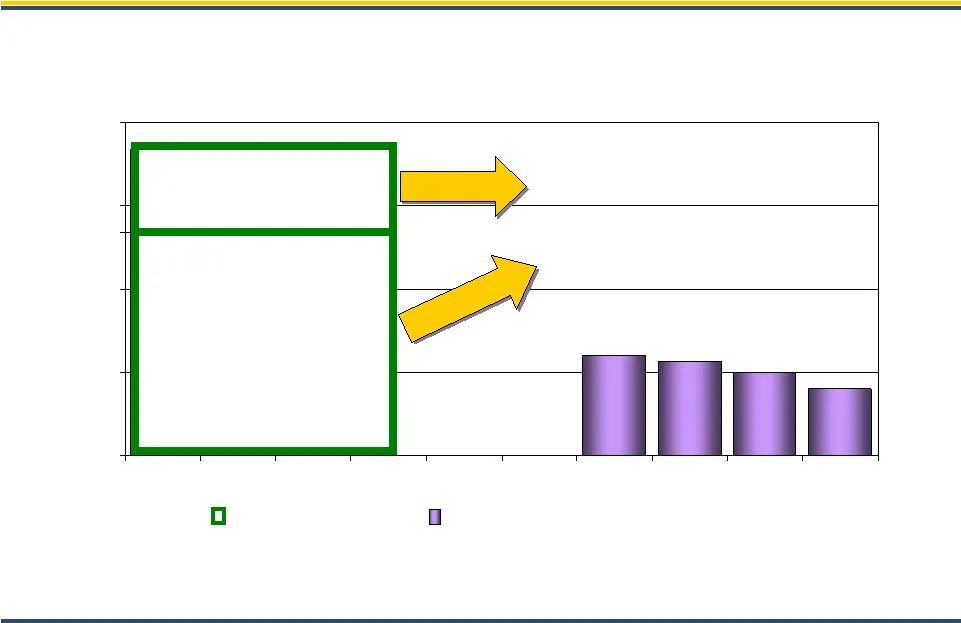
Slide 5: Financial Strength
$600 $565 $400 $500 $0 $500 $1,000 $1,500 $2,000 Financial Strength Strong Liquidity With No Near Term Debt Maturities Credit Revolver Senior Notes - WACC ~ 8.60% Liquidity and Debt Maturity Profile Millions -0- Balance $500MM Cash $1.84 Billion Current Liquidity $1,340
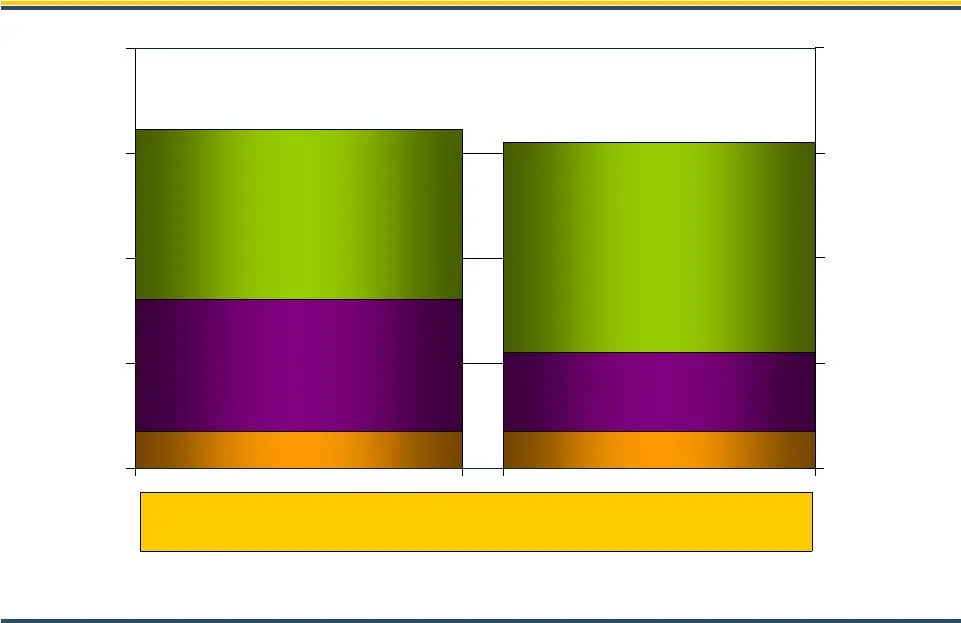
Slide 6: 2009 Hedge Positions
Oil $55 Puts Nat Gas $10 - $20 Collars Nat Gas Physical Purchase (3) Oil $55 Puts Nat Gas $6.12-$8 3 Way Collars (2) Nat Gas Physical Purchase (3) 2009 Hedge Positions Based on Estimated 2009 & 2010 Production Volumes MMbbl/d 80% Protected (1) MMcf/d Total Hedged Position (3) for 2009 is 80% of Prod

Slide 7: PXP Strategy Detail
PXP Strategy Detail Financially Conservative • $1.34 billion available under revolver • +$500 million in cash Operationally Aggressive • Begin development of Diatomite, Non-Diatomite and Miocene projects to maintain oil production volumes • Accelerate Haynesville development to increase natural gas
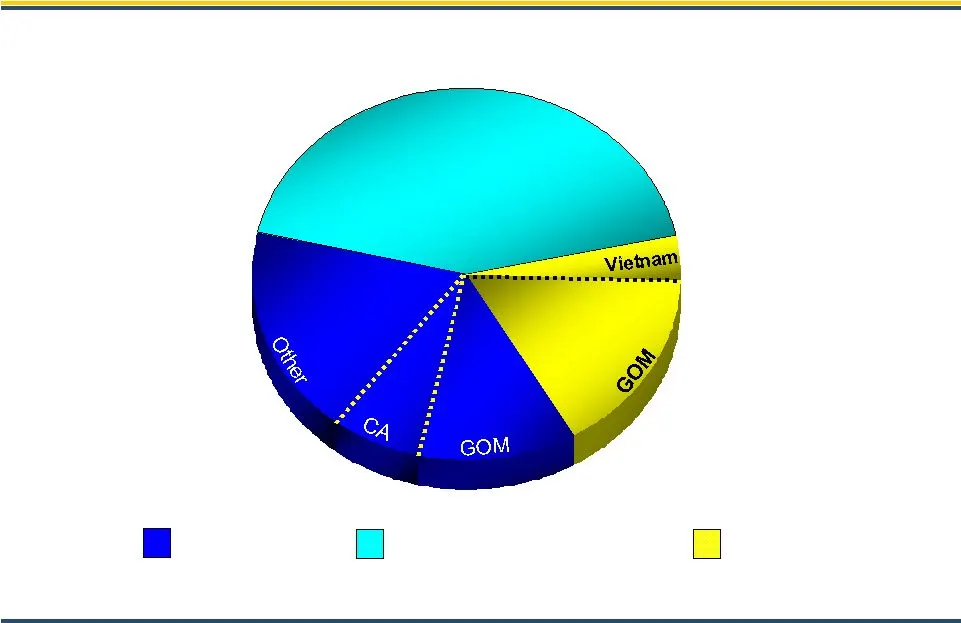
Slide 8: 2009 Capital Program
37% 2009 Capital Program $1,050 MM Development Development-Haynesville Development capital includes exploitation, real estate, capitalized interest and G&A costs. Exploration Rigs Avg. 20% 43% 12% 7% 4% 16% 18% 37%
Slide 9: California
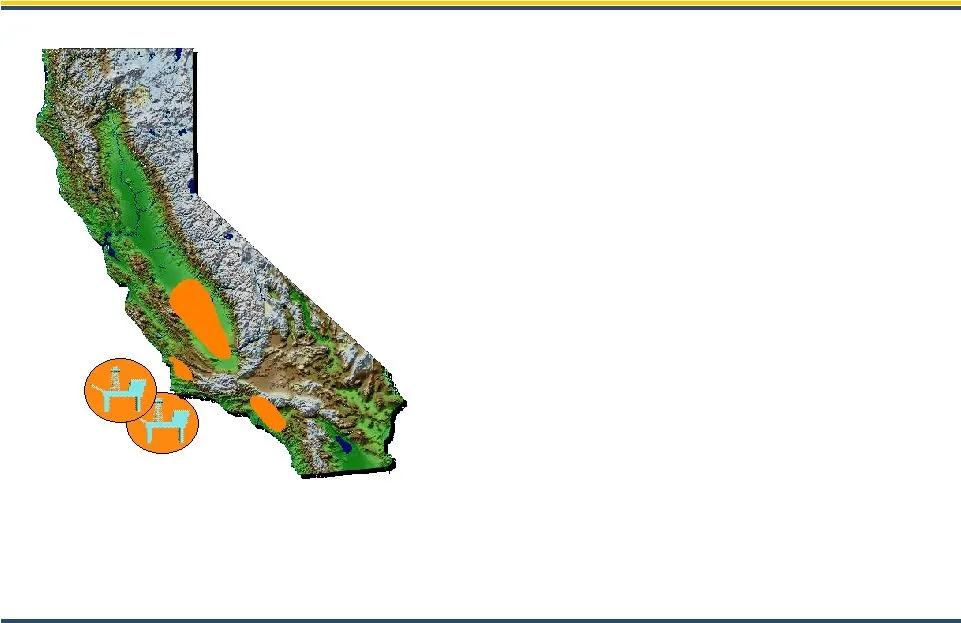
California Onshore/Offshore Los Angeles Basin Los Angeles Basin San Joaquin Valley San Joaquin Valley Arroyo Grande Arroyo Grande Pt Pedernales Pt Arguello • 174 MMBOE Net Proved Reserves (1) • 275 MMBOE Net Reserve Potential • 69% Proved Developed • Capex ~ $69 MM est. • 10 yr R/P (2) • 2,500+ futu
Slide 10: San Joaquin Valley Santa Maria Basin
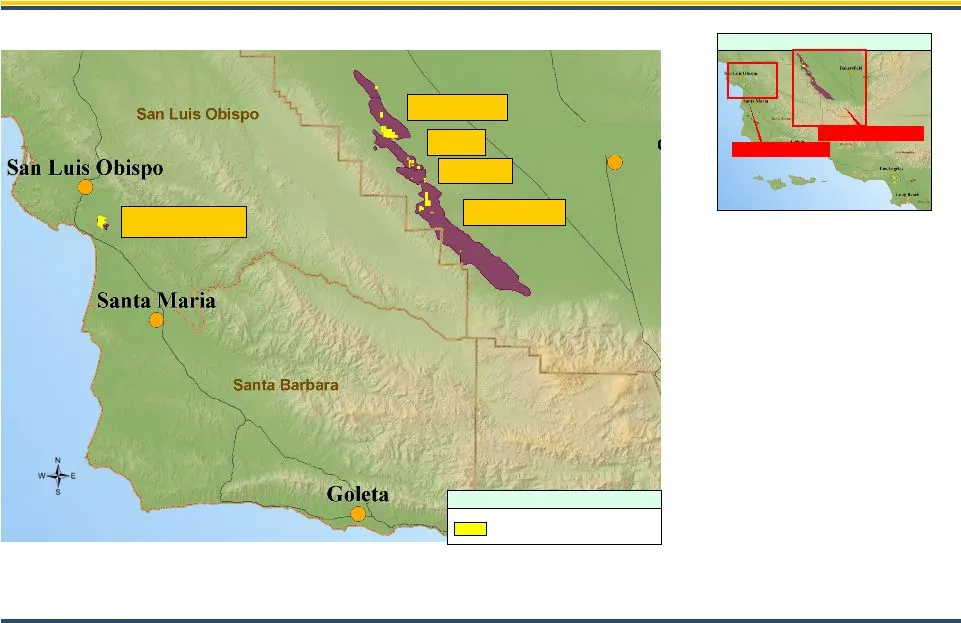
San Joaquin Valley Santa Maria Basin Projection: NAD 1927 CAL VII Location Map T:\California\Regional_CA\Graphics\ppt\\CA_Relief_maps.ppt Midway Sunset Cymric South Belridge McKittrick Legend PXP LEASES Diatomite/Non-Diatomite • Steam recovery • Development Resource ~ 165 MMBOE • Diatomite ~ 62 MMBO
Slide 11: LA Basin
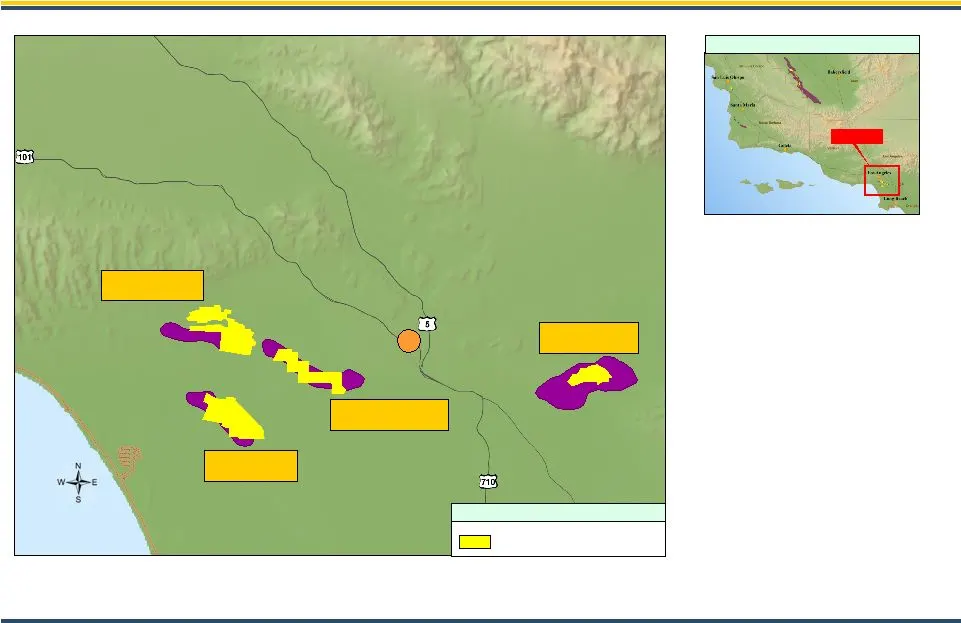
LA Basin Miocene Sands Onshore California - LA Basin Location Map Projection: NAD 1927 CAL VII Legend PXP LEASES T:\California\Regional_CA\Graphics\ppt\\CA_Relief_maps.ppt Miocene/Pliocene Sands • Waterflood recovery • Development Resource ~ 112 MMBOE Los Angeles Montebello Inglewood Urban Area Las
Slide 12: Haynesville Shale 2009 Activity
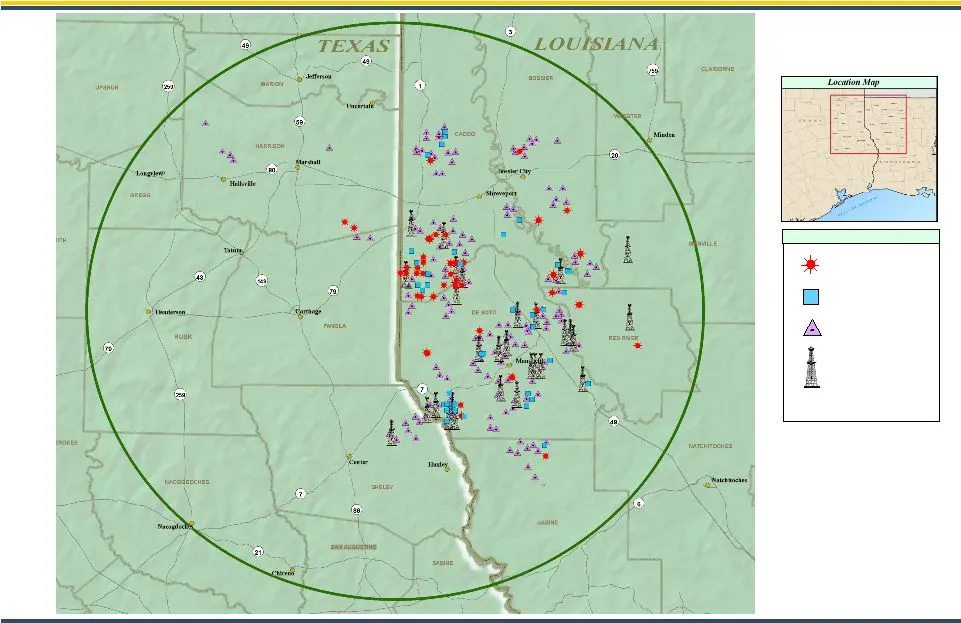
Legend PRODUCING WAITING ON COMPLETION 2009 DRILLS ACTIVE DRILLING Projection: NAD 1927 LA North Haynesville Shale 2009 Activity
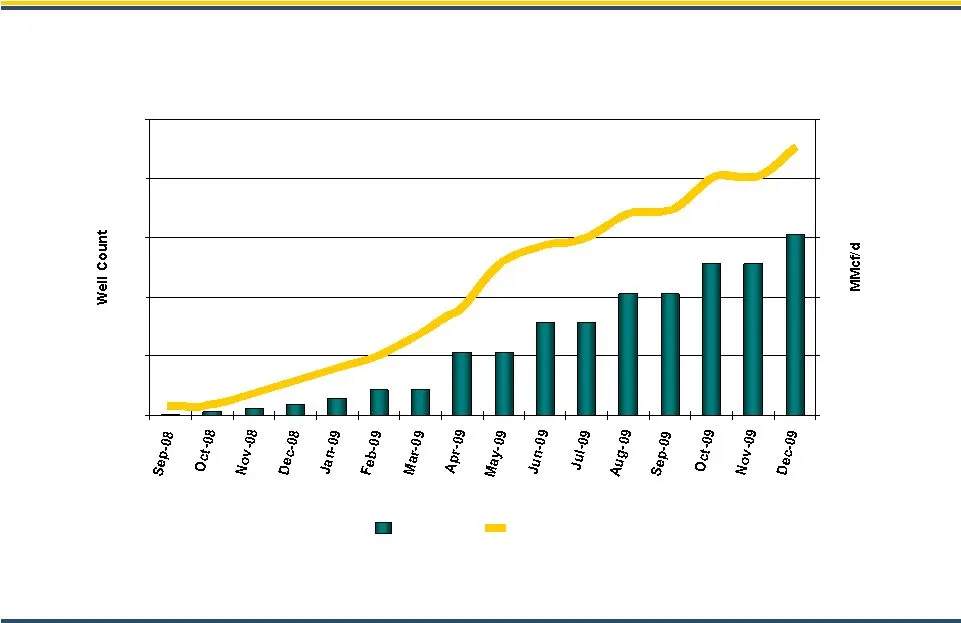
Slide 13: PXP Net Gas Production & Gross Well Count
PXP Net Gas Production & Gross Well Count Haynesville Shale Planned Ramping of Production Well count Net MMcf/d
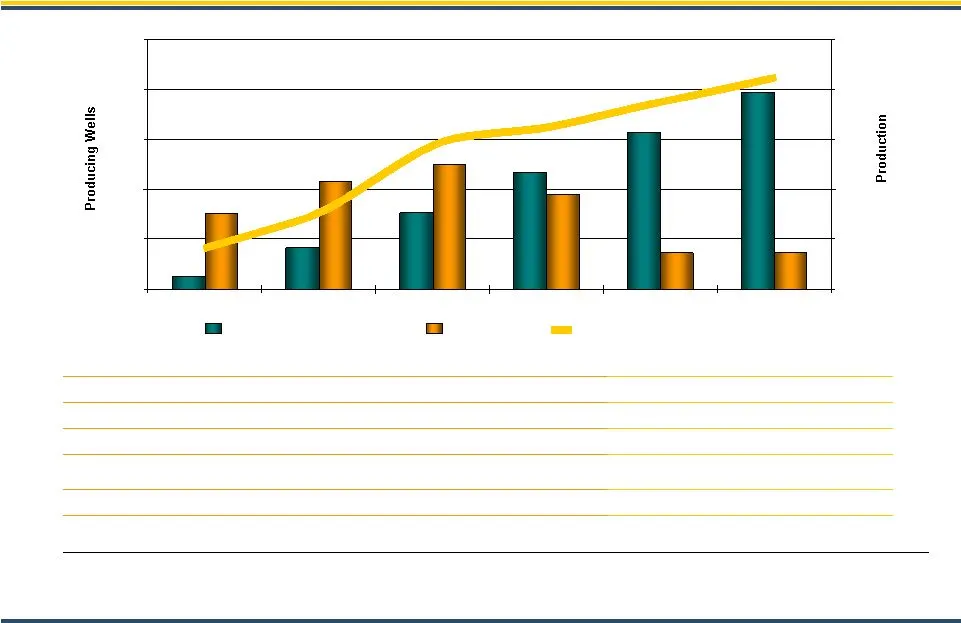
Slide 14: Haynesville Economics
1,200 1,500 Haynesville Economics $1.62 Mcfe or $9.72/BOE January 1, 2009 Project Cost Forward F&D: $1.83 Mcfe or $10.98/BOE PXP 2009 Net H’ville F&D: (1) Assumed D&C costs for first 3 years = $7 MM per well, after 3 years = $6 MM per well. 6.5 Bcfe Est. Median Gross EUR per Well: $7 MM (1) Est. Med
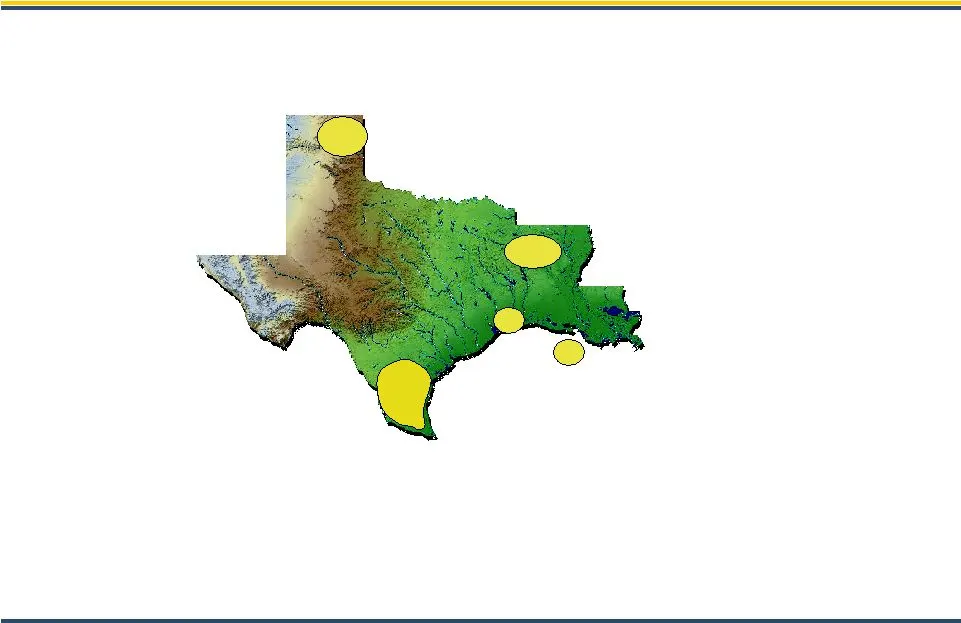
Slide 15: South Texas Big Mac
South Texas Big Mac Texas/Louisiana Haynesville Shale • 111,000 net acres • 1,375 potential net locations • 25 rigs operating • Current production +20 MMcf/d net Texas Panhandle • 532,000 gross acres • 715 square miles 3D seismic • Granite Wash potential • Current Production +35 MMcf/d net South Tex
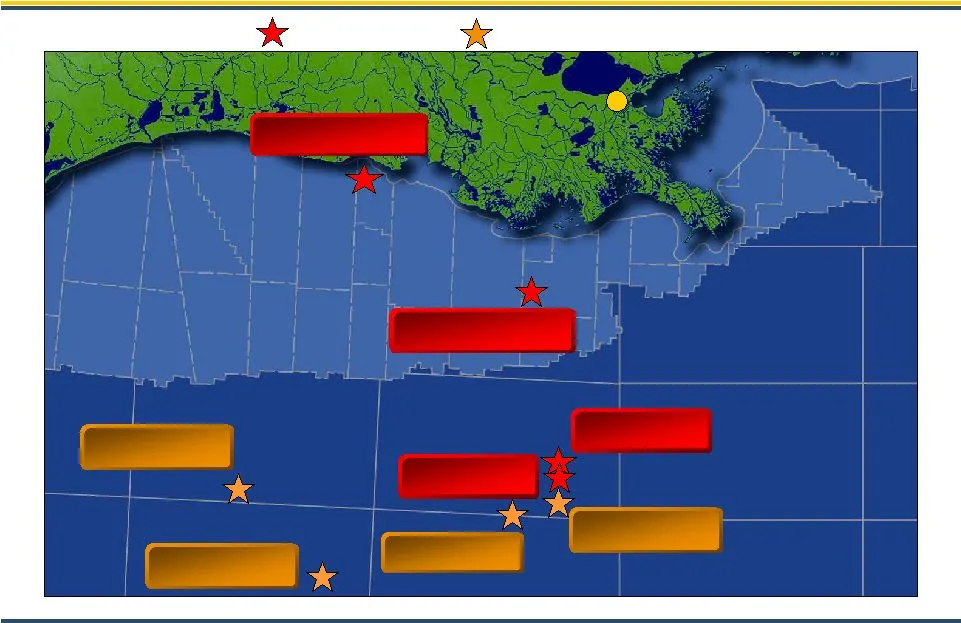
Slide 16: Gulf of Mexico Exploration Success Continues
New Orleans S. Timbalier 168 Friesian Friesian # 2 Friesian Deep Salida Rickenbacker Northwood Flatrock Field Gulf of Mexico Exploration Success Continues Discoveries 2009 Drilling
Slide 17: Friesian Project
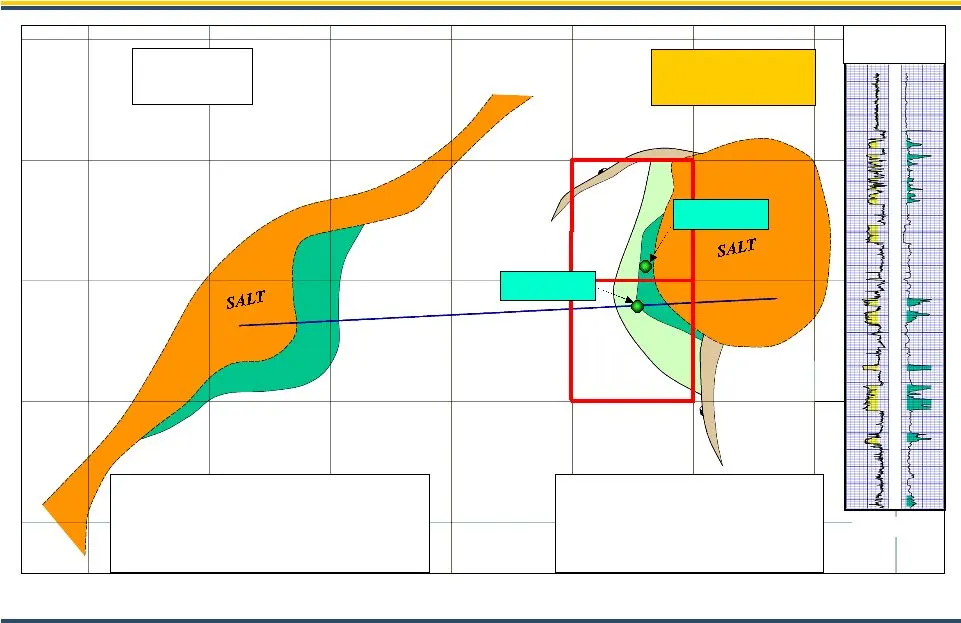
Friesian Project Green Canyon Area, GOM Tahiti Reserve Potential approx. 300 MMBOE PXP - 50% W.I. Est. Reserves 500 MMBOE Est. Prod. 135 MBOEPD Miocene Type Log 29,000’ Friesian Friesian 1 Friesian 2
Slide 18: Friesian Project
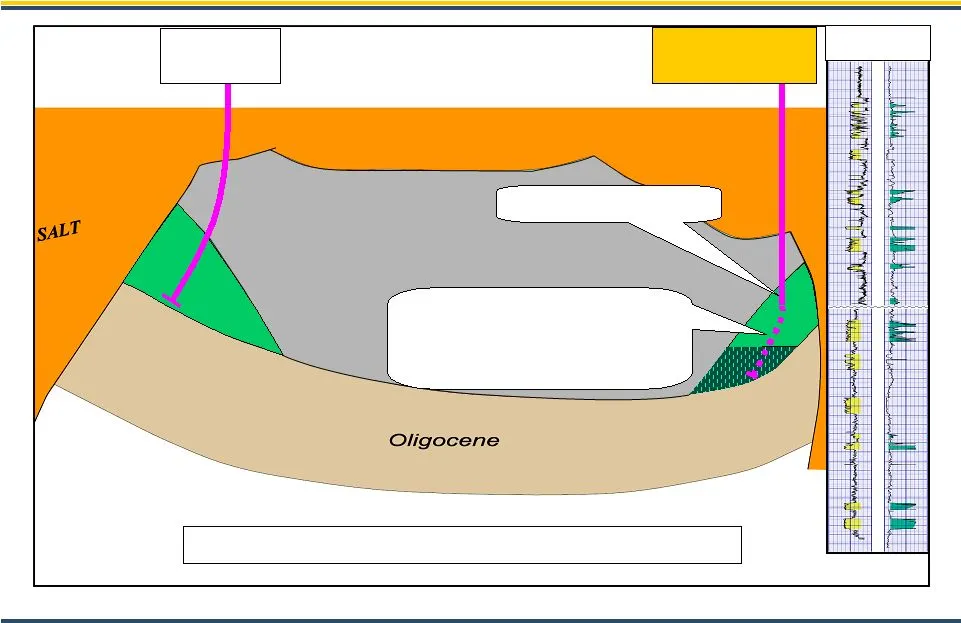
Friesian Project Green Canyon Area, GOM Net Reserve Potential 150 MMBOE Miocene Type Log Miocene Friesian Tahiti Recently added 89’ high quality deeper oil pay Currently setting liner to drill ahead to M-21 Sand 389 net feet of oil pay
Slide 19: Lower Tertiary Wilcox Trend
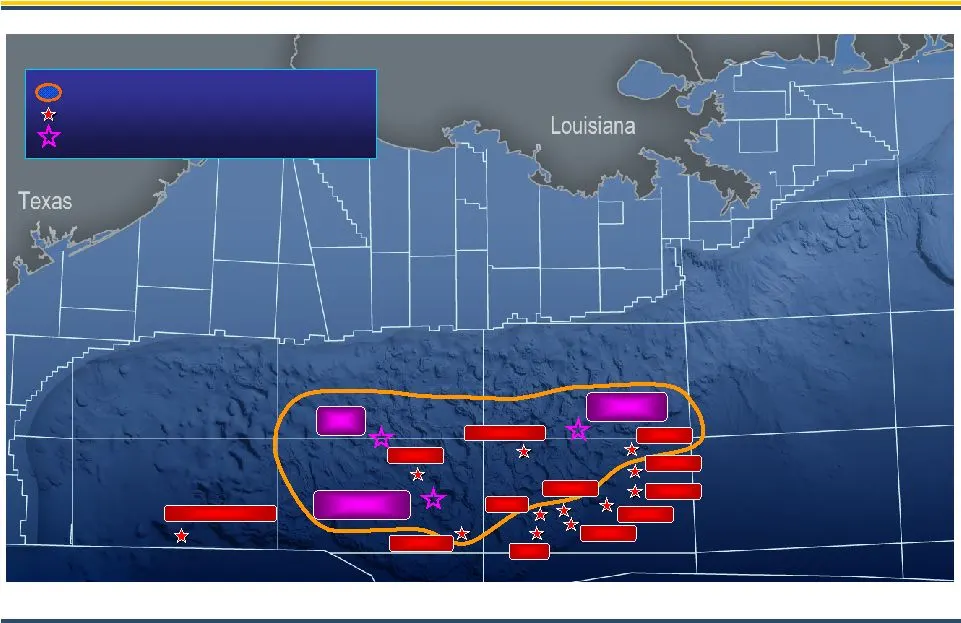
Lower Tertiary (LT) Wilcox Inboard Boundary Stones Chinook Cascade St. Malo Jack Julia Tucker Kaskida Buckskin Great White et al Industry L. Tertiary Discoveries/Fields Prospects Big Foot Shenandoah Salida Northwood Rickenbacker Lower Tertiary Wilcox Trend Deepwater GOM (Paleogene)
Slide 20: Salida Prospect
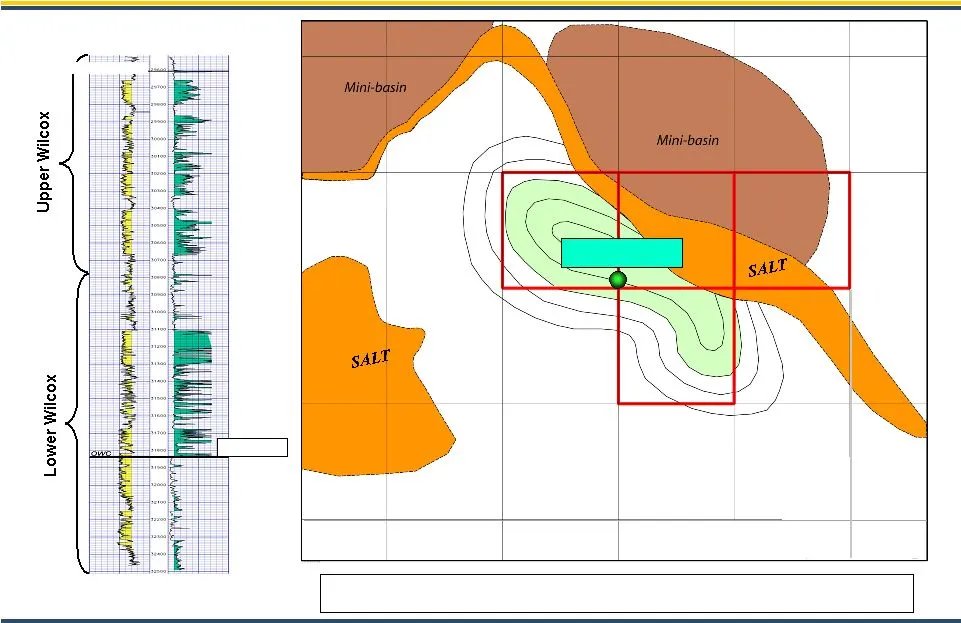
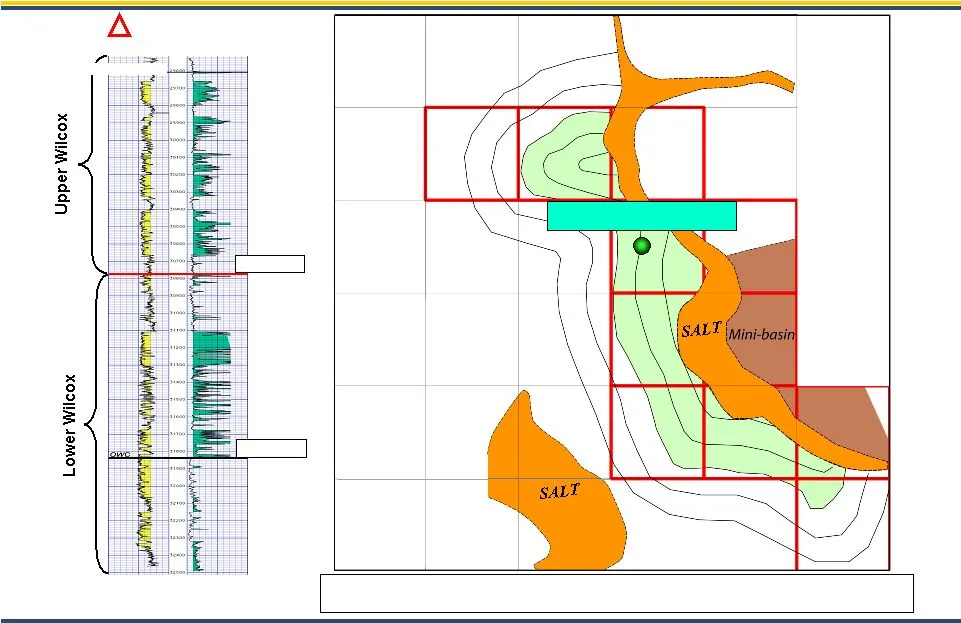
BP Exploration KC 292 OCS-G 25796 #1 BP2 EOCENE / WILCOX OWC -31,765 Salida Prospect Lower Wilcox Structure Salida Prospect Net Reserve Potential +100 MMBOE
Slide 21: Rickenbacker Prospect
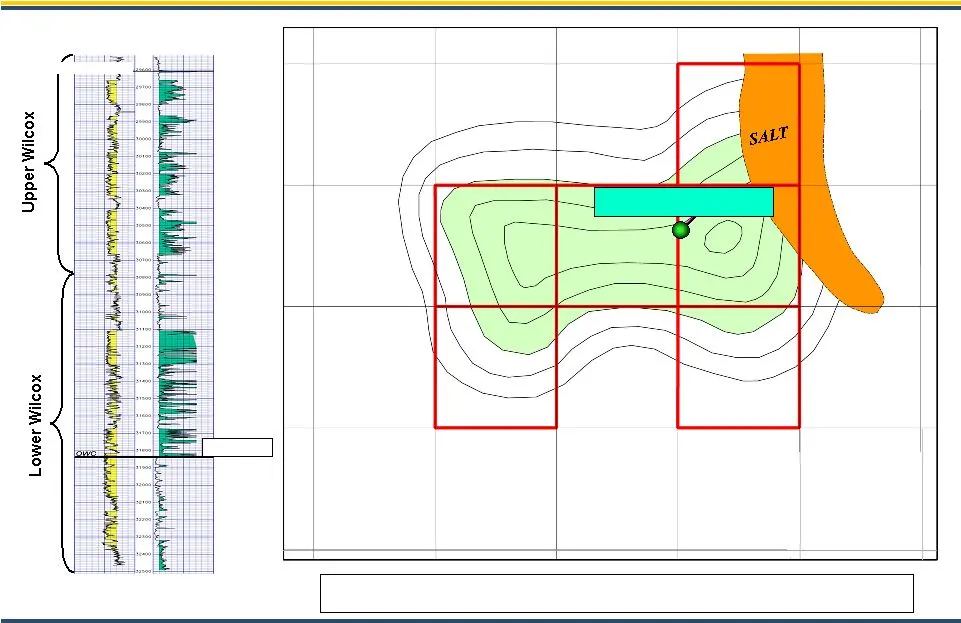
BP Exploration KC 292 OCS-G 25796 #1 BP2 Map Horizon EOCENE / WILCOX OWC -31,765 Rickenbacker Prospect Top Paleocene / Lower Wilcox Rickenbacker Prospect Net Reserve Potential +100 MMBOE
Slide 22: Northwood Prospect
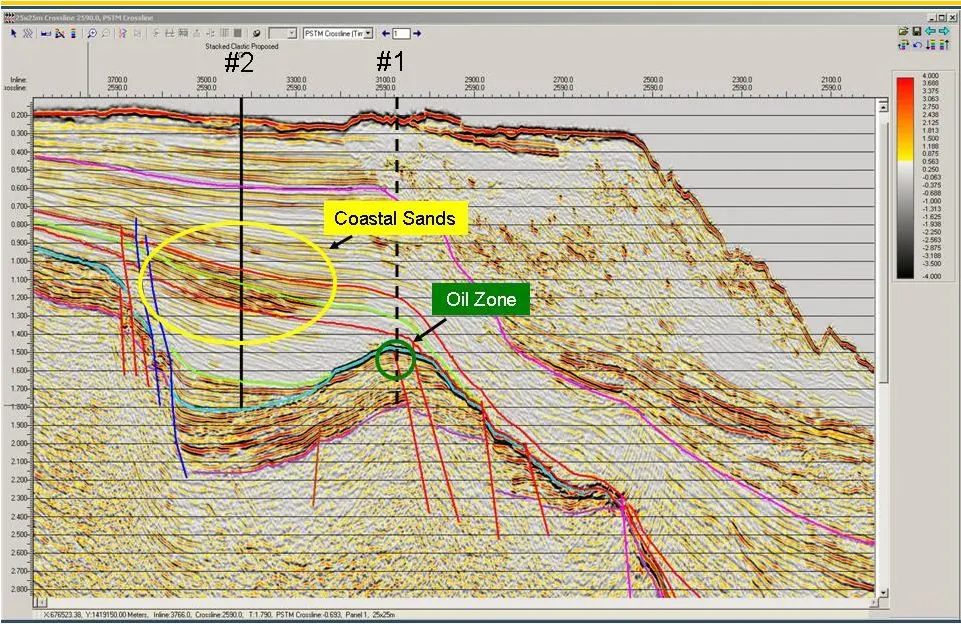
Northwood Prospect Wilcox Sand Structure BP Exploration KC 292 OCS-G 25796 #1 BP2 EOCENE / WILCOX OWC -31,765 Northwood Prospect Net Reserve Potential +100 MMBOE
Slide 23: Purple Tiger Prospect
Purple Tiger Prospect Offshore Central Vietnam

Slide 24: Exploration Summary
Exploration Summary +500 MMBOE 3Q09 Spud +100 MMBOE Purple Tiger 3Q09 Spud +100 MMBOE Rickenbacker June 09 Spud +100 MMBOE Northwood June 09 Spud +100 MMBOE Salida Drilling +100 MMBOE Friesian Status Net Potential

Slide 25: +2.15 Billion BOE Resource Potential
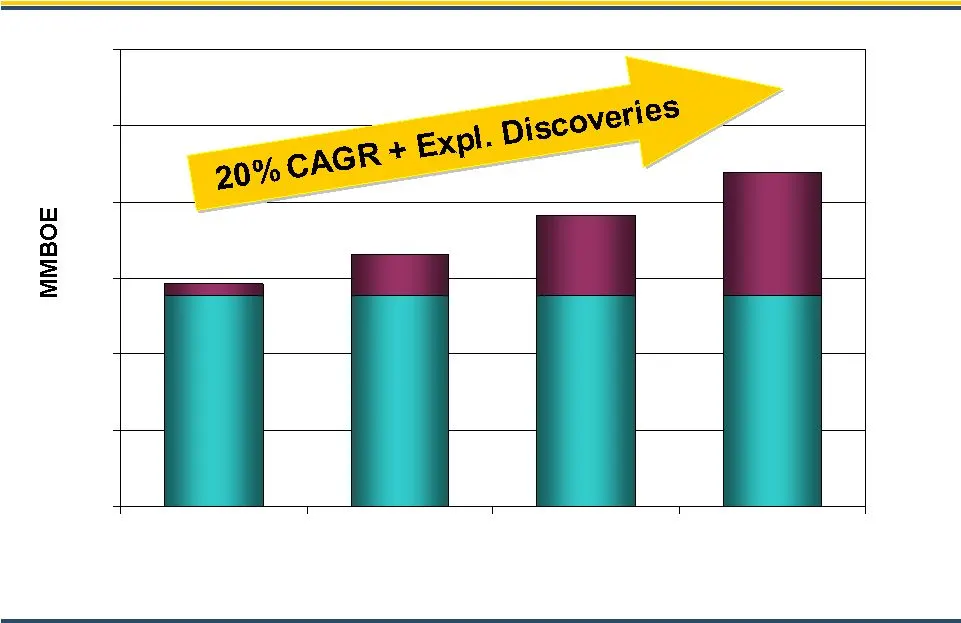
950 MMBOE 275 MMBOE 100 MMBOE 20 MMBOE 10 MMBOE Haynesville California Panhandle/S. TX Gulf of Mexico Rockies 750 MMBOE 100 MMBOE Gulf of Mexico Vietnam +2.15 Billion BOE Resource Potential Potential Reserves ~1.3 Billion BOE Development Resource Potential Region ~850 Million BOE Exploration Resourc
Slide 26: Proved Reserves Target Growth
277 15 H - Ville 54 H-Ville 297 104 H-Ville 317 162 H-Ville 338 Total Adds 100 Total Adds 88 Total Adds 110 Proved Reserves Target Growth $55.00 & $5.50 Flat NYMEX Pricing (1) (1) (1) (1) Illustrates estimated reserves using NYMEX pricing and recent historical average differentials of 15%.

Slide 27: PXP Targets Over Next Years
PXP Targets Over Next 5 Years • Double reserves of Company resulting in +20% average per year reserve growth from existing asset portfolio • Grow production 50% over the next 5 years • Efficiently manage business focusing on cost reduction and profitability • Maintain conservative balance sheet with

Slide 28: Addendum
Addendum

Slide 29: Continued Commodity Price Protection
Continued Commodity Price Protection Financial Settlement Derivatives Henry Hub $0.346 $10.00 Floor by $20.00 Ceiling 150,000 MMBtu Collars Jan – Dec 2009 WTI $3.38 $55.00 Strike Price 32,500 Bbls Put Options Jan – Dec 2009 $0.034 $5.00 AVERAGE DEFERRED PREMIUM INDEX AVERAGE PRICE DAILY VOLUME TYPE

Slide 30: Income Statement Summary
Income Statement Summary - 4.5 Other Operating Expenses 3,629.7 - Impairment of Oil & Gas Properties $ (6.52) $ 0.05 Earnings (Loss) Per Share - diluted $ (709.1) $ 5.2 Net Income (Loss) (1) (1,153.6) 34.9 Income (Loss) Before Income Tax (2,627.4) (20.3) Income (Loss) From Operations 621.5 91.7 DD&A

Slide 31: IPAA/OGIS London Conference
June IPAA/OGIS London Conference
Source: SEC EDGAR · 8-K filed May 28, 2009
More decks from Plains Exploration & Production Company
 Global Metals, Mining & Steel Conference 201333 slides · May 14, 2013
 Q1 2013 Earnings Presentation46 slides · Apr 19, 2013
 Merger or Acquisition (February 2013)35 slides · Feb 25, 2013
 2013 Credit Suisse Energy Summit10 slides · Feb 5, 2013
 Merger or Acquisition (January 2013)30 slides · Jan 17, 2013
 Credit Suisse 2012 Energy Summit32 slides · Feb 7, 2012