Bryn Mawr Bank — Q3 2009 Earnings Presentation
37 slides from Bryn Mawr Bank's earnings presentation, Nov 24, 2009
Slide 1: Bryn Mawr Bank Corporation Third Quarter 2009 Update
Bryn Mawr Bank Corporation NASDAQ: BMTC Third Quarter 2009 Update Exhibit 99.1

Slide 2: Safe Harbor
This presentation contains certain forward-looking statements. Forward-looking statements can be identified by the fact that they do not relate strictly to historical or current facts. They often include the words believe, expect, anticipate, intend, plan, estimate or words of similar meaning. Forwa

Slide 3: Bryn Mawr Bank Corporation Profile
Bryn Mawr Bank Corporation Profile Founded in 1889 – 120 year history A unique business model with a traditional commercial bank ($1.2 billion) and a trust company ($2.7 billion) under one roof Wholly owned subsidiary – The Bryn Mawr Trust Company Located on Philadelphia’s affluent “Main Line”
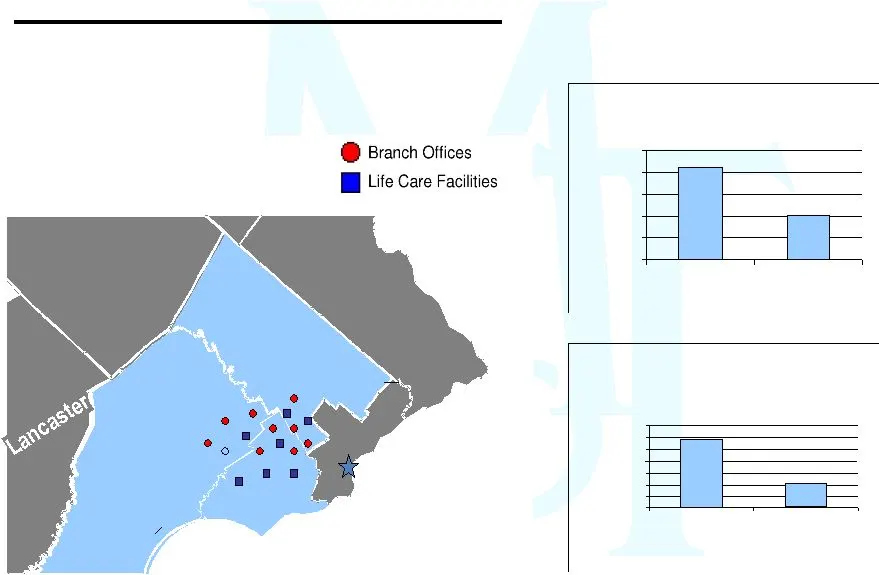
Slide 4: The Franchise Footprint
Chester Bucks Montgomery Berks Delaware State of Delaware Philadelphia New Jersey New Jersey The Franchise Footprint 9 Full Service Branches/ 7 Life Care Facilities Source: Public School Review Average Household Income $84,600 $41,000 $- $20,000 $40,000 $60,000 $80,000 $100,000 BMTC Target Market Pe

Slide 5: Investment Considerations
Investment Considerations A great brand & franchise Solid financial fundamentals Excellent overall credit quality Outstanding target market demographics New business initiatives driving growth Well-capitalized

Slide 6

Slide 7: 2008 Results / 2009 Results (YTD)
2008 Results Leasing portfolio provision Mortgage servicing rights impairment Margin contraction Financial market impact on Wealth Management Revenue 2009 Results (YTD) Robust in-market residential mortgage originations Strong rebound in wealth management assets: $2.7 billion Stable margin: 3.64% (Q

Slide 8: 2009 Strategies
2009 Strategies Increase the net interest margin Credit quality Control expenses Use banking industry turmoil to attract new clients Opportunistic expansion Raise capital as needed
Slide 9: New Business Initiatives
New Business Initiatives

Slide 10: Growth Initiatives
BMTC of Delaware opened (4 th Qtr 2008) The Delaware Advantage Generation Skipping Trusts Directed Trusts $333 million in assets at 9/30/2009 West Chester, PA Regional Banking Office Branch, loan center, and wealth office Opened 1/02/2009 Preceded by loan production office $19 million in deposits at

Slide 11: Acquisition Initiatives
Announced acquisition of First Keystone Financial, Inc. (11/2/2009) $525 million in assets Expands footprint in Delaware and Chester counties with 8 branches Bryn Mawr Asset Management “Lift out” strategy Three investment advisers hired, $90 million in new assets Additional opportunities being evalu

Slide 12: First Keystone Financial, Inc. – Transaction Summary
First Keystone Financial, Inc. – Transaction Summary Acquiror: Bryn Mawr Bank Corporation (NASDAQ: BMTC) Seller: First Keystone Financial, Inc. (NASDAQ: FKFS) Consideration: Each share of FKFS common stock will be exchanged for 0.6973 BMTC shares (1) and $2.06 in cash Transaction Value: $34 million

Slide 13: First Keystone Financial Inc. – Transaction Highlights
First Keystone Financial Inc. - Transaction Highlights Expands branch footprint into the attractive demographic markets of Delaware and Chester County, Pennsylvania Important component of strategic plan Enhances long-term franchise value Complementary business mix Both banks have a “community focus”
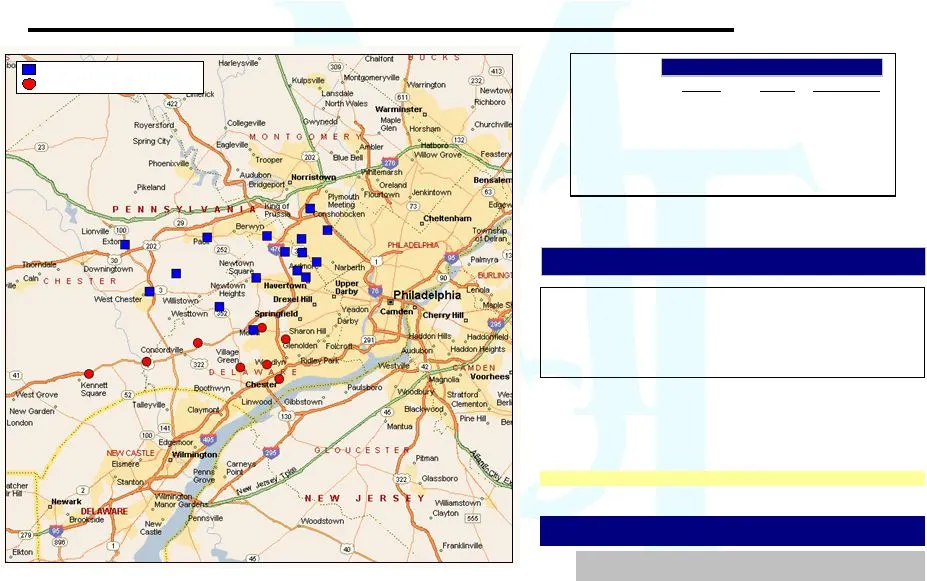
Slide 14: Expanding Southeast PA Footprint: Pro Forma Deposit Market Share
Pro Forma Deposit Market Share – Delaware County, PA 9 First Keystone Financial (PA) 7 337 3.2 10 Bryn Mawr Bank Corp. (PA) 7 226 2.1 Pro Forma Financials Source: SNL Financial Pro forma financials do not include merger adjustments BMTC data as of 9/30/2009; FKFS data as of 6/30/2009 (1) Includes 7
Slide 15: Pro Forma Loans and Deposits
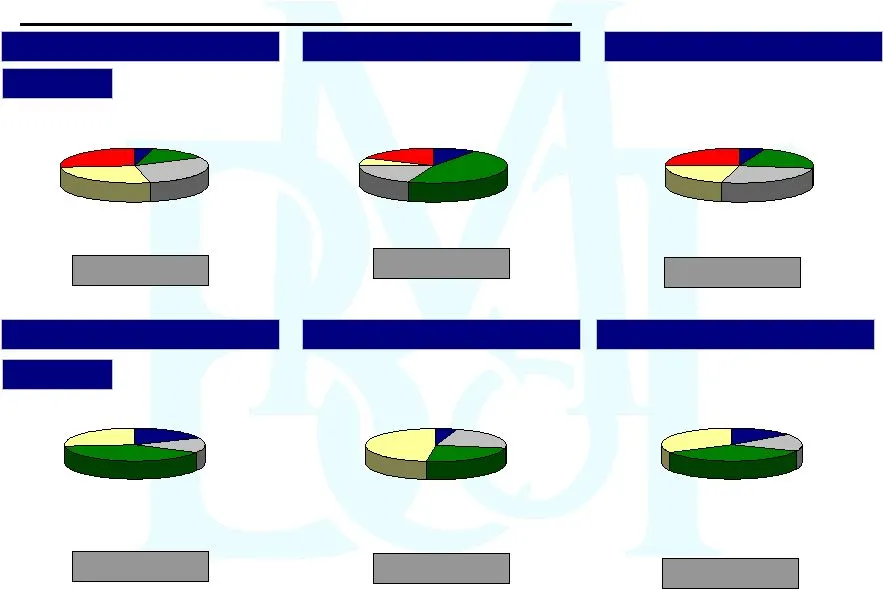
Deposits Loans BMTC Stand Alone Total: $886M Total: $1.2B Total: $899M Total: $1.3B Total: $317M Total: $354M BMTC Stand Alone FKFS Stand Alone BMTC Pro Forma FKFS Stand Alone BMTC Pro Forma Time Deposits 32.7% NOW & Other Trans. Accts. 16.7% MMDA, Savings, & Other 35.8% Demand Deposits 14.8% Consum

Slide 16: First Keystone Financial Inc. – Due Diligence
First Keystone Financial Inc. - Due Diligence Extensive due diligence conducted by BMTC and third parties over the past month Conducted extensive credit diligence BMTC and third party loan review Reviewed over 65% of commercial portfolio (CRE, C&I, and Construction) Multiple Construction / Commercia
Slide 17: Financial Review
Financial Review Bryn Mawr Bank Corporation Only As of 9/30/2009
Slide 18: Diluted Earnings Per Share
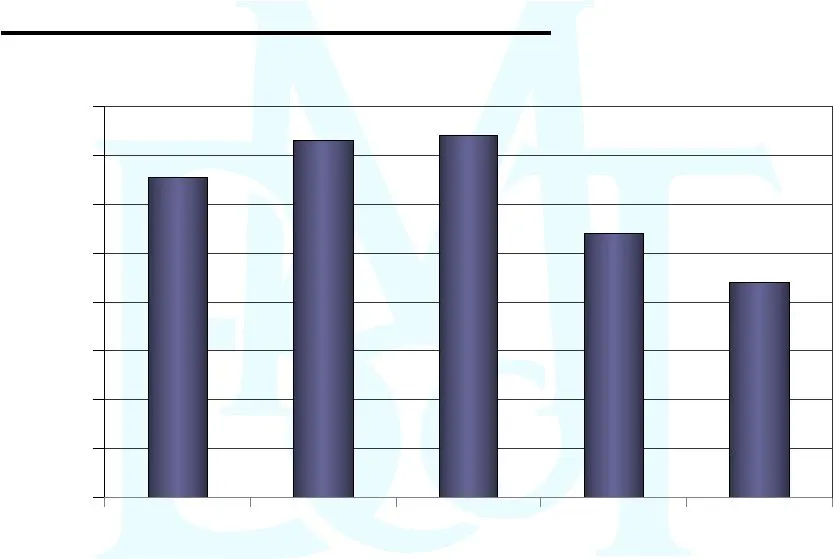
Diluted Earnings Per Share (1) Excludes $0.10 per share gain on sale of real estate (2) As of September 30, 2009 $1.46 $1.31 $1.48 $1.08 $0.88 $0.00 $0.20 $0.40 $0.60 $0.80 $1.00 $1.20 $1.40 $1.60 2007 (1) 2009 (2)
Slide 19: Portfolio Loan & Lease Growth
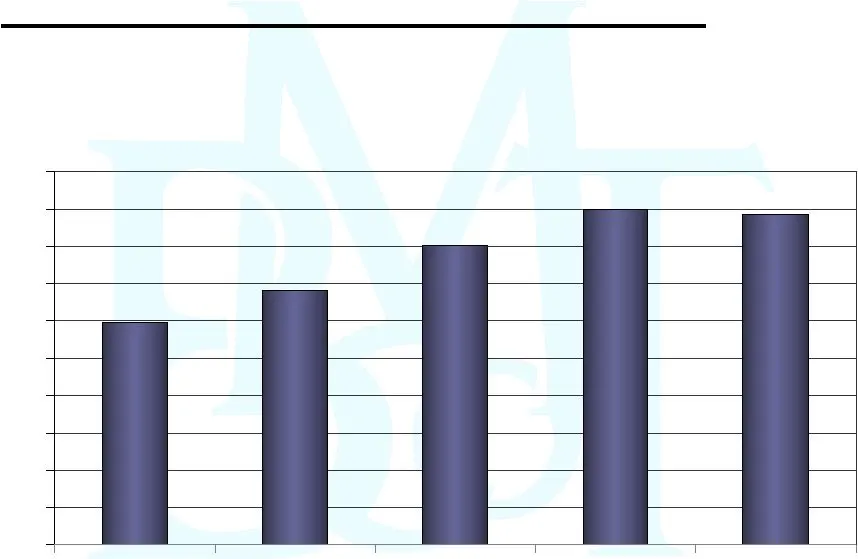
Portfolio Loan & Lease Growth Total Portfolio Loans & Leases Outstanding ($ in millions) CAGR 14.8% (2005 - 2008) 1) As of September 30, 2009 $595 $681 $803 $900 $887 $0 $100 $200 $300 $400 $500 $600 $700 $800 $900 $1,000 2009 (1)
Slide 20: Strong Asset Quality
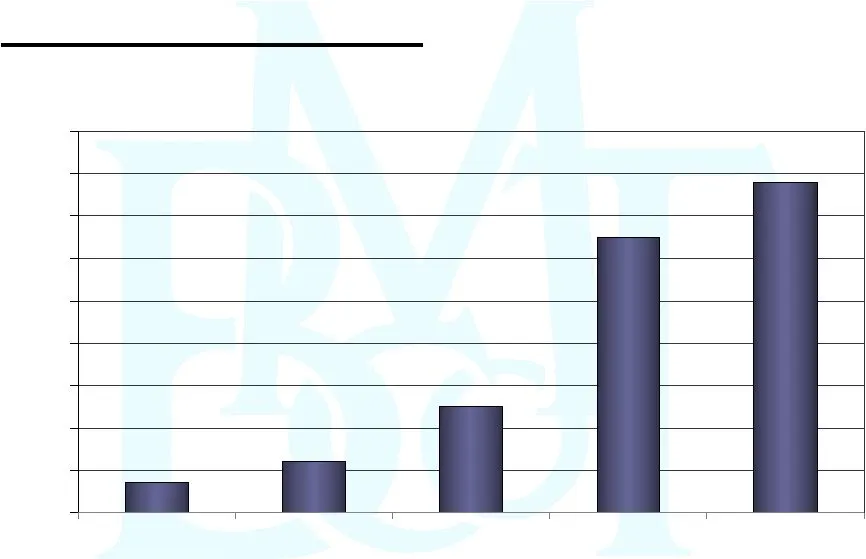
Strong Asset Quality Nonperforming Loans and Leases 1) As of September 30, 2009 0.07% 0.12% 0.25% 0.65% 0.78% 0.0% 0.1% 0.2% 0.3% 0.4% 0.5% 0.6% 0.7% 0.8% 0.9% 2009 (1)
Slide 21: Loan Composition at September 30, 2009
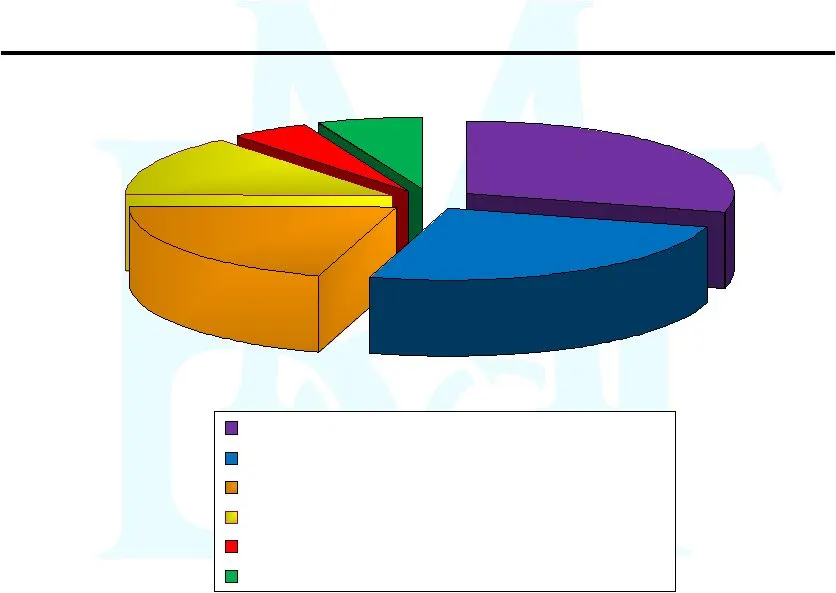
Loan Composition at September 30, 2009 ($ in millions) Commercial Mortgages Commercial & Industrial Home Equity Lines & Loans & Consumer Loans Residential Mortgages Construction Leases $256 $237 $187 $118 $37 $

Slide 22: Small Ticket National Leasing Business
Small Ticket National Leasing Business “ Lift out ” strategy Leases outstanding: $51.8 million at 9/30/2009 Average yield 10.54% Experiencing credit issues at this time Charge-offs have decreased gradually since 12/31/2008 Changes made in underwriting standards and collection process Lease portfolio
Slide 23: Net Interest Income
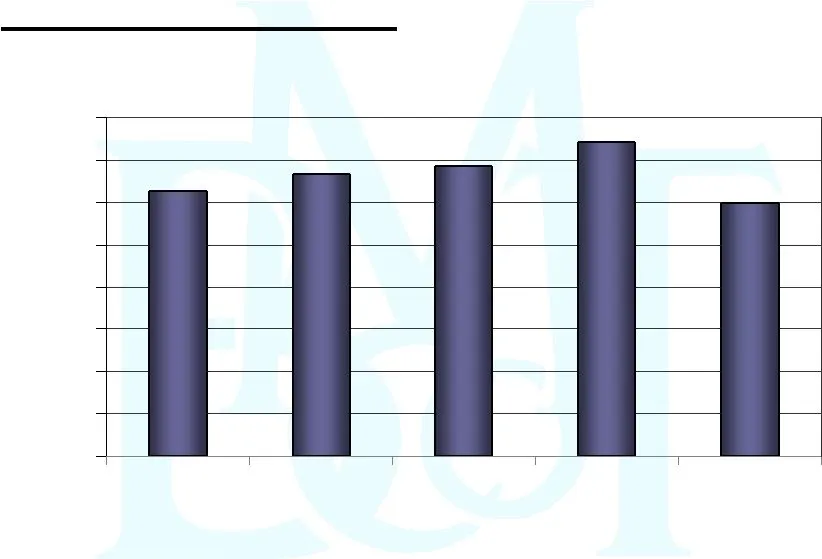
$31.3 $33.3 $34.2 $37.1 $29.9 $0 $5 $10 $15 $20 $25 $30 $35 $40 2009 (1) Net Interest Income CAGR 5.8% (2005-2008) 1) As of September 30, 2009 Note: Not on a tax-equivalent basis ($ in millions)
Slide 24: Net Interest Margin
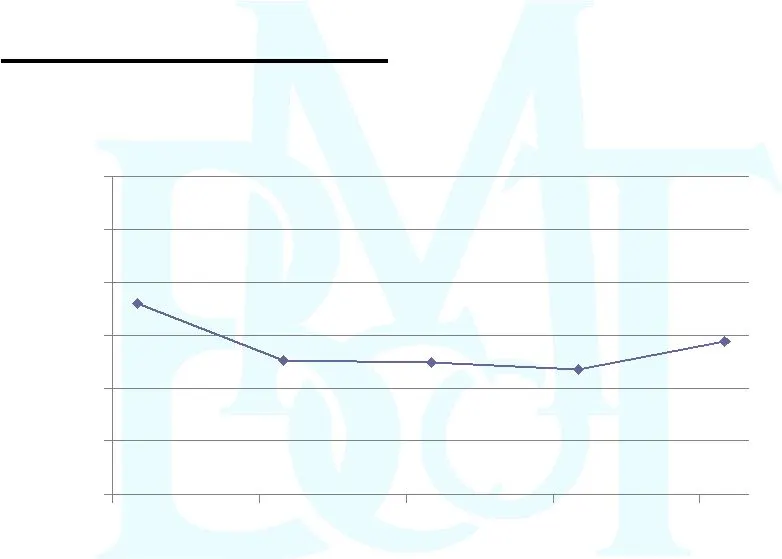
Net Interest Margin On a tax equivalent basis 3.90% 3.63% 3.62% 3.59% 3.64% 3.0% 3.3% 3.5% 3.8% 4.0% 4.3% 4.5% Sep-08 Dec-08 Mar-09 Jun-09 Sep-09
Slide 25: Deposit Growth
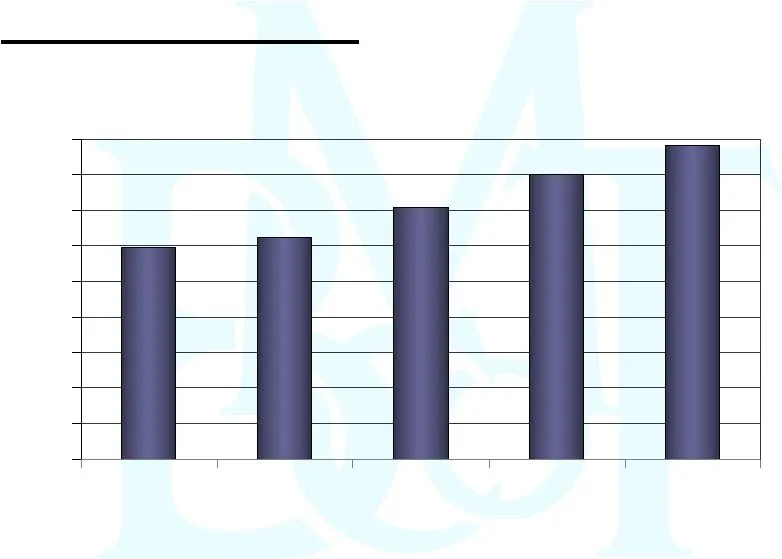
Deposit Growth Average Annual Deposits ($ in millions) 1) As of September 30, 2009 $596 $626 $709 $798 $881 $0 $100 $200 $300 $400 $500 $600 $700 $800 $900 2009 (1)
Slide 26: Average Deposits & Borrowed Funds Mix
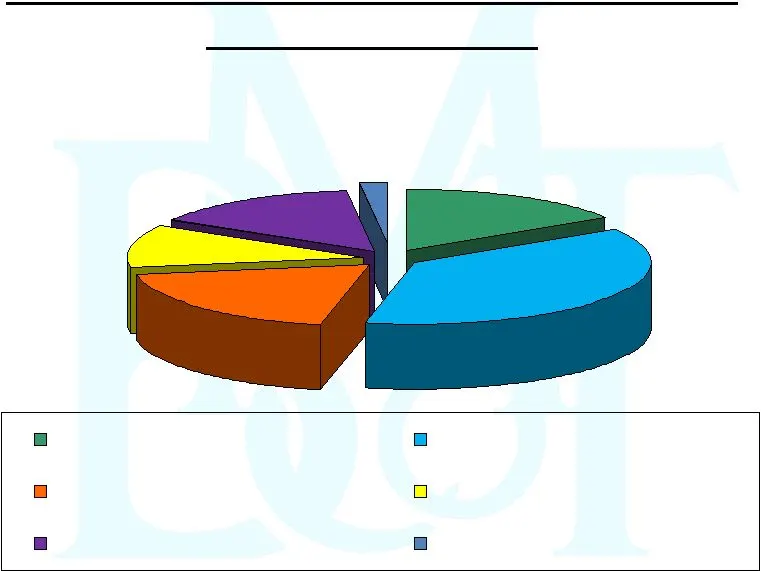
Average Deposits & Borrowed Funds Mix Third Quarter 2009 ($ in millions) $20 $168 $394 $199 $120 $151 Non-Interest Bearing DDA Savings, NOW & Money Market Time Deposits Wholesale Deposits, IND & IDC Borrowed Funds Subordinated Debt

Slide 27: Wholesale Funding Totals
Wholesale Funding Totals Type September 30, % of Wholesale Funding December 31, % of Wholesale Funding Wholesale CD $ 23.9 9.0% $ 51.3 16.8% PLIGIT - - 40.0 13.1 FHLB Advances 147.4 55.5 154.9 50.7 CDARS 40.8 15.3 29.1 9.5 IND/IDC 53.8 20.2 30.5 10.0 Total Wholesale Funding $ 265.9 100.0% $ 305.8 10

Slide 28: Additional Funding Sources at September 30, 2009
Additional Funding Sources at September 30, 2009 $ in millions Available Used Fed Funds Line of Credit (7 Banks) $ 75 $ 0 FHLB of Pittsburgh* $ 411 $147 Federal Reserve Bank – Discount Window Program $ 75 $ 0 Total $ 561 $ 147 Total (Percentage) 100% 26% * Additional FHLB of Pittsburgh common stock

Slide 29: Investment Portfolio as of September 30, 2009
Investment Portfolio as of September 30, 2009 ($ in thousands) Amortized Fair Unrealized SECURITY DESCRIPTION (AFS) Cost Value Gain / Loss U. S. Government Agency $ 55,159 $ 55,242 $ State, County & Municipal 24,628 25,094 FNMA/FHLMC Mortgage Backed Securities 52,963 54,826 1,863 GNMA Mortgage Backe

Slide 30: Capital Considerations
Capital Considerations Bryn Mawr Bank Corporation elected not to take TARP Capital Maintains a “well capitalized” capital position Selectively add capital as needed to fund growth and acquisitions Three additional earn out payments for Lau Associates at the end of 2009, 2010 and 2011 Active Dividend

Slide 31: Capital Position - Bryn Mawr Bank Corporation
Capital Position - Bryn Mawr Bank Corporation Regulatory Minimum to be Well Capitalized Actual 9/30/2009 Tier I 6.00% 9.36% Total (Tier II) 10.00% 12.49% Tier I Leverage 5.00% 8.39% Common Equity - 8.54% Tangible Common Equity - 7.74%

Slide 32: Capital Position - Bryn Mawr Trust Company
Capital Position - Bryn Mawr Trust Company (“Bank”) Regulatory Minimum to be Well Capitalized Actual 9/30/2009 Tier I 6.00% 8.91% Total (Tier II) 10.00% 12.06% Tier I Leverage 5.00% 7.98%

Slide 33: Capital Raised in 2009
Capital Raised in 2009 $7.5 million in subordinated debt in April 2009 (Tier Two) $2.5 million in common stock in April 2009 DRIP/DSPP to provide an incremental stream of capital
Slide 34: Assets Under Management, Administration, Supervision and Brokerage
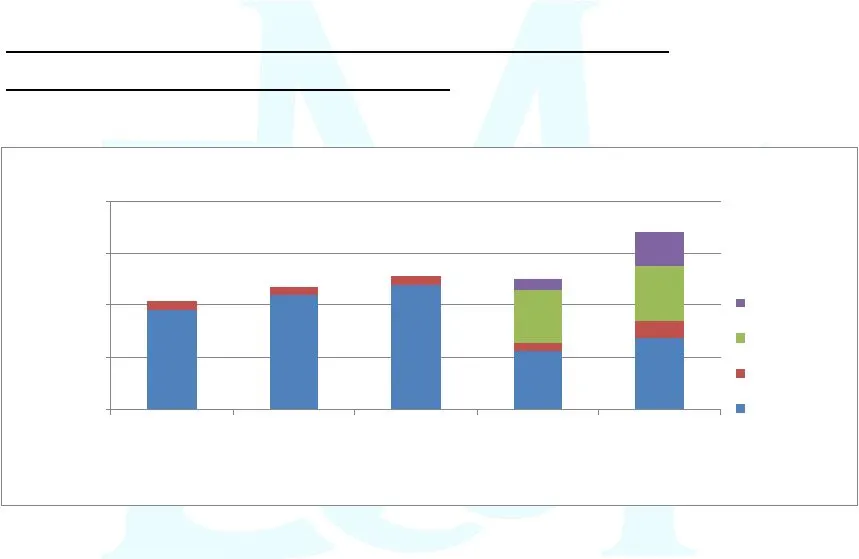
$2.04 $2.18 $2.28 $2.26 $2.71 $1.0 $1.5 $2.0 $2.5 $3.0 2009 (1) BMT DE Lau Associates Brokerage Wealth Division Assets Under Management, Administration, Supervision and Brokerage (2) ($ in billions) (1) As of September 30, 2009 (2) Excludes Community Banks 2005 -
Slide 35: Wealth Management Fees
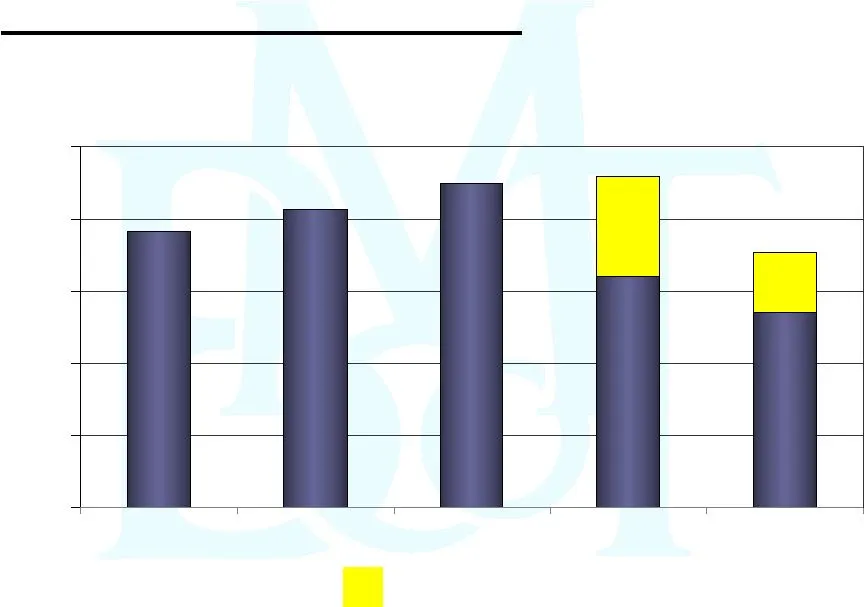
Wealth Management Fees ($ in millions) Lau Associates ( 1) As of September 30, 2009 $11.5 $12.4 $13.5 $13.8 $10.6 $0 $3 $6 $9 $12 $15 2009 (1) CAGR 6.3% 2005 – 2008

Slide 36: Summary
Summary Outstanding franchise in a vibrant, growing market Focus on Wealth Services, Business Banking, and Private Banking Investing in growth opportunities today for earnings growth tomorrow Announced acquisition will expand footprint Solid 2009 Strategy to succeed in current economic recession

Slide 37: Thank You
Thank You Joseph Keefer, EVP 610- 581- jkeefer@bmtc.com Duncan Smith, CFO 610- 526 – jdsmith@bmtc.com Ted Peters, Chairman 610-581-4800 tpeters@bmtc.com Frank Leto, EVP 610-581-4730 fleto@bmtc.com
Source: SEC EDGAR · 8-K filed Nov 24, 2009
More decks from Bryn Mawr Bank Corporation
 Merger or Acquisition (March 2021)20 slides · Mar 10, 2021
 Q4 2020 Earnings Presentation16 slides · Jan 22, 2021
 Q3 2020 Earnings Presentation14 slides · Oct 23, 2020
 Investor Presentation (September 2020)17 slides · Sep 21, 2020
 Q2 2020 Earnings Presentation14 slides · Jul 21, 2020
 Q1 2020 Earnings Presentation13 slides · Apr 21, 2020