Tellurian — Investor Presentation (August 2019)
33 slides from Tellurian's investor presentation, Aug 7, 2019
Slide 1: Corporate presentation August 2019
Corporate presentation August 2019
Slide 2: Cautionary statements
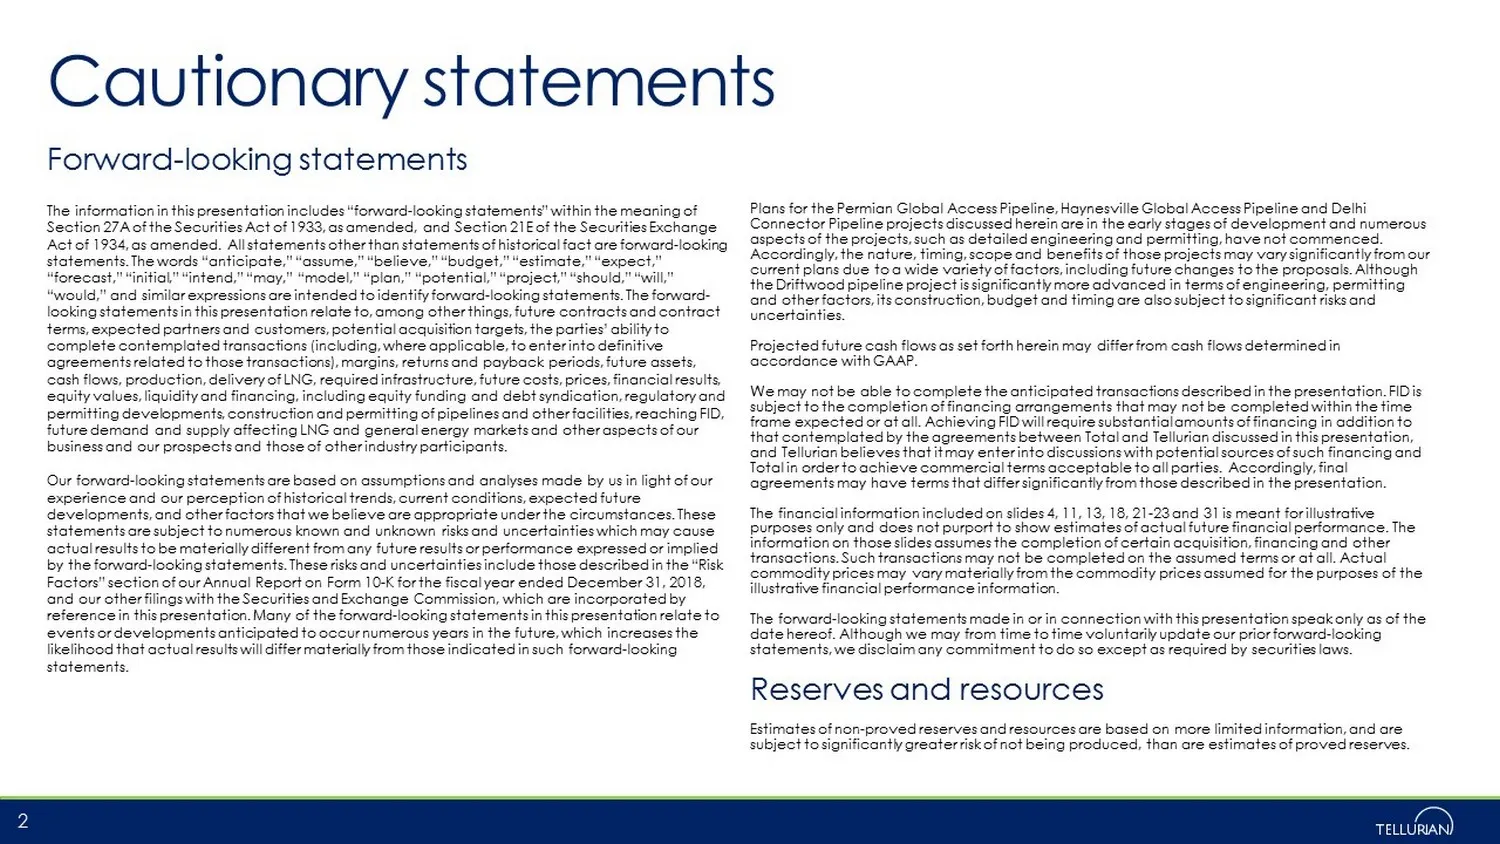
Cautionary statements The information in this presentation includes “forward - looking statements” within the meaning of Section 27A of the Securities Act of 1933, as amended, and Section 21E of the Securities Exchange Act of 1934, as amended. All statements other than statements of historical fact

Slide 3: Corporate updates
Corporate updates 3
Slide 4: Tellurian value proposition
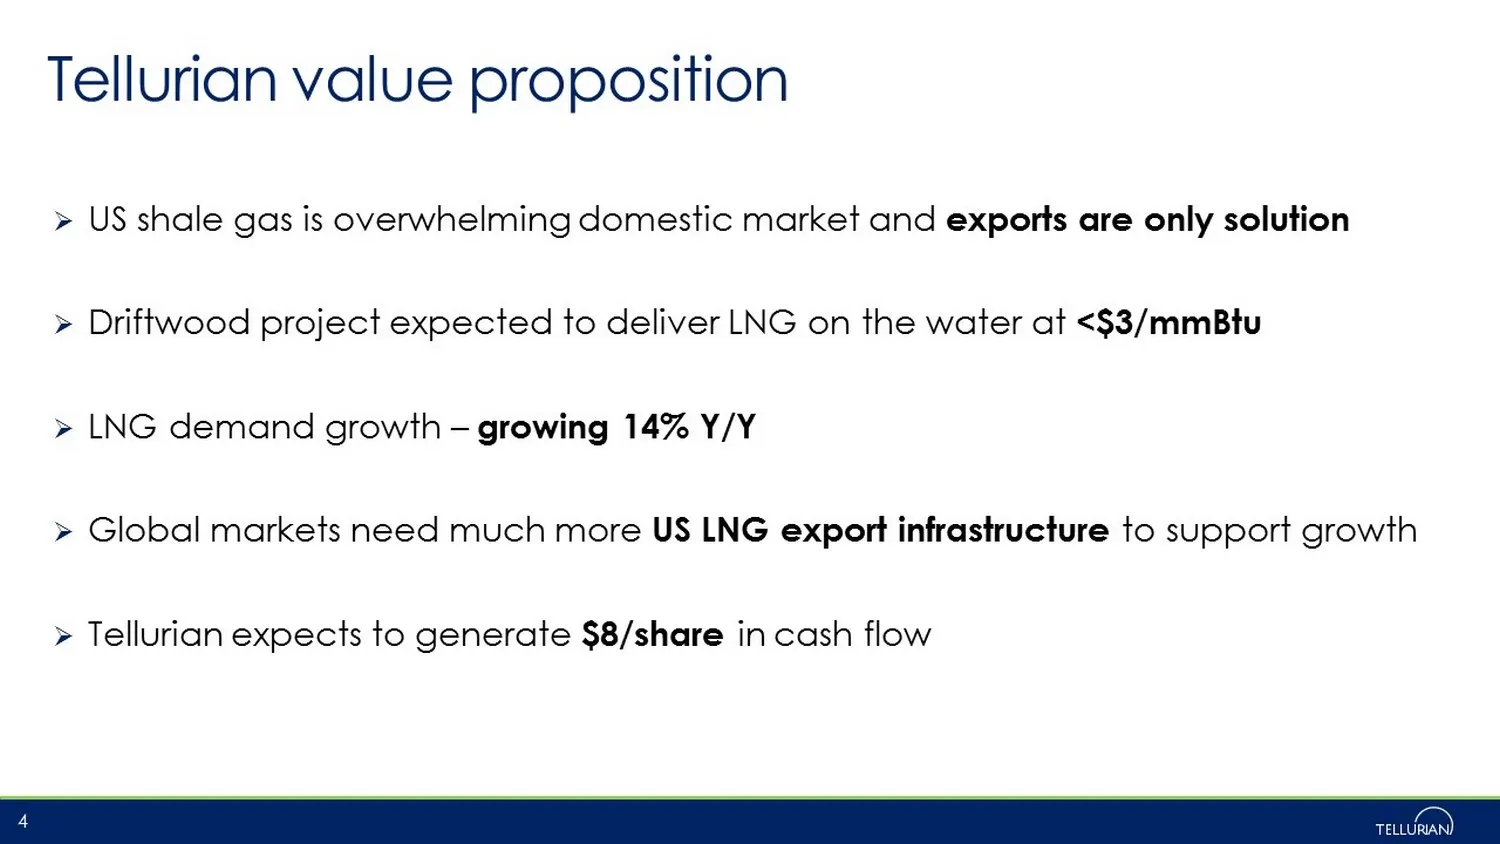
Tellurian value proposition 4 » US shale gas is overwhelming domestic market and exports are only solution » Driftwood project expected to deliver LNG on the water at <$3/mmBtu » LNG demand growth – growing 14% Y/Y » Global markets need much more US LNG export infrastructure to support growth » Tell
Slide 5: U.S. natural gas export requirements
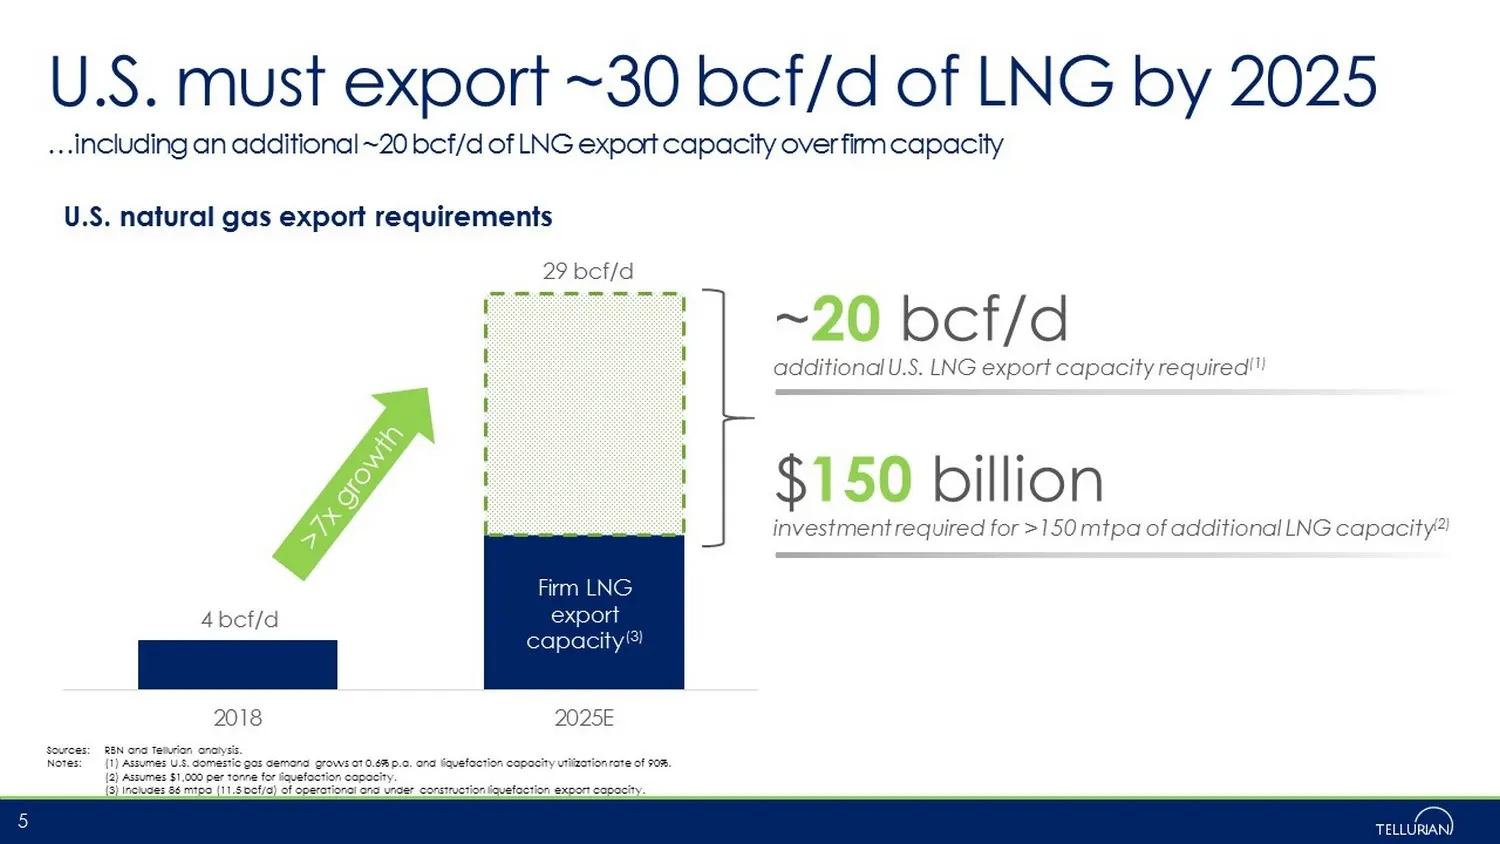
2018 2025E 4 bcf/d 29 bcf/d ~ 20 bcf/d additional U.S. LNG export capacity required (1) U.S. must export ~30 bcf/d of LNG by 2025 Sources: RBN and Tellurian analysis. Notes: (1) Assumes U.S. domestic gas demand grows at 0.6% p.a. and liquefaction capacity utilization rate of 90%. (2) Assumes $1,000
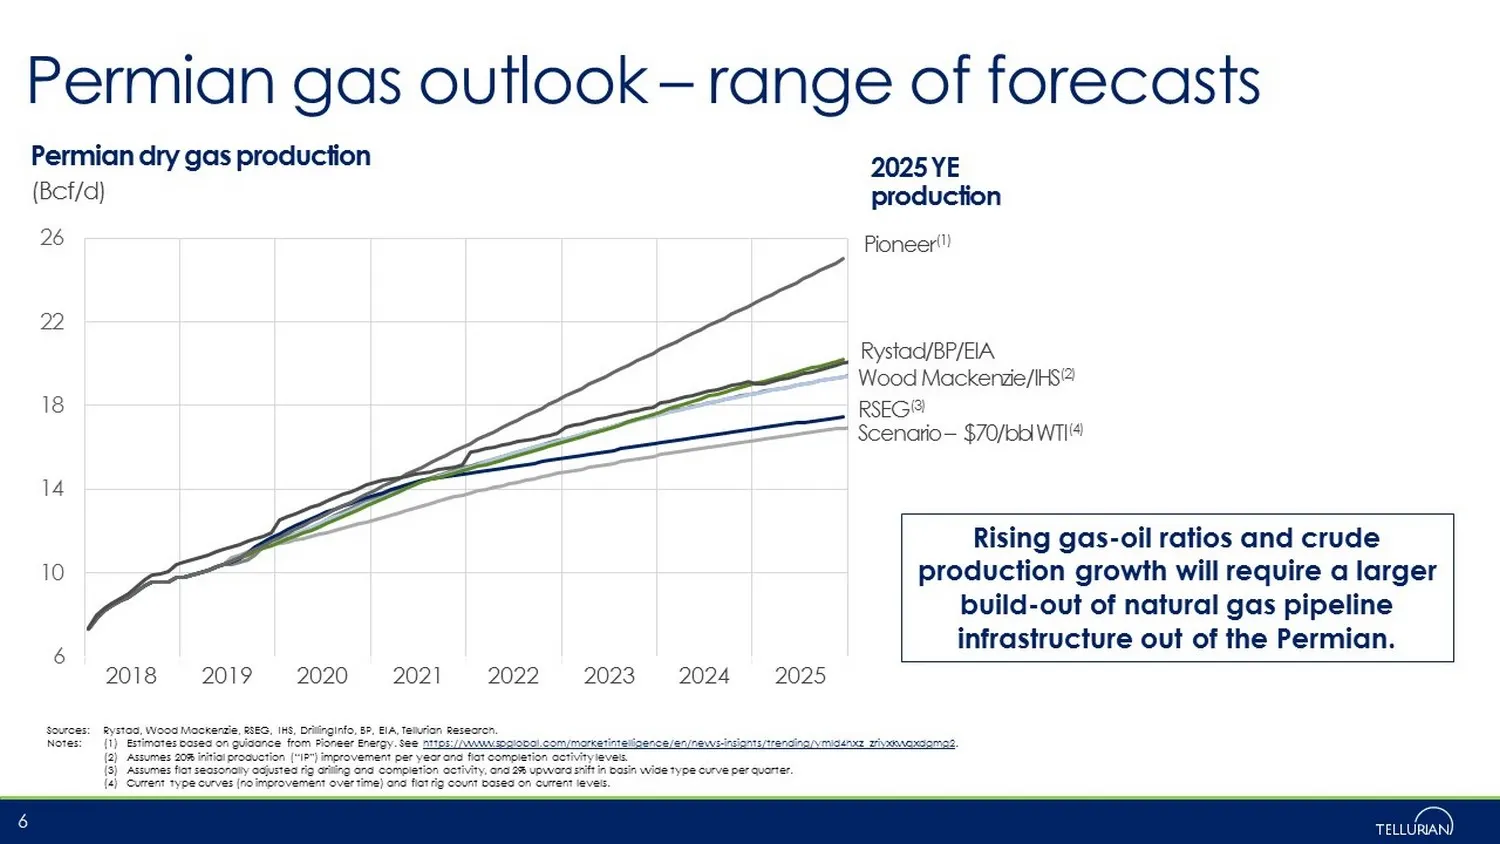
Slide 6: Permian gas outlook – range of forecasts
6 10 14 18 22 26 2018 2019 2020 2021 2022 2023 2024 2025 Permian gas outlook – range of forecasts Sources: Rystad , Wood Mackenzie, RSEG, IHS, DrillingInfo, BP, EIA, Tellurian Research. Notes: (1) Estimates based on guidance from Pioneer Energy. See https://www.spglobal.com/marketintelligence/en/new
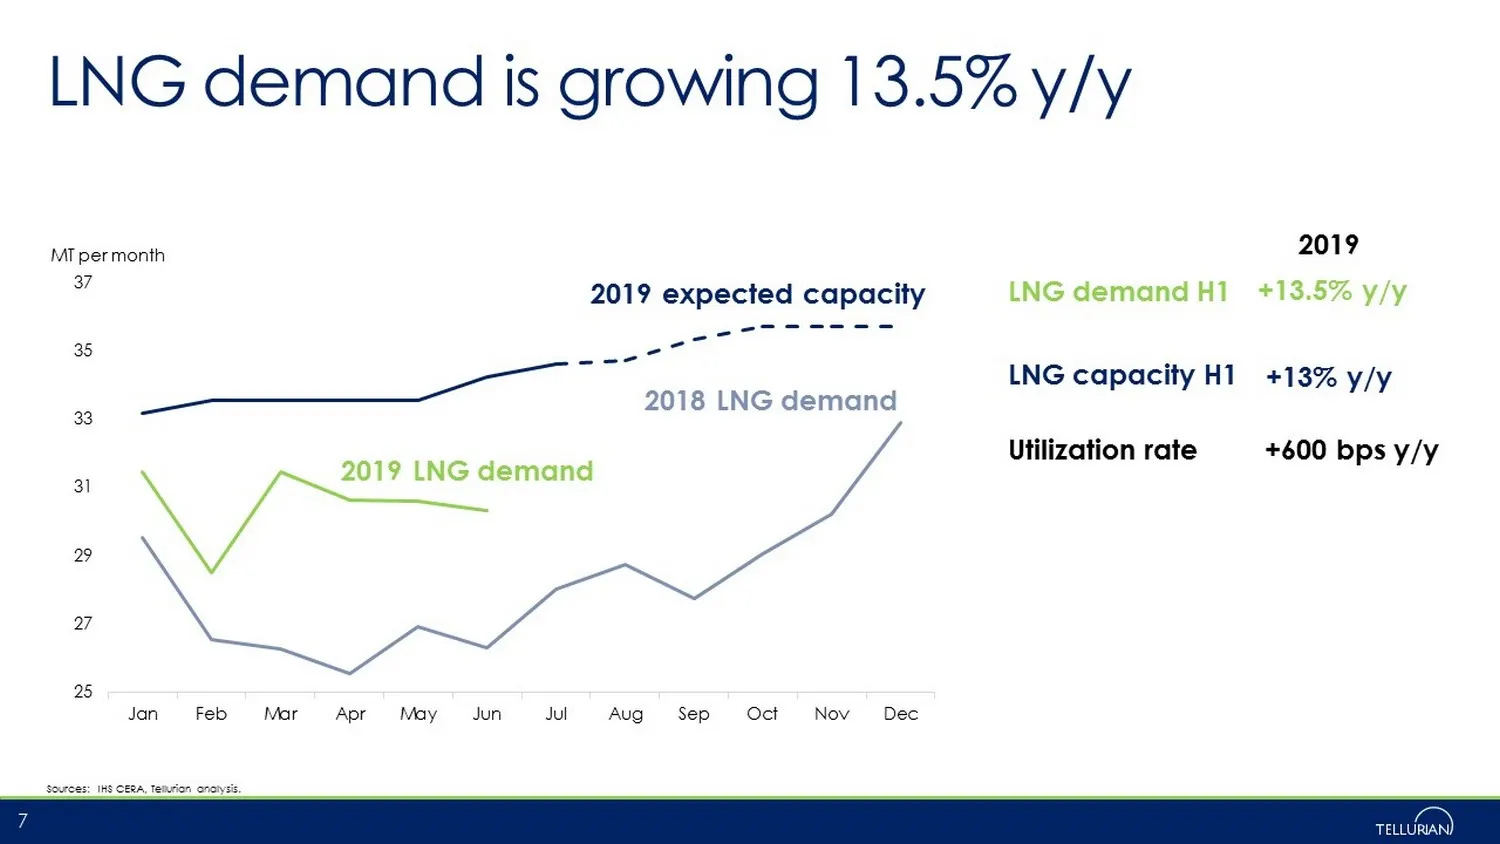
Slide 7: LNG demand is growing 13.5% y/y
LNG demand is growing 13.5% y/y 25 27 29 31 33 35 37 Jan Feb Mar Apr May Jun Jul Aug Sep Oct Nov Dec MT per month Sources: IHS CERA, Tellurian analysis. 7 2019 expected capacity 2018 LNG demand 2019 LNG demand +13.5% y/y LNG demand H1 LNG capacity H1 +13% y/y Utilization rate +600 bps y/y 2019
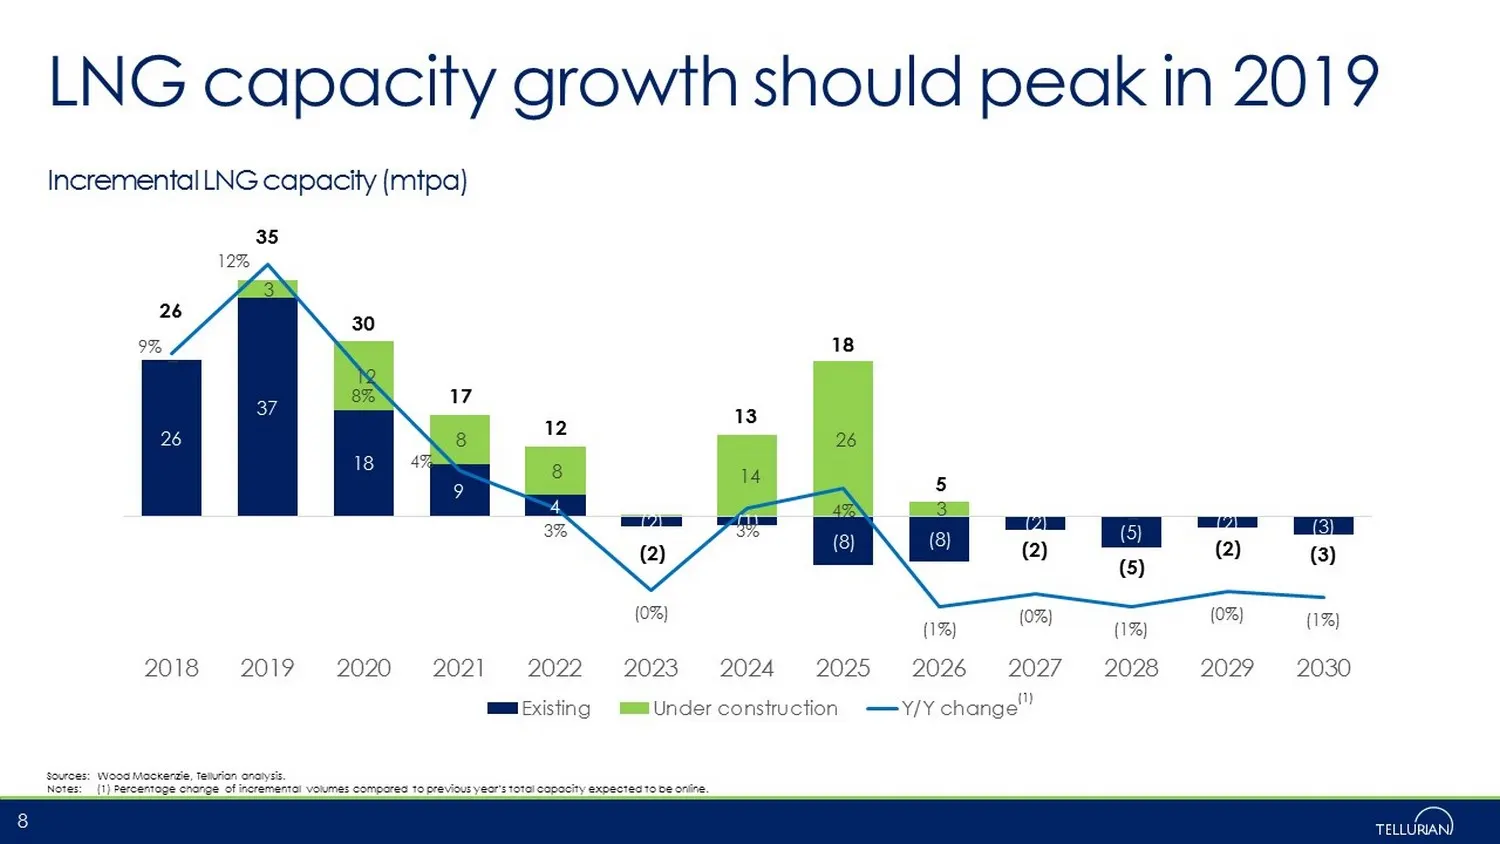
Slide 8: LNG capacity growth should peak in 2019
LNG capacity growth should peak in 2019 Incremental LNG capacity (mtpa) Sources: Wood Mackenzie, Tellurian analysis. Notes: (1) Percentage change of incremental volumes compared to previous year’s total capacity expected to be online. 8 26 37 18 9 4 (2) (1) (8) (8) (2) (5) (2) (3) – 3 12 8 8 14 26 3
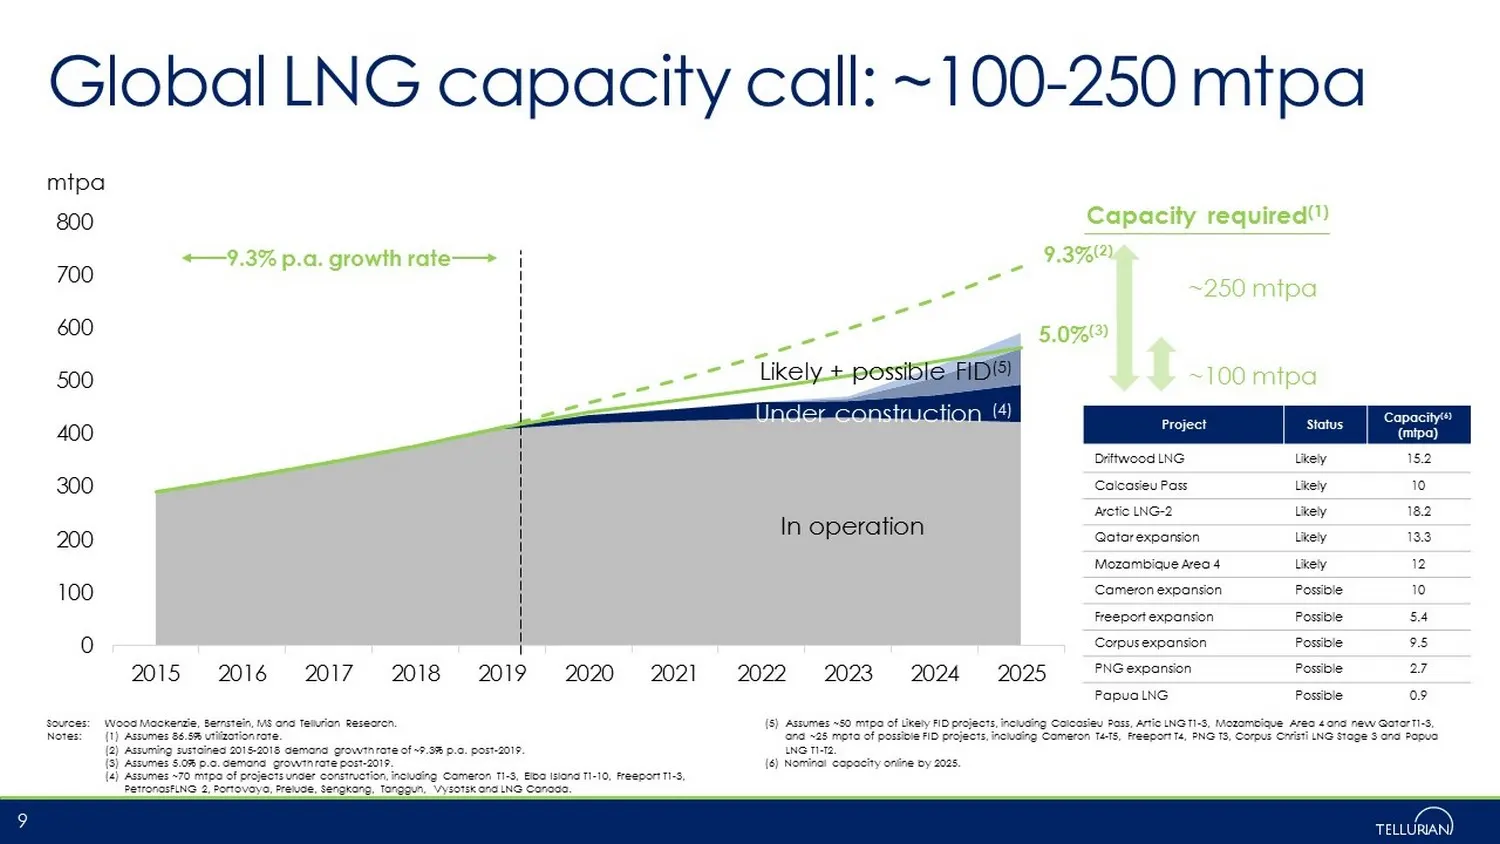
Slide 9: Global LNG capacity call: ~100-250 mtpa
0 100 200 300 400 500 600 700 800 2015 2016 2017 2018 2019 2020 2021 2022 2023 2024 2025 Likely + possible FID (5) Global LNG capacity call: ~100 - 250 mtpa Sources: Wood Mackenzie, Bernstein, MS and Tellurian Research. Notes: (1) Assumes 86.5% utilization rate. (2) Assuming sustained 2015 - 2018 de
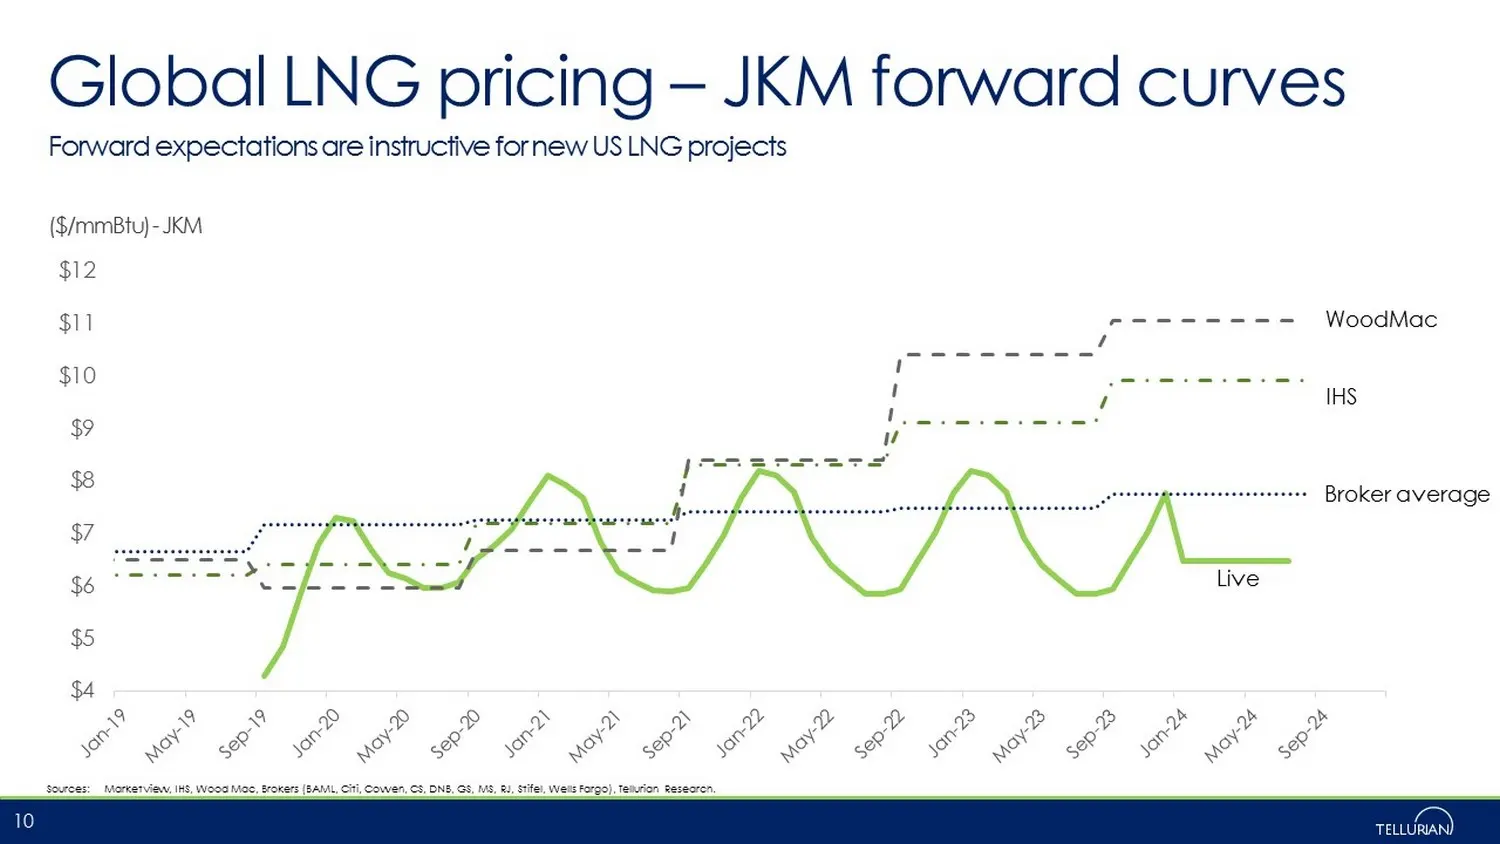
Slide 10: Global LNG pricing – JKM forward curves
Global LNG pricing – JKM forward curves Sources: Marketview, IHS, Wood Mac, Brokers (BAML, Citi, Cowen, CS, DNB, GS, MS, RJ, Stifel, Wells Fargo), Tellurian Research. 10 ($/mmBtu) - JKM Forward expectations are instructive for new US LNG projects Live Broker average IHS WoodMac $4 $5 $6 $7 $8 $9 $10
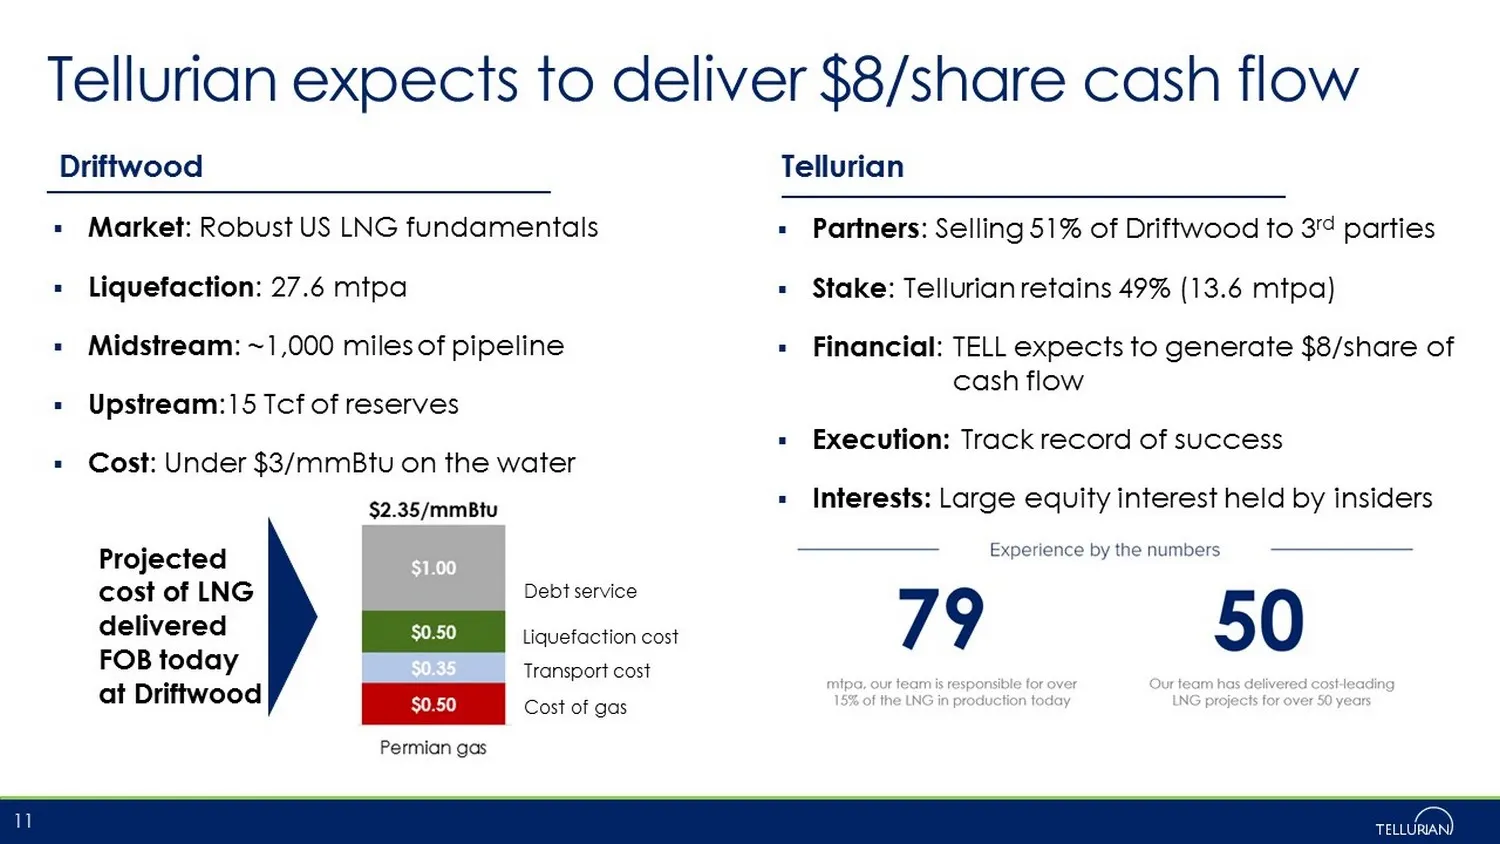
Slide 11: Tellurian expects to deliver $8/share cash flow
Tellurian expects to deliver $8/share cash flow 11 ▪ Market : Robust US LNG fundamentals ▪ Liquefaction : 27.6 mtpa ▪ Midstream : ~1,000 miles of pipeline ▪ Upstream :15 Tcf of reserves ▪ Cost : Under $3/mmBtu on the water ▪ Partners : Selling 51% of Driftwood to 3 rd parties ▪ Stake : Tellurian ret

Slide 12: Project overview
Project overview 12
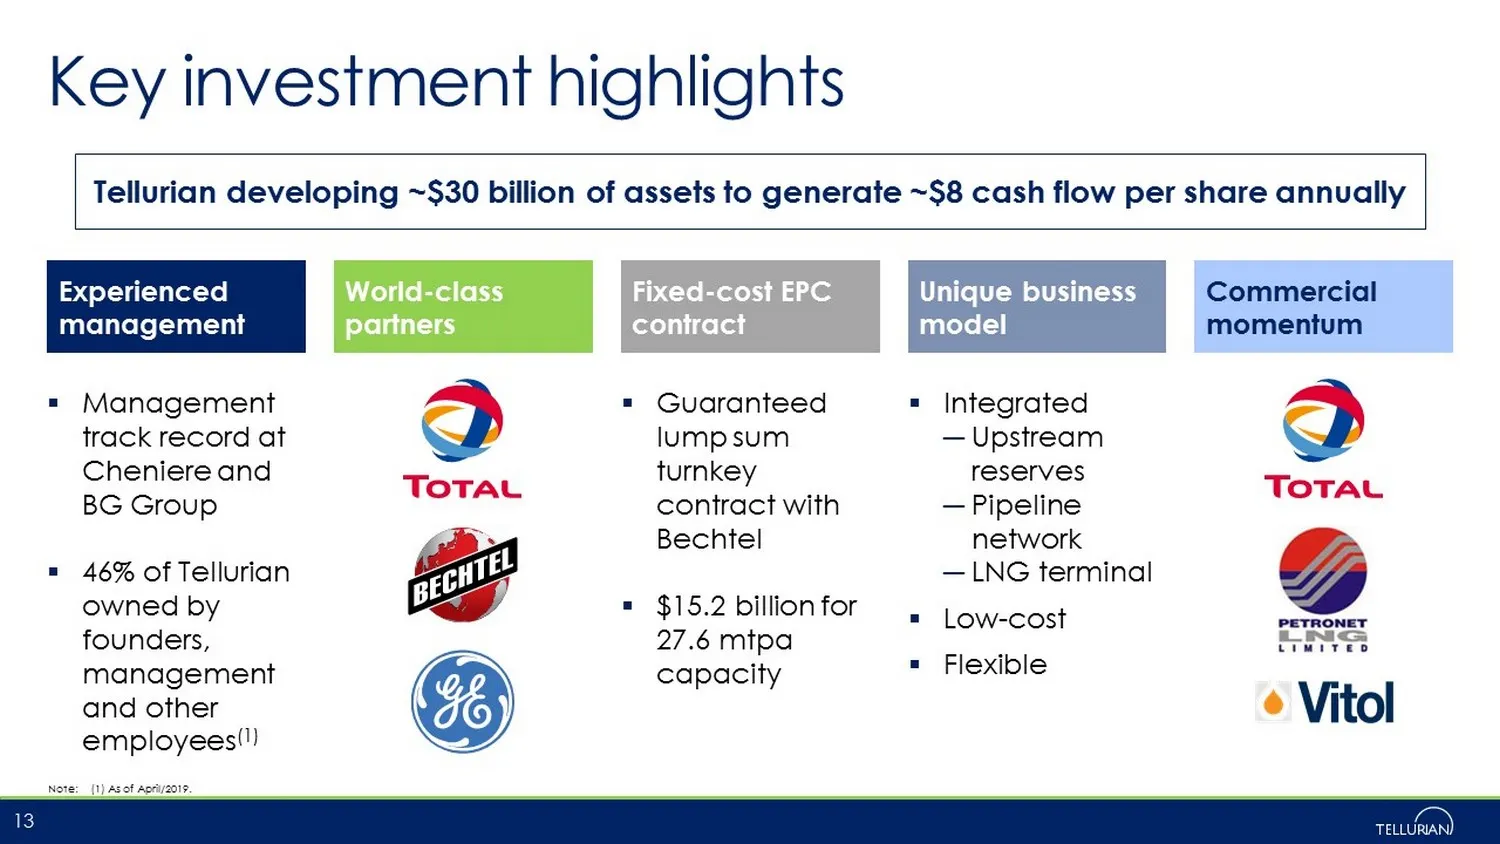
Slide 13: Key investment highlights
Key investment highlights 13 ▪ Management track record at Cheniere and BG Group ▪ 46% of Tellurian owned by founders, management and other employees (1) ▪ Guaranteed lump sum turnkey contract with Bechtel ▪ $15.2 billion for 27.6 mtpa capacity ▪ Integrated ― Upstream reserves ― Pipeline network ― LN
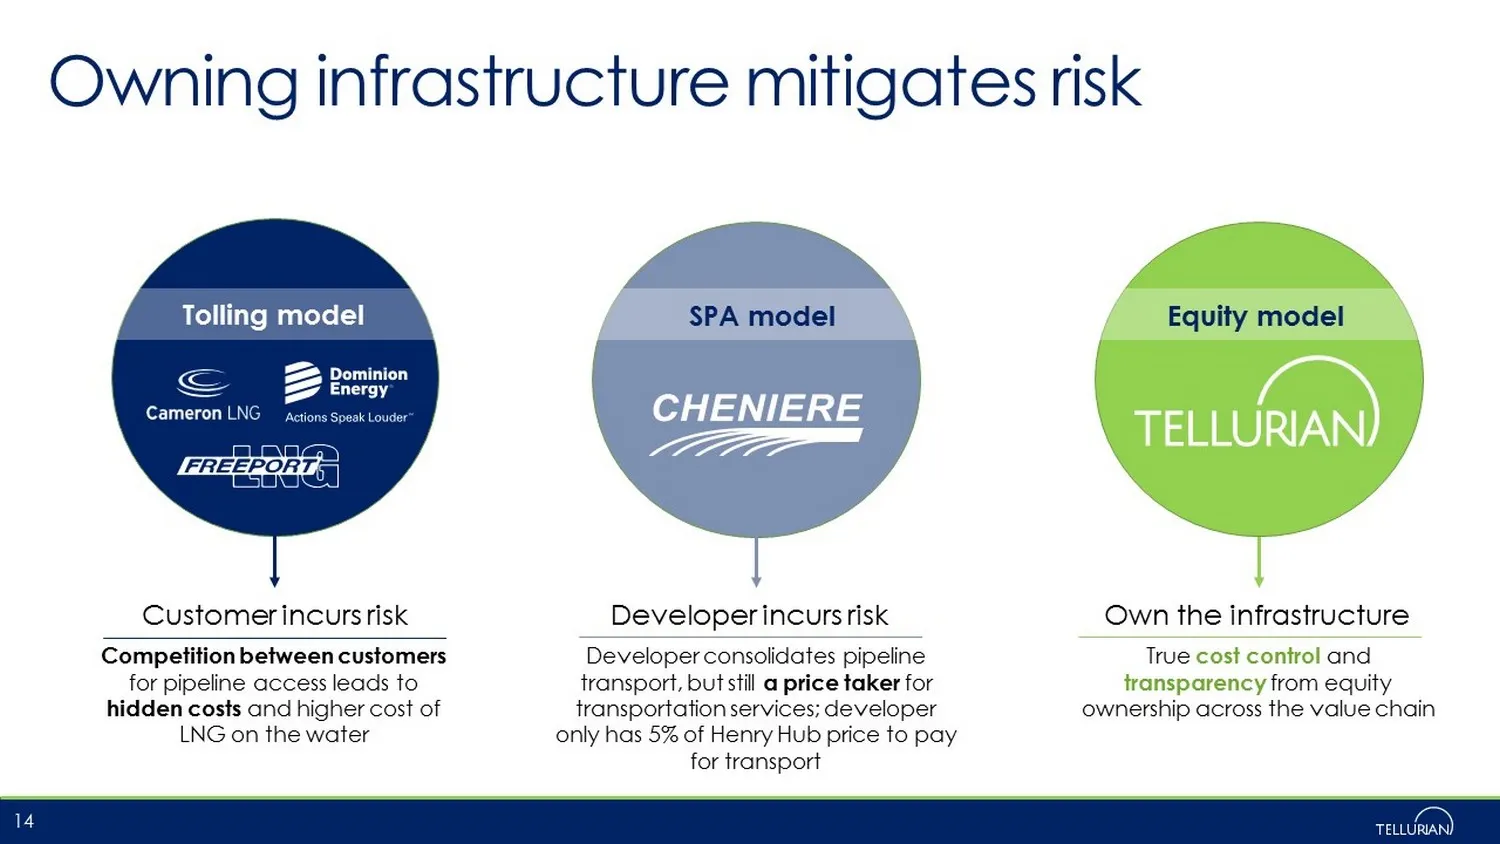
Slide 14: Owning infrastructure mitigates risk
Owning infrastructure mitigates risk 14 Tolling model SPA model Equity model Customer incurs risk Competition between customers for pipeline access leads to hidden costs and higher cost of LNG on the water Developer incurs risk Developer consolidates pipeline transport, but still a price taker for t
Slide 15: Best team in the business
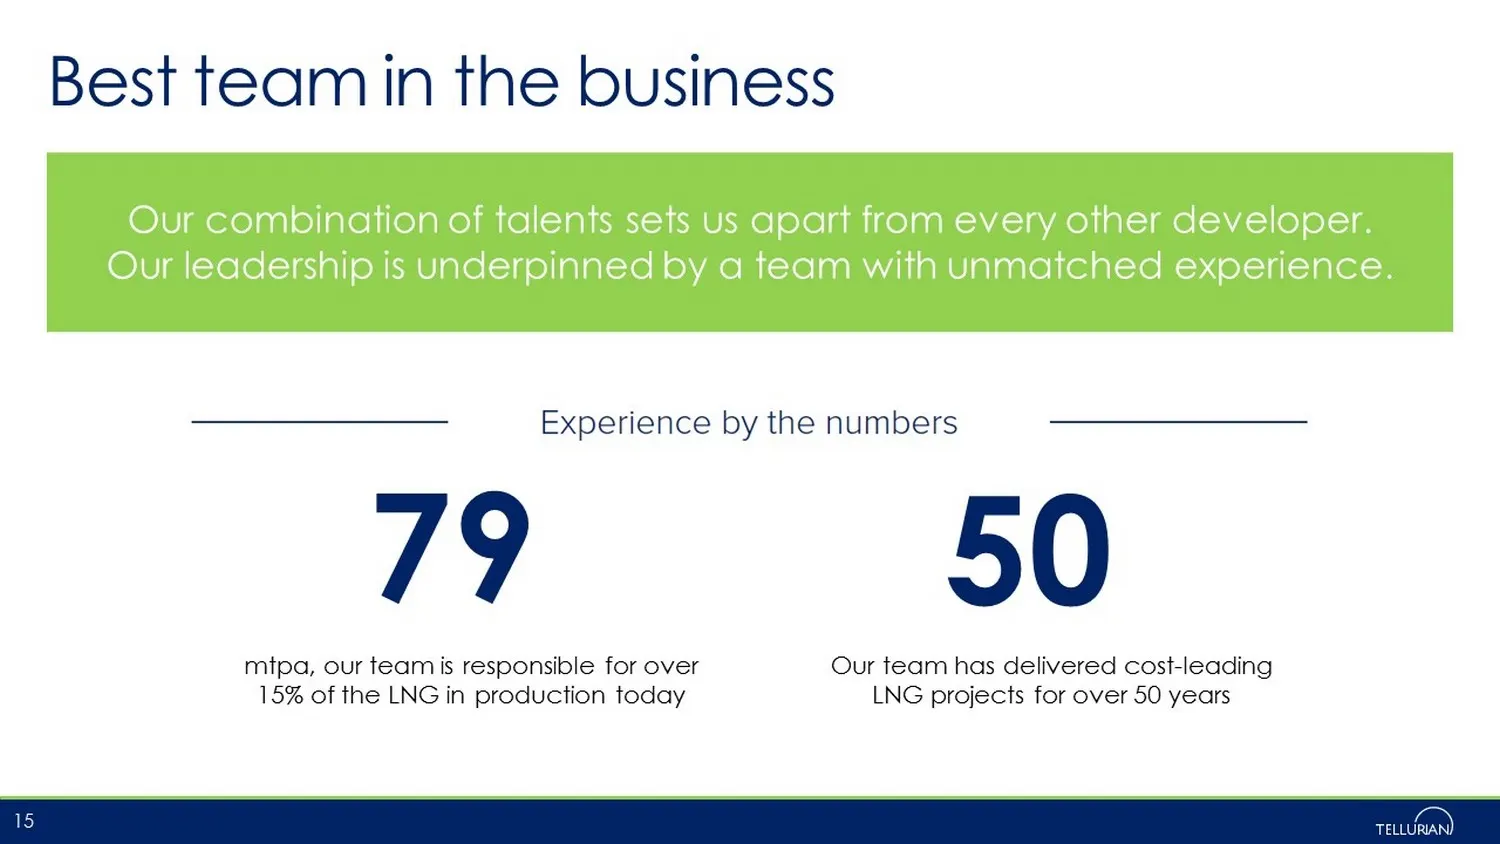
Best team in the business 15 Our combination of talents sets us apart from every other developer. Our leadership is underpinned by a team with unmatched experience. 79 50 mtpa, our team is responsible for over 15% of the LNG in production today Our team has delivered cost - leading LNG projects for
Slide 16: Driftwood LNG's ideal site for exports
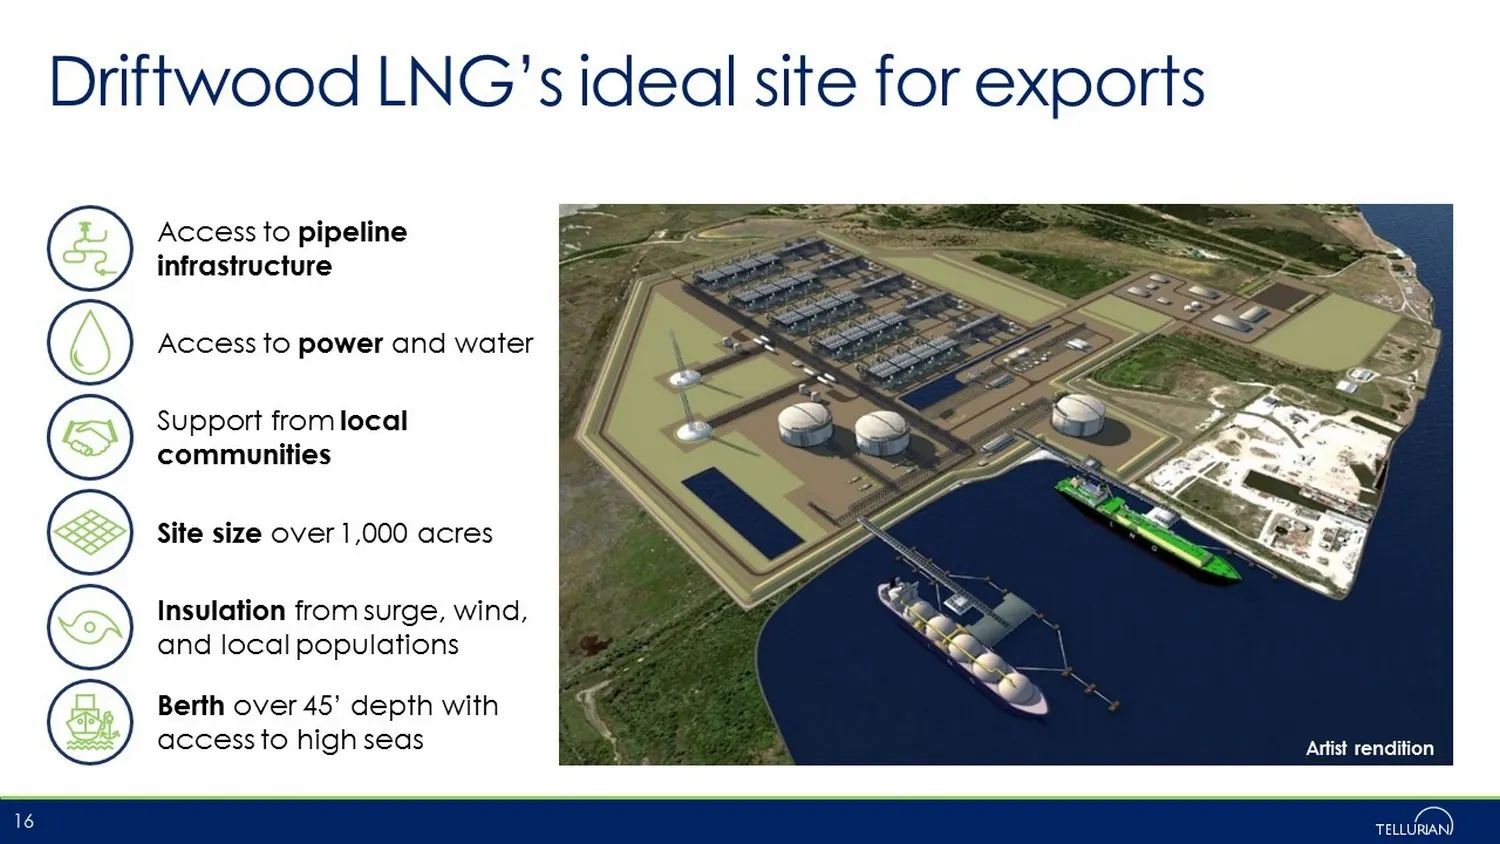
Driftwood LNG’s ideal site for exports 16 Access to power and water Berth over 45’ depth with access to high seas Support from local communities Access to pipeline infrastructure Site size over 1,000 acres Insulation from surge, wind, and local populations Artist rendition
Slide 17: Bringing low-cost gas to SW Louisiana
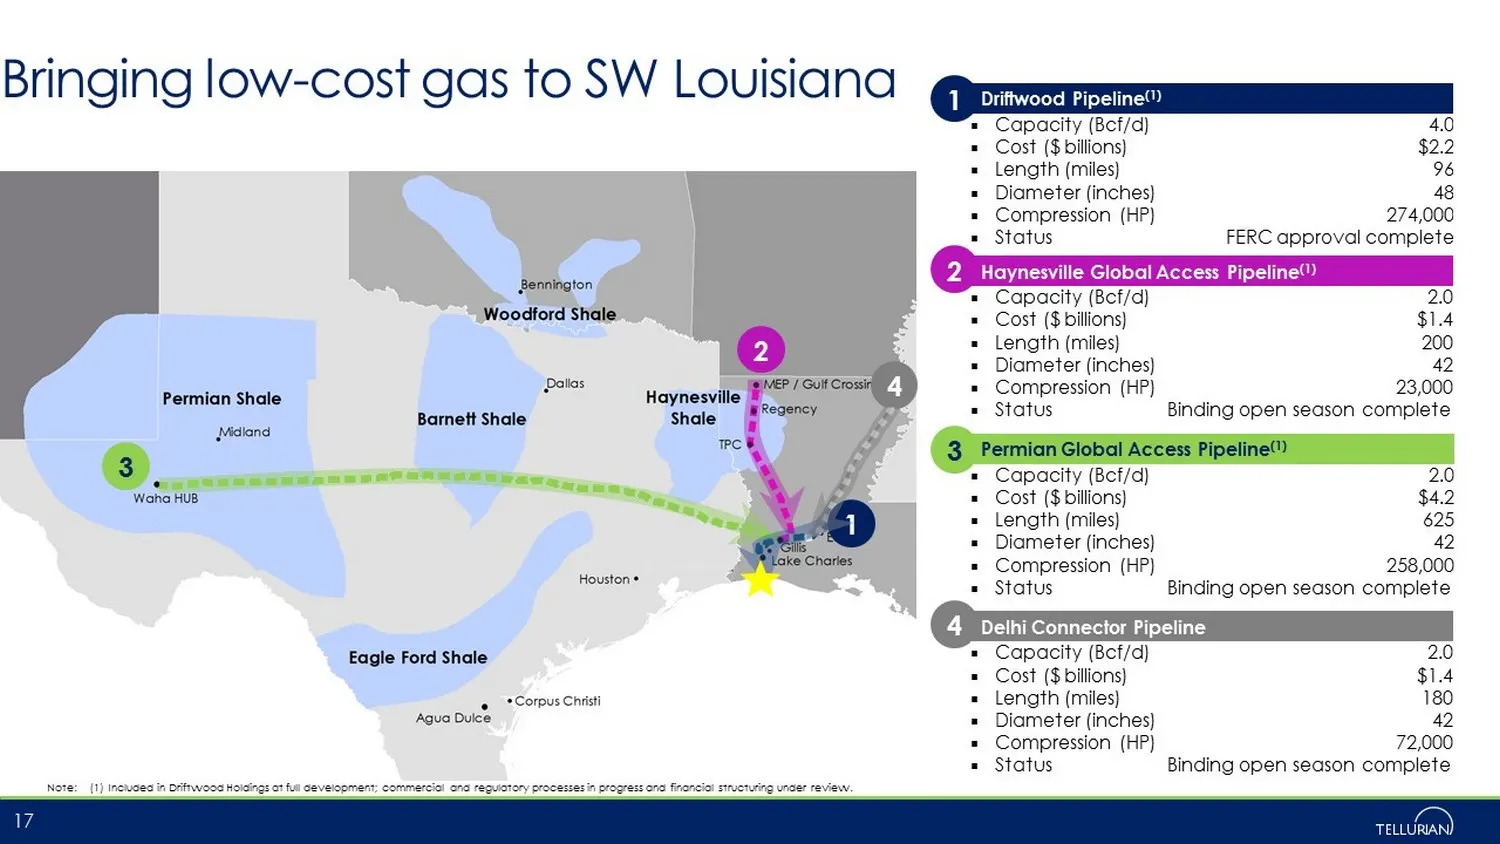
2 3 4 1 Bringing low - cost gas to SW Louisiana 17 Driftwood Pipeline (1) ▪ Capacity (Bcf/d) 4.0 ▪ Cost ($ billions) $2.2 ▪ Length (miles) 96 ▪ Diameter (inches) 48 ▪ Compression (HP) 274,000 ▪ Status FERC approval complete Haynesville Global Access Pipeline (1) ▪ Capacity (Bcf/d) 2.0 ▪ Cost ($ bill
Slide 18: Integrated model to produce low-cost LNG on the water
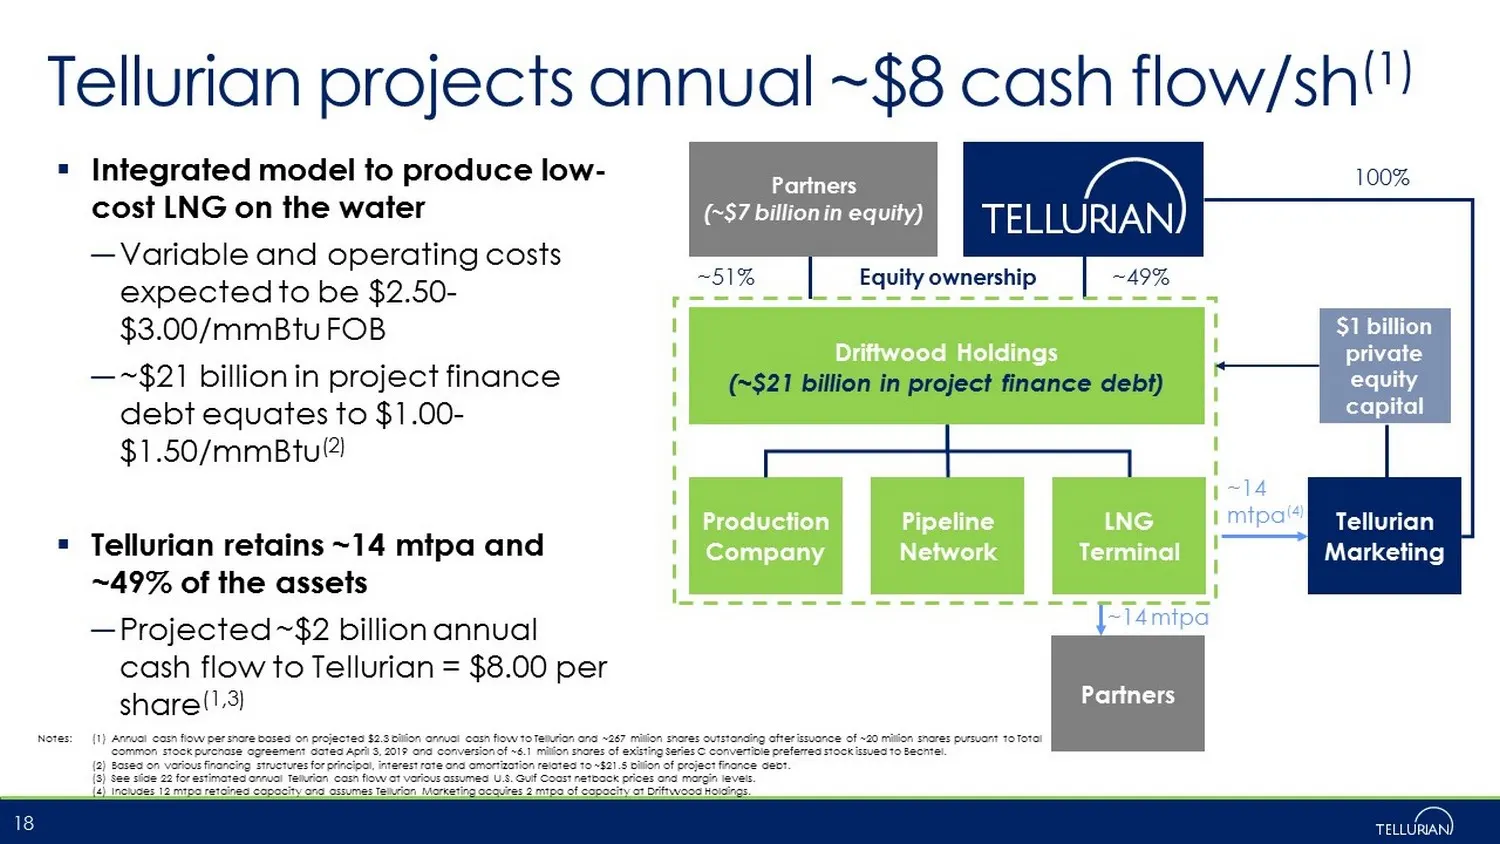
▪ Integrated model to produce low - cost LNG on the water ― Variable and operating costs expected to be $2.50 - $3.00/mmBtu FOB ― ~$21 billion in project finance debt equates to $1.00 - $1.50/mmBtu (2) ▪ Tellurian retains ~14 mtpa and ~49% of the assets ― Projected ~$2 billion annual cash flow to Te
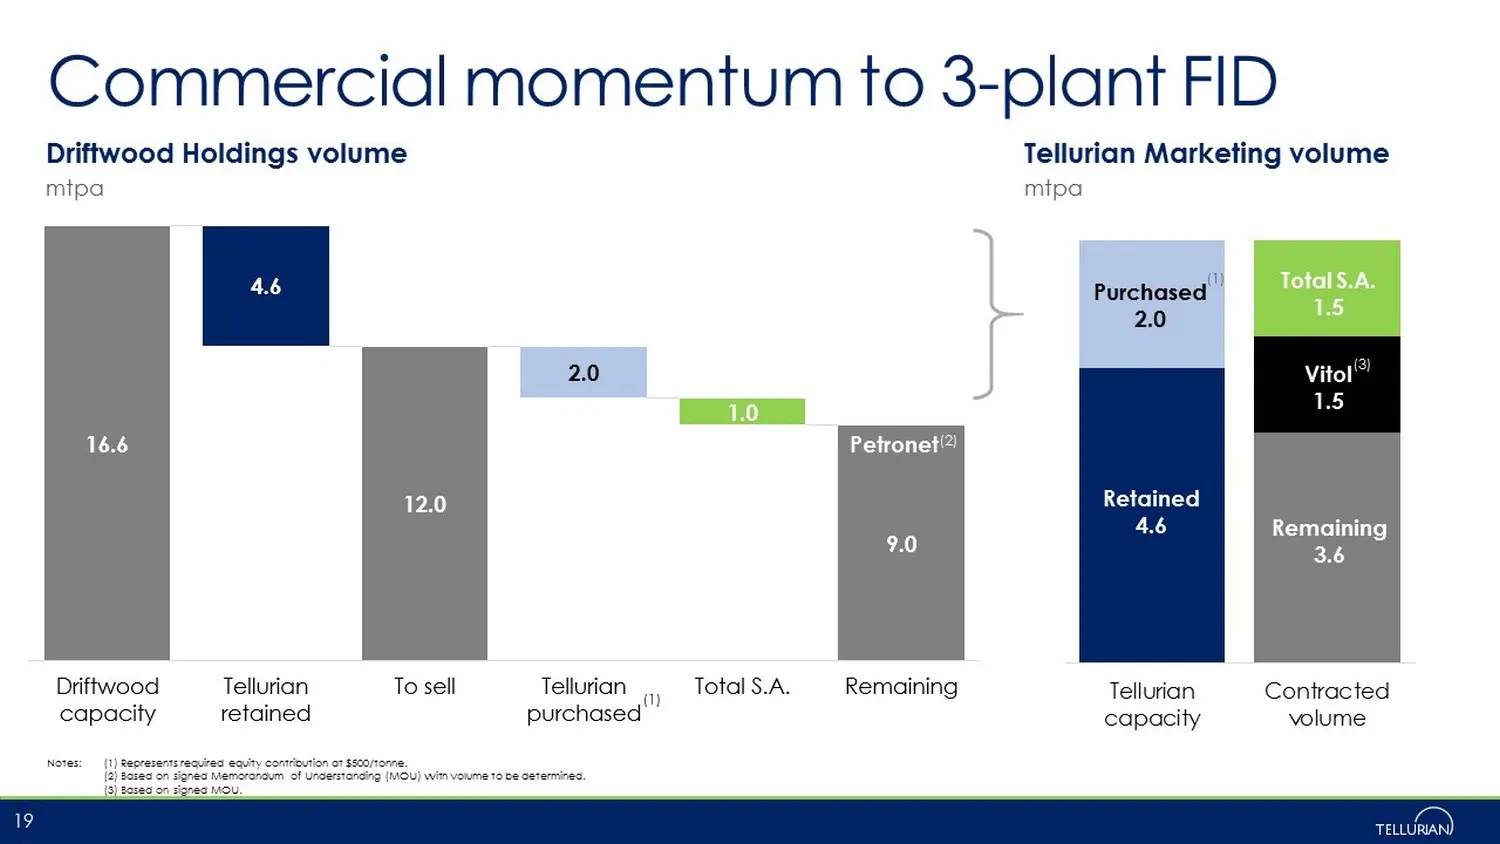
Slide 19: Commercial momentum to 3-plant FID
Tellurian capacity Contracted volume Vitol 1.5 Total S.A. 1.5 Commercial momentum to 3 - plant FID Notes: (1) Represents required equity contribution at $500/tonne. (2) Based on signed Memorandum of Understanding (MOU) with volume to be determined. (3) Based on signed MOU. 19 mtpa mtpa (3) Driftwood
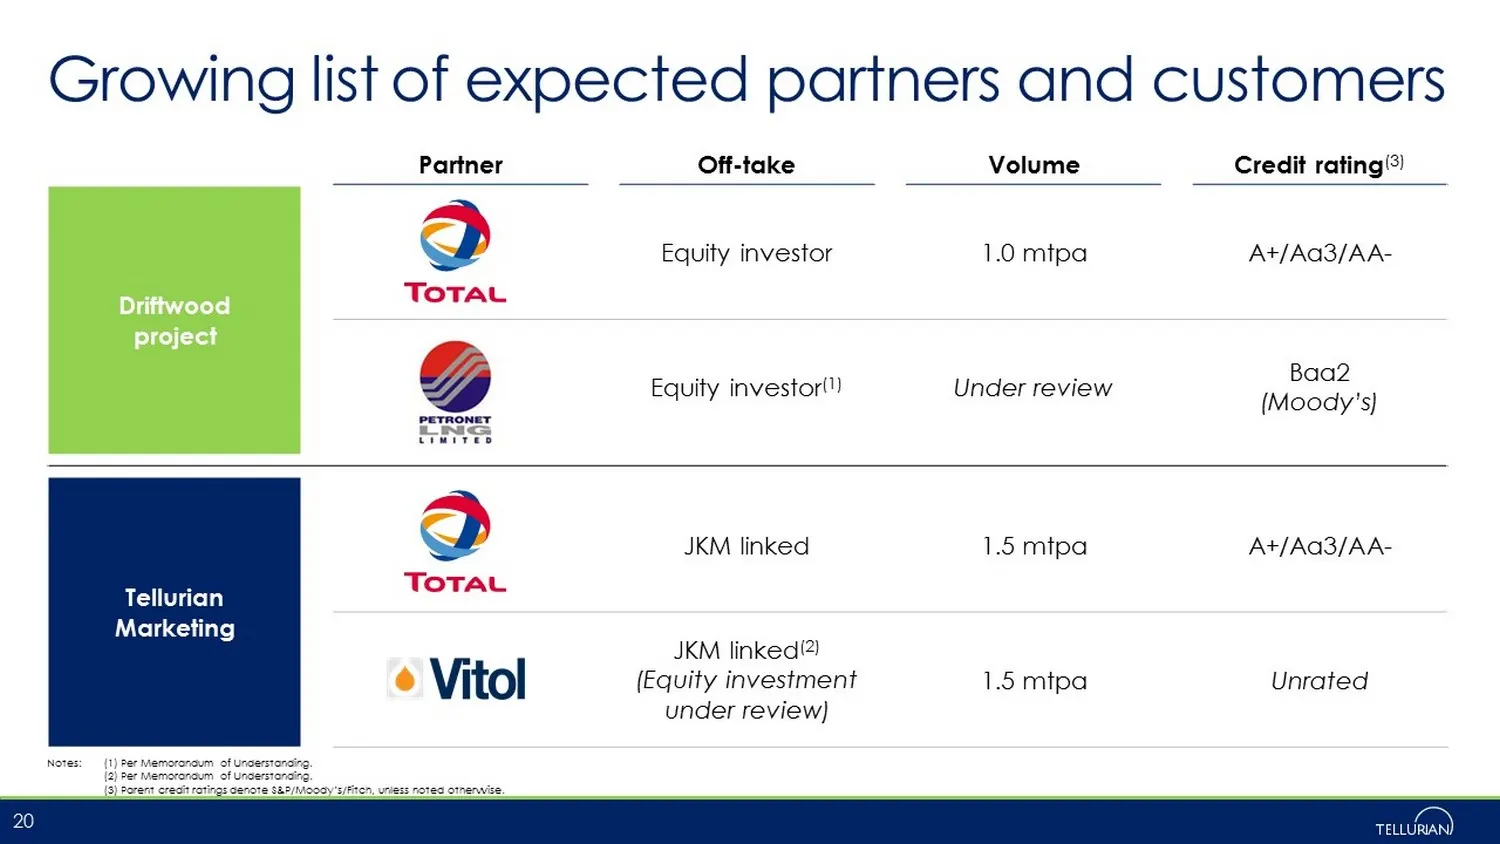
Slide 20: Growing list of expected partners and customers
Growing list of expected partners and customers 20 Partner Off - take Volume Credit rating (3) Driftwood project Equity investor 1.0 mtpa A+/Aa3/AA - Equity investor (1) Under review Baa2 (Moody’s) Tellurian Marketing JKM linked 1.5 mtpa A+/Aa3/AA - JKM linked (2) (Equity investment under review) 1.
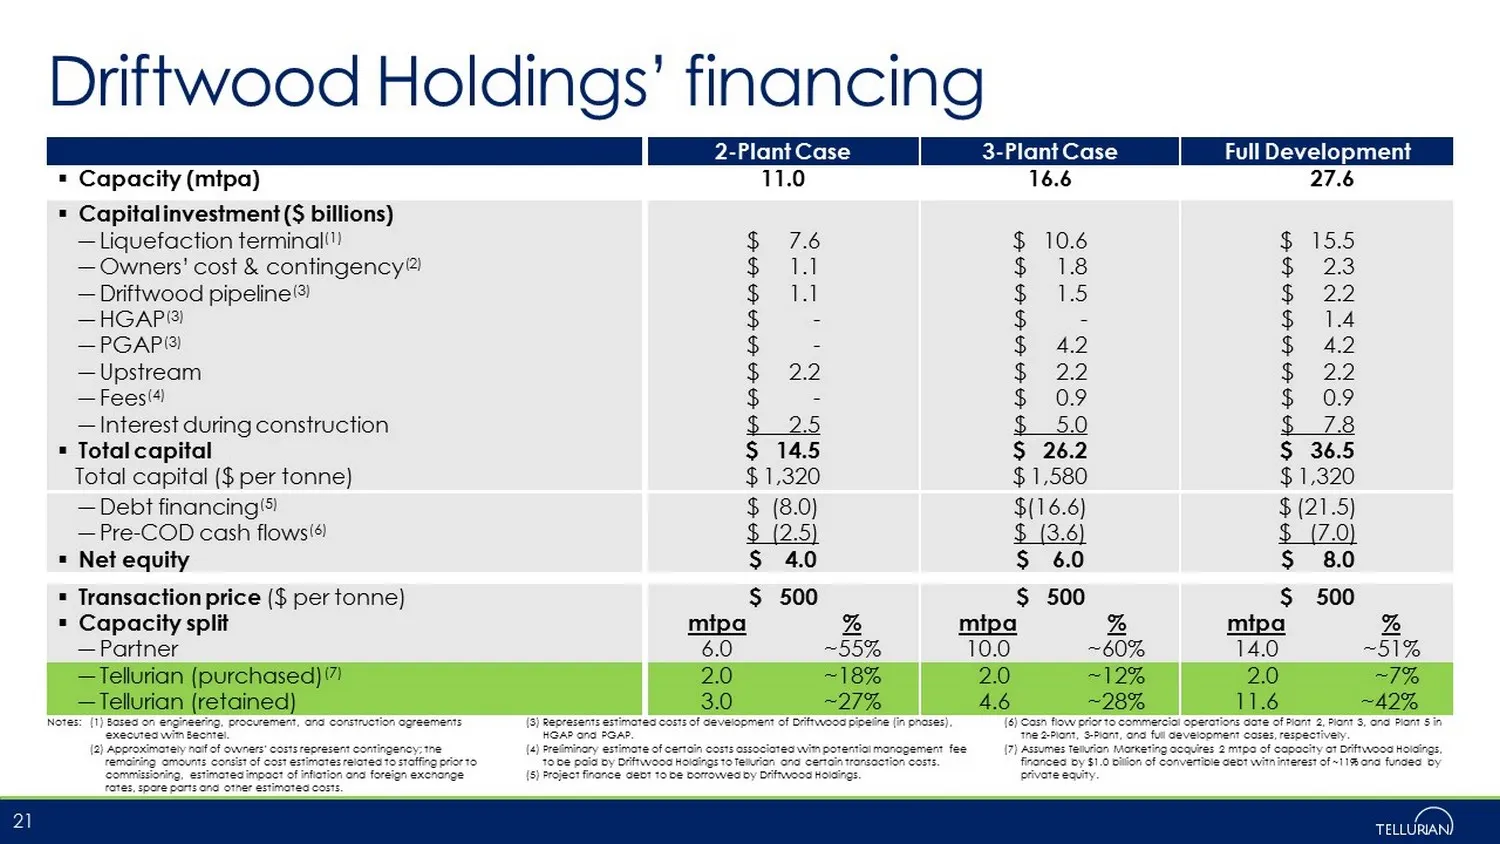
Slide 21: Driftwood Holdings' financing
Driftwood Holdings’ financing 21 Notes: (1) Based on engineering, procurement, and construction agreements executed with Bechtel. (2) Approximately half of owners’ costs represent contingency; the remaining amounts consist of cost estimates related to staffing prior to commissioning, estimated impac
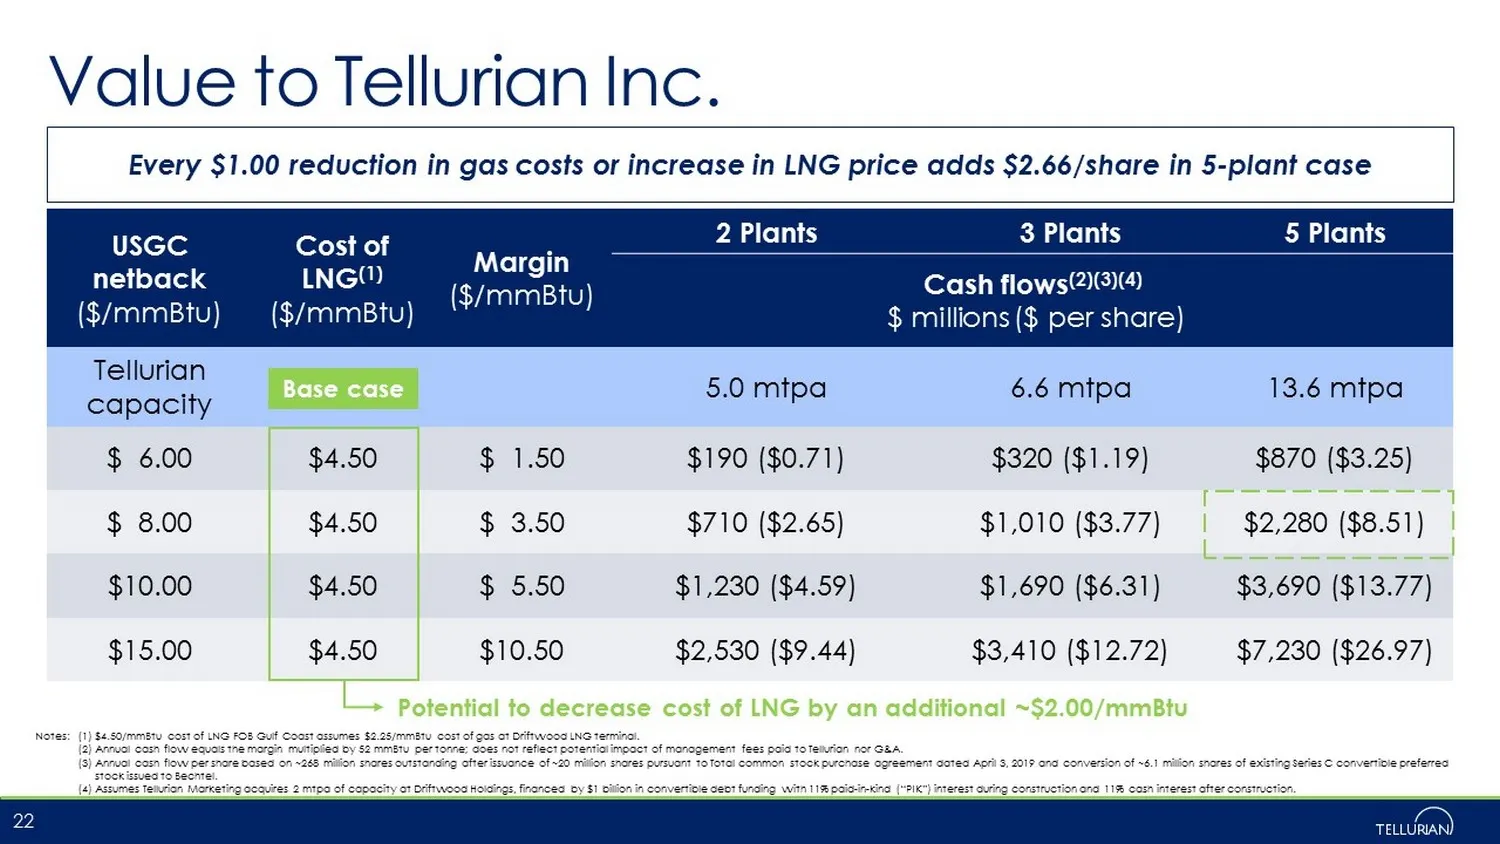
Slide 22: Every $1.00 change adds $2.66/share in 5-plant case
Every $1.00 reduction in gas costs or increase in LNG price adds $2.66/share in 5 - plant case USGC netback ($/mmBtu) Cost of LNG (1) ($/mmBtu) Margin ($/mmBtu) 2 Plants 3 Plants 5 Plants Cash flows (2)(3)(4) $ millions ($ per share) Tellurian capacity 5.0 mtpa 6.6 mtpa 13.6 mtpa $ 6.00 $4.50 $ 1.50
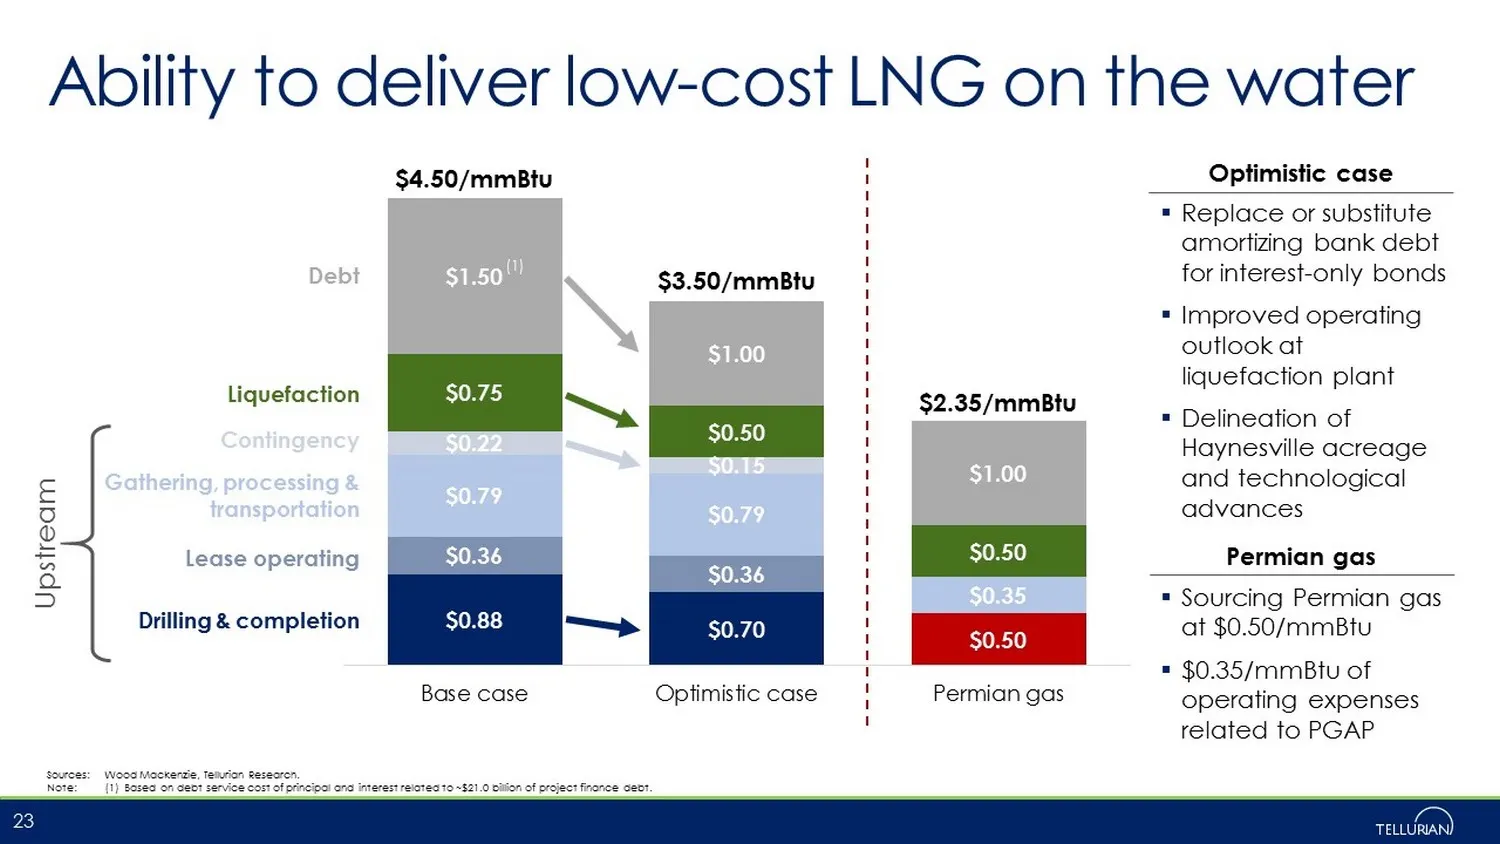
Slide 23: Ability to deliver low-cost LNG on the water
$0.88 $0.70 $0.36 $0.36 $0.50 $0.79 $0.79 $0.35 $0.22 $0.15 $0.75 $0.50 $0.50 $1.50 $1.00 $1.00 Base case Optimistic case Permian gas ▪ Replace or substitute amortizing bank debt for interest - only bonds ▪ Improved operating outlook at liquefaction plant ▪ Delineation of Haynesville acreage and tec
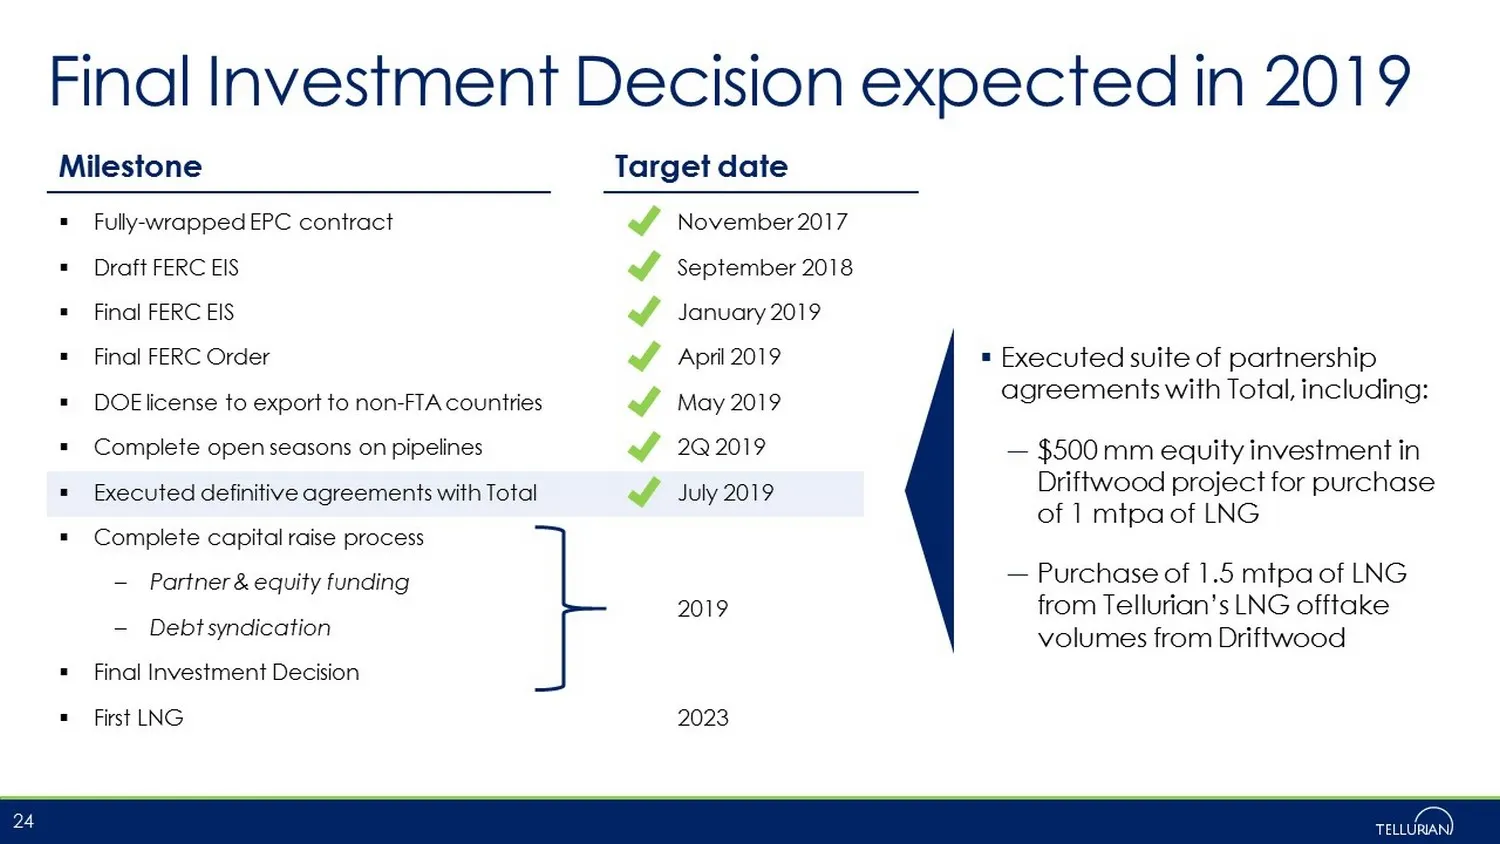
Slide 24: Final Investment Decision expected in 2019
Final Investment Decision expected in 2019 24 ▪ Fully - wrapped EPC contract ▪ Draft FERC EIS ▪ Final FERC EIS ▪ Final FERC Order ▪ DOE license to export to non - FTA countries ▪ Complete open seasons on pipelines ▪ Executed definitive agreements with Total ▪ Complete capital raise process – Partner

Slide 25: Contact us
Social media Contact us ▪ Amit Marwaha Director, Investor Relations & Finance +1 832 485 2004 amit.marwaha@tellurianinc.com ▪ Joi Lecznar SVP, Public Affairs & Communication +1 832 962 4044 joi.lecznar@tellurianinc.com 25 @TellurianLNG

Slide 26: Appendix
Appendix 26
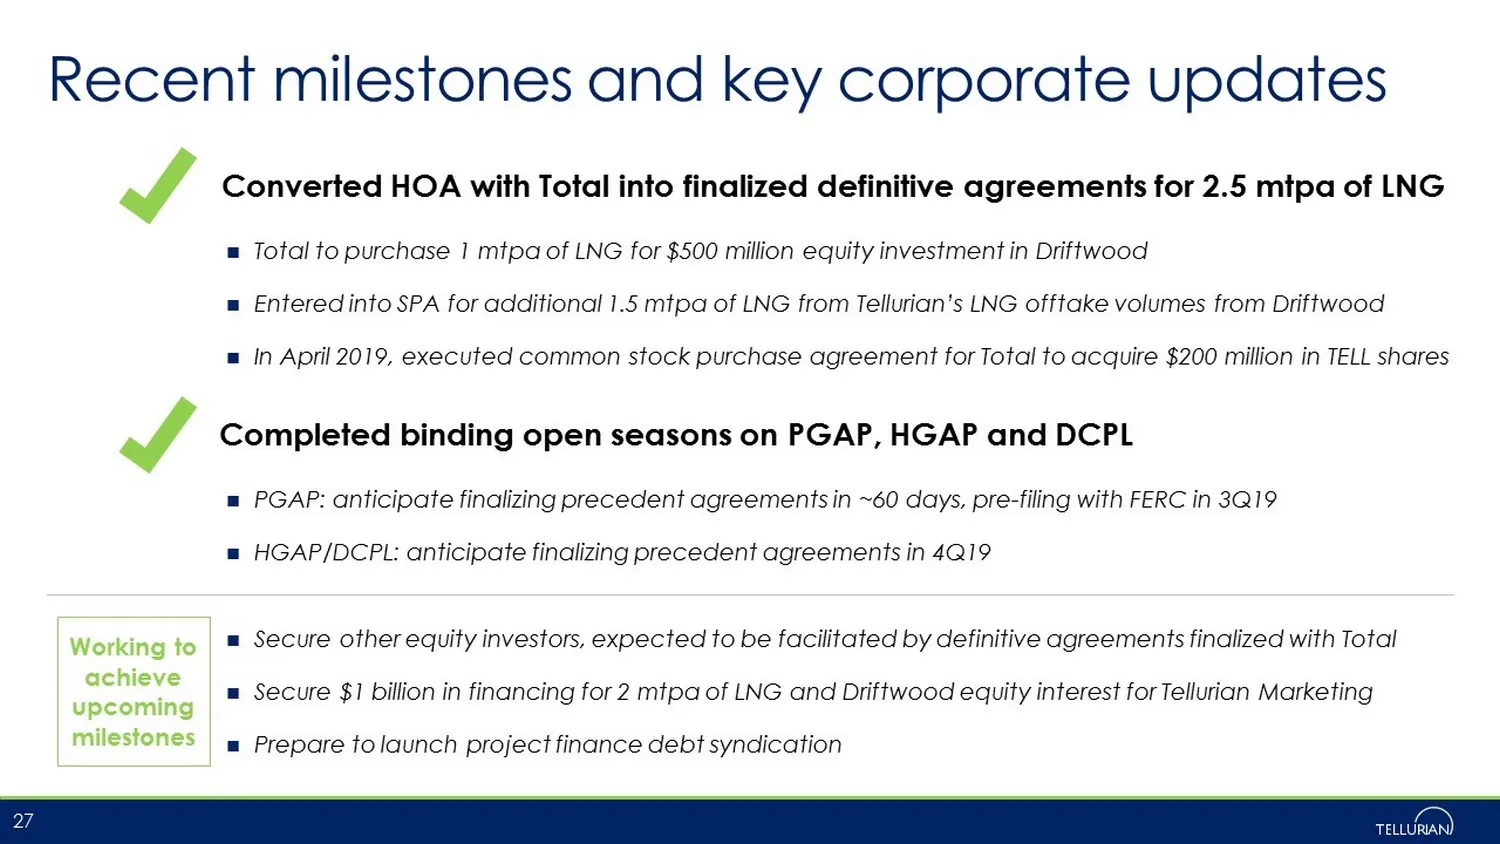
Slide 27: Recent milestones and key corporate updates
Recent milestones and key corporate updates 27 Converted HOA with Total into finalized definitive agreements for 2.5 mtpa of LNG Completed binding open seasons on PGAP, HGAP and DCPL Total to purchase 1 mtpa of LNG for $500 million equity investment in Driftwood Entered into SPA for additional 1.5 m
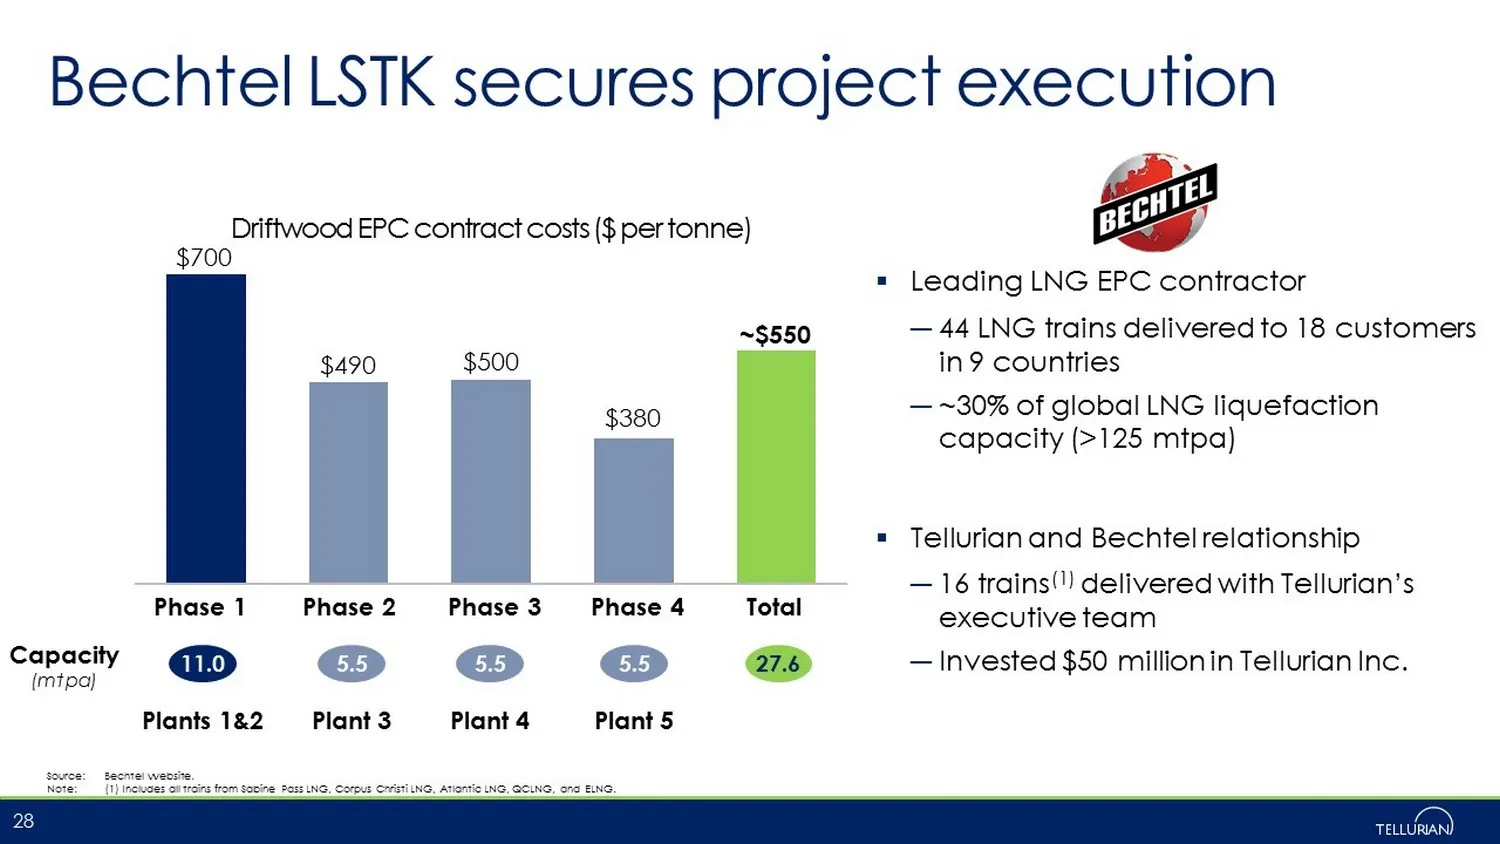
Slide 28: Bechtel LSTK secures project execution
$700 $490 $500 $380 ~$550 Phase 1 Phase 2 Phase 3 Phase 4 Total Bechtel LSTK secures project execution ▪ Leading LNG EPC contractor ― 44 LNG trains delivered to 18 customers in 9 countries ― ~30% of global LNG liquefaction capacity (>125 mtpa) ▪ Tellurian and Bechtel relationship ― 16 trains (1) del
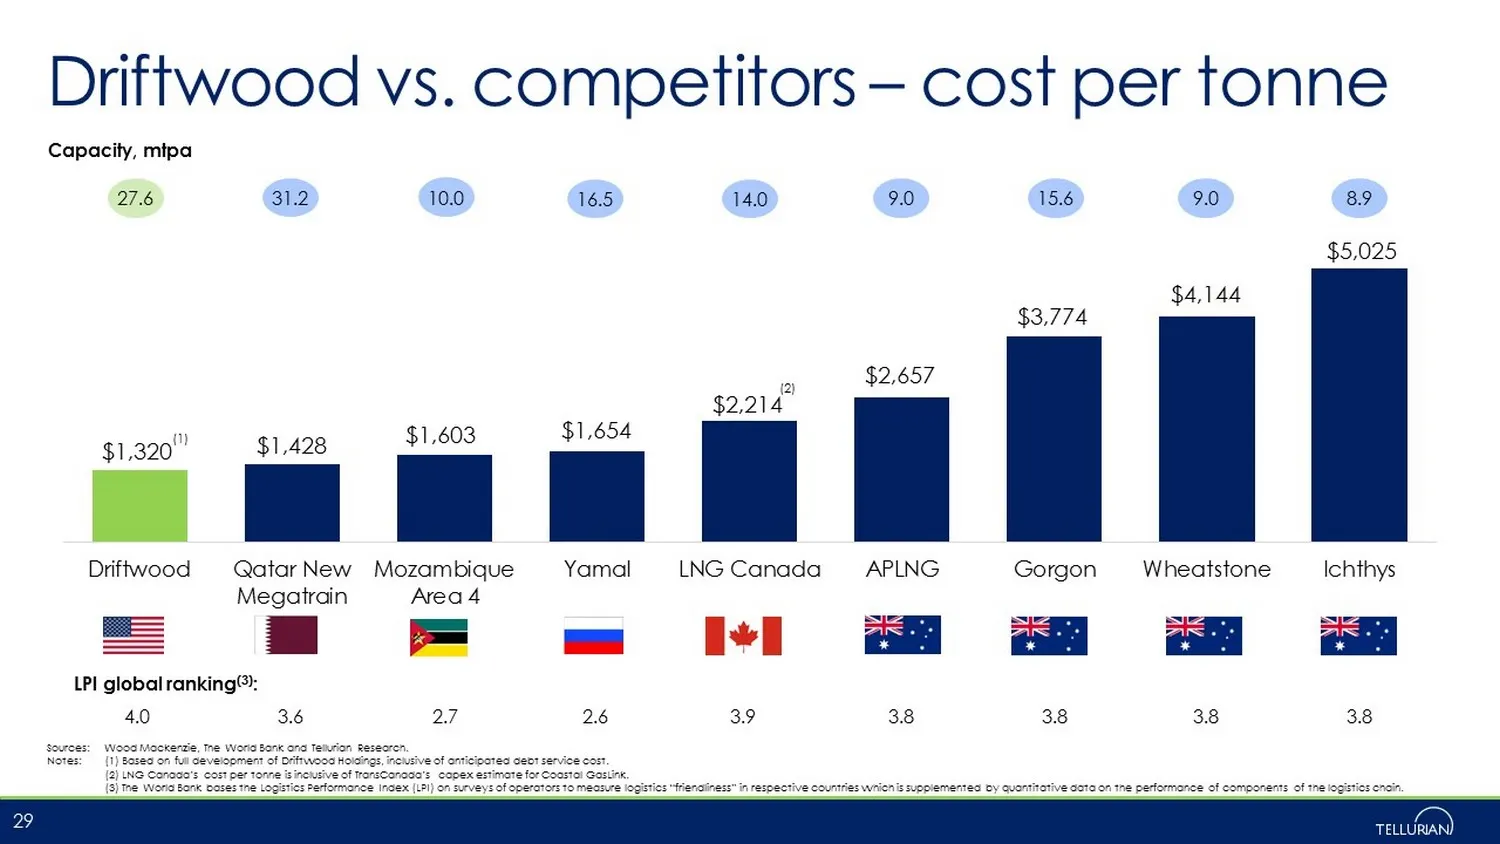
Slide 29: Driftwood vs. competitors – cost per tonne
$1,320 $1,428 $1,603 $1,654 $2,214 $2,657 $3,774 $4,144 $5,025 Driftwood Qatar New Megatrain Mozambique Area 4 Yamal LNG Canada APLNG Gorgon Wheatstone Ichthys Driftwood vs. competitors – cost per tonne Sources: Wood Mackenzie, The World Bank and Tellurian Research. Notes: (1) Based on full developm
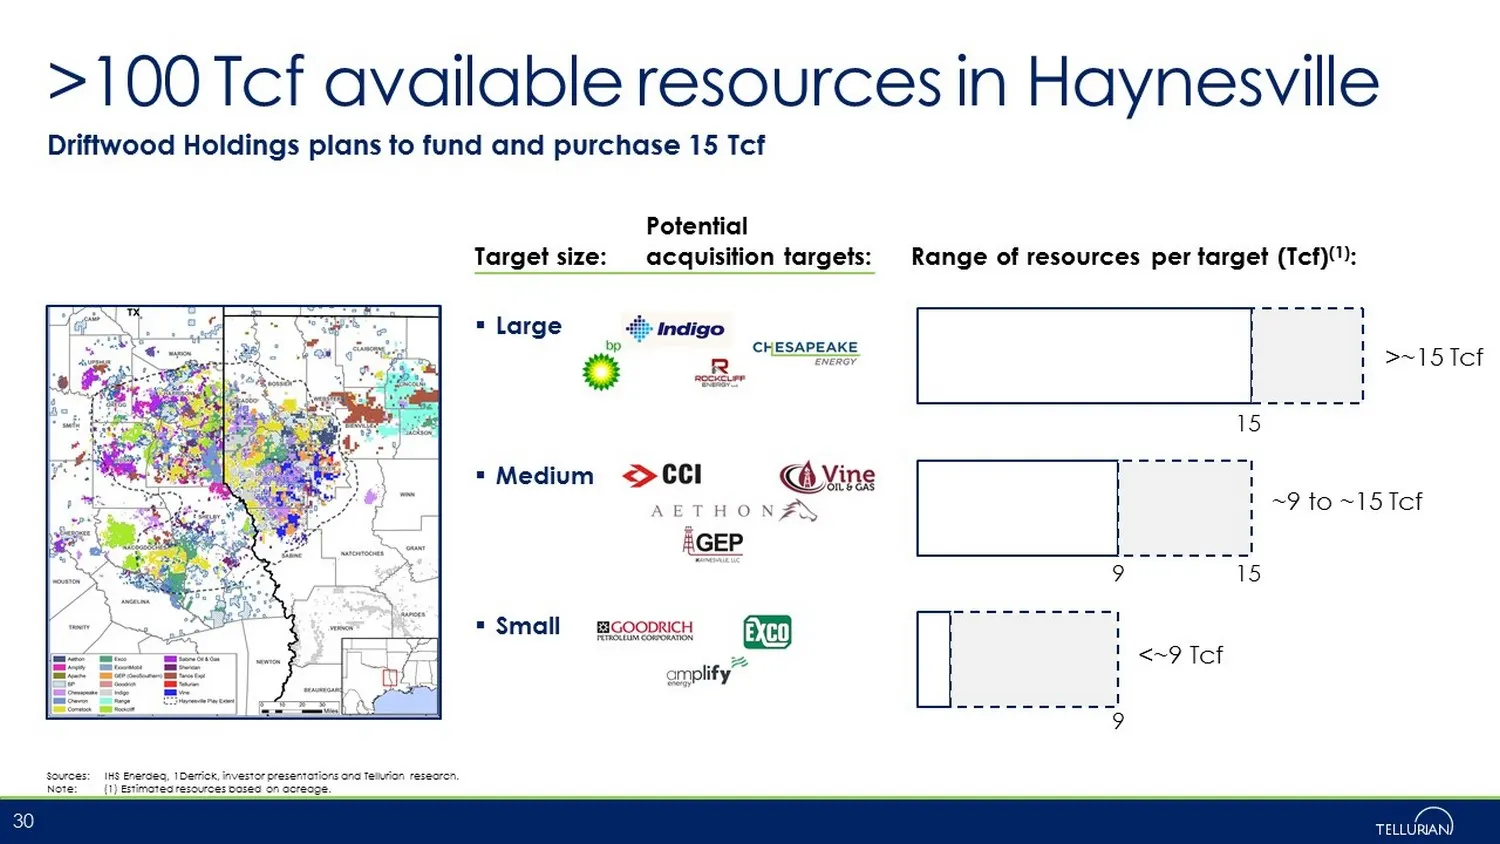
Slide 30: Potential acquisition targets for upstream resources
<~9 Tcf ~9 to ~15 Tcf >~15 Tcf >100 Tcf available resources in Haynesville Sources: IHS Enerdeq, 1Derrick, investor presentations and Tellurian research. Note: (1) Estimated resources based on acreage. 30 Driftwood Holdings plans to fund and purchase 15 Tcf Potential acquisition targets: Range of re
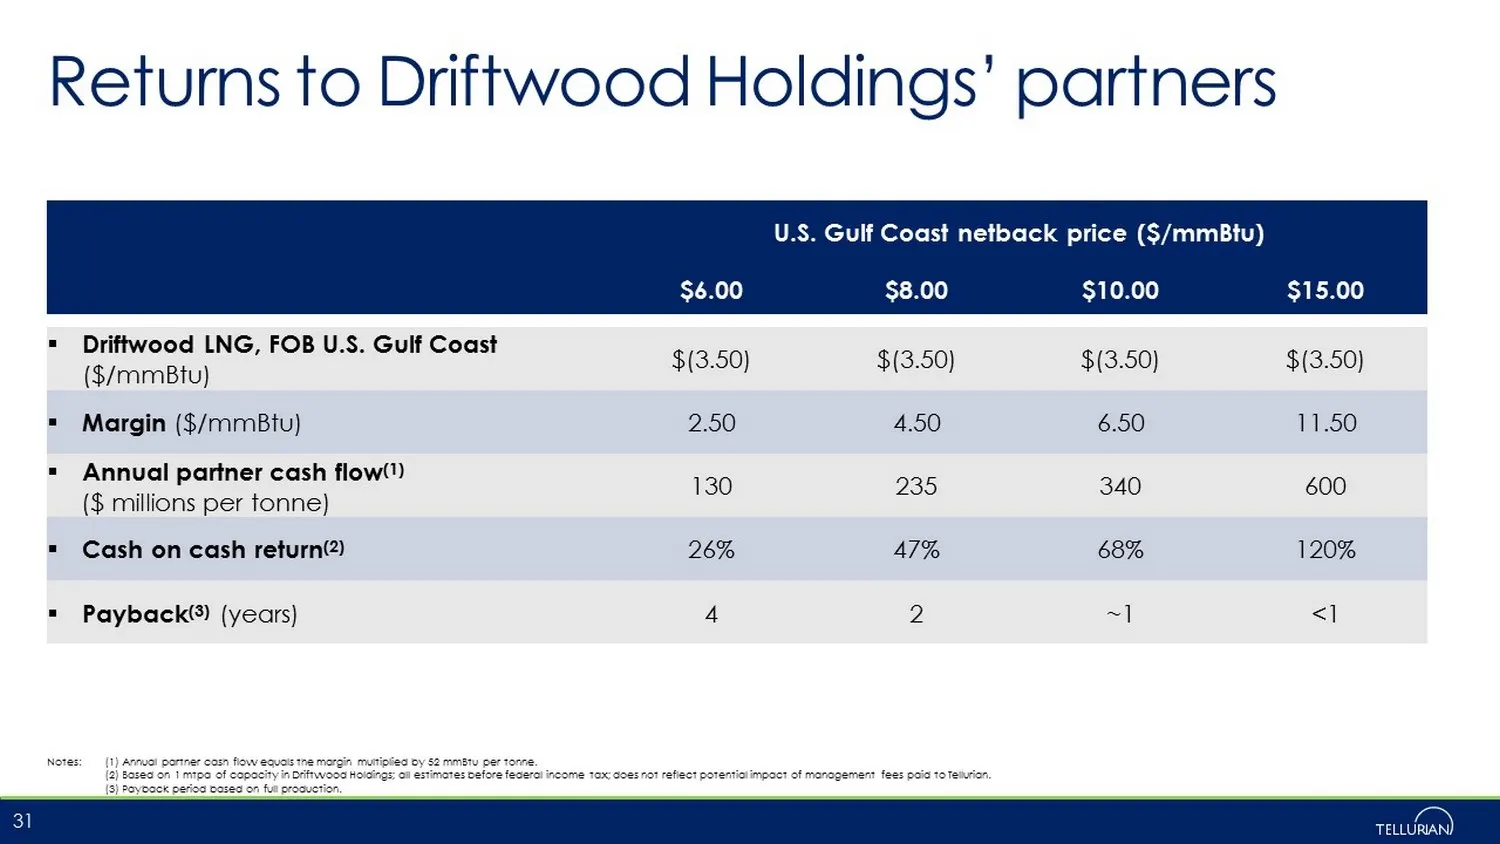
Slide 31: Returns to Driftwood Holdings' partners
Returns to Driftwood Holdings’ partners 31 U.S. Gulf Coast netback price ($/mmBtu) $6.00 $8.00 $10.00 $15.00 ▪ Driftwood LNG, FOB U.S. Gulf Coast ($/mmBtu) $(3.50) $(3.50) $(3.50) $(3.50) ▪ Margin ($/mmBtu) 2.50 4.50 6.50 11.50 ▪ Annual partner cash flow (1) ($ millions per tonne) 130 235 340 600 ▪
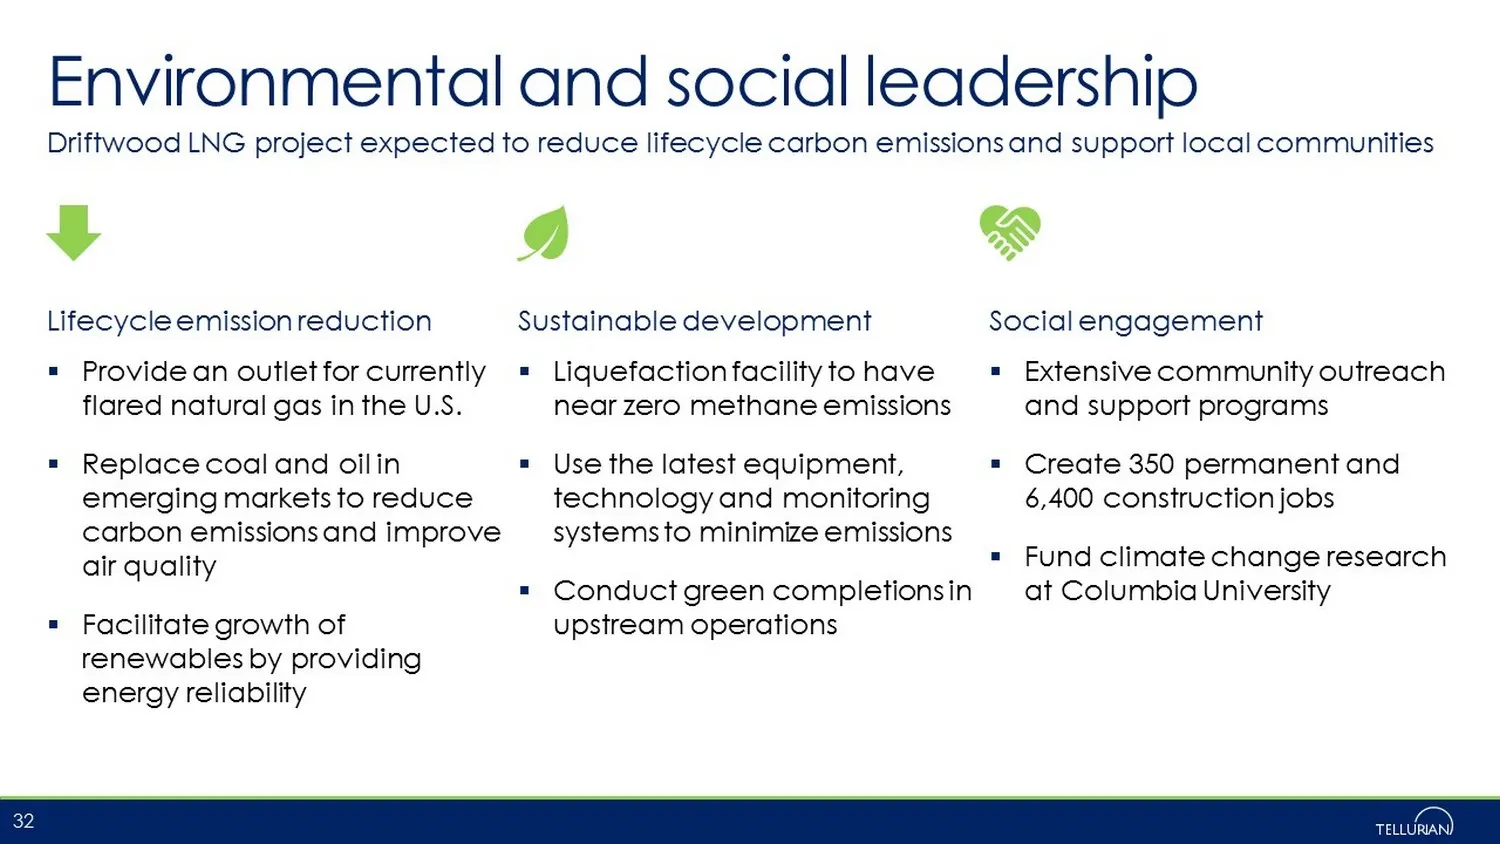
Slide 32: Environmental and social leadership
Environmental and social leadership ▪ Provide an outlet for currently flared natural gas in the U.S. ▪ Replace coal and oil in emerging markets to reduce carbon emissions and improve air quality ▪ Facilitate growth of renewables by providing energy reliability Driftwood LNG project expected to reduc
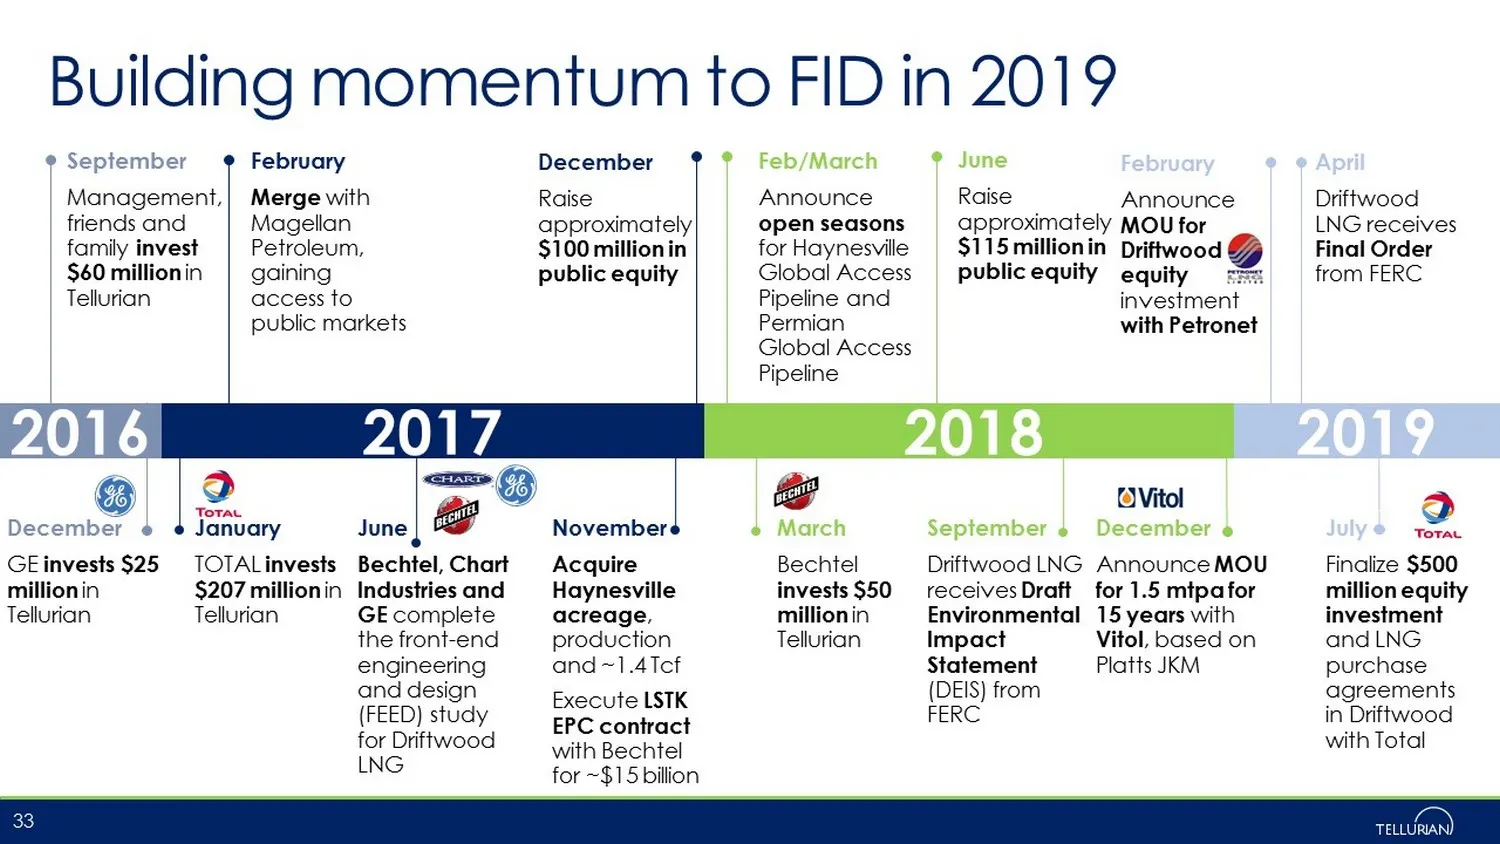
Slide 33: Building momentum to FID in 2019
April Driftwood LNG receives Final Order from FERC July Finalize $500 million equity investment and LNG purchase agreements in Driftwood with Total February Announce MOU for Driftwood equity investment with Petronet Building momentum to FID in 2019 33 June Raise approximately $115 million in public
Source: SEC EDGAR · 8-K filed Aug 7, 2019
More decks from Tellurian Inc
 Merger or Acquisition (July 2024)27 slides · Jul 22, 2024
 Investor Presentation (March 2024)16 slides · Mar 4, 2024
 Investor Presentation (August 2023)20 slides · Aug 7, 2023
 Investor Presentation (May 2023)20 slides · May 3, 2023
 Investor Presentation (February 2023)21 slides · Feb 22, 2023
 Investor Presentation (November 2022)19 slides · Nov 2, 2022