Energy Transfer Partners L.P — Sunoco Logistics Partners — 4th Annual Wachovia Energy Pipeline Symposium (December 2005)
23 slides from Energy Transfer Partners L.P's conference presentation, Dec 6, 2005
Slide 1: 4th Annual Wachovia Energy Pipeline Symposium
4th Annual Wachovia Energy Pipeline Symposium December 6, 2005 Sunoco Logistics Partners L.P.
Slide 2: Sunoco Logistics Partners Overview
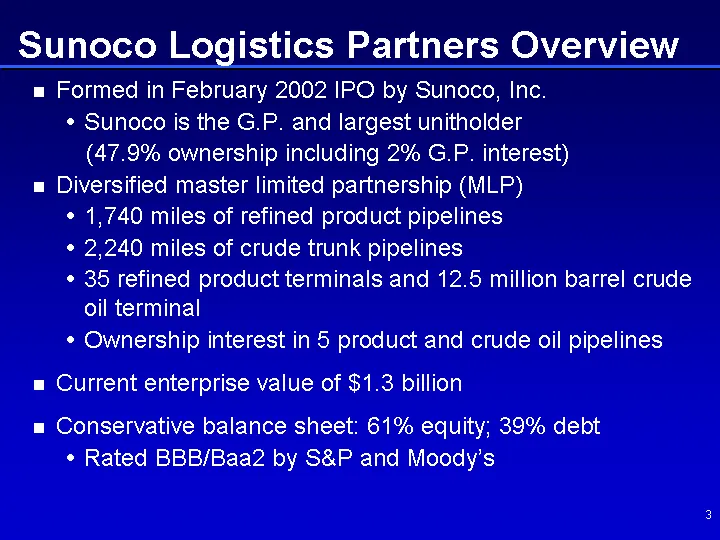
Sunoco Logistics Partners Overview Formed in February 2002 IPO by Sunoco, Inc. Sunoco is the G.P. and largest unitholder (47.9% ownership including 2% G.P. interest) Diversified master limited partnership (MLP) 1,740 miles of refined product pipelines 2,240 miles of crude trunk pipelines 35 refined
Slide 3: Distribution Summary
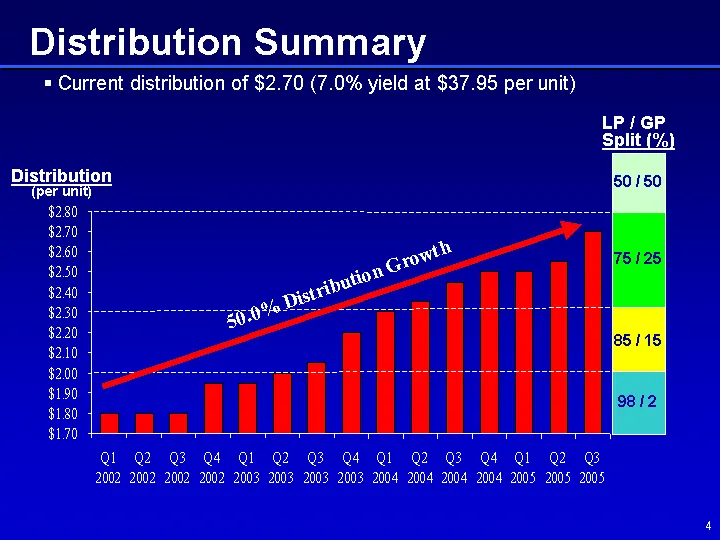
Distribution Summary LP / GP Split (%) 50 / 50 75 / 25 85 / 15 98 / 2 Current distribution of $2.70 (7.0% yield at $37.95 per unit) Distribution (per unit) 50.0% Distribution Growth 4

Slide 4: Businesses
BUSINESSES
Slide 5: Asset Portfolio
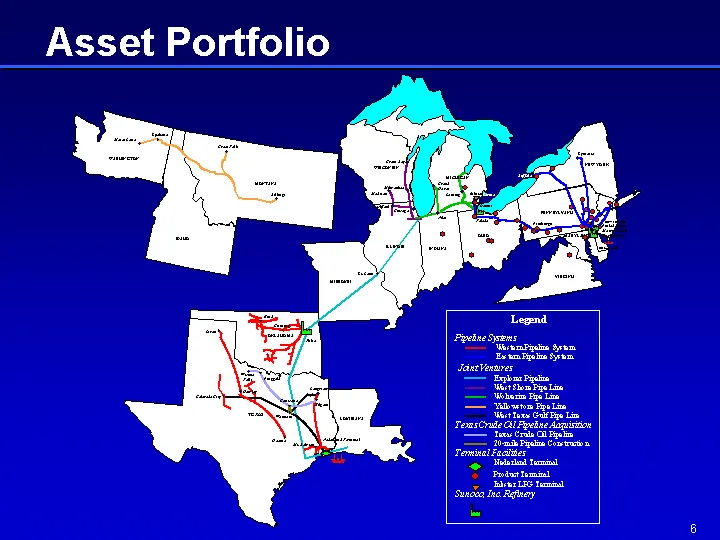
Asset Portfolio Asset Portfolio 6
Slide 6: Financial and Operational Measures
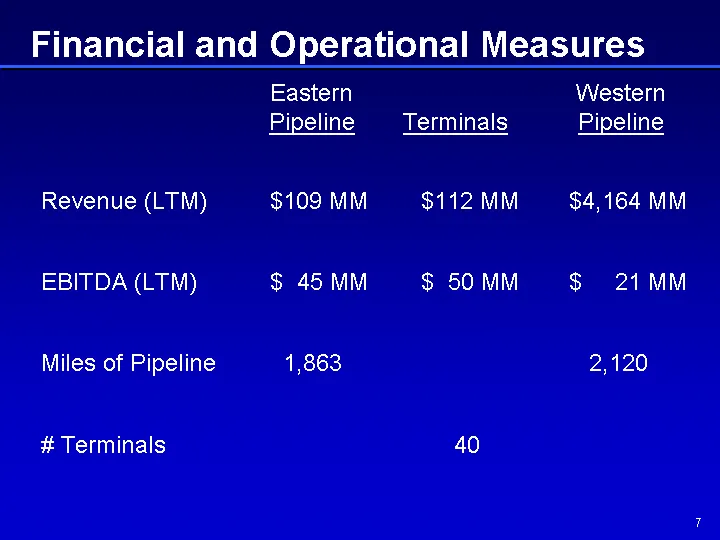
Financial and Operational Measures Eastern Pipeline Eastern Pipeline Terminals Western Pipeline Revenue (LTM) $109 MM $112 MM $112 MM $4,164 MM EBITDA (LTM) $ 45 MM $ 50 MM $ 50 MM $ 21 MM Miles of Pipeline 1,863 2,120 # Terminals 40 40 7
Slide 7: EBITDA by Business Segment
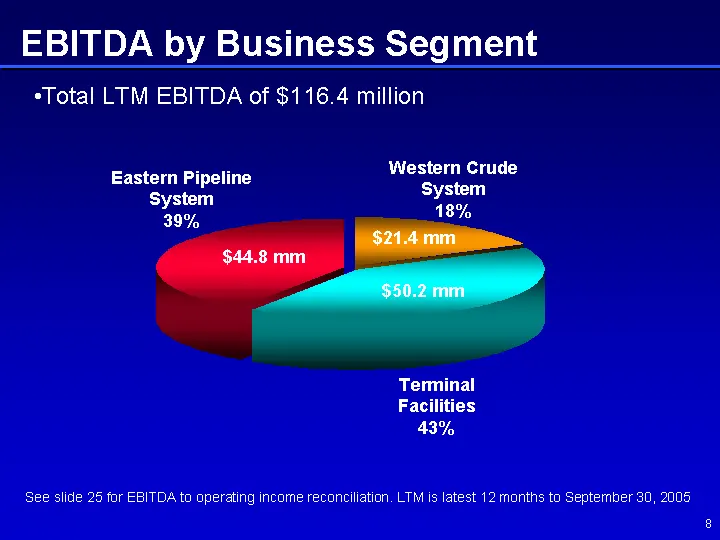
EBITDA by Business Segment Western Crude System Terminal Facilities Eastern Pipeline System 18 42 41 14.7 32.8 34.1 $44.8 mm $21.4 mm $50.2 mm Eastern Pipeline System 39% Western Crude System 18% Terminal Facilities 43% Total LTM EBITDA of $116.4 million See slide 25 for EBITDA to operating income r
Slide 8: Financial Overview
FINANCIAL OVERVIEW
Slide 9: Historical Financial Results
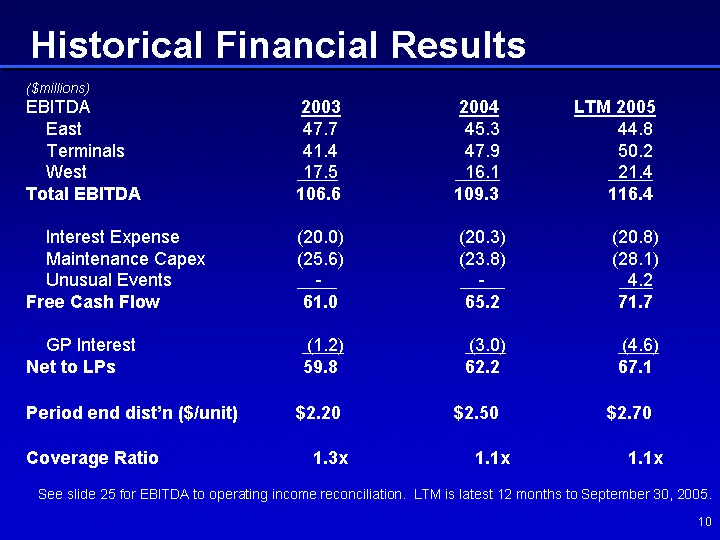
Historical Financial Results ($millions) EBITDA 2003 2004 LTM 2005 East 47.7 45.3 44.8 Terminals 41.4 47.9 50.2 West 17.5 16.1 21.4 Total EBITDA 106.6 109.3 116.4 Interest Expense (20.0) (20.3) (20.8) Maintenance Capex (25.6) (23.8) (28.1) Unusual Events - - 4.2 Free Cash Flow 61.0 65.2 71.7 GP Inte
Slide 10: Capitalization
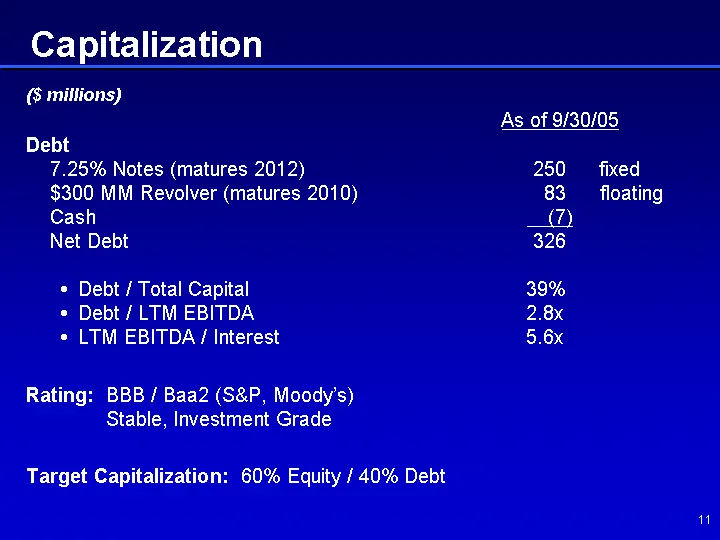
Capitalization ($ millions) As of 9/30/05 Debt 7.25% Notes (matures 2012) 250 fixed $300 MM Revolver (matures 2010) 83 floating Cash (7) Net Debt 326 Debt / Total Capital 39% Debt / LTM EBITDA 2.8x LTM EBITDA / Interest 5.6x Rating: BBB / Baa2 (S&P, Moody's) Stable, Investment Grade Target Capitaliz
Slide 11: Distributable Cash Flow Growth
Distributable Cash Flow Growth
Slide 12: Growth in Distributable Cash Flow
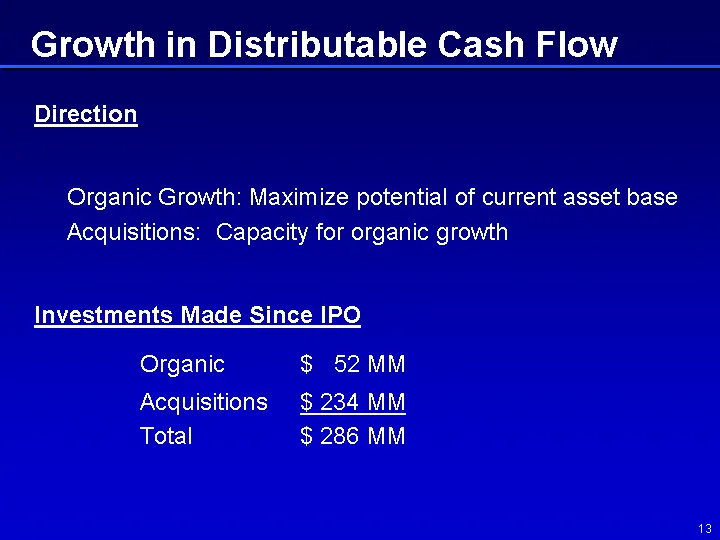
Growth in Distributable Cash Flow Direction Organic Growth: Maximize potential of current asset base Acquisitions: Capacity for organic growth Investments Made Since IPO Organic $ 52 MM Acquisitions $ 234 MM Total $ 286 MM 13
Slide 13: Nederland Terminal/Crude Pipelines Hub Strategy
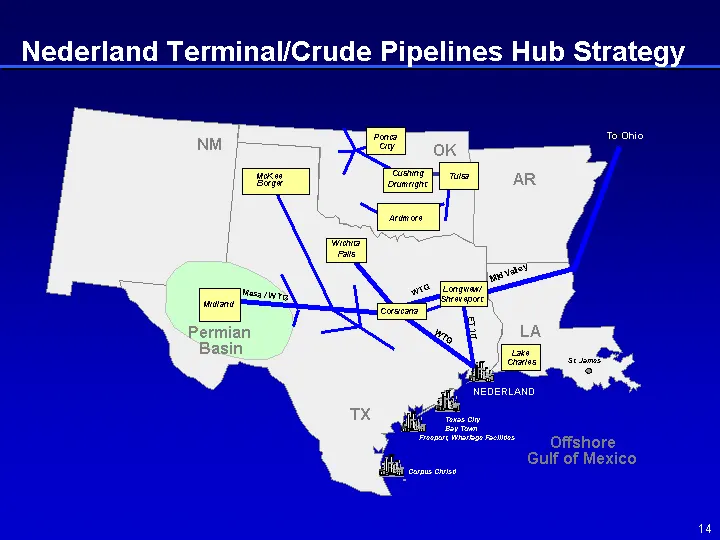
Nederland Terminal/Crude Pipelines Hub Strategy NM TX OK LA AR Texas City Bay Town Freeport, Wharfage Facilities St. James Corpus Christi Ohio ET 10" WTG Longview/ Shreveport To Ohio ET 10" WTG Longview/ Shreveport Midland Mesa / WTG Permian Basin Offshore Gulf of Mexico WTG NEDERLAND Wichita Falls
Slide 14: Organic Projects (On Line 2007)
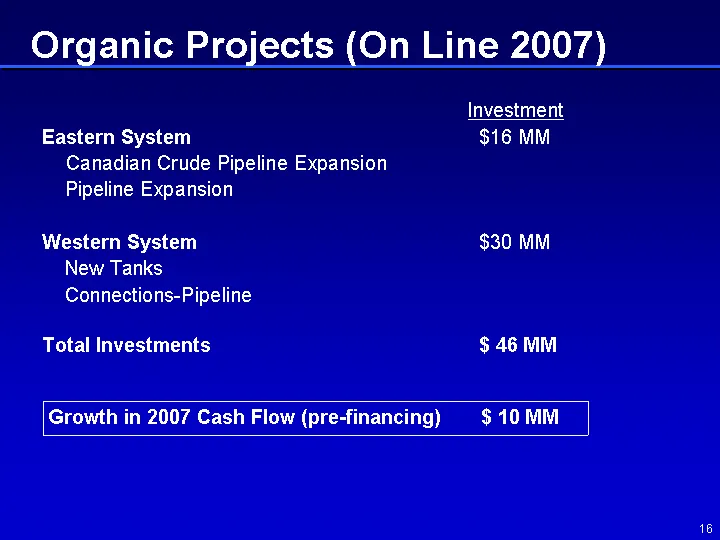
Organic Projects (On Line 2007) Investment Eastern System $16 MM Canadian Crude Pipeline Expansion Pipeline Expansion Western System $30 MM New Tanks Connections-Pipeline Total Investments $ 46 MM Growth in 2007 Cash Flow (pre-financing) $ 10 MM 16
Slide 15: Summary - Growth Initiatives
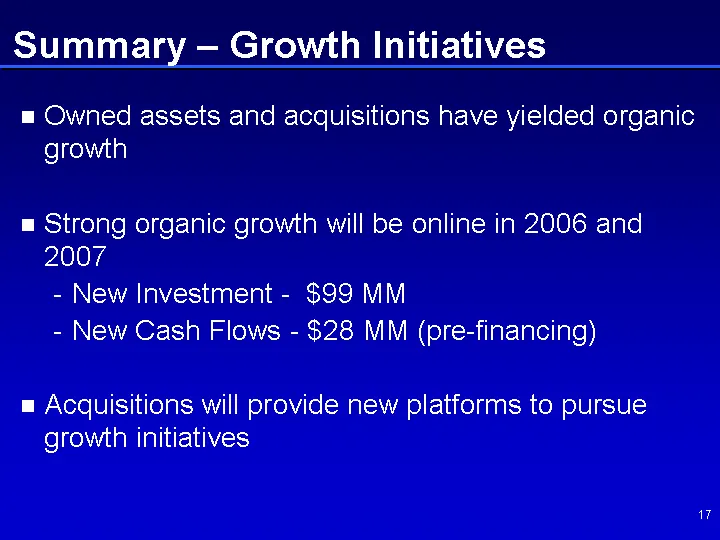
Summary - Growth Initiatives Owned assets and acquisitions have yielded organic growth Strong organic growth will be online in 2006 and 2007 New Investment - $99 MM New Cash Flows - $28 MM (pre-financing) Acquisitions will provide new platforms to pursue growth initiatives 17
Slide 16: Unit Price Performance vs. Indices and Peers
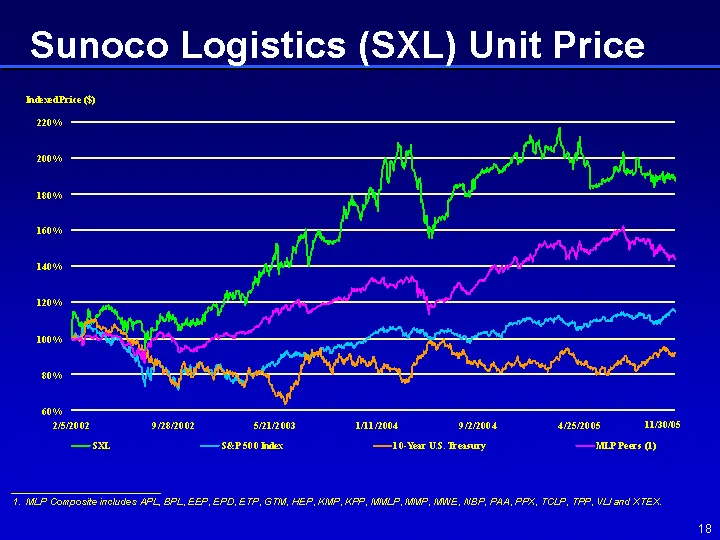
SXL S&P 500 Index 10-Year U.S. Treasury MLP Peers (1) 2/5/2002 1 1 1 1 2/6/2002 1.115 0.994 1.008 0.995 2/7/2002 1.141 0.991 1.006 0.992 2/8/2002 1.146 1.006 0.997 0.992 2/11/2002 1.143 1.02 1 0.99 2/12/2002 1.136 1.016 1.015 0.989 2/13/2002 1.135 1.026 1.02 0.993 2/14/2002 1.12 1.024 1.011 0.993 2/
Slide 17: Conclusion
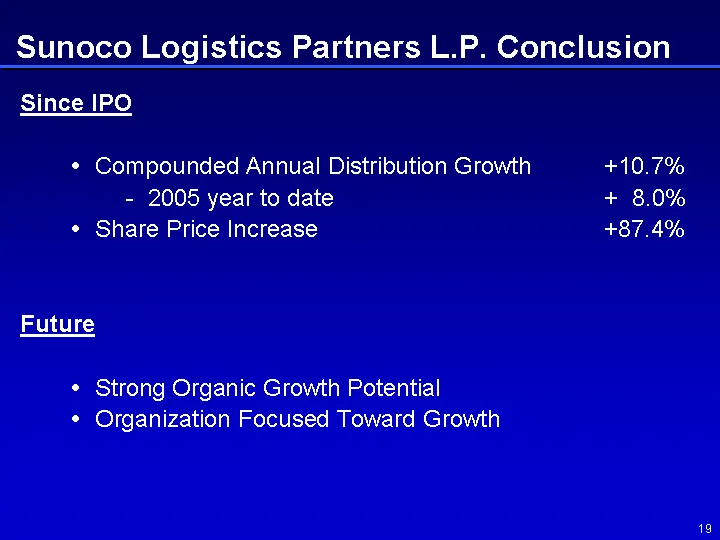
Sunoco Logistics Partners L.P. Conclusion Since IPO Compounded Annual Distribution Growth +10.7% - 2005 year to date + 8.0% Share Price Increase +87.4% Future Strong Organic Growth Potential Organization Focused Toward Growth 19
Slide 18: Sunoco Logistics Partners L.P.
Sunoco Logistics Partners L.P.
Slide 19: Western Crude Oil System
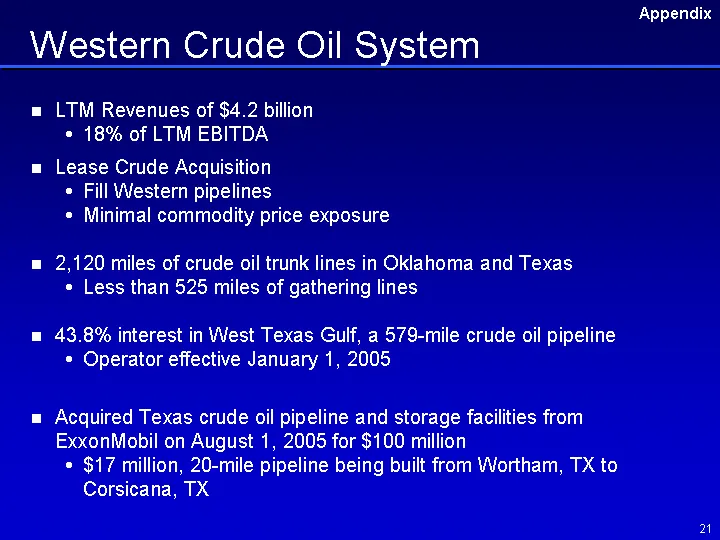
Western Crude Oil System LTM Revenues of $4.2 billion 18% of LTM EBITDA Lease Crude Acquisition Fill Western pipelines Minimal commodity price exposure 2,120 miles of crude oil trunk lines in Oklahoma and Texas Less than 525 miles of gathering lines 43.8% interest in West Texas Gulf, a 579-mile crud
Slide 20: Eastern Pipeline System
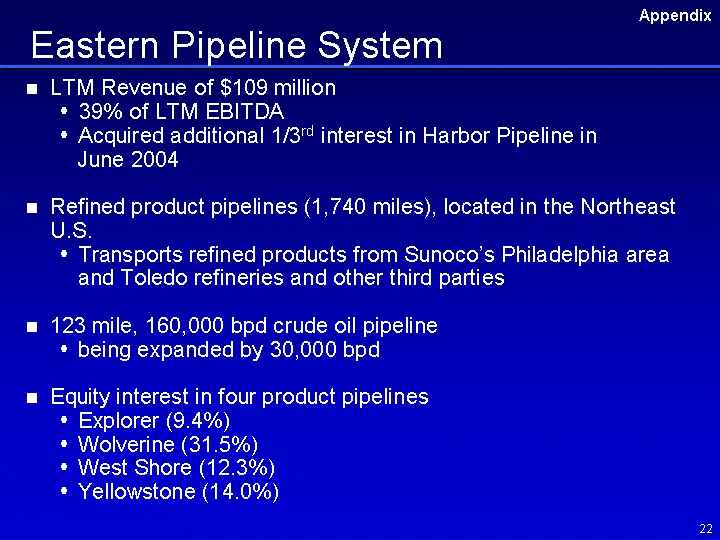
Eastern Pipeline System LTM Revenue of $109 million 39% of LTM EBITDA Acquired additional 1/3rd interest in Harbor Pipeline in June 2004 Refined product pipelines (1,740 miles), located in the Northeast U.S. Transports refined products from Sunoco's Philadelphia area and Toledo refineries and other
Slide 21: Terminal Facilities
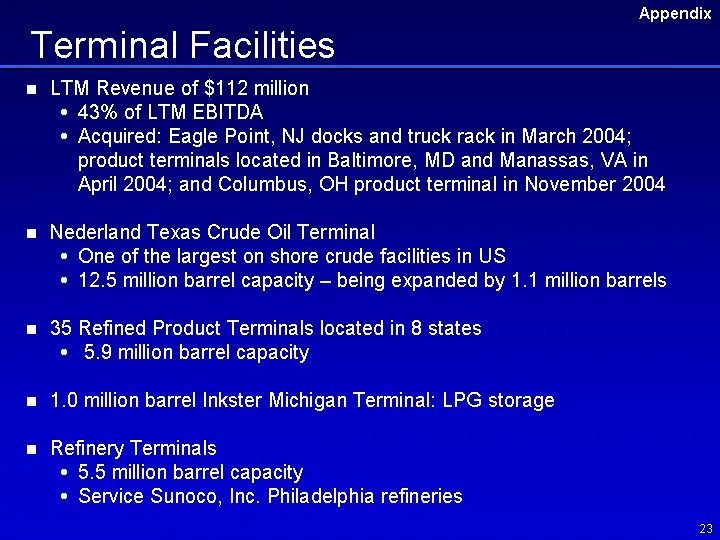
Terminal Facilities LTM Revenue of $112 million 43% of LTM EBITDA Acquired: Eagle Point, NJ docks and truck rack in March 2004; product terminals located in Baltimore, MD and Manassas, VA in April 2004; and Columbus, OH product terminal in November 2004 Nederland Texas Crude Oil Terminal One of the
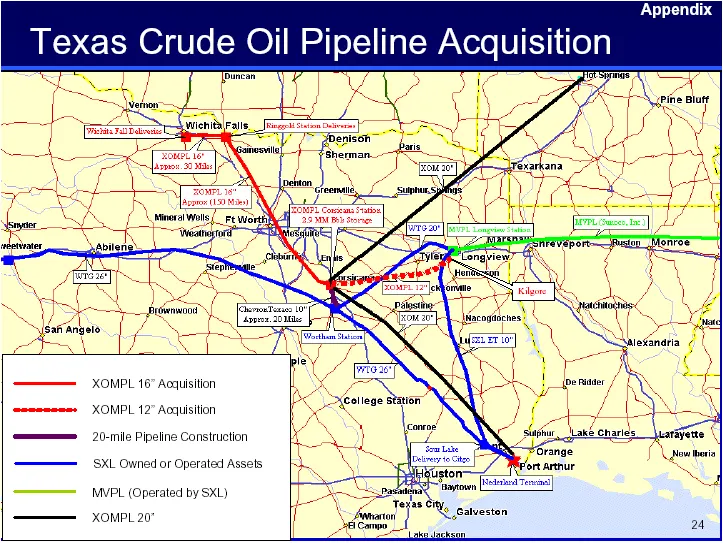
Slide 22: Texas Crude Oil Pipeline Acquisition
Texas Crude Oil Pipeline Acquisition XOMPL 16" Acquisition SXL Owned or Operated Assets 20-mile Pipeline Construction XOMPL 20" MVPL (Operated by SXL) XOMPL 12" Acquisition Kilgore Appendix 24
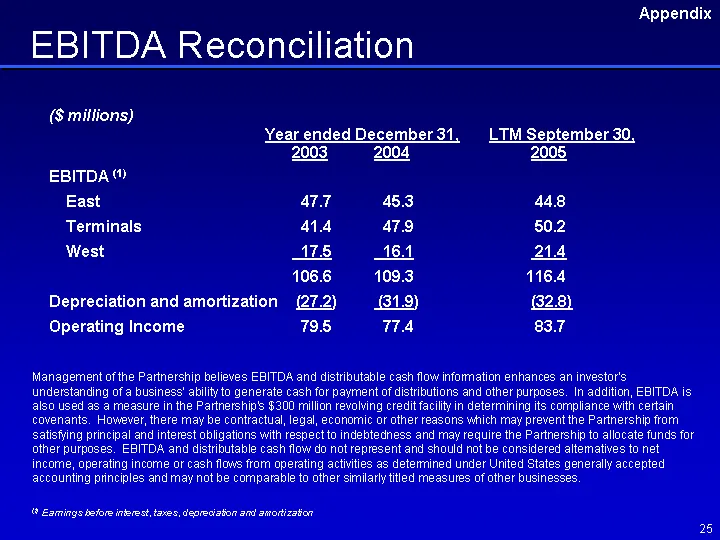
Slide 23: EBITDA Reconciliation
EBITDA Reconciliation ($ millions) Year ended December 31, LTM September 30, 2003 2004 2005 EBITDA (1) East 47.7 45.3 44.8 Terminals 41.4 47.9 50.2 West 17.5 16.1 21.4 106.6 109.3 116.4 Depreciation and amortization (27.2) (31.9) (32.8) Operating Income 79.5 77.4 83.7 Management of the Partnership b
Source: SEC EDGAR · 8-K filed Dec 6, 2005
More decks from Energy Transfer Partners L.P
 Barclays CEO Energy-Power Conference 201844 slides · Sep 6, 2018
 2018 Citi One-on-One MLP / Midstream Infrastructure Conference43 slides · Aug 15, 2018
 Merger or Acquisition (August 2018)7 slides · Aug 2, 2018
 Sunoco Logistics Partners — Merger or Acquisition (November 2016)22 slides · Nov 21, 2016
 Sunoco Logistics Partners — IPO Roadshow (September 2016)8 slides · Sep 26, 2016
 Sunoco Logistics Partners — Q4 2011 Earnings Presentation16 slides · Jan 27, 2012