Energy Transfer Partners L.P — Barclays CEO Energy-Power Conference 2018
44 slides from Energy Transfer Partners L.P's conference presentation, Sep 6, 2018
Slide 1: Energy Transfer Equity & Energy Transfer Partners Barclays CEO Energy-Power Conference
Energy Transfer Equity & Energy Transfer Partners Barclays CEO Energy-Power Conference September 5, 2018 Filed by Energy Transfer Partners, L.P. pursuant to Rule 425 under the Securities Act of 1933 and deemed filed pursuant to Rule 14a-12 under the Securities Exchange Act of 1934 Subject Company: E

Slide 2: Forward-Looking Statements / Legal Disclaimer
Forward-Looking Statements / Legal Disclaimer Management of Energy Transfer Equity, L.P. (ETE) and Energy Transfer Partners, L.P. (ETP) will provide this presentation to analysts at meetings to be held on November 5th, 2018. At the meetings, members of management may make statements about future eve
Slide 3: ETP Highlights
ETP Highlights
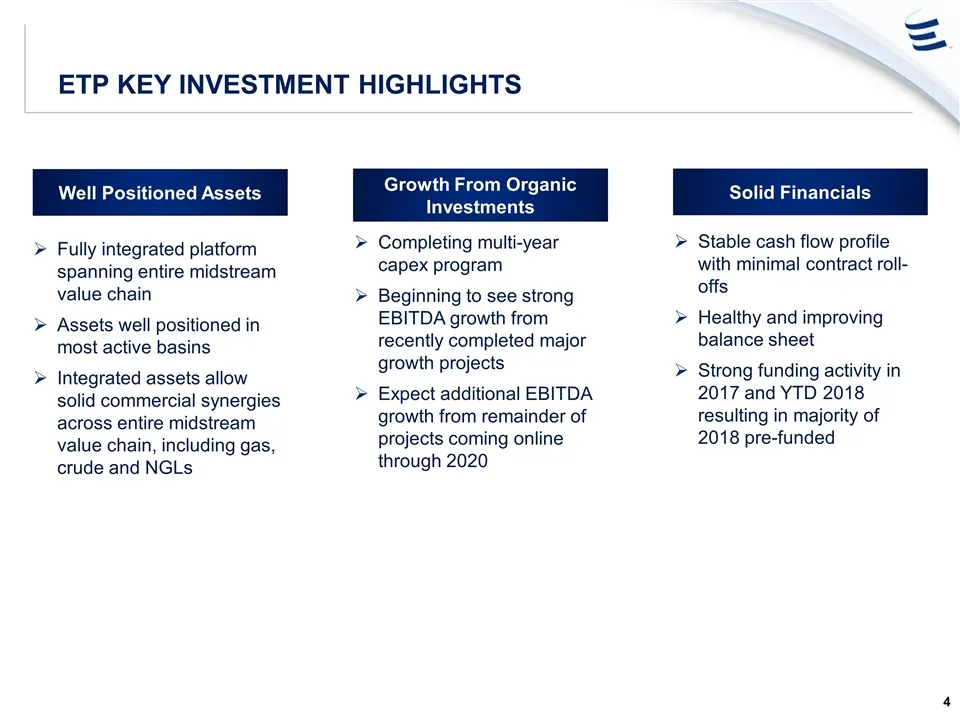
Slide 4: ETP Key Investment Highlights
ETP Key Investment Highlights Growth From Organic Investments Solid Financials Stable cash flow profile with minimal contract roll-offs Healthy and improving balance sheet Strong funding activity in 2017 and YTD 2018 resulting in majority of 2018 pre-funded Completing multi-year capex program Beginn
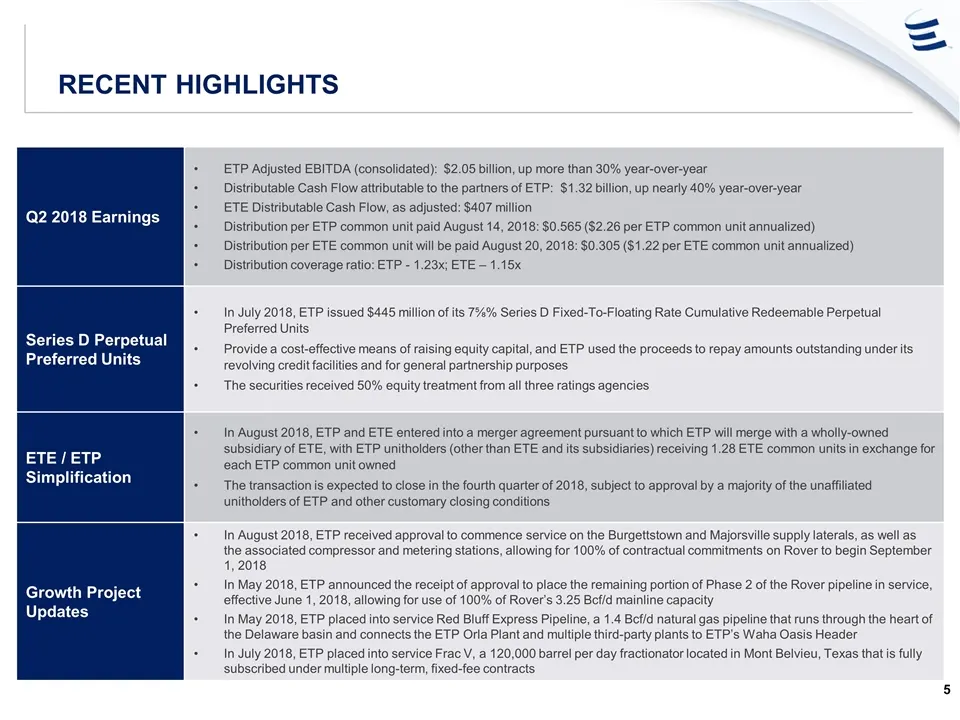
Slide 5: Recent Highlights Q2 2018 Earnings
Recent Highlights Q2 2018 Earnings ETP Adjusted EBITDA (consolidated): $2.05 billion, up more than 30% year-over-year Distributable Cash Flow attributable to the partners of ETP: $1.32 billion, up nearly 40% year-over-year ETE Distributable Cash Flow, as adjusted: $407 million Distribution per ETP c
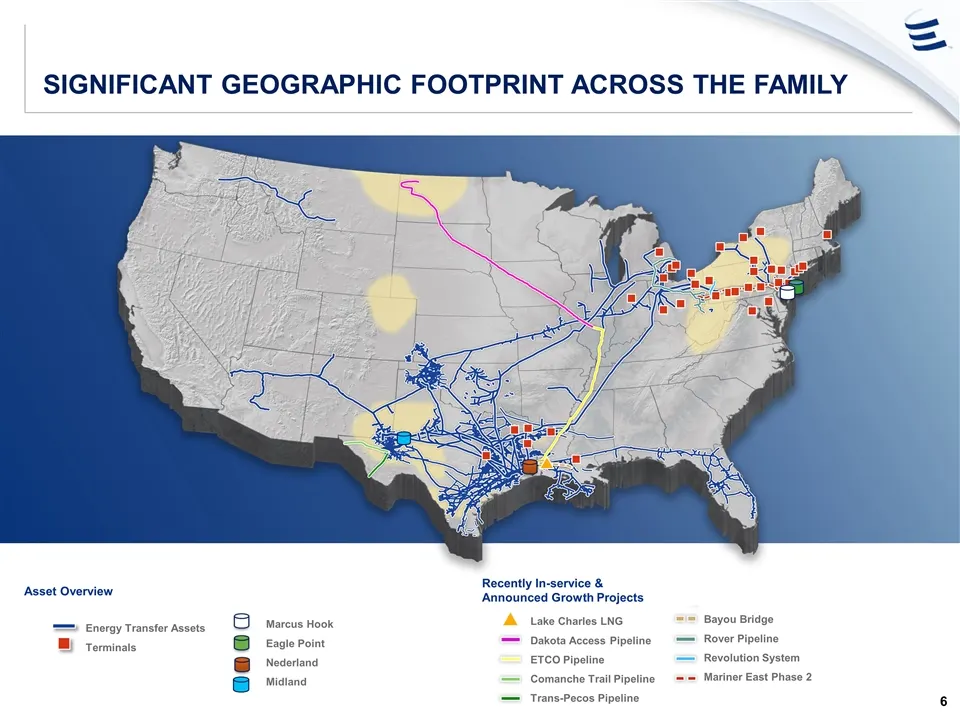
Slide 6: Recently In-service & Announced Growth Projects
Recently In-service & Announced Growth Projects Significant geographic footprint across the Family Midland 6 Asset Overview Lake Charles LNG Dakota Access Pipeline ETCO Pipeline Comanche Trail Pipeline Trans-Pecos Pipeline Bayou Bridge Rover Pipeline Revolution System Mariner East Phase 2 Marcus Hoo
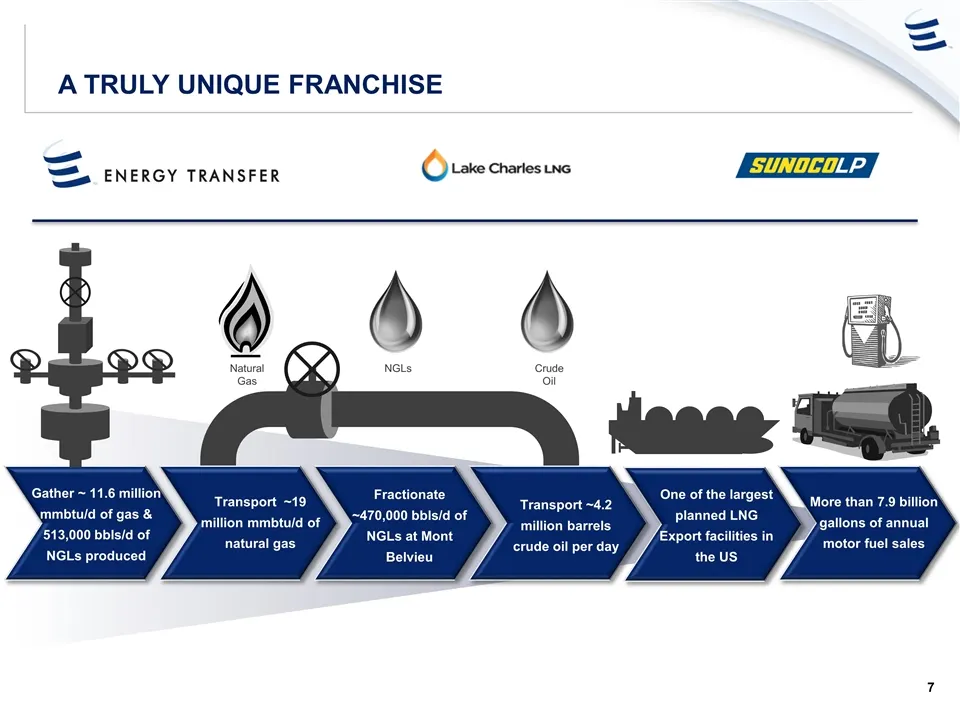
Slide 7: A truly unique franchise
A truly unique franchise 7 Transport ~19 million mmbtu/d of natural gas Fractionate ~470,000 bbls/d of NGLs at Mont Belvieu Gather ~ 11.6 million mmbtu/d of gas & 513,000 bbls/d of NGLs produced Transport ~4.2 million barrels crude oil per day Natural Gas NGLs Crude Oil One of the largest planned LN
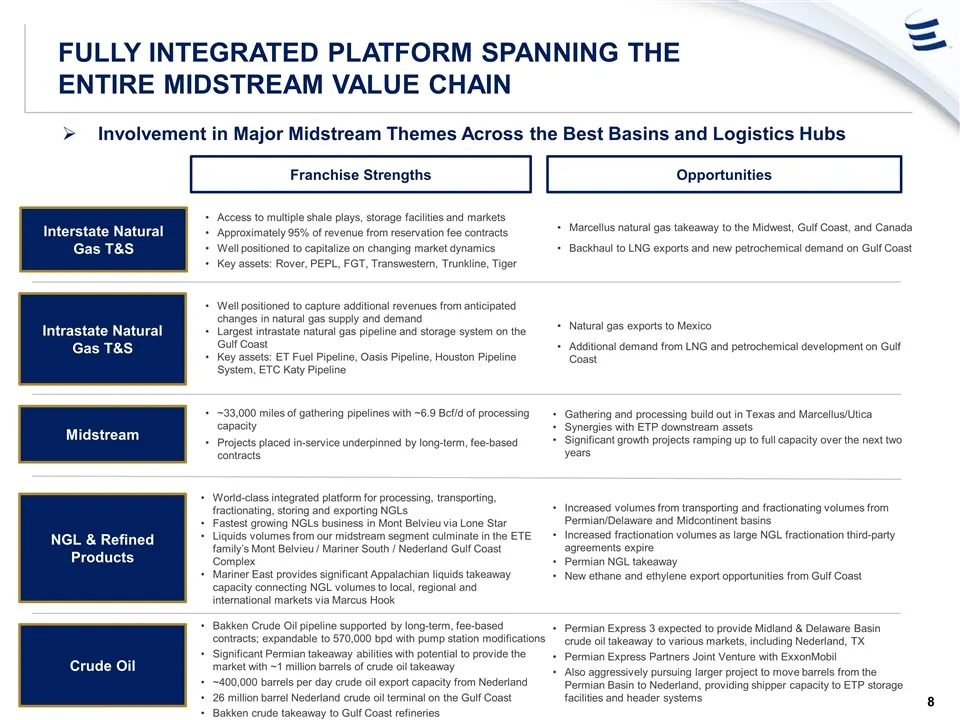
Slide 8: Fully Integrated Platform Spanning the Entire Midstream Value Chain
Fully Integrated Platform Spanning the Entire Midstream Value Chain Involvement in Major Midstream Themes Across the Best Basins and Logistics Hubs Interstate Natural Gas T&S Franchise Strengths Intrastate Natural Gas T&S Midstream Crude Oil NGL & Refined Products Access to multiple shale plays, sto
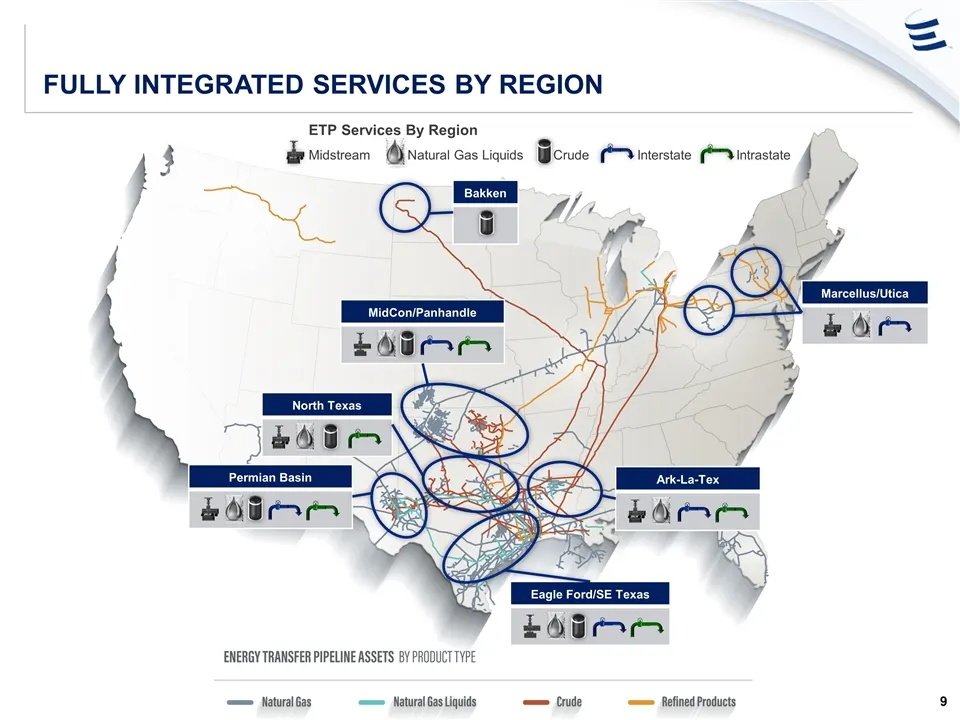
Slide 9: ETP Services By Region
ETP Services By Region Midstream Natural Gas Liquids Crude Interstate Intrastate Fully Integrated Services By Region Midland 9 Permian Basin MidCon/Panhandle Eagle Ford/SE Texas Ark-La-Tex North Texas Marcellus/Utica Bakken
Slide 10: ETP Assets Aligned with Major U.S. Drilling Regions
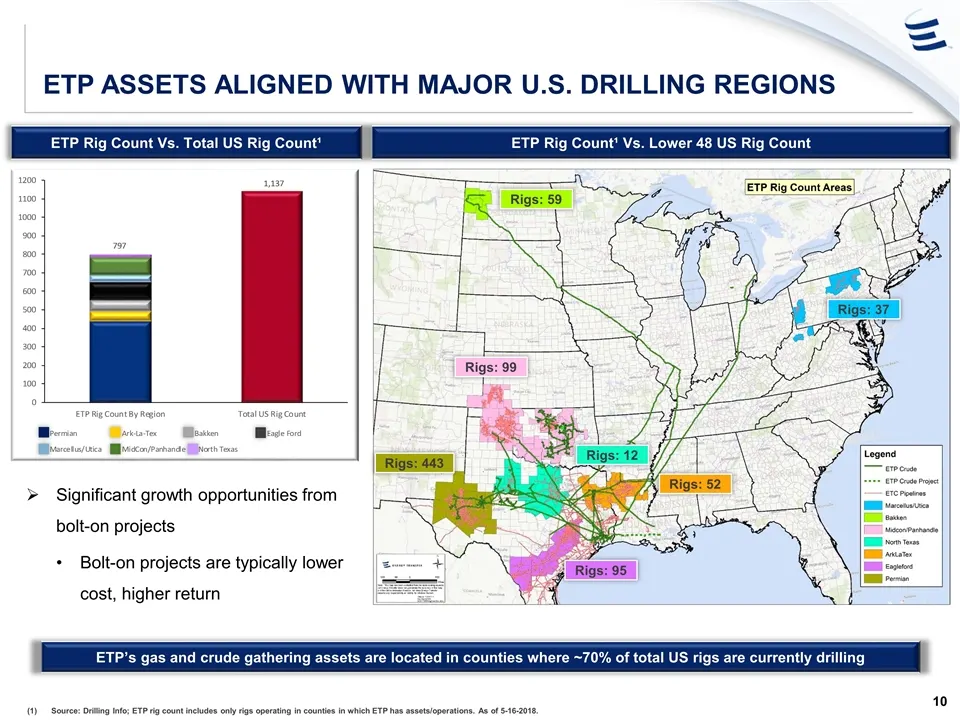
ETP Assets Aligned with Major U.S. Drilling Regions Midland 10 ETP’s gas and crude gathering assets are located in counties where ~70% of total US rigs are currently drilling ETP Rig Count Vs. Total US Rig Count¹ ETP Rig Count¹ Vs. Lower 48 US Rig Count Source: Drilling Info; ETP rig count includes
Slide 11: Fully integrated midstream/liquids platform across North America
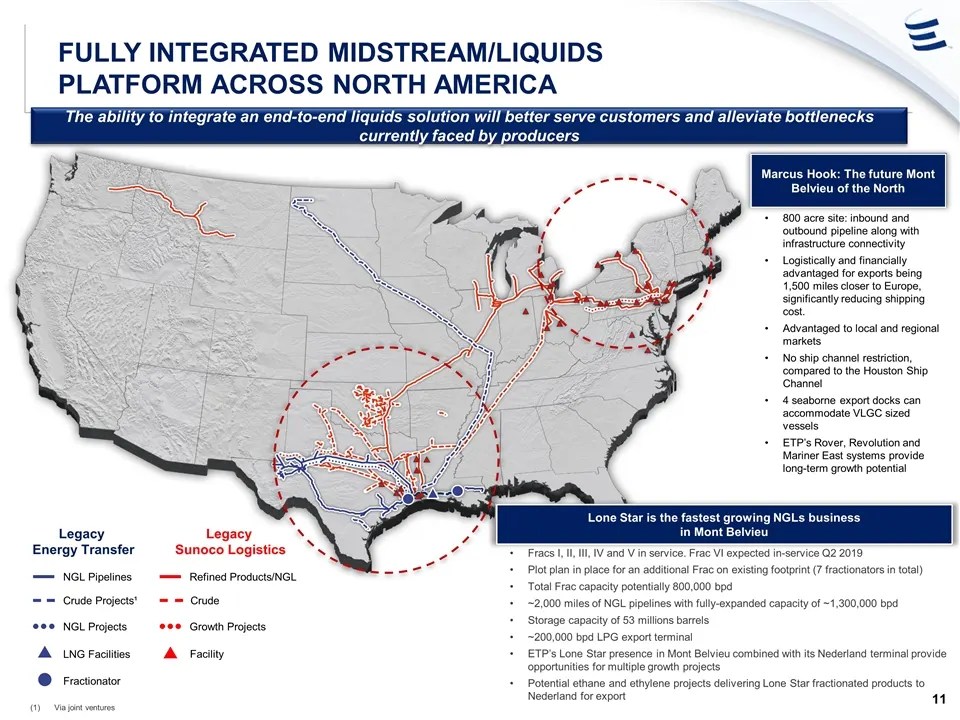
Fully integrated midstream/liquids platform across north America Refined Products/NGL Crude Growth Projects Legacy Sunoco Logistics Facility NGL Pipelines Crude Projects¹ NGL Projects Legacy Energy Transfer LNG Facilities Fractionator The ability to integrate an end-to-end liquids solution will bett
Slide 12: Growth From Organic Investments
Growth From Organic Investments
Slide 13: Organic growth enhances the combined entity's strong foothold in prolific basins
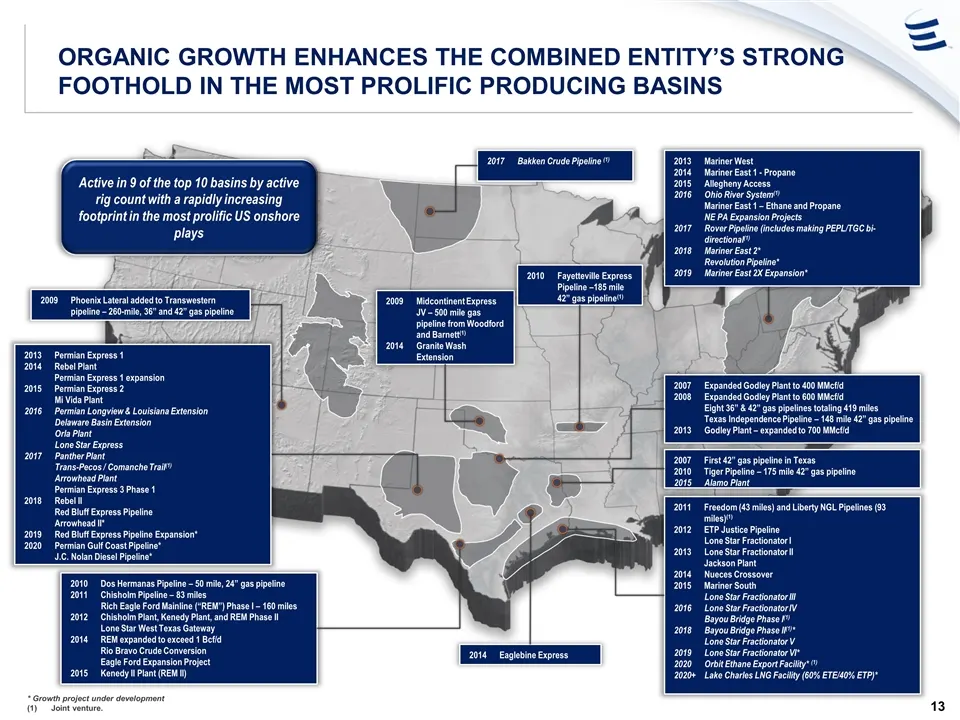
Organic growth enhances the combined entity’s strong foothold in the most prolific producing basins 13 * Growth project under development Joint venture. 2007Expanded Godley Plant to 400 MMcf/d 2008Expanded Godley Plant to 600 MMcf/d Eight 36” & 42” gas pipelines totaling 419 miles Texas Independence
Slide 14: ETP Projects provide visibility for future EBITDA Growth
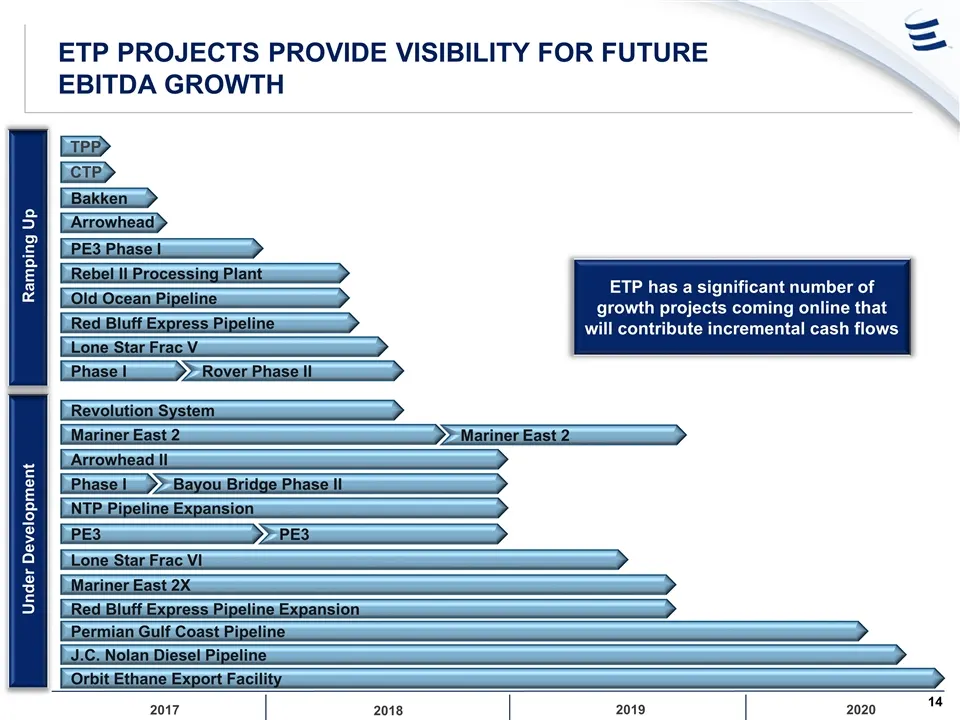
TPP 2020 ETP Projects provide visibility for future EBITDA Growth 14 Mariner East 2X Lone Star Frac V Rebel II Processing Plant Phase I Red Bluff Express Pipeline Revolution System Under Development Phase I PE3 Phase I Lone Star Frac VI 2017 2018 2019 ETP has a significant number of growth projects
Slide 15: Foresee significant EBITDA growth in 2018 from completion of project backlog
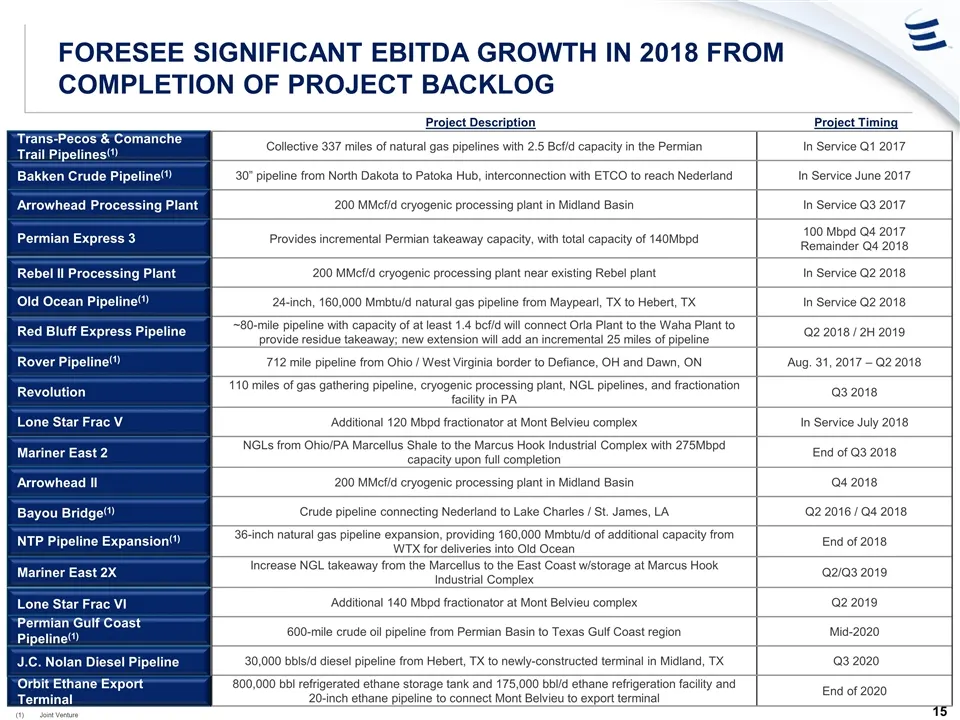
Foresee significant eBitda growth in 2018 from completion of project backlog 15 Red Bluff Express Pipeline Bakken Crude Pipeline(1) Arrowhead Processing Plant Project Timing Collective 337 miles of natural gas pipelines with 2.5 Bcf/d capacity in the Permian In Service Q1 2017 30” pipeline from Nort
Slide 16: Crude oil segment - Bakken pipeline Project
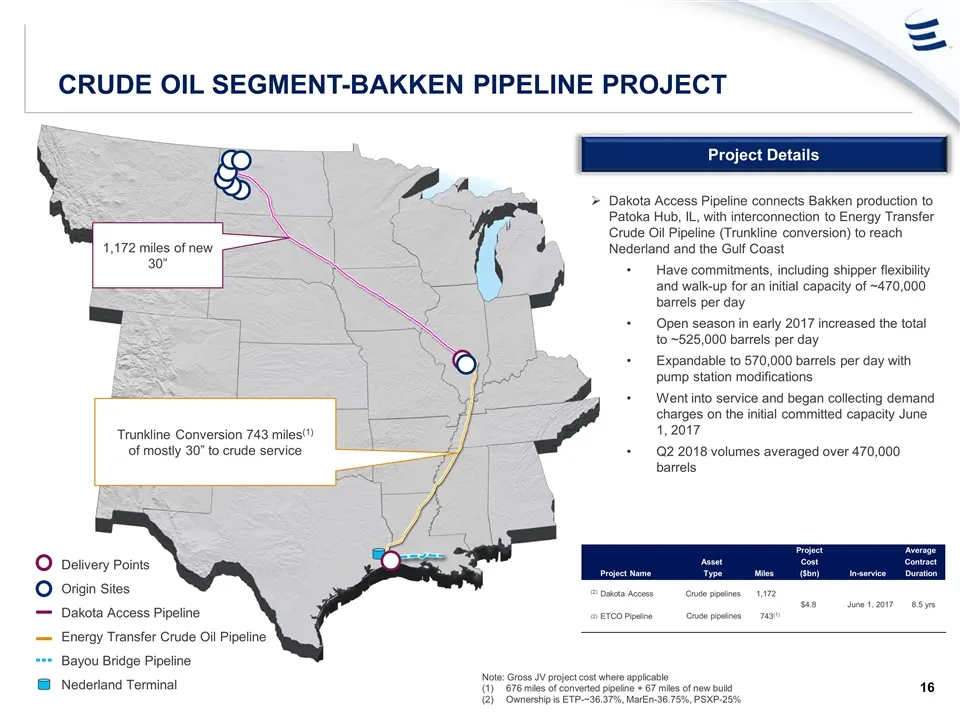
Crude oil segment-Bakken pipeline Project 1,172 miles of new 30” Trunkline Conversion 743 miles(1) of mostly 30” to crude service Dakota Access Pipeline connects Bakken production to Patoka Hub, IL, with interconnection to Energy Transfer Crude Oil Pipeline (Trunkline conversion) to reach Nederland
Slide 17: Crude oil Segment – Permian Express Projects
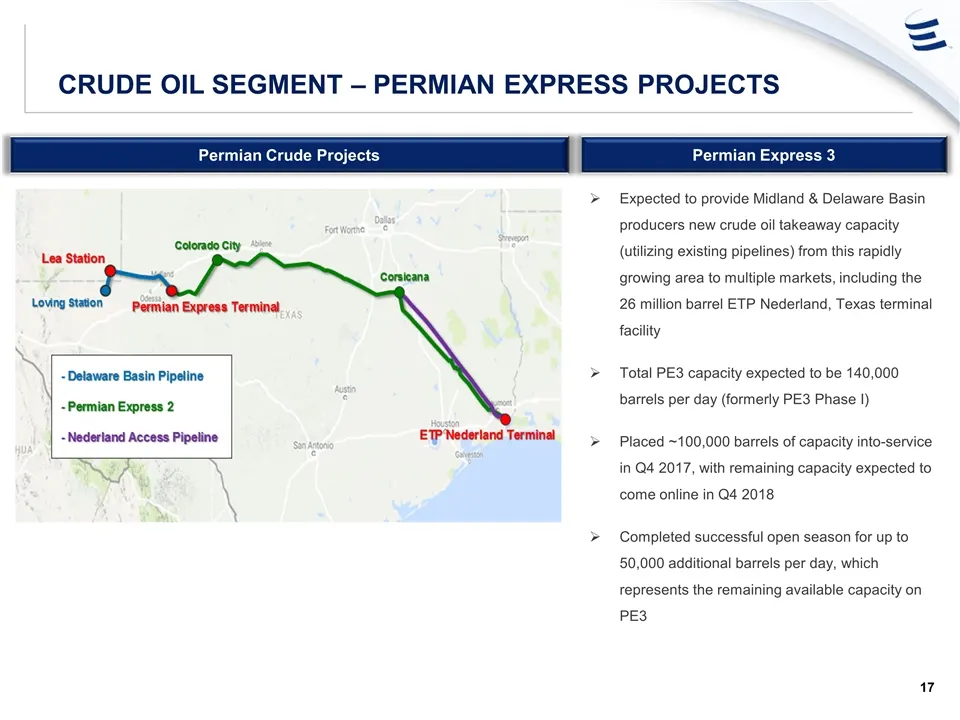
Expected to provide Midland & Delaware Basin producers new crude oil takeaway capacity (utilizing existing pipelines) from this rapidly growing area to multiple markets, including the 26 million barrel ETP Nederland, Texas terminal facility Total PE3 capacity expected to be 140,000 barrels per day (
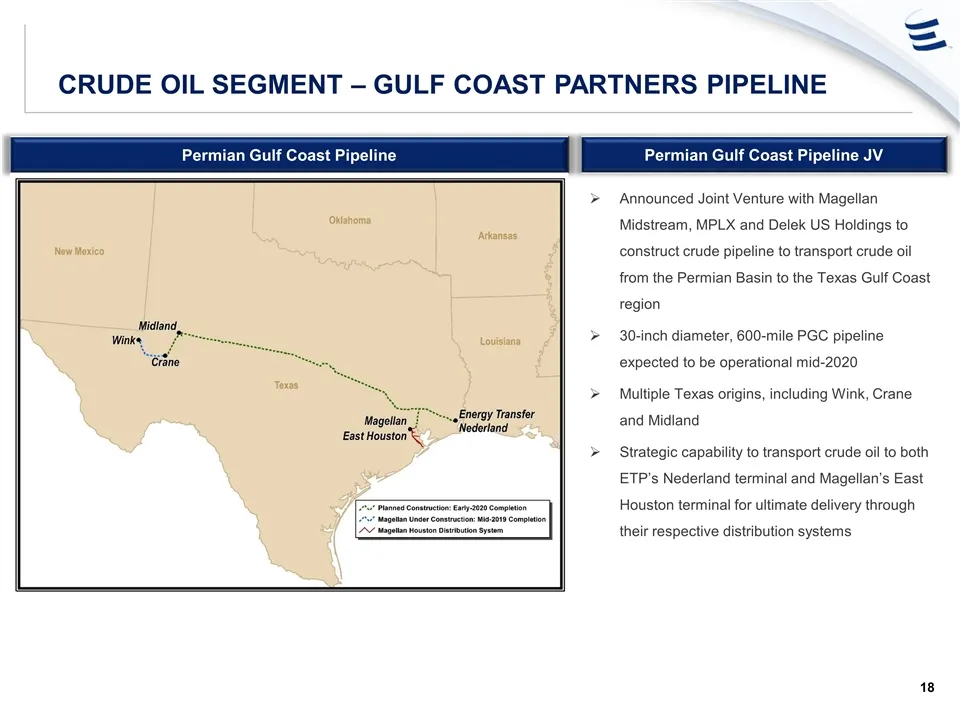
Slide 18: Crude oil Segment – Gulf Coast Partners Pipeline
Announced Joint Venture with Magellan Midstream, MPLX and Delek US Holdings to construct crude pipeline to transport crude oil from the Permian Basin to the Texas Gulf Coast region 30-inch diameter, 600-mile PGC pipeline expected to be operational mid-2020 Multiple Texas origins, including Wink, Cra
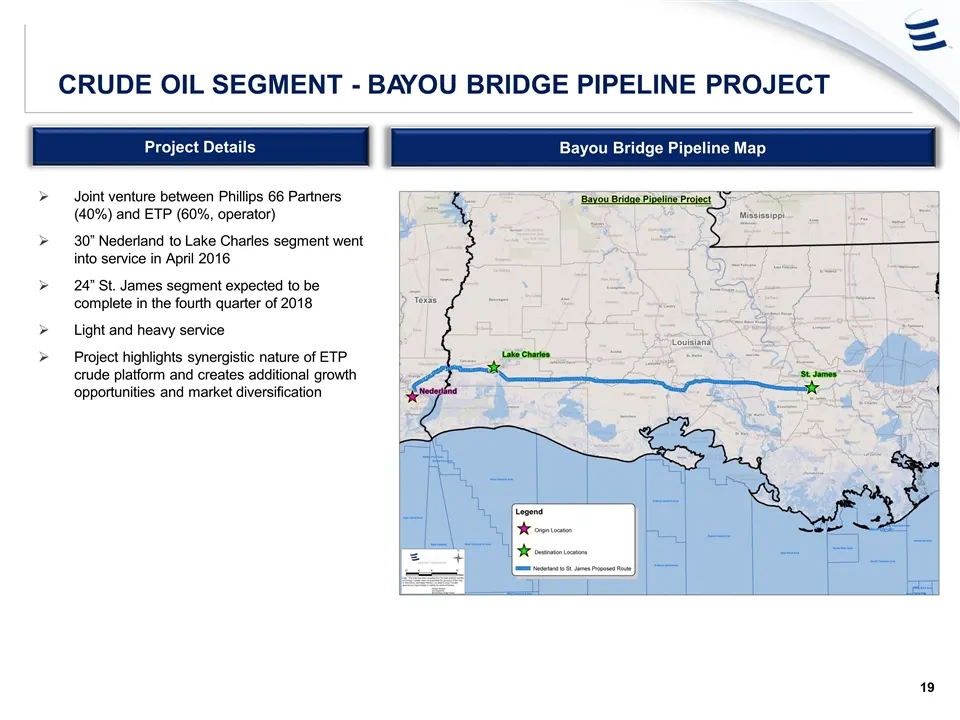
Slide 19: Crude oil segment - Bayou Bridge Pipeline Project
Crude oil segment - bAYOU BRIDGE PIPELINE PROJECT Joint venture between Phillips 66 Partners (40%) and ETP (60%, operator) 30” Nederland to Lake Charles segment went into service in April 2016 24” St. James segment expected to be complete in the fourth quarter of 2018 Light and heavy service Project
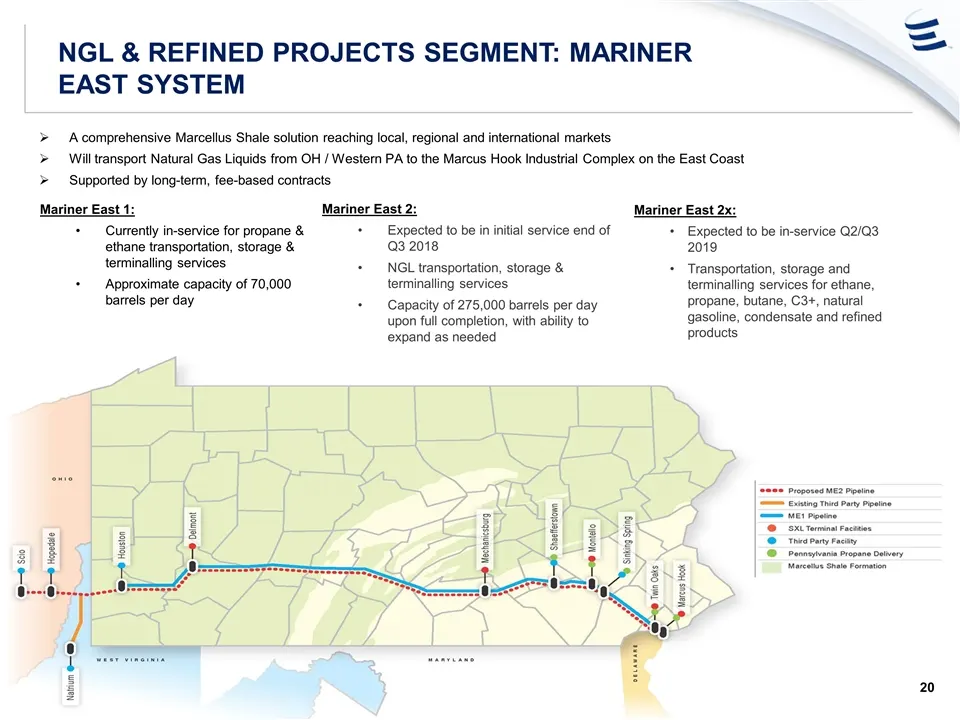
Slide 20: NGL & Refined Projects Segment: Mariner East System
NGL & Refined Projects Segment: Mariner East System A comprehensive Marcellus Shale solution reaching local, regional and international markets Will transport Natural Gas Liquids from OH / Western PA to the Marcus Hook Industrial Complex on the East Coast Supported by long-term, fee-based contracts
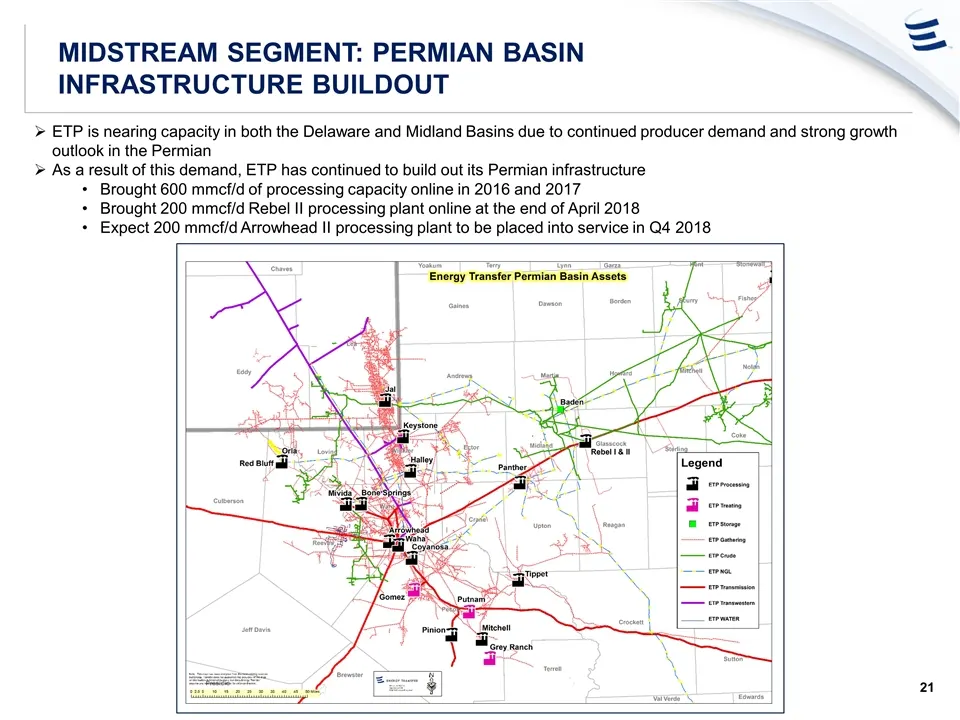
Slide 21: Midstream Segment: Permian Basin Infrastructure Buildout
Midstream Segment: Permian Basin Infrastructure Buildout 21 ETP is nearing capacity in both the Delaware and Midland Basins due to continued producer demand and strong growth outlook in the Permian As a result of this demand, ETP has continued to build out its Permian infrastructure Brought 600 mmcf
Slide 22: Midstream Segment: Revolution System Project
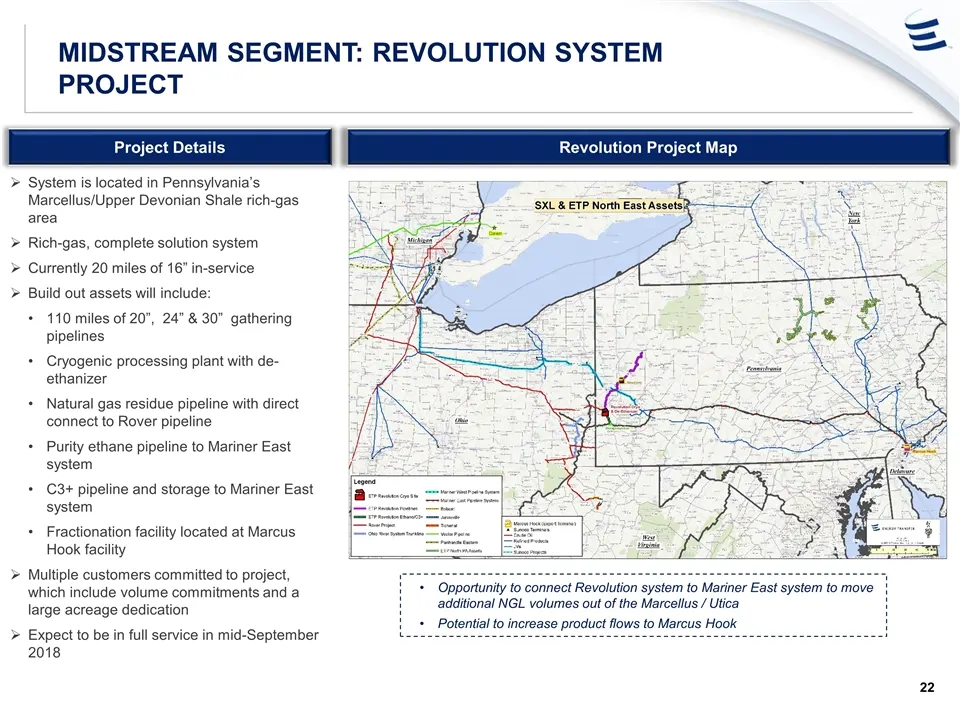
Midstream Segment: Revolution system Project System is located in Pennsylvania’s Marcellus/Upper Devonian Shale rich-gas area Rich-gas, complete solution system Currently 20 miles of 16” in-service Build out assets will include: 110 miles of 20”, 24” & 30” gathering pipelines Cryogenic processing pl
Slide 23: Interstate Segment: Marcellus/Utica Rover Pipeline
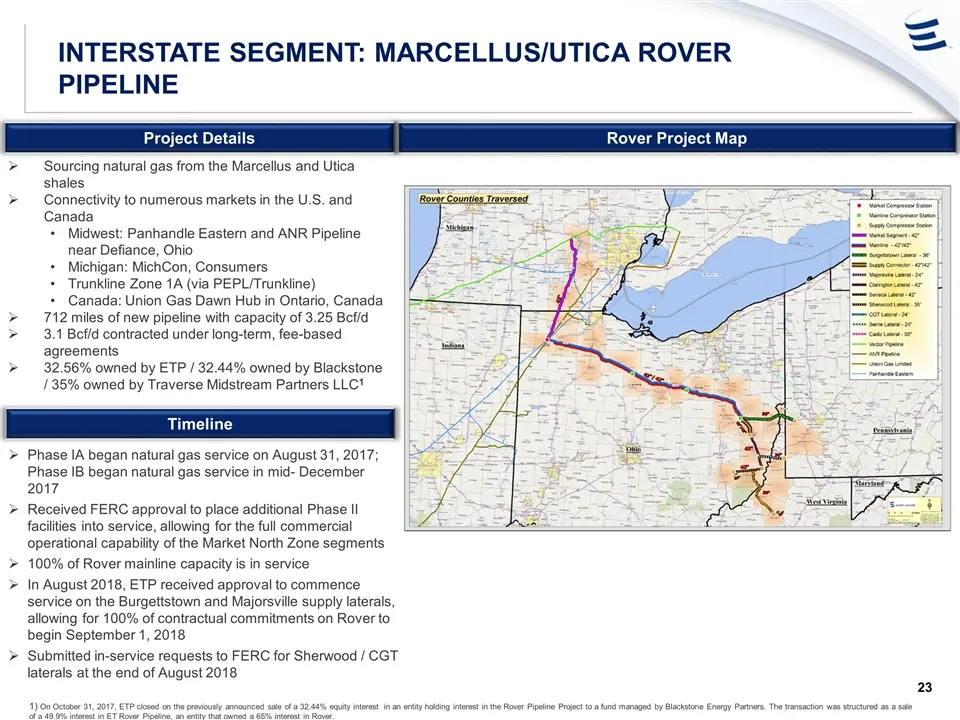
Interstate Segment: Marcellus/Utica Rover Pipeline Rover Project Map Project Details Sourcing natural gas from the Marcellus and Utica shales Connectivity to numerous markets in the U.S. and Canada Midwest: Panhandle Eastern and ANR Pipeline near Defiance, Ohio Michigan: MichCon, Consumers Trunkline

Slide 24: Solid Financials
e SOLID FINANCIALS
Slide 25: Primarily fee-based Business Mix
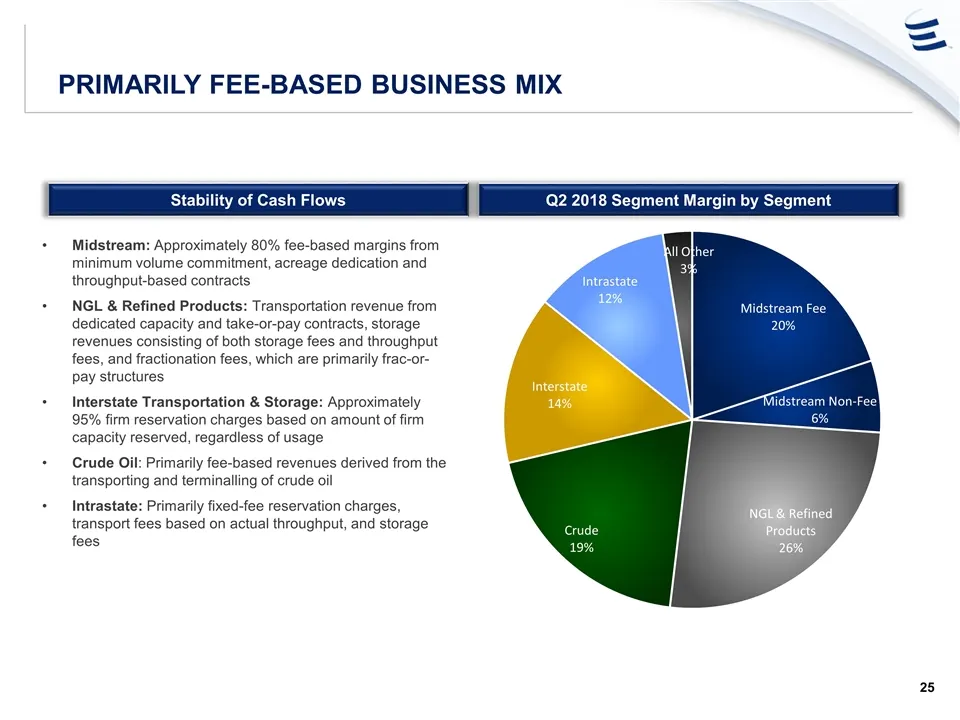
Primarily fee-based Business Mix Midstream: Approximately 80% fee-based margins from minimum volume commitment, acreage dedication and throughput-based contracts NGL & Refined Products: Transportation revenue from dedicated capacity and take-or-pay contracts, storage revenues consisting of both stor
Slide 26: Strong Focus on the Balance Sheet and Liquidity Position
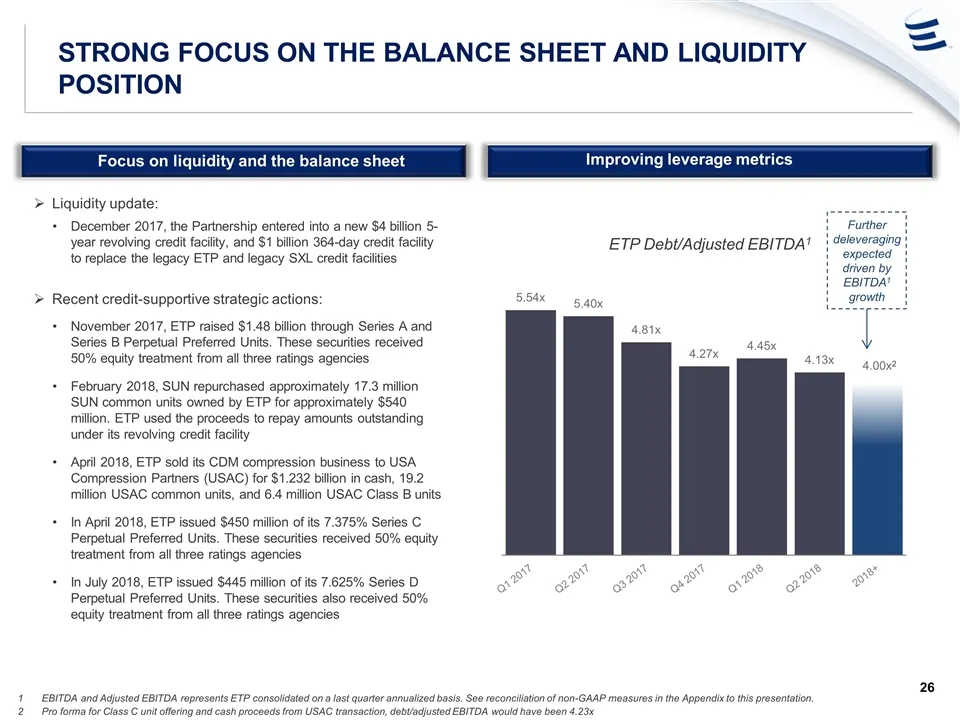
STRONG FOCUS ON THE BALANCE SHEET AND LIQUIDITY POSITION Further deleveraging expected driven by EBITDA1 growth Focus on liquidity and the balance sheet Improving leverage metrics Liquidity update: December 2017, the Partnership entered into a new $4 billion 5-year revolving credit facility, and $1
Slide 27: ETE - ETP Merger Overview
ETE - ETP Merger Overview
Slide 28: Transaction Overview
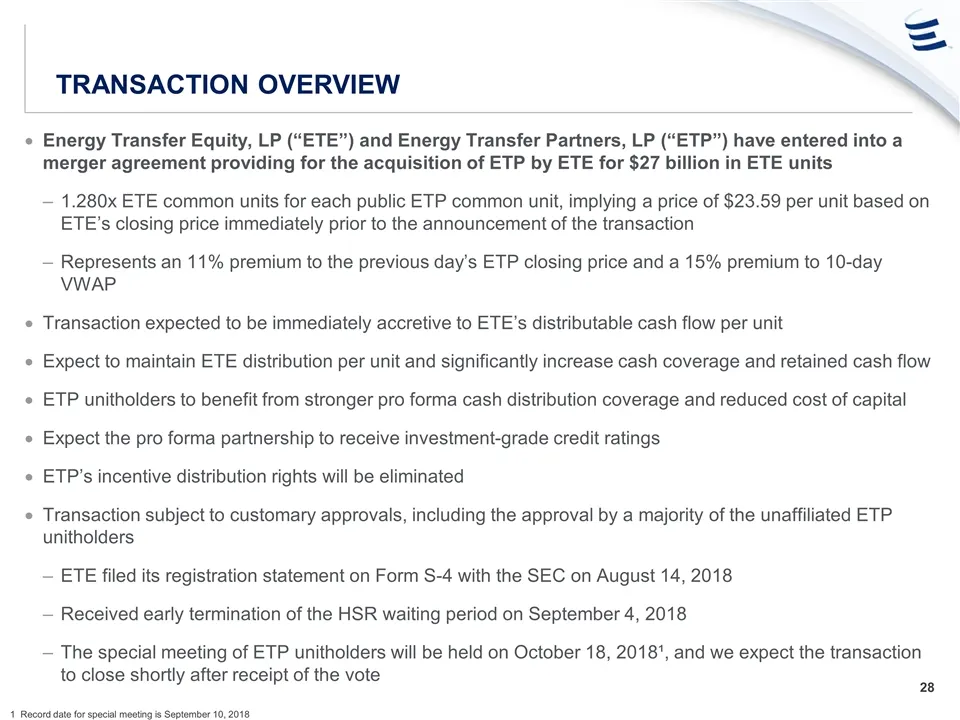
Transaction Overview Energy Transfer Equity, LP (“ETE”) and Energy Transfer Partners, LP (“ETP”) have entered into a merger agreement providing for the acquisition of ETP by ETE for $27 billion in ETE units 1.280x ETE common units for each public ETP common unit, implying a price of $23.59 per unit
Slide 29: Strategic Rationale
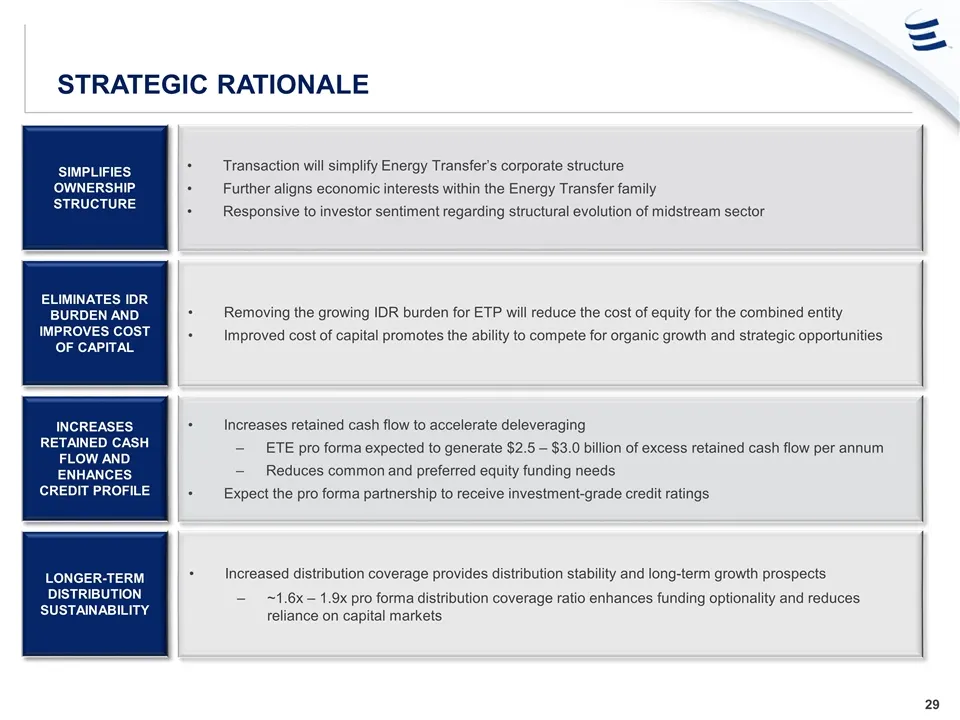
Strategic Rationale Simplifies Ownership structure Transaction will simplify Energy Transfer’s corporate structure Further aligns economic interests within the Energy Transfer family Responsive to investor sentiment regarding structural evolution of midstream sector Eliminates idr burden and Improve
Slide 30: Illustrative Transaction Structure
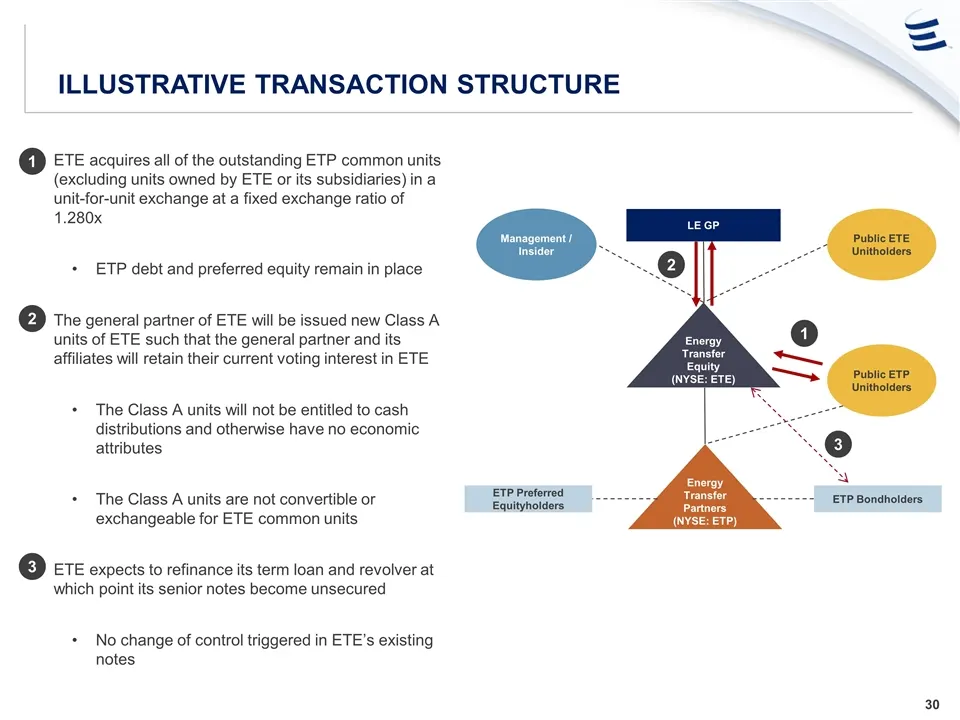
ETE acquires all of the outstanding ETP common units (excluding units owned by ETE or its subsidiaries) in a unit-for-unit exchange at a fixed exchange ratio of 1.280x ETP debt and preferred equity remain in place The general partner of ETE will be issued new Class A units of ETE such that the gener
Slide 31: Enhanced Pro Forma Balance Sheet and Liquidity Position
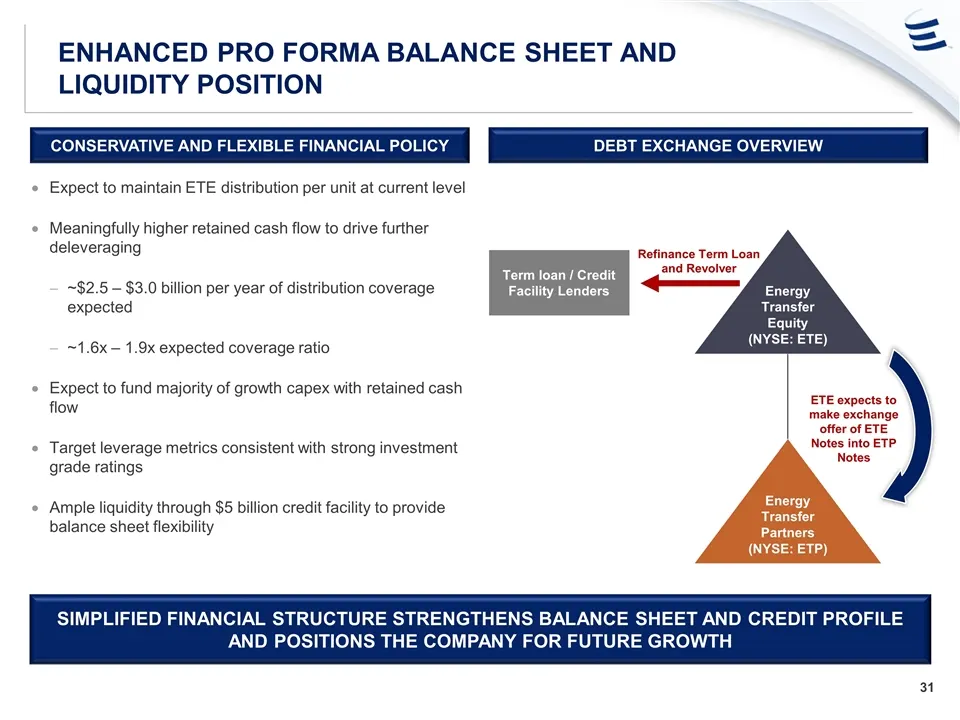
Enhanced Pro Forma Balance Sheet and Liquidity Position 63-63-63 222-222-222 66-68-86 0-32-96 237-187-63 189-211-225 196-101-45 127-127-127 92-146-181 Expect to maintain ETE distribution per unit at current level Meaningfully higher retained cash flow to drive further deleveraging ~$2.5 – $3.0 billi
Slide 32: ETE Class A Unit Overview
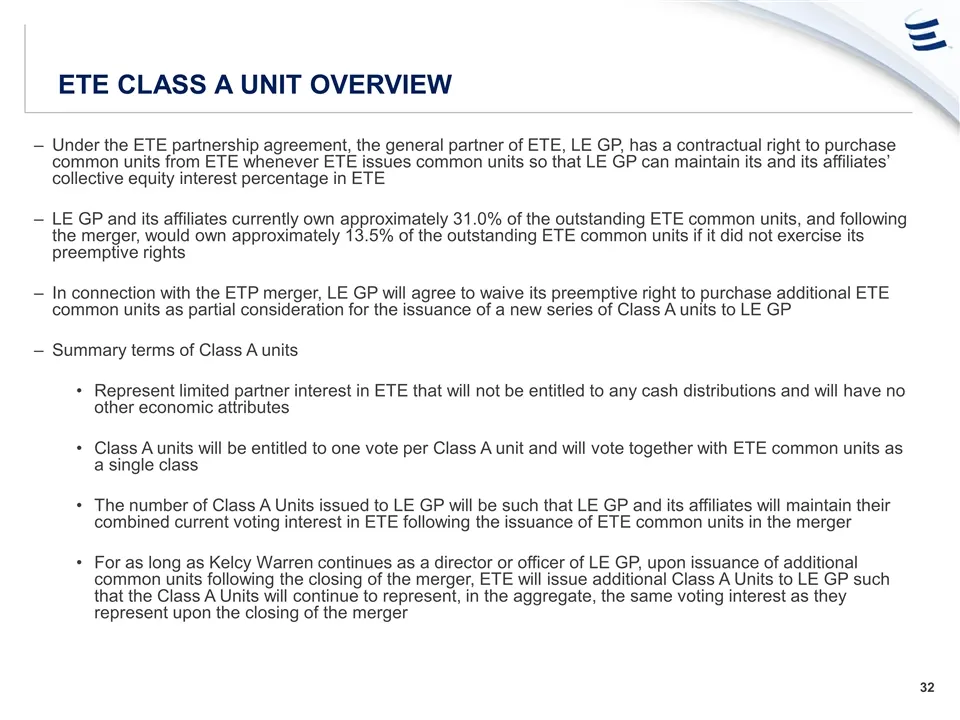
Ete Class a unit overview Under the ETE partnership agreement, the general partner of ETE, LE GP, has a contractual right to purchase common units from ETE whenever ETE issues common units so that LE GP can maintain its and its affiliates’ collective equity interest percentage in ETE LE GP and its a
Slide 33: Key takeaways
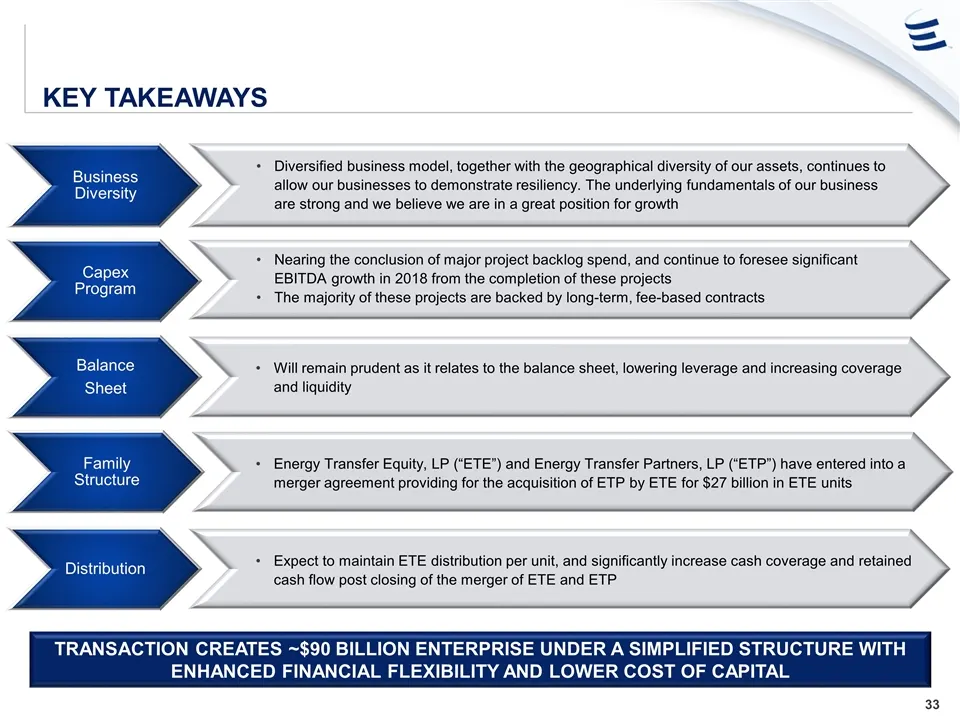
Diversified business model, together with the geographical diversity of our assets, continues to allow our businesses to demonstrate resiliency. The underlying fundamentals of our business are strong and we believe we are in a great position for growth Nearing the conclusion of major project backlog

Slide 34: Appendix
appendix
Slide 35: Crude oil Segment
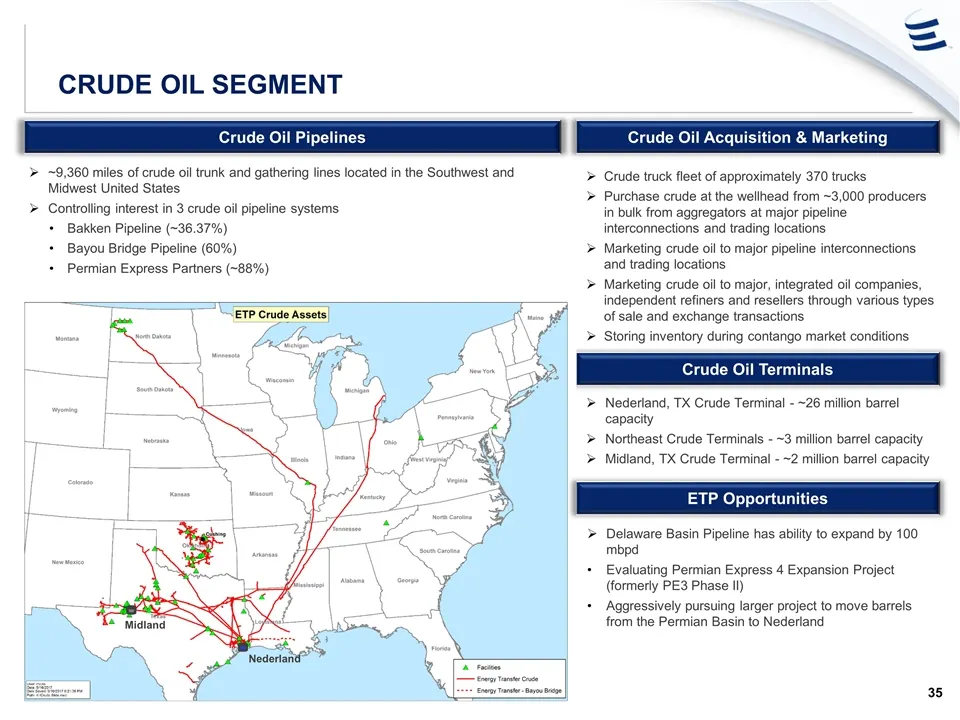
Crude oil Segment Crude truck fleet of approximately 370 trucks Purchase crude at the wellhead from ~3,000 producers in bulk from aggregators at major pipeline interconnections and trading locations Marketing crude oil to major pipeline interconnections and trading locations Marketing crude oil to m
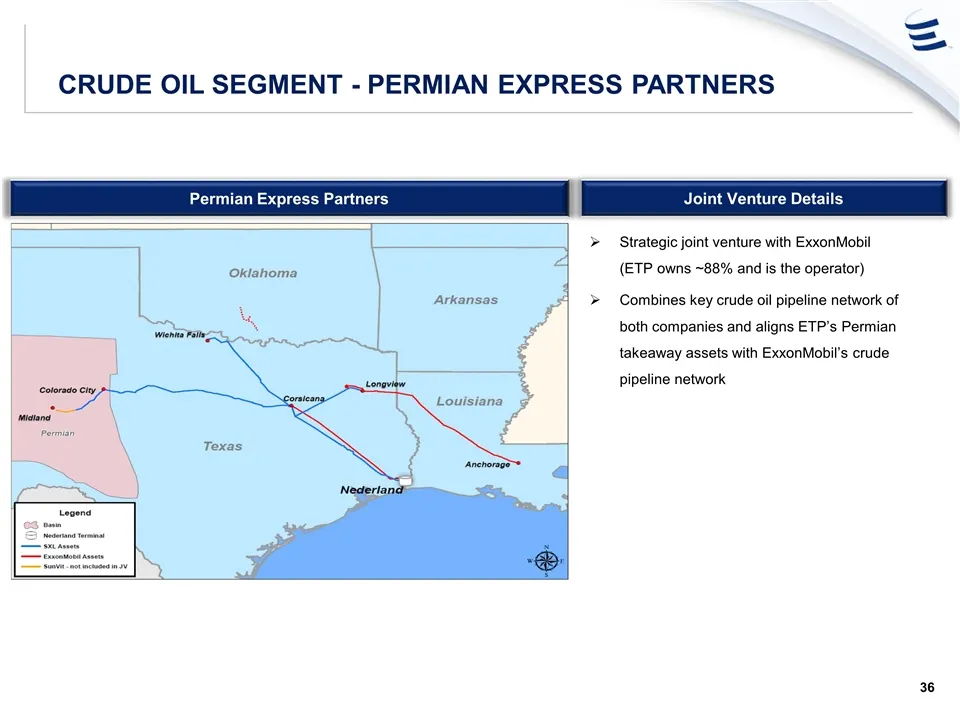
Slide 36: Crude oil segment - Permian Express Partners
Strategic joint venture with ExxonMobil (ETP owns ~88% and is the operator) Combines key crude oil pipeline network of both companies and aligns ETP’s Permian takeaway assets with ExxonMobil’s crude pipeline network Crude oil segment - Permian Express PARTNERS Joint Venture Details Permian Express P
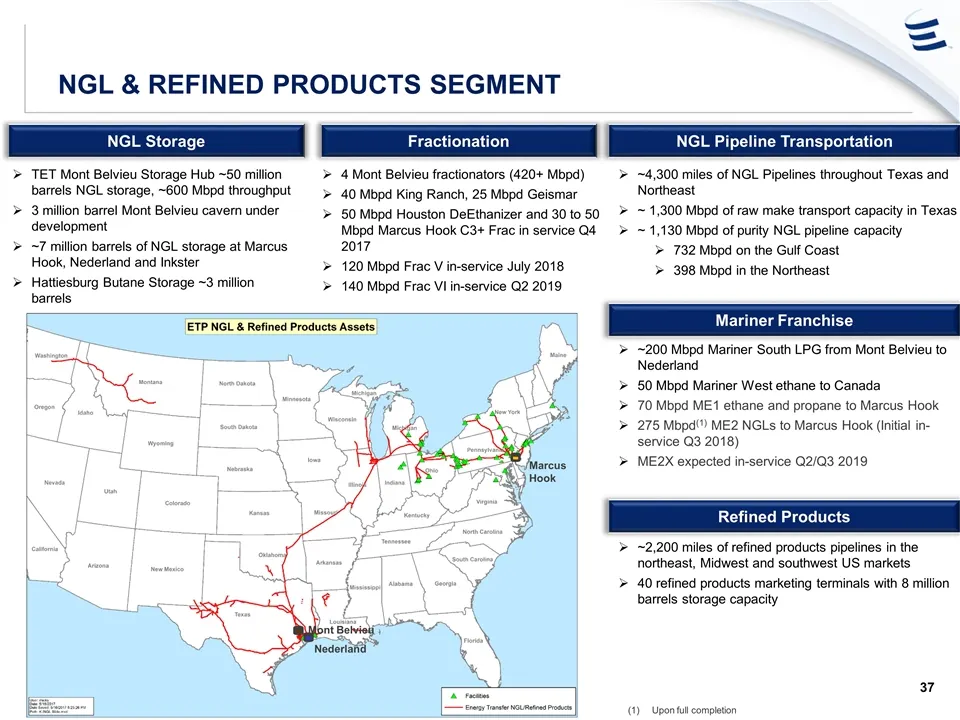
Slide 37: NGL & Refined products Segment
NGL & Refined products Segment NGL Storage Fractionation NGL Pipeline Transportation Refined Products Mariner Franchise ~2,200 miles of refined products pipelines in the northeast, Midwest and southwest US markets 40 refined products marketing terminals with 8 million barrels storage capacity ~4,300
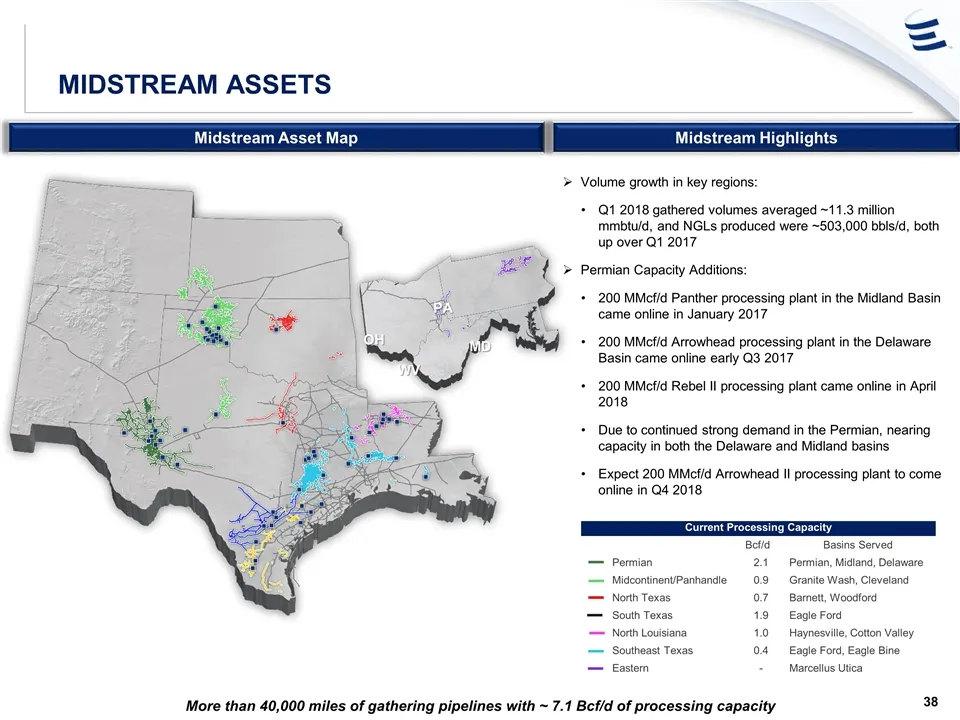
Slide 38: Midstream assets
Midstream assets More than 40,000 miles of gathering pipelines with ~ 7.1 Bcf/d of processing capacity PA WV MD OH Midstream Highlights Volume growth in key regions: Q1 2018 gathered volumes averaged ~11.3 million mmbtu/d, and NGLs produced were ~503,000 bbls/d, both up over Q1 2017 Permian Capacity
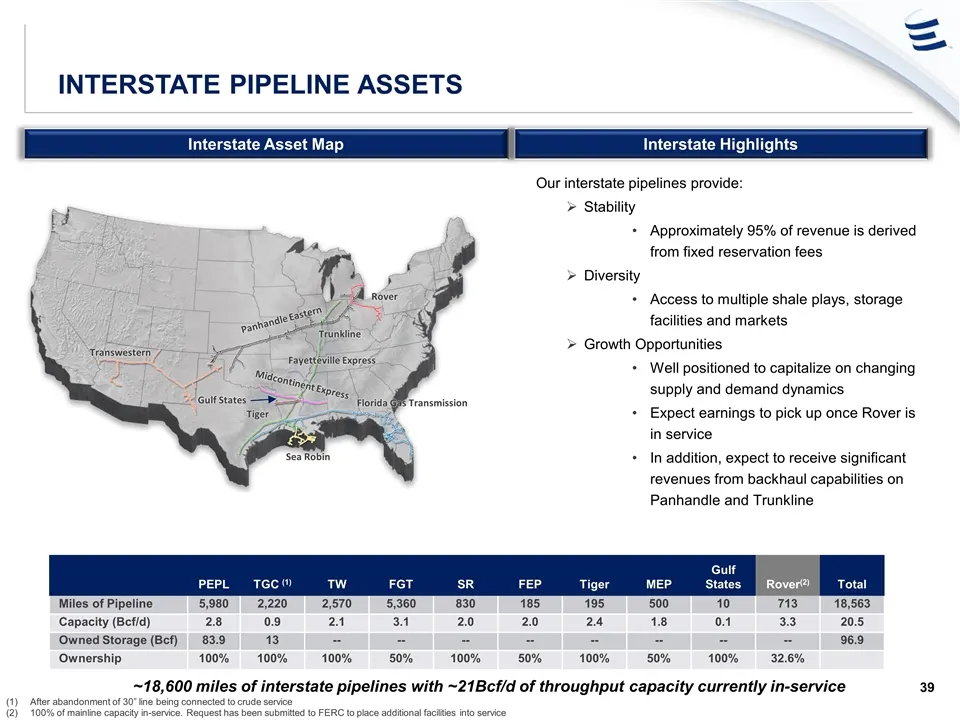
Slide 39: Interstate pipeline assets
Interstate pipeline assets PEPL TGC (1) TW FGT SR FEP Tiger MEP Gulf States Rover(2) Total Miles of Pipeline 5,980 2,220 2,570 5,360 830 185 195 500 10 713 18,563 Capacity (Bcf/d) 2.8 0.9 2.1 3.1 2.0 2.0 2.4 1.8 0.1 3.3 20.5 Owned Storage (Bcf) 83.9 13 -- -- -- -- -- -- -- -- 96.9 Ownership 100% 100
Slide 40: Intrastate Pipeline Assets
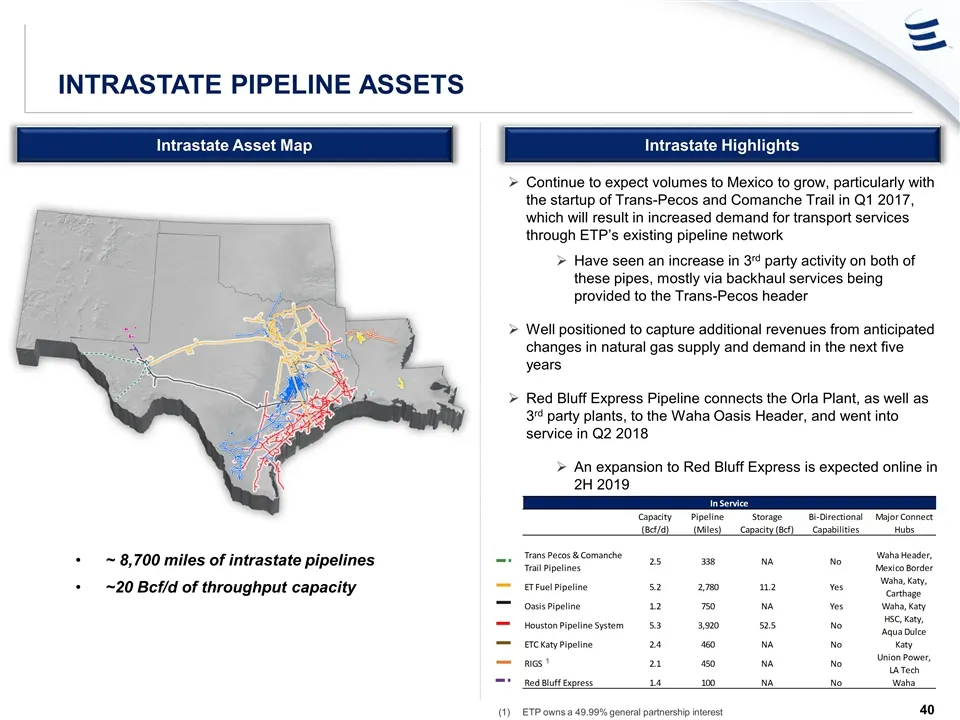
Intrastate Pipeline Assets ~ 8,700 miles of intrastate pipelines ~20 Bcf/d of throughput capacity Intrastate Asset Map Intrastate Highlights Continue to expect volumes to Mexico to grow, particularly with the startup of Trans-Pecos and Comanche Trail in Q1 2017, which will result in increased demand
Slide 41: Intrastate Segment: Mexico (CFE)
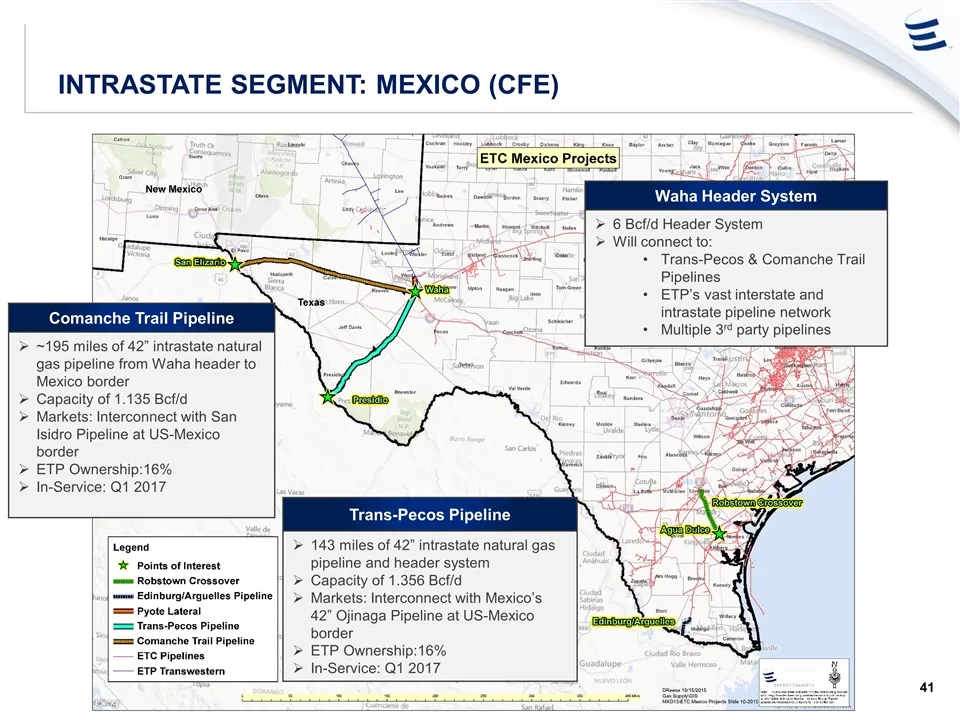
Intrastate Segment: Mexico (CFE) Waha Header System 6 Bcf/d Header System Will connect to: Trans-Pecos & Comanche Trail Pipelines ETP’s vast interstate and intrastate pipeline network Multiple 3rd party pipelines Trans-Pecos Pipeline 143 miles of 42” intrastate natural gas pipeline and header system
Slide 42: ETP Non-GAAP financial measures
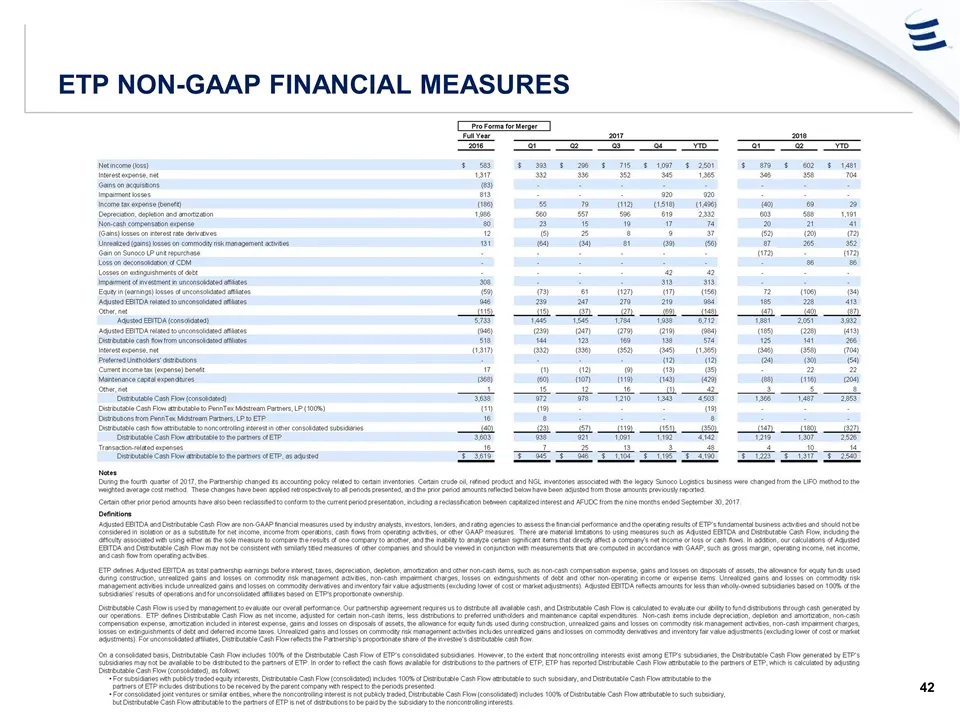
ETP Non-gaAp financial measures
Slide 43: ETP Non-GAAP financial measures
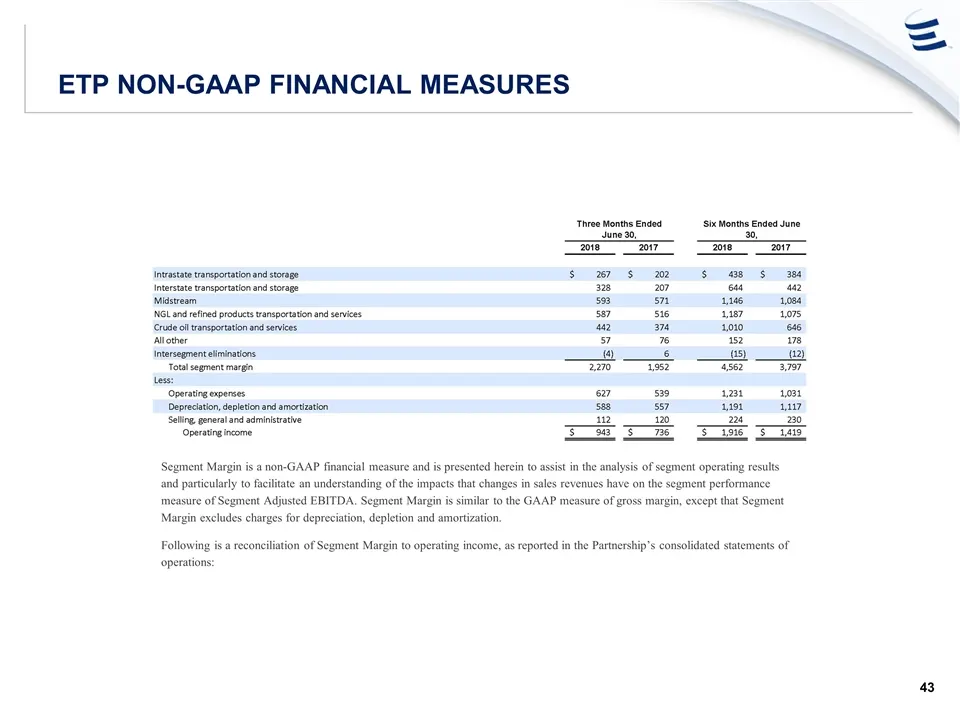
ETP Non-gaAp financial measures Segment Margin is a non-GAAP financial measure and is presented herein to assist in the analysis of segment operating results and particularly to facilitate an understanding of the impacts that changes in sales revenues have on the segment performance measure of Segme
Slide 44: ETE Non-GAAP financial measures
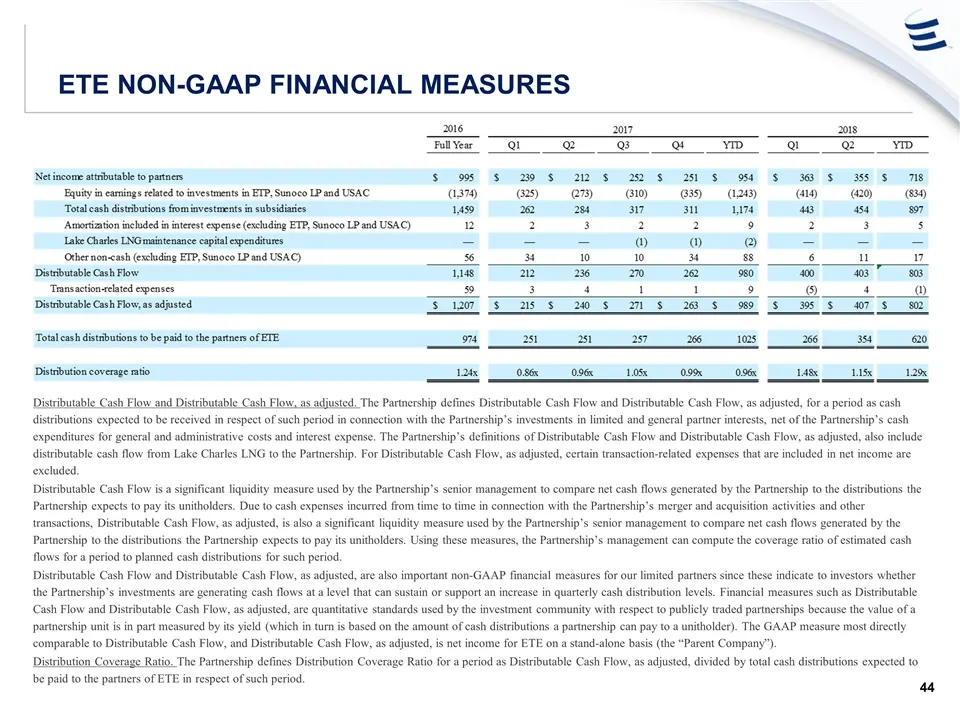
ETE Non-gaAp financial measures Distributable Cash Flow and Distributable Cash Flow, as adjusted. The Partnership defines Distributable Cash Flow and Distributable Cash Flow, as adjusted, for a period as cash distributions expected to be received in respect of such period in connection with the Part
Source: SEC EDGAR · 425 filed Sep 6, 2018
More decks from Energy Transfer Partners L.P
 2018 Citi One-on-One MLP / Midstream Infrastructure Conference43 slides · Aug 15, 2018
 Merger or Acquisition (August 2018)7 slides · Aug 2, 2018
 Sunoco Logistics Partners — Merger or Acquisition (November 2016)22 slides · Nov 21, 2016
 Sunoco Logistics Partners — IPO Roadshow (September 2016)8 slides · Sep 26, 2016
 Sunoco Logistics Partners — Q4 2011 Earnings Presentation16 slides · Jan 27, 2012
 Sunoco Logistics Partners — Q3 2011 Earnings Presentation18 slides · Oct 25, 2011