Vantagesouth Bancshares — Crescent Financial Bancshares — Merger or Acquisition (February 2013)
23 slides from Vantagesouth Bancshares's merger presentation, Feb 28, 2013
Slide 1: Crescent Financial Bancshares, Inc. Investor Presentation February 2013
Crescent Financial Bancshares, Inc. Holding Company for VantageSouth Bank Investor Presentation February 2013 Filed by Crescent Financial Bancshares, Inc. Pursuant to Rule 425 under the Securities Act of 1933, as amended Subject Company: ECB Bancorp, Inc. Crescent Financial’s Registration Statement
Slide 2: Forward looking statements
Forward looking statements Statements in this presentation relating to plans, strategies, economic performance and trends, projections of results of specific, acquisitions, activities or investments, expectations or beliefs about future events or results, and other statements that are not descriptio
Slide 3: Creating an enduring community banking franchise
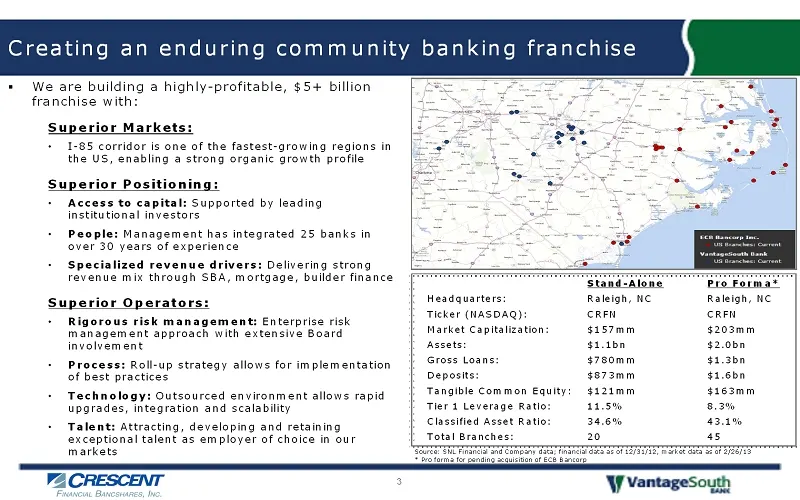
Creating an enduring community banking franchise 3 ▪ We are building a highly-profitable, $5+ billion franchise with: Superior Markets: • I-85 corridor is one of the fastest-growing regions in the US, enabling a strong organic growth profile Superior Positioning: • Access to capital:Supported by lea
Slide 4: Investment highlights
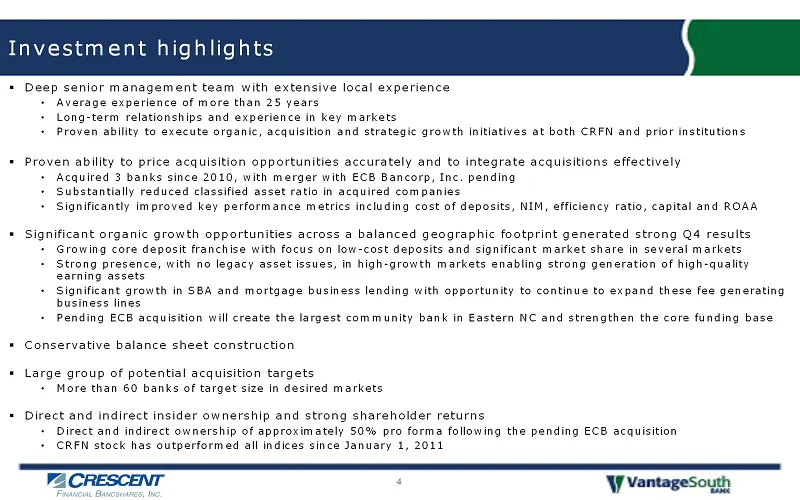
Investment highlights 4 ▪ Deep senior management team with extensive local experience • Average experience of more than 25 years • Long-term relationships and experience in key markets • Proven ability to execute organic, acquisition and strategic growth initiatives at both CRFN and prior institutio
Slide 5: Deep management team with extensive local experience
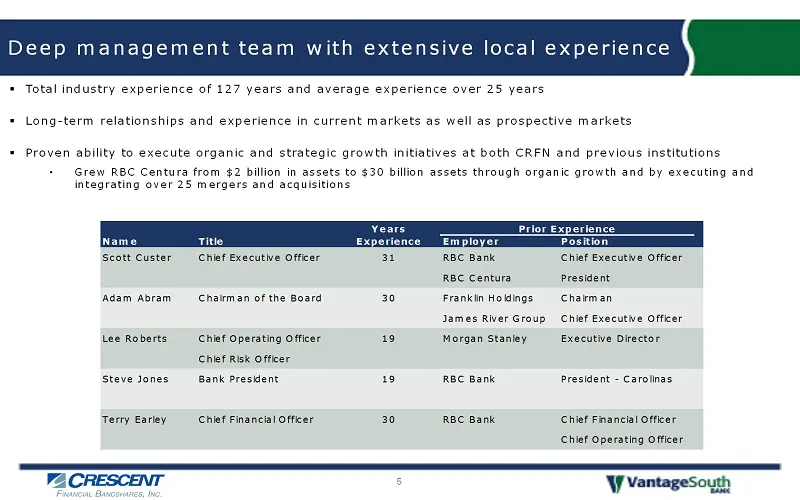
Deep management team with extensive local experience 5 ▪ Total industry experience of 127 years and average experience over 25 years ▪ Long-term relationships and experience in current markets as well as prospective markets ▪ Proven ability to execute organic and strategic growth initiatives at both
Slide 6: Experienced, diligent and effective acquiror
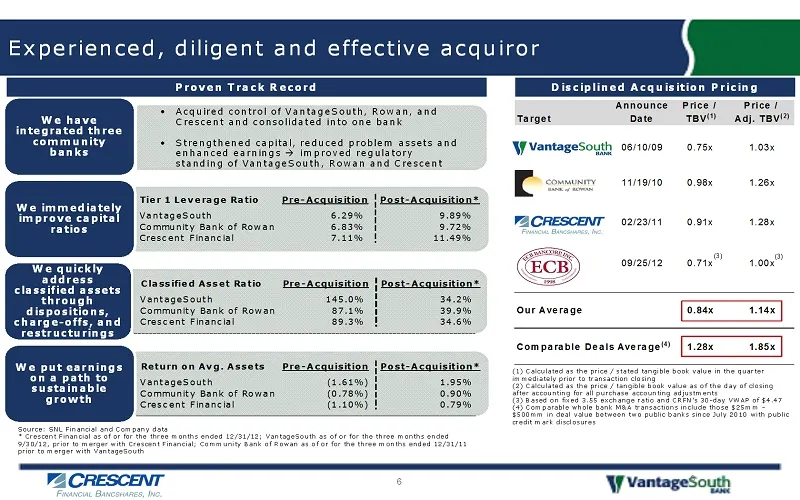
Announce Price / Price / Target Date TBV (1) Adj. TBV (2) 06/10/09 0.75x 1.03x 11/19/10 0.98x 1.26x 02/23/11 0.91x 1.28x 09/25/12 0.71x 1.00x Our Average 0.84x 1.14x Comparable Deals Average (4) 1.28x 1.85x Experienced, diligent and effective acquiror 6 Source: SNL Financial and Company data * Cresc
Slide 7: Organic growth has multiple drivers
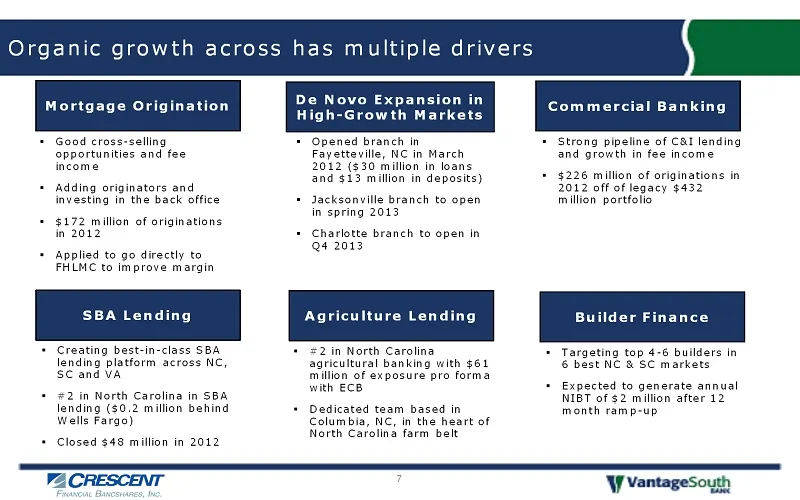
Organic growth across has multiple drivers 7 Mortgage Origination De Novo Expansion in High-Growth Markets Commercial Banking SBA Lending ▪ Creating best-in-class SBA lending platform across NC, SC and VA ▪ #2 in North Carolina in SBA lending ($0.2 million behind Wells Fargo) ▪ Closed $48 million in
Slide 8: Organic growth supported by superior markets
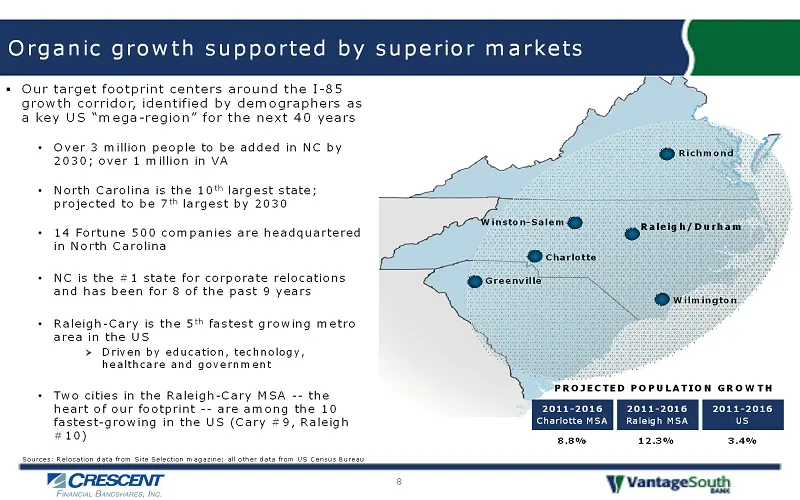
Organic growth supported by superior markets 8 Charlotte Raleigh/Durham Winston-Salem Greenville Richmond PROJECTED POPULATION GROWTH 3.4%12.3%8.8% 2011-2016 US 2011-2016 Raleigh MSA 2011-2016 Charlotte MSA Sources: Relocation data from Site Selection magazine; all other data from US Census Bureau W
Slide 9: Quarterly 2012 results
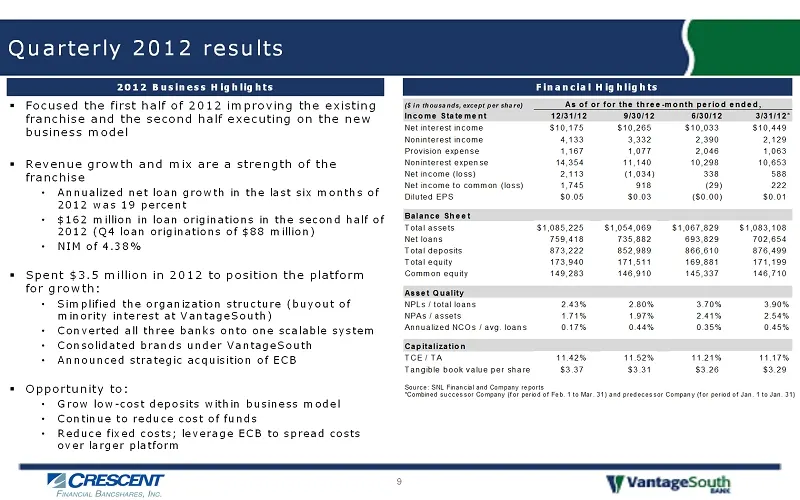
Quarterly 2012 results 9 ▪ Focused the first half of 2012 improving the existing franchise and the second half executing on the new business model ▪ Revenue growth and mix are a strength of the franchise • Annualized net loan growth in the last six months of 2012 was 19 percent • $162 million in loa
Slide 10: Net interest margin strength
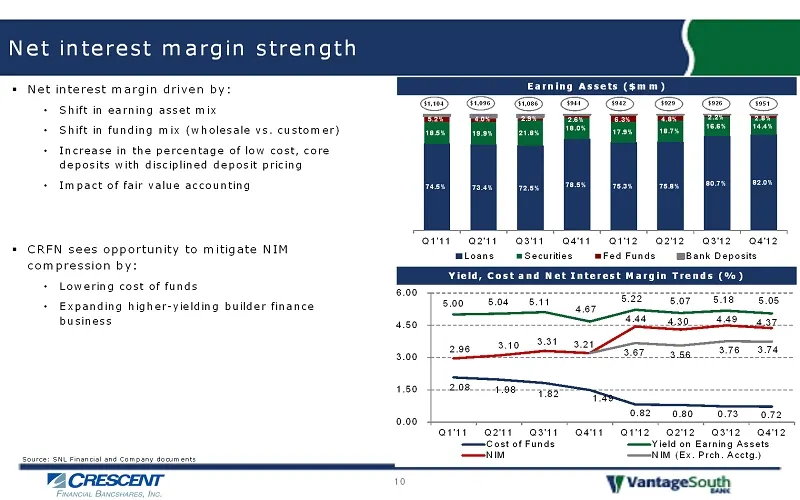
2.08 1.98 1.82 1.49 0.82 0.80 0.73 0.72 5.00 5.04 5.11 4.67 5.22 5.07 5.18 5.05 2.96 3.10 3.31 3.21 4.44 4.30 4.49 4.37 3.67 3.56 3.76 3.74 0.00 1.50 3.00 4.50 6.00 Q1'11 Q2'11 Q3'11 Q4'11 Q1'12 Q2'12 Q3'12 Q4'12 Cost of Funds Yield on Earning Assets NIM NIM (Ex. Prch. Acctg.) 74.5% 73.4% 72.5% 78.5
Slide 11: Noninterest income growth from diverse sources
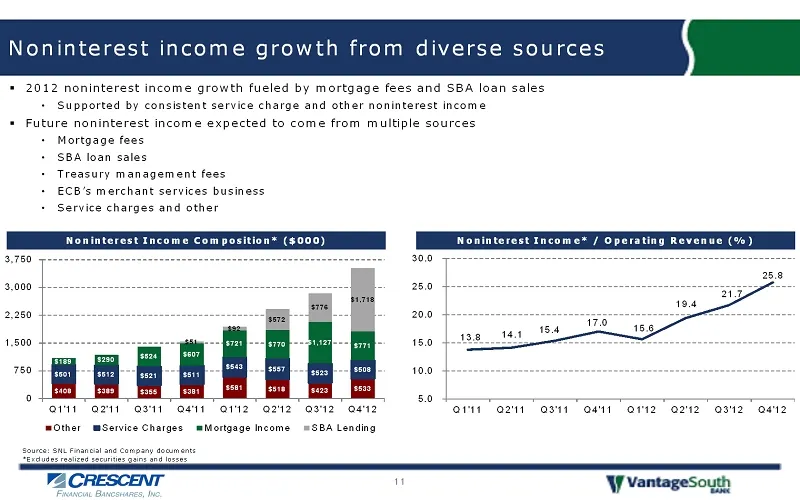
$408 $389 $355 $381 $581 $518 $423 $533 $501 $512 $521 $511 $543 $557 $523 $508 $189 $290 $524 $607 $721 $770 $1,127 $771 $51 $92 $572 $776 $1,718 0 750 1,500 2,250 3,000 3,750 Q1'11 Q2'11 Q3'11 Q4'11 Q1'12 Q2'12 Q3'12 Q4'12 Other Service Charges Mortgage Income SBA Lending Noninterest income growth
Slide 12: Conservative balance sheet construction
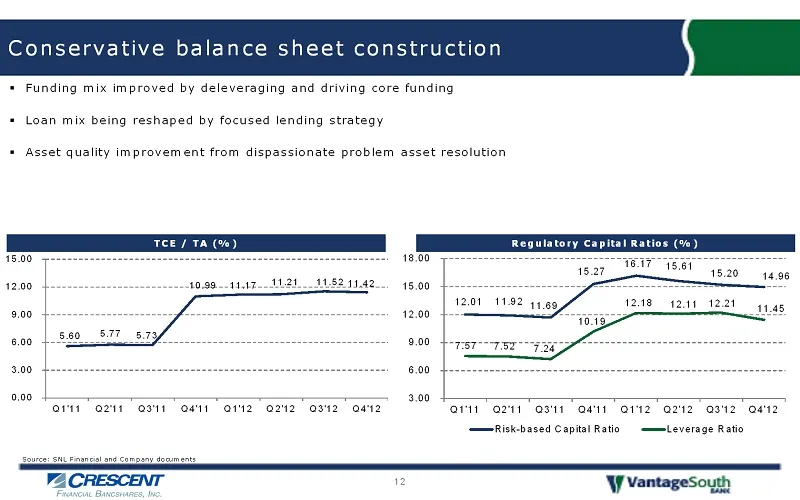
12.01 11.92 11.69 15.27 16.17 15.61 15.20 14.96 7.57 7.52 7.24 10.19 12.18 12.11 12.21 11.45 3.00 6.00 9.00 12.00 15.00 18.00 Q1'11 Q2'11 Q3'11 Q4'11 Q1'12 Q2'12 Q3'12 Q4'12 Risk-based Capital Ratio Leverage Ratio Conservative balance sheet construction 12 ▪ Funding mix improved by deleveraging and
Slide 13: Funding mix improved by rebalancing and driving core funding
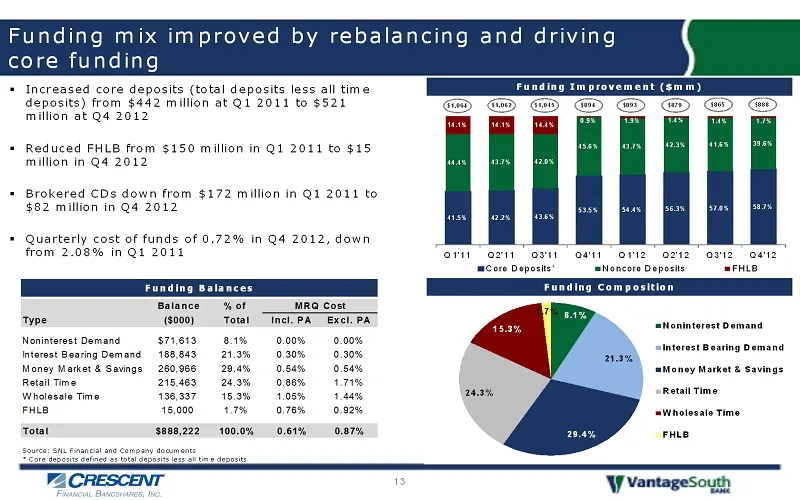
41.5% 42.2% 43.6% 53.5% 54.4% 56.3% 57.0% 58.7% 44.4% 43.7% 42.0% 45.6% 43.7% 42.3% 41.6% 39.6% 14.1% 14.1% 14.4% 0.9% 1.9% 1.4% 1.4% 1.7% Q1'11 Q2'11 Q3'11 Q4'11 Q1'12 Q2'12 Q3'12 Q4'12 Core Deposits* Noncore Deposits FHLB $1,064 Funding mix improved by rebalancing and driving core funding 13 ▪ Inc
Slide 14: Loan portfolio being reshaped by focused lending strategy
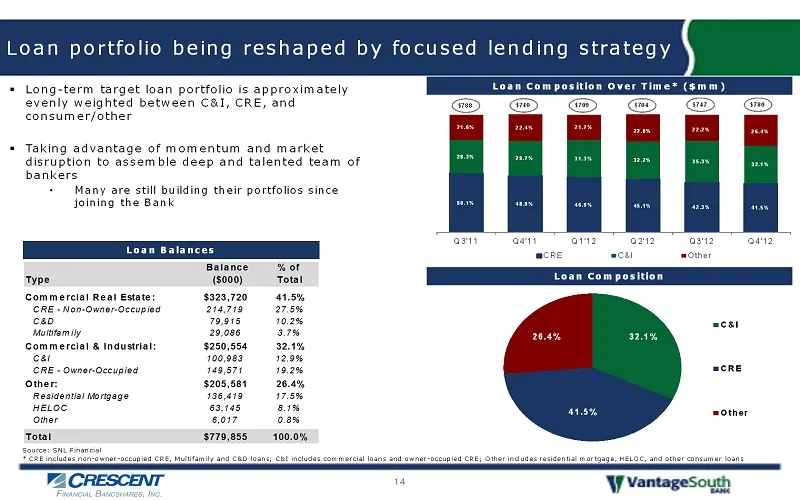
32.1% 41.5% 26.4% C&I CRE Other Loan portfolio being reshaped by focused lending strategy 14 50.1% 48.0% 46.9% 45.1% 42.3% 41.5% 28.3% 29.7% 31.3% 32.2% 35.3% 32.1% 21.6% 22.4% 21.7% 22.8% 22.2% 26.4% Q3'11 Q4'11 Q1'12 Q2'12 Q3'12 Q4'12 CRE C&I Other Loan Balances Loan Composition Loan Composition O
Slide 15: Strong coverage ratios driven by low NPAs
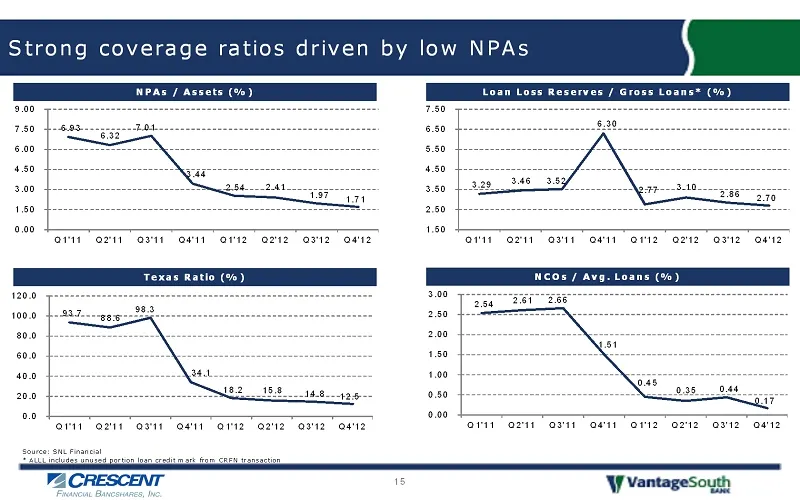
Strong coverage ratios driven by low NPAs 15 NPAs / Assets (%) Loan Loss Reserves / Gross Loans* (%) Texas Ratio (%) NCOs / Avg. Loans (%) 93.7 88.6 98.3 34.1 18.2 15.8 14.8 12.5 0.0 20.0 40.0 60.0 80.0 100.0 120.0 Q1'11 Q2'11 Q3'11 Q4'11 Q1'12 Q2'12 Q3'12 Q4'12 Source: SNL Financial * ALLL includes
Slide 16: Franchise growth opportunity
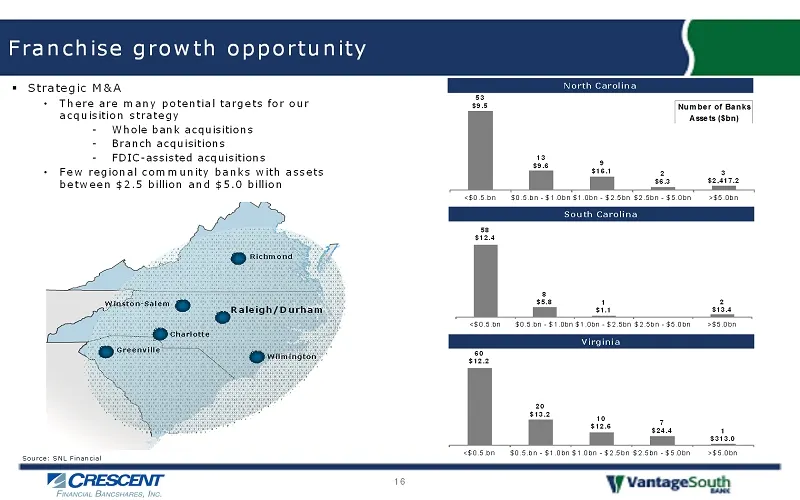
58 $12.4 8 $5.8 1 $1.1 2 $13.4 <$0.5.bn $0.5.bn - $1.0bn$1.0bn - $2.5bn$2.5bn - $5.0bn >$5.0bn 60 $12.2 20 $13.2 10 $12.6 7 $24.4 1 $313.0 <$0.5.bn $0.5.bn - $1.0bn$1.0bn - $2.5bn $2.5bn - $5.0bn >$5.0bn 53 $9.5 13 $9.6 9 $16.1 2 $6.3 3 $2,417.2 <$0.5.bn $0.5.bn - $1.0bn$1.0bn - $2.5bn $2.5bn - $5.0
Slide 17: Pending ECB acquisition is compelling
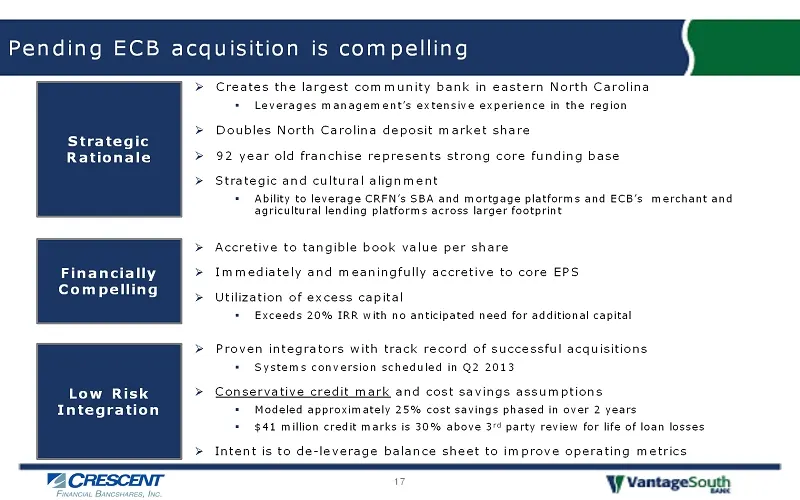
Pending ECB acquisition is compelling 17 Strategic Rationale Financially Compelling Low Risk Integration » Creates the largest community bank in eastern North Carolina ▪ Leverages management’s extensive experience in the region » Doubles North Carolina deposit market share » 92 year old franchise re
Slide 18: Overview of ECB transaction terms
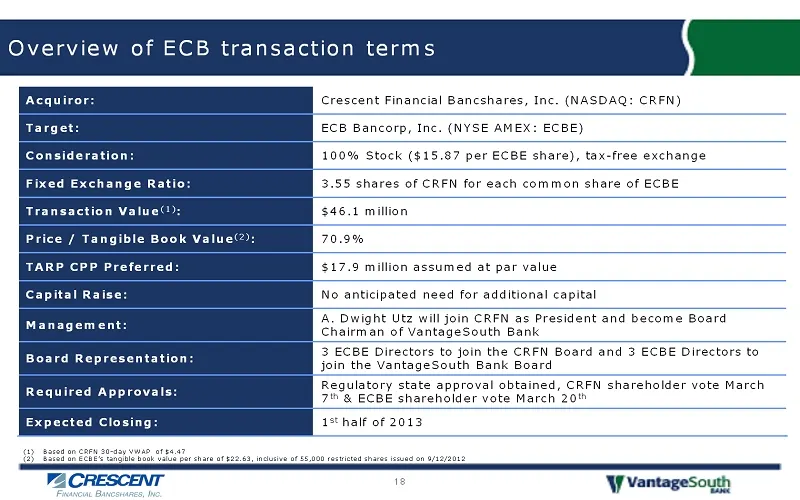
Overview of ECB transaction terms 18 (1) Based on CRFN 30-day VWAP of $4.47 (2) Based on ECBE’s tangible book value per share of $22.63, inclusive of 55,000 restricted shares issued on 9/12/2012 Acquiror: Crescent Financial Bancshares, Inc. (NASDAQ: CRFN) Target: ECB Bancorp, Inc. (NYSE AMEX: ECBE)
Slide 19: CRFN remains attractively priced compared to peers
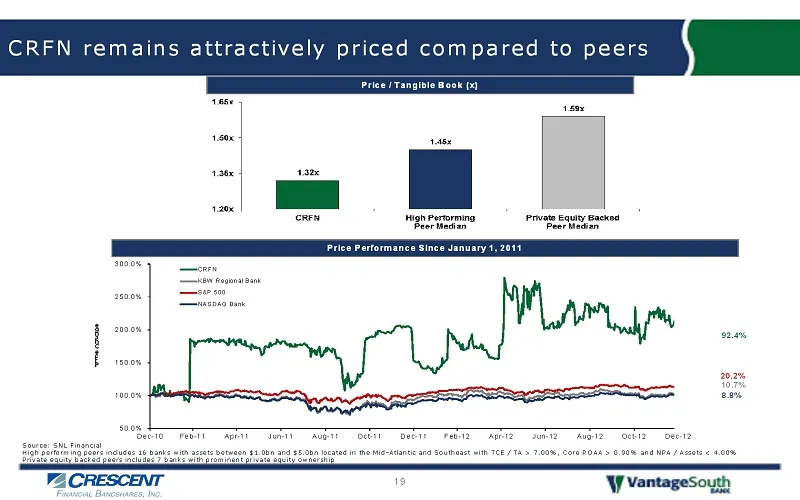
50.0% 100.0% 150.0% 200.0% 250.0% 300.0% Dec-10 Feb-11 Apr-11 Jun-11 Aug-11 Oct-11 Dec-11 Feb-12 Apr-12 Jun-12 Aug-12 Oct-12 Dec-12 P r i c e C h a n g e CRFN KBW Regional Bank S&P 500 NASDAQ Bank CRFN remains attractively priced compared to peers 19 Price / Tangible Book (x) Source: SNL Financial H
Slide 20: Peer benchmarking
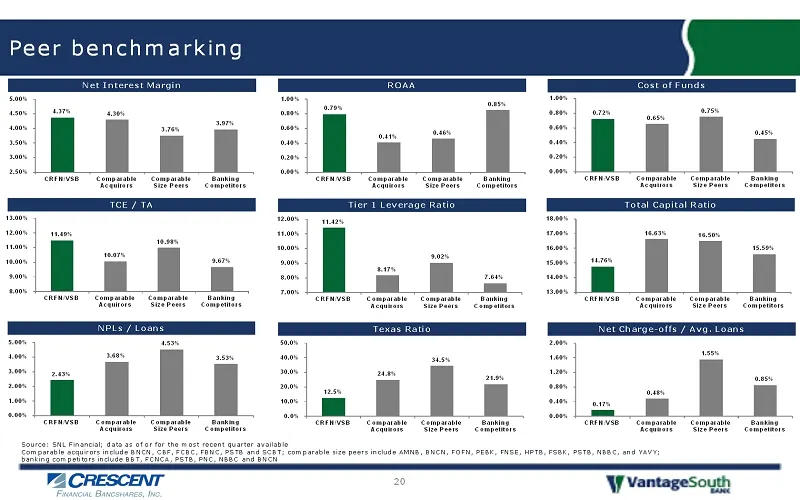
Peer benchmarking 20 Net Interest Margin TCE / TA NPLs / Loans Cost of Funds Total Capital Ratio ROAA Tier 1 Leverage Ratio TexasRatio Source: SNL Financial; data as of or for the most recent quarter available Comparable acquirorsinclude BNCN, CBF, FCBC, FBNC, PSTB and SCBT; comparable size peers in
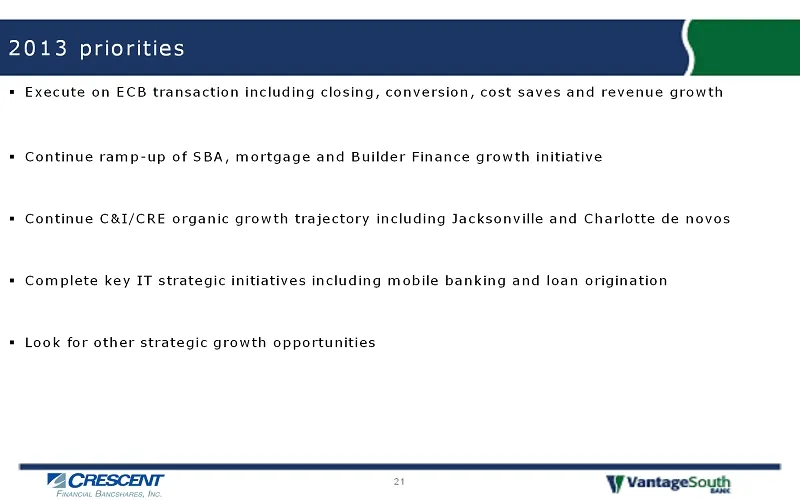
Slide 21: 2013 priorities
2013 priorities 21 ▪ Execute on ECB transaction including closing, conversion, cost saves and revenue growth ▪ Continue ramp-up of SBA, mortgage and Builder Finance growth initiative ▪ Continue C&I/CRE organic growth trajectory including Jacksonville and Charlotte de novos ▪ Complete key IT strategi
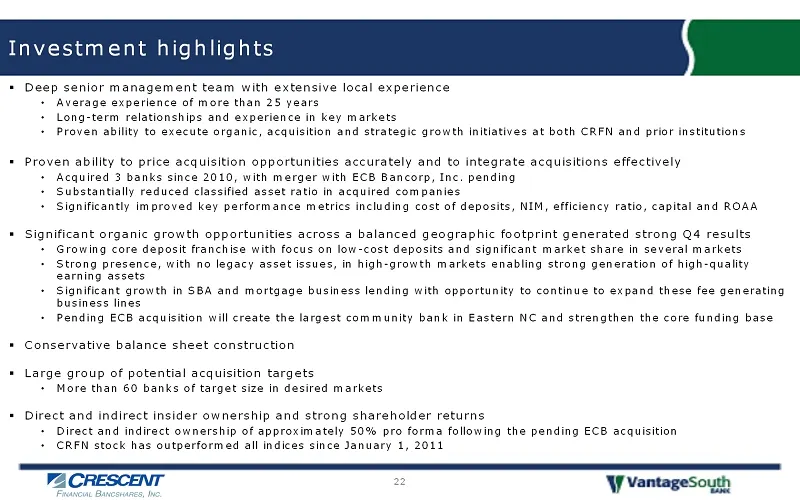
Slide 22: Investment highlights
Investment highlights 22 ▪ Deep senior management team with extensive local experience • Average experience of more than 25 years • Long-term relationships and experience in key markets • Proven ability to execute organic, acquisition and strategic growth initiatives at both CRFN and prior instituti
Slide 23: Additional information about the merger and where to find it
Additional information about the merger and where to find it In connection with the proposed merger of ECB Bancorp, Inc. and Crescent Financial Bancshares, Inc., CRFN has filed on January 31, 2013 with the Securities and Exchange Commission (“SEC”) a Registration Statement on Form S-4 that contains
Source: SEC EDGAR · 425 filed Feb 28, 2013
More decks from Vantagesouth Bancshares Inc.
 Gulf South Conference (May 2014)25 slides · May 12, 2014
 Q1 2014 Earnings Presentation15 slides · Apr 23, 2014
 Merger or Acquisition (March 2014)23 slides · Mar 4, 2014
 Merger or Acquisition (January 2014)15 slides · Jan 27, 2014
 Investor Presentation (December 2013)17 slides · Dec 18, 2013
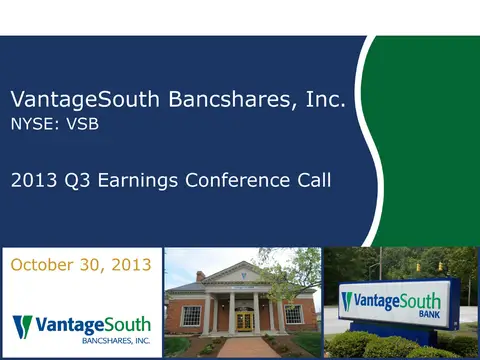 Q3 2013 Earnings Presentation14 slides · Oct 30, 2013