Vantagesouth Bancshares — Q3 2013 Earnings Presentation
14 slides from Vantagesouth Bancshares's earnings presentation, Oct 30, 2013
Slide 1: VantageSouth Bancshares 2013 Q3 Earnings Conference Call
VantageSouth Bancshares, Inc. NYSE: VSB 2013 Q3 Earnings Conference Call October 30, 2013
Slide 2: Forward-looking statements
Forward-looking statements 2 Statements in this presentation relating to plans, strategies, economic performance and trends, projections of results of specific, acquisitions, activities or investments, expectations or beliefs about future events or results, and other statements that are not descript
Slide 3: Creating an enduring community banking franchise
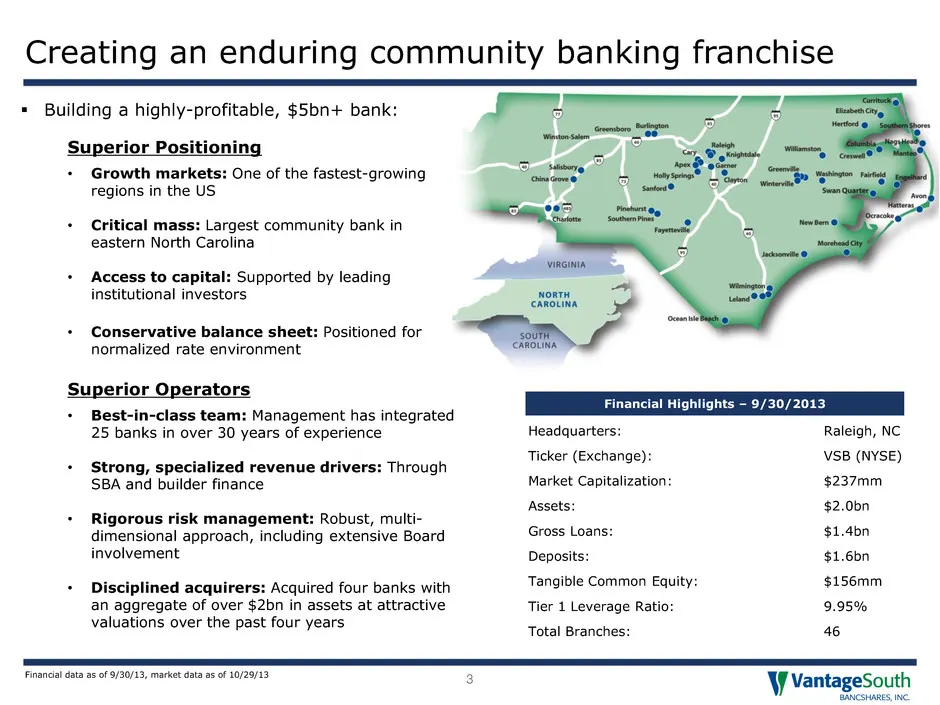
Building a highly-profitable, $5bn+ bank: Superior Positioning • Growth markets: One of the fastest-growing regions in the US • Critical mass: Largest community bank in eastern North Carolina • Access to capital: Supported by leading institutional investors • Conservative balance sheet: Positioned
Slide 4: Q3 2013 – Overview
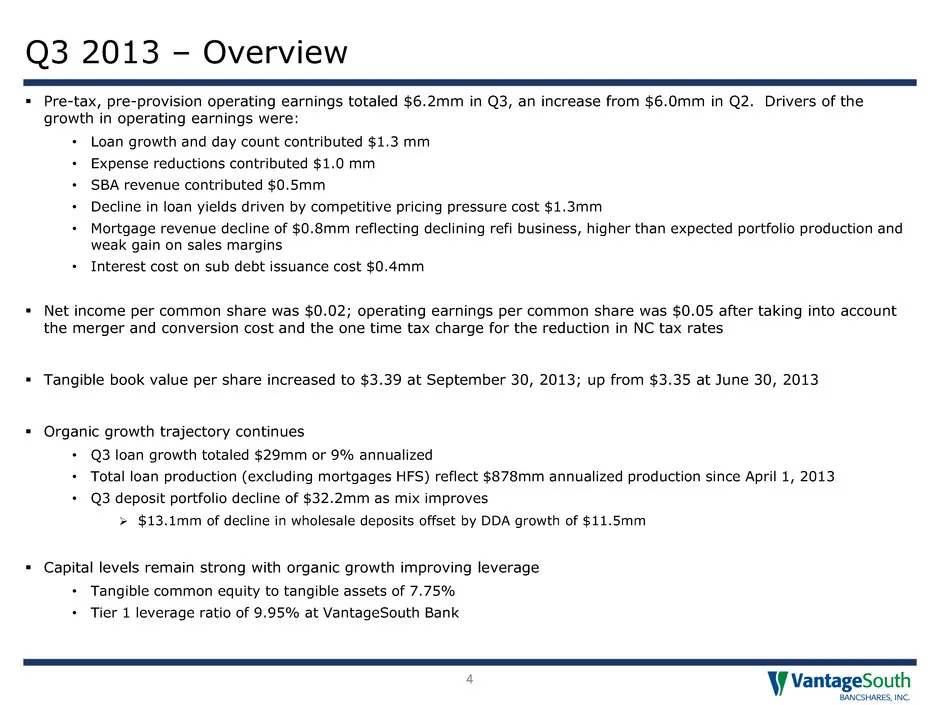
Q3 2013 – Overview 4 Pre-tax, pre-provision operating earnings totaled $6.2mm in Q3, an increase from $6.0mm in Q2. Drivers of the growth in operating earnings were: • Loan growth and day count contributed $1.3 mm • Expense reductions contributed $1.0 mm • SBA revenue contributed $0.5mm • Decline
Slide 5: Earnings profile
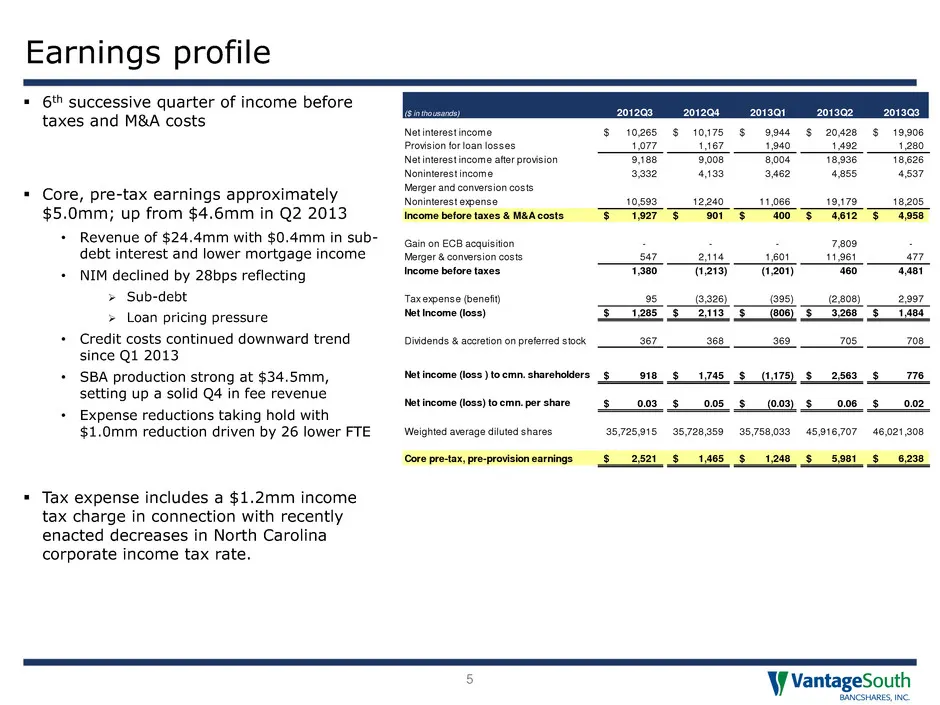
Earnings profile 5 6th successive quarter of income before taxes and M&A costs Core, pre-tax earnings approximately $5.0mm; up from $4.6mm in Q2 2013 • Revenue of $24.4mm with $0.4mm in sub- debt interest and lower mortgage income • NIM declined by 28bps reflecting Sub-debt Loan pricing pres
Slide 6: Net interest income
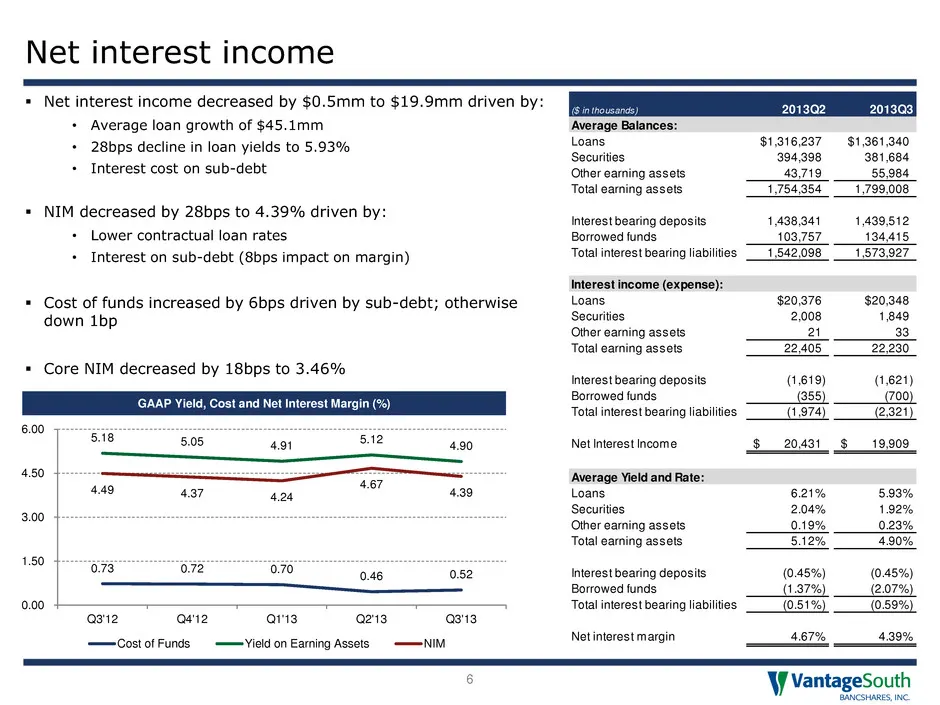
Net interest income 6 GAAP Yield, Cost and Net Interest Margin (%) 0.73 0.72 0.70 0.46 0.52 5.18 5.05 4.91 5.12 4.90 4.49 4.37 4.24 4.67 4.39 0.00 1.50 3.00 4.50 6.00 Q3'12 Q4'12 Q1'13 Q2'13 Q3'13 Cost of Funds Yield on Earning Assets NIM Net interest income decreased by $0.5mm to $19.9mm driven b
Slide 7: Noninterest income
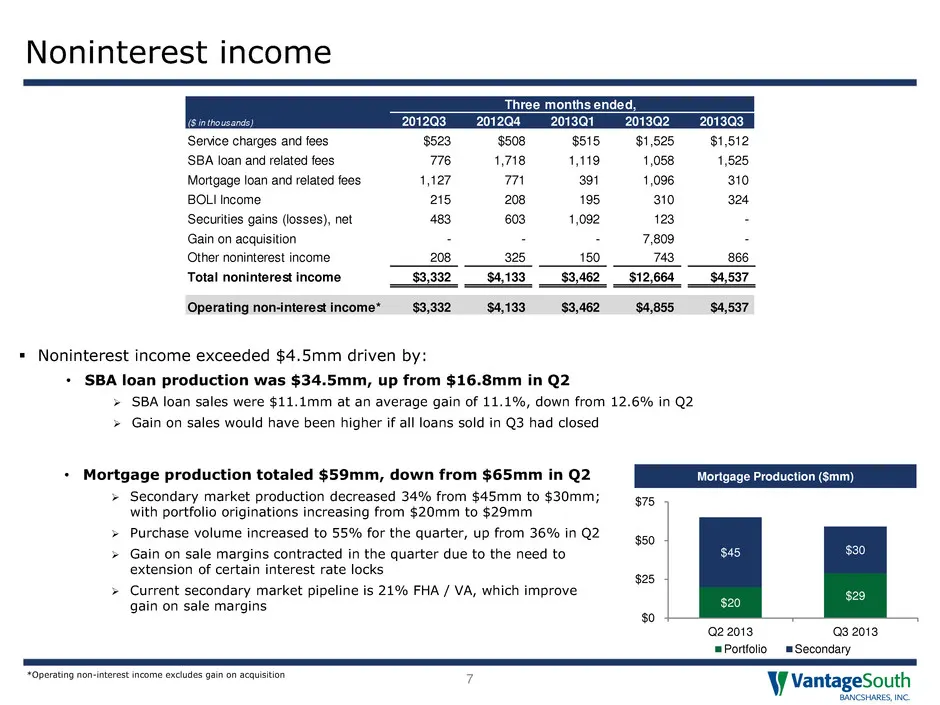
Noninterest income 7 Noninterest income exceeded $4.5mm driven by: • SBA loan production was $34.5mm, up from $16.8mm in Q2 SBA loan sales were $11.1mm at an average gain of 11.1%, down from 12.6% in Q2 Gain on sales would have been higher if all loans sold in Q3 had closed $20 $29 $45 $30 $0
Slide 8: Noninterest expense
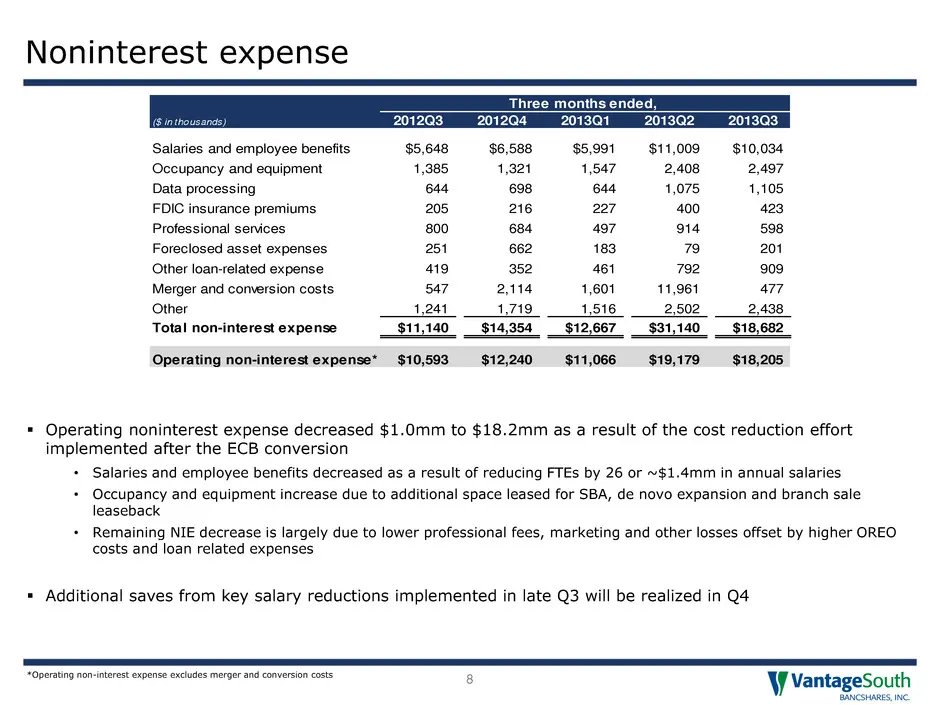
Noninterest expense 8 Operating noninterest expense decreased $1.0mm to $18.2mm as a result of the cost reduction effort implemented after the ECB conversion • Salaries and employee benefits decreased as a result of reducing FTEs by 26 or ~$1.4mm in annual salaries • Occupancy and equipment increa
Slide 9: Balance Sheet
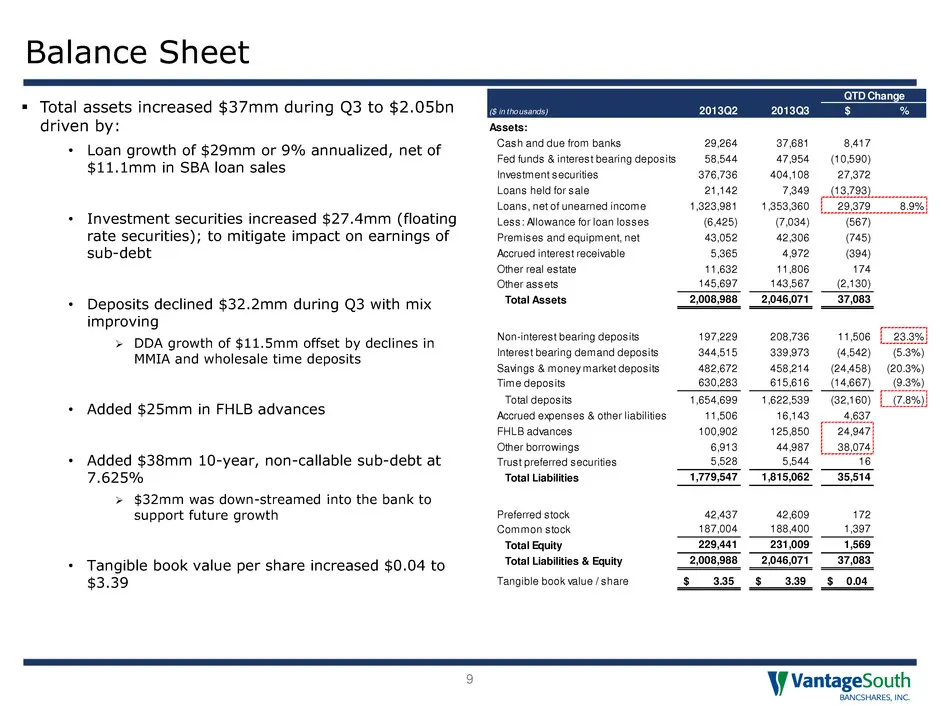
Balance Sheet 9 Total assets increased $37mm during Q3 to $2.05bn driven by: • Loan growth of $29mm or 9% annualized, net of $11.1mm in SBA loan sales • Investment securities increased $27.4mm (floating rate securities); to mitigate impact on earnings of sub-debt • Deposits declined $32.2mm during
Slide 10: Loan portfolio transformation
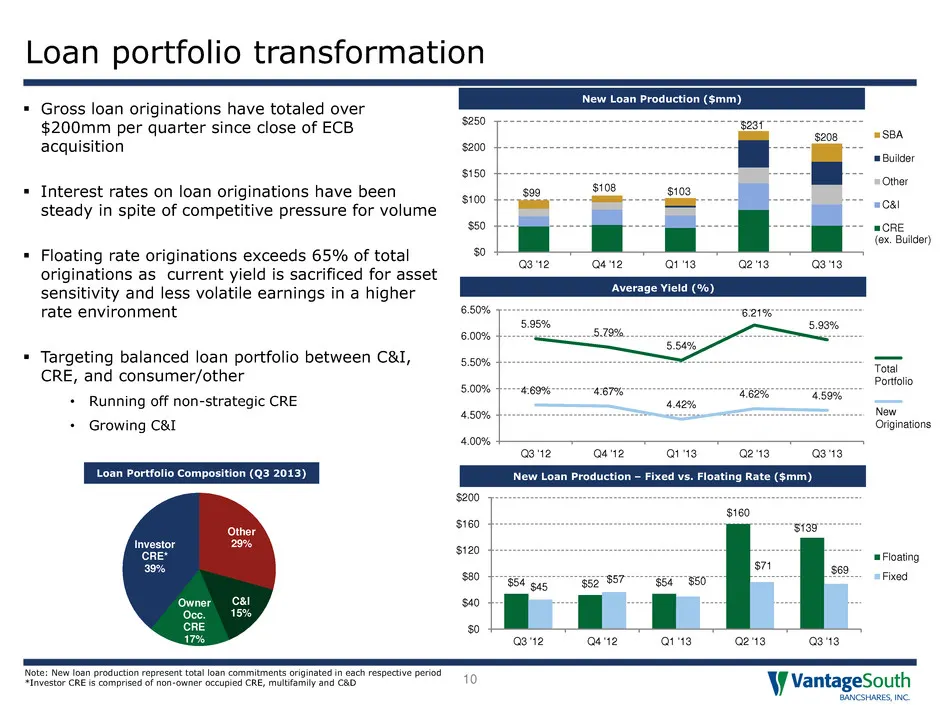
$0 $50 $100 $150 $200 $250 Q3 '12 Q4 '12 Q1 '13 Q2 '13 Q3 '13 SBA Builder Other C&I CRE Loan portfolio transformation 10 New Loan Production ($mm) Average Yield (%) New Loan Production – Fixed vs. Floating Rate ($mm) Gross loan originations have totaled over $200mm per quarter since close of ECB a
Slide 11: Allowance for loan losses
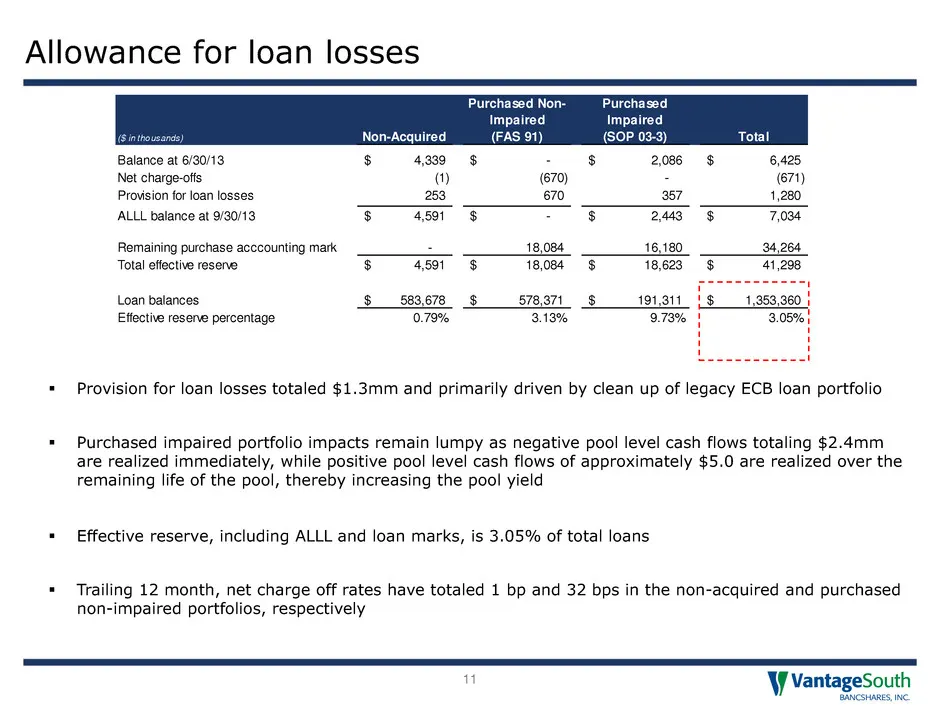
Allowance for loan losses 11 Provision for loan losses totaled $1.3mm and primarily driven by clean up of legacy ECB loan portfolio Purchased impaired portfolio impacts remain lumpy as negative pool level cash flows totaling $2.4mm are realized immediately, while positive pool level cash flows o
Slide 12: Key financial targets
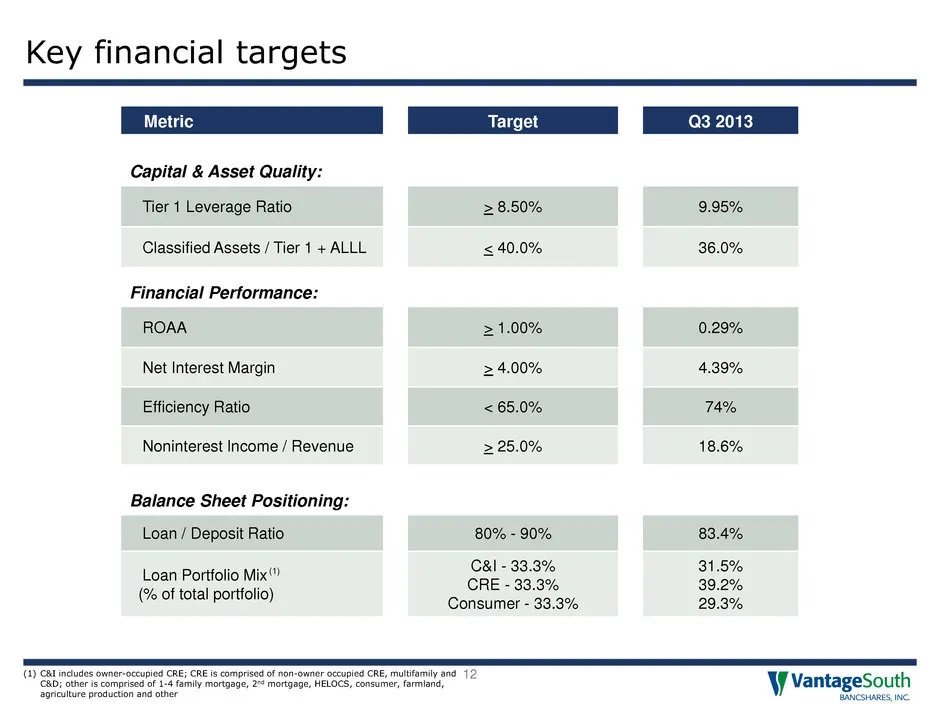
Key financial targets 12 Metric Target Q3 2013 Capital & Asset Quality: Tier 1 Leverage Ratio > 8.50% 9.95% Classified Assets / Tier 1 + ALLL < 40.0% 36.0% Financial Performance: ROAA > 1.00% 0.29% Net Interest Margin > 4.00% 4.39% Efficiency Ratio < 65.0% 74% Noninterest Income / Revenue > 25.0% 18
Slide 13: Remain attractively priced compared to peers
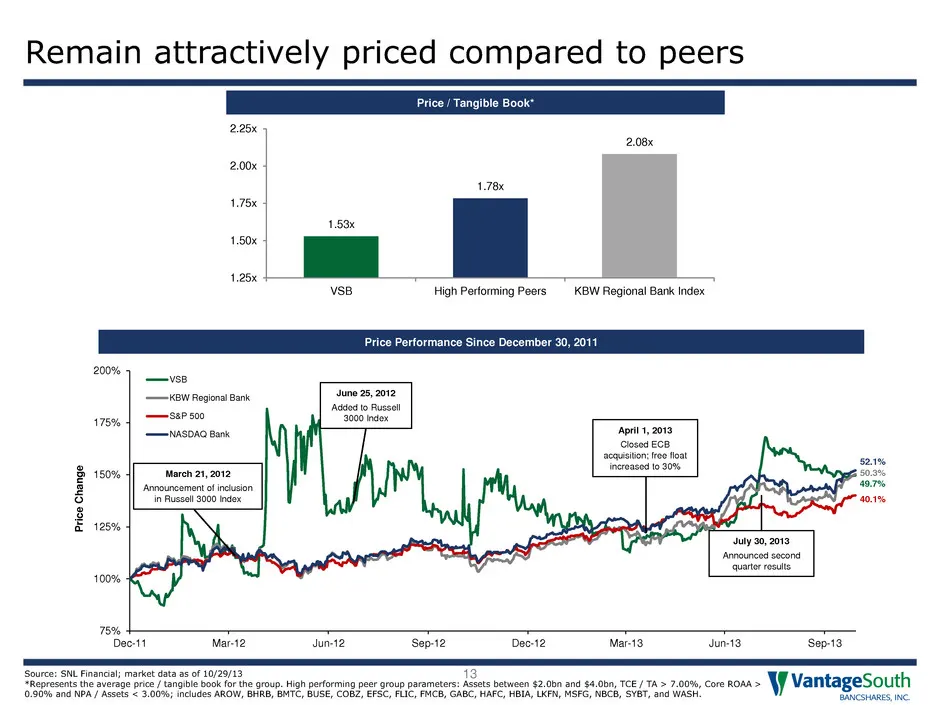
75% 100% 125% 150% 175% 200% Dec-11 Mar-12 Jun-12 Sep-12 Dec-12 Mar-13 Jun-13 Sep-13 Pric e C han ge VSB KBW Regional Bank S&P 500 NASDAQ Bank Remain attractively priced compared to peers 13 Price / Tangible Book* Source: SNL Financial; market data as of 10/29/13 *Represents the average price / tang
Slide 14: VantageSouth Bancshares 2013 Q3 Earnings Conference Call
VantageSouth Bancshares, Inc. NYSE: VSB 2013 Q3 Earnings Conference Call October 30, 2013
Source: SEC EDGAR · 8-K filed Oct 30, 2013
More decks from Vantagesouth Bancshares Inc.
 Gulf South Conference (May 2014)25 slides · May 12, 2014
 Q1 2014 Earnings Presentation15 slides · Apr 23, 2014
 Merger or Acquisition (March 2014)23 slides · Mar 4, 2014
 Merger or Acquisition (January 2014)15 slides · Jan 27, 2014
 Investor Presentation (December 2013)17 slides · Dec 18, 2013
 Keefe, Bruyette & Woods 2013 Community Bank Investor Conference25 slides · Jul 31, 2013