Mony Group PLC · LSE:MONY
Mony — Moneysupermarket Group — H1 2021 Earnings Presentation
37 slides from Mony's earnings presentation, Jul 22, 2021

Slide 1: Interim results
Interim results 22 July 2021

Slide 2: Peter Duffy, Chief Executive Officer
Peter Duffy Chief Executive Officer IMAGE TO FOLLOW
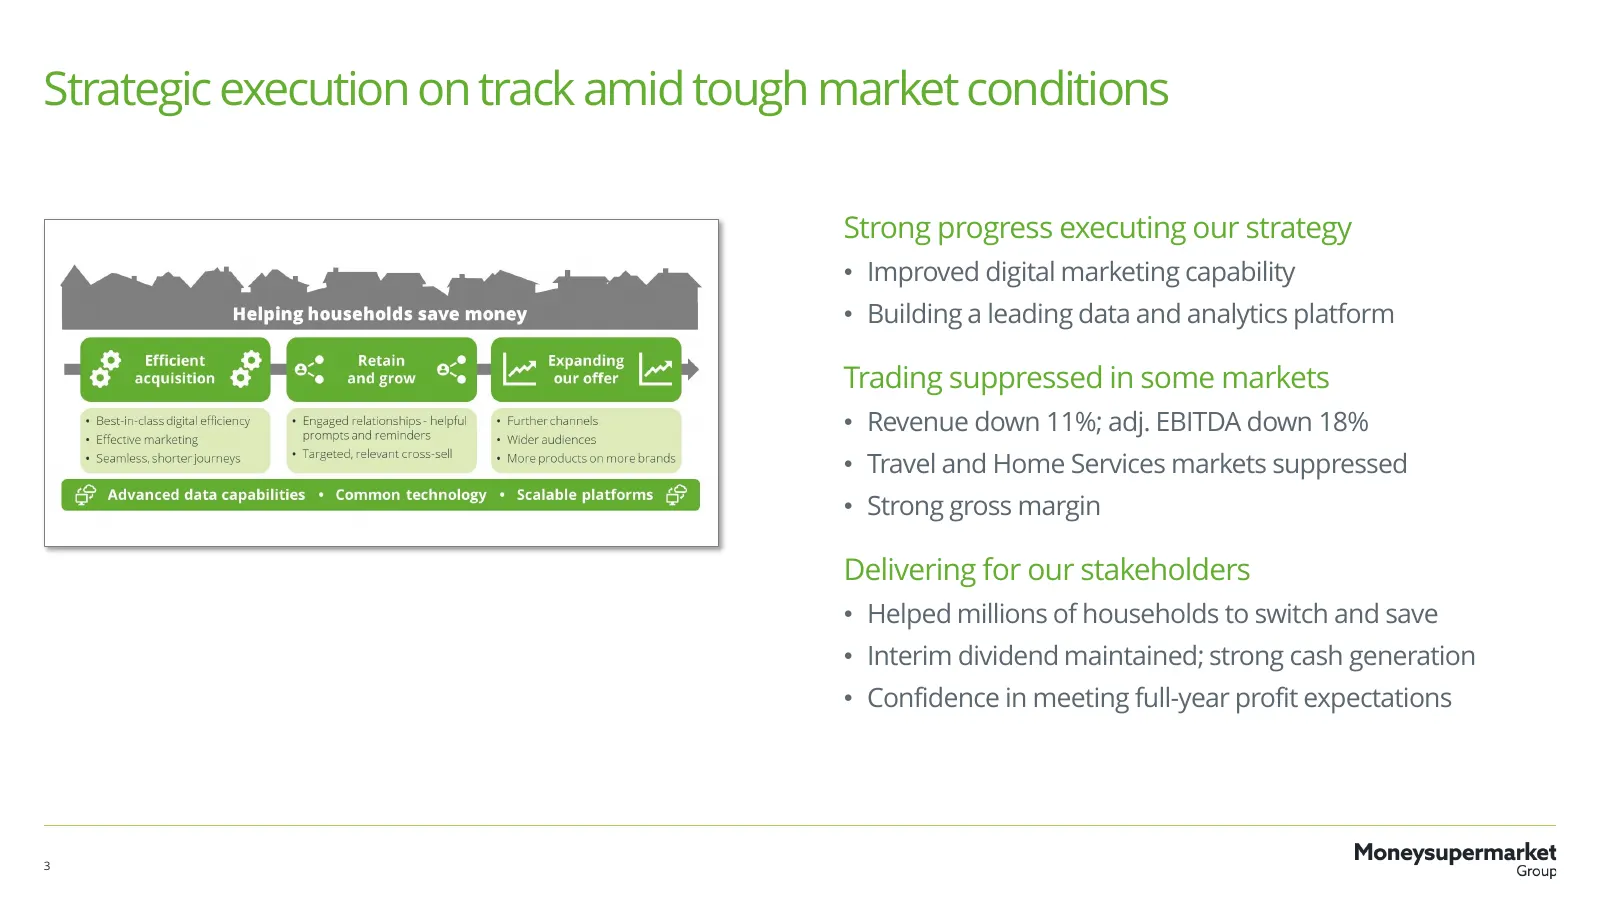
Slide 3: Strategic execution on track amid tough market conditions
Strategic execution on track amid tough market conditions Strong progress executing our strategy • Improved digital marketing capability • Building a leading data and analytics platform Trading suppressed in some markets • Revenue down 11%; adj. EBITDA down 18% • Travel and Home Services markets sup

Slide 4: Scilla Grimble, Chief Financial Officer
Scilla Grimble Chief Financial Officer
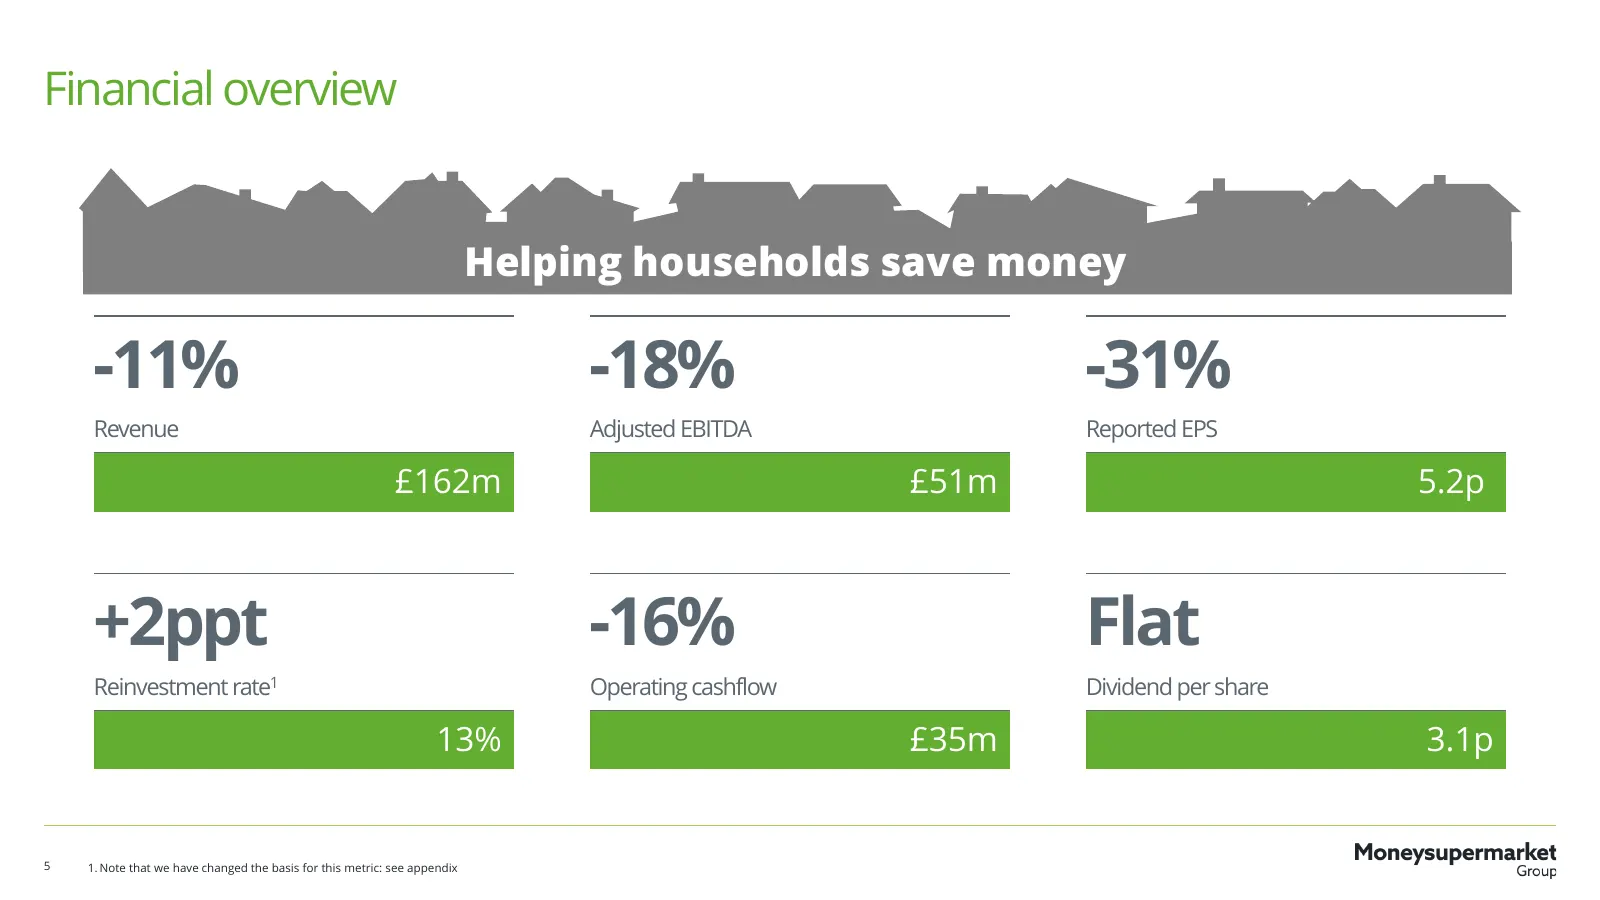
Slide 5: Financial overview
Financial overview Helping households save money -11% -18% -31% Revenue Adjusted EBITDA Reported EPS £162m £51m 5.2p +2ppt -16% Flat Reinvestment rate1 Operating cashflow Dividend per share 13% £35m 3.1p 5 1. Note that we have changed the basis for this metric: see appendix
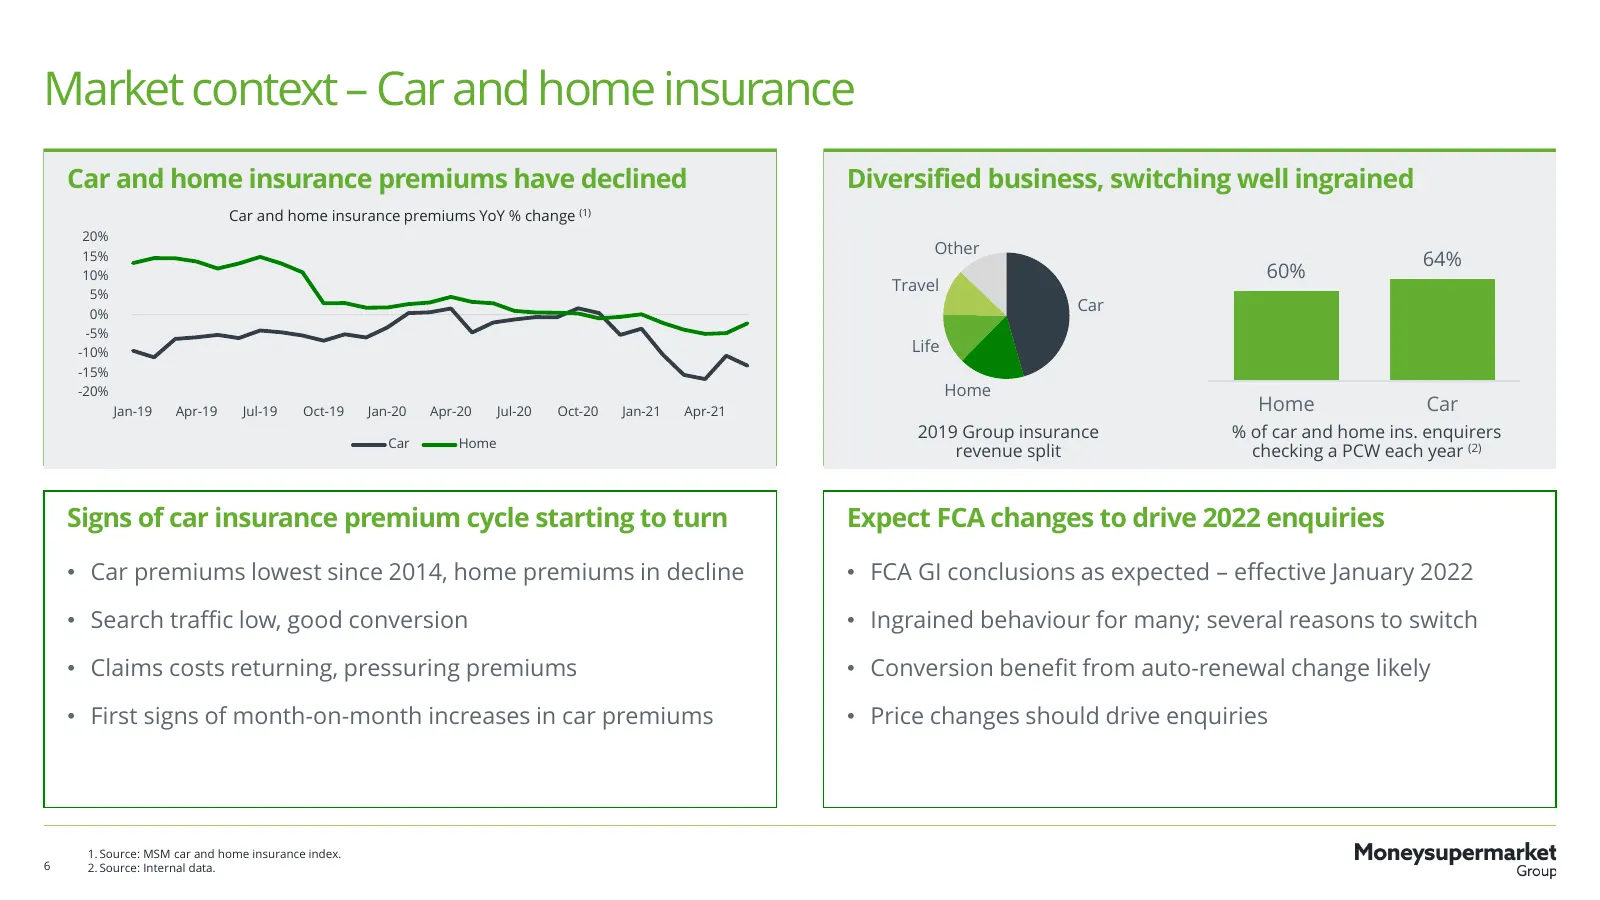
Slide 6: Market context – Car and home insurance
Market context – Car and home insurance Car and home insurance premiums have declined Diversified business, switching well ingrained Car and home insurance premiums YoY % change (1) 20% Other 15% 64% 10% 60% 5% Travel 0% Car -5% -10% Life -15% -20% Home Jan-19 Apr-19 Jul-19 Oct-19 Jan-20 Apr-20 Jul-
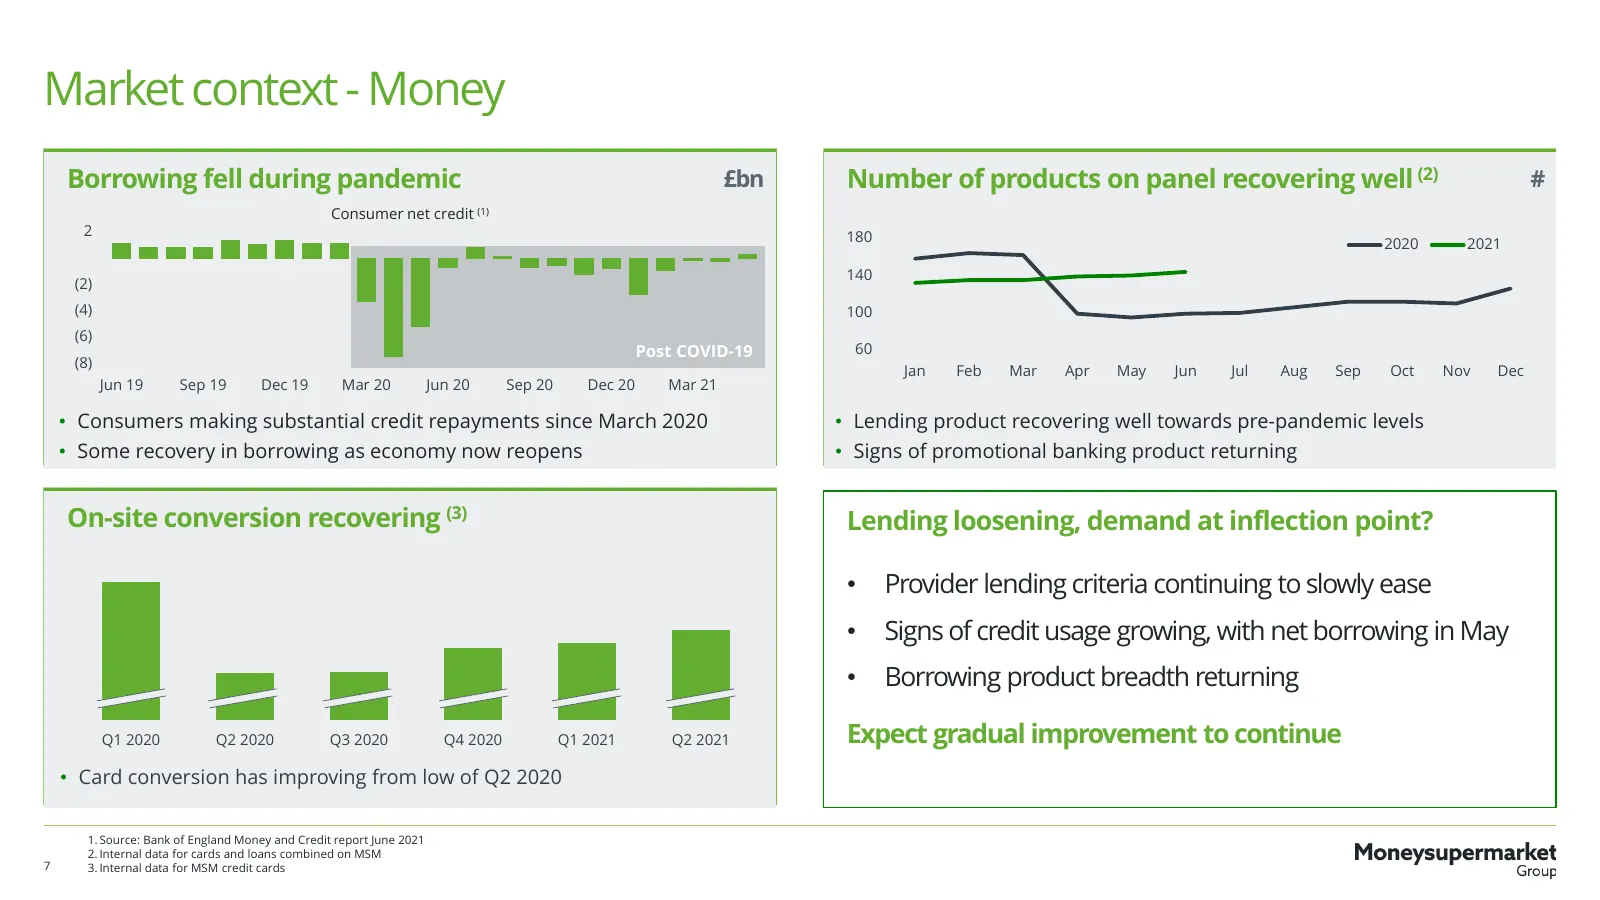
Slide 7: Market context - Money
Market context - Money Borrowing fell during pandemic £bn Number of products on panel recovering well (2) # Consumer net credit (1) 2 180 2020 2021 140 (2) (4) 100 (6) Post COVID-19 60 (8) Jan Feb Mar Apr May Jun Jul Aug Sep Oct Nov Dec Jun 19 Sep 19 Dec 19 Mar 20 Jun 20 Sep 20 Dec 20 Mar 21 • Consu
Slide 8: Market context - Energy
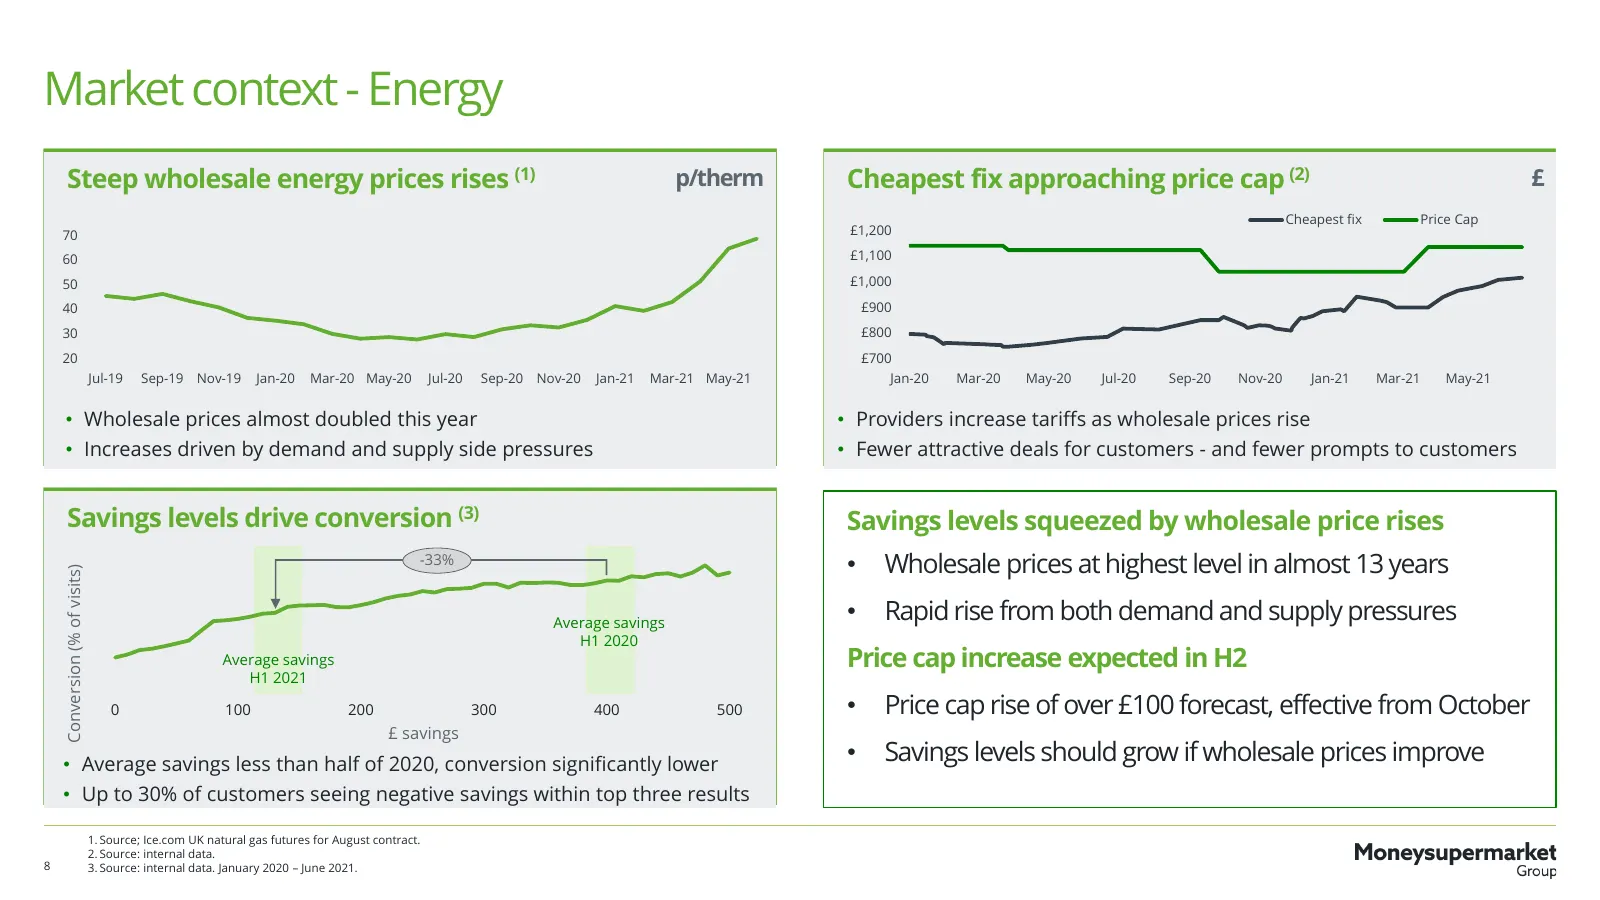
Market context - Energy Steep wholesale energy prices rises (1) p/therm Cheapest fix approaching price cap (2) £ Cheapest fix Price Cap 70 £1,200 60 £1,100 50 £1,000 40 £900 30 £800 20 £700 Jul-19 Sep-19 Nov-19 Jan-20 Mar-20 May-20 Jul-20 Sep-20 Nov-20 Jan-21 Mar-21 May-21 Jan-20 Mar-20 May-20 Jul-2
Slide 9: Revenue down 11% driven by Home Services
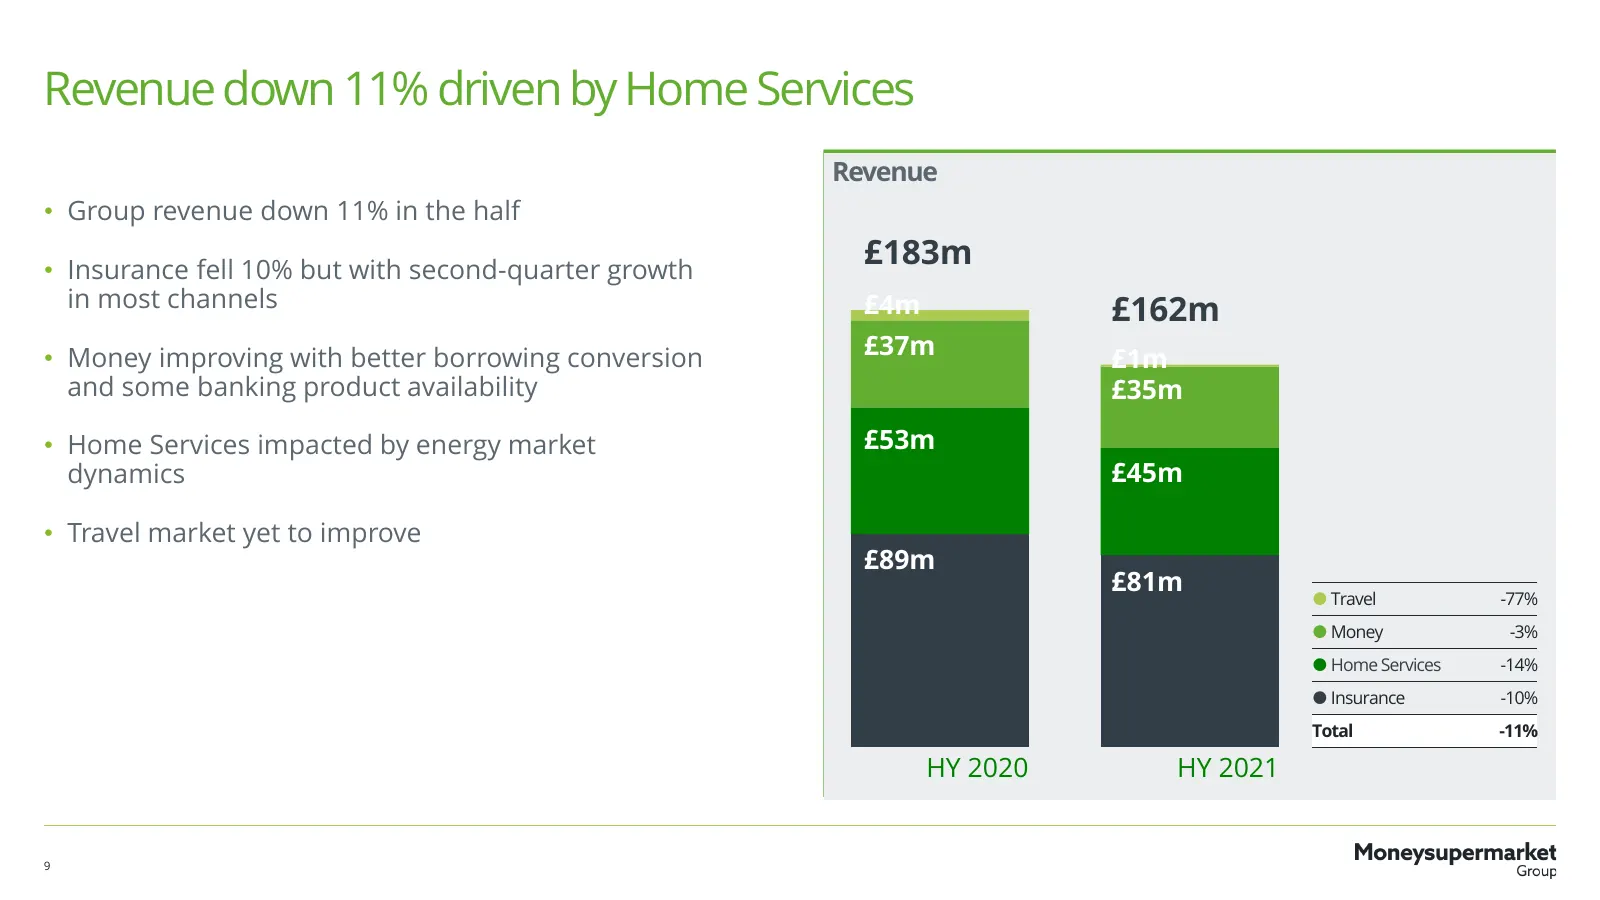
Revenue down 11% driven by Home Services Revenue • Group revenue down 11% in the half • Insurance fell 10% but with second-quarter growth £183m in most channels £4m £162m • Money improving with better borrowing conversion £37m £1m and some banking product availability £35m • Home Services impacted b
Slide 10: Good increase in gross margin
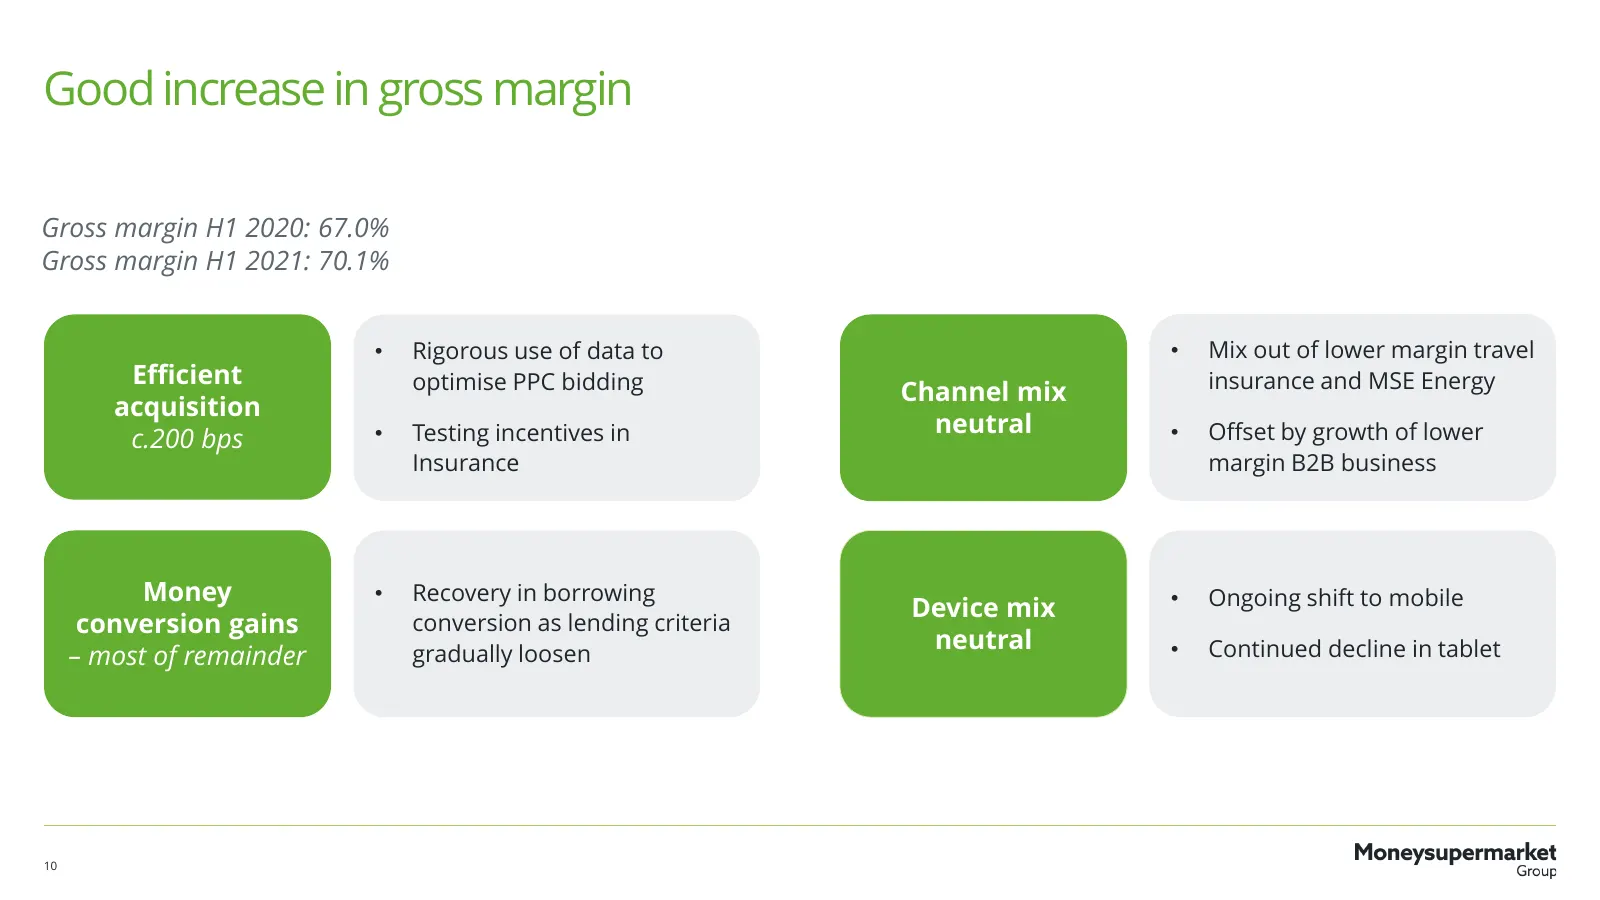
Good increase in gross margin Gross margin H1 2020: 67.0% Gross margin H1 2021: 70.1% • Rigorous use of data to • Mix out of lower margin travel Efficient optimise PPC bidding insurance and MSE Energy Channel mix acquisition • Testing incentives in neutral • Offset by growth of lower c.200 bps Insur
Slide 11: Lower online spend reducing marketing costs
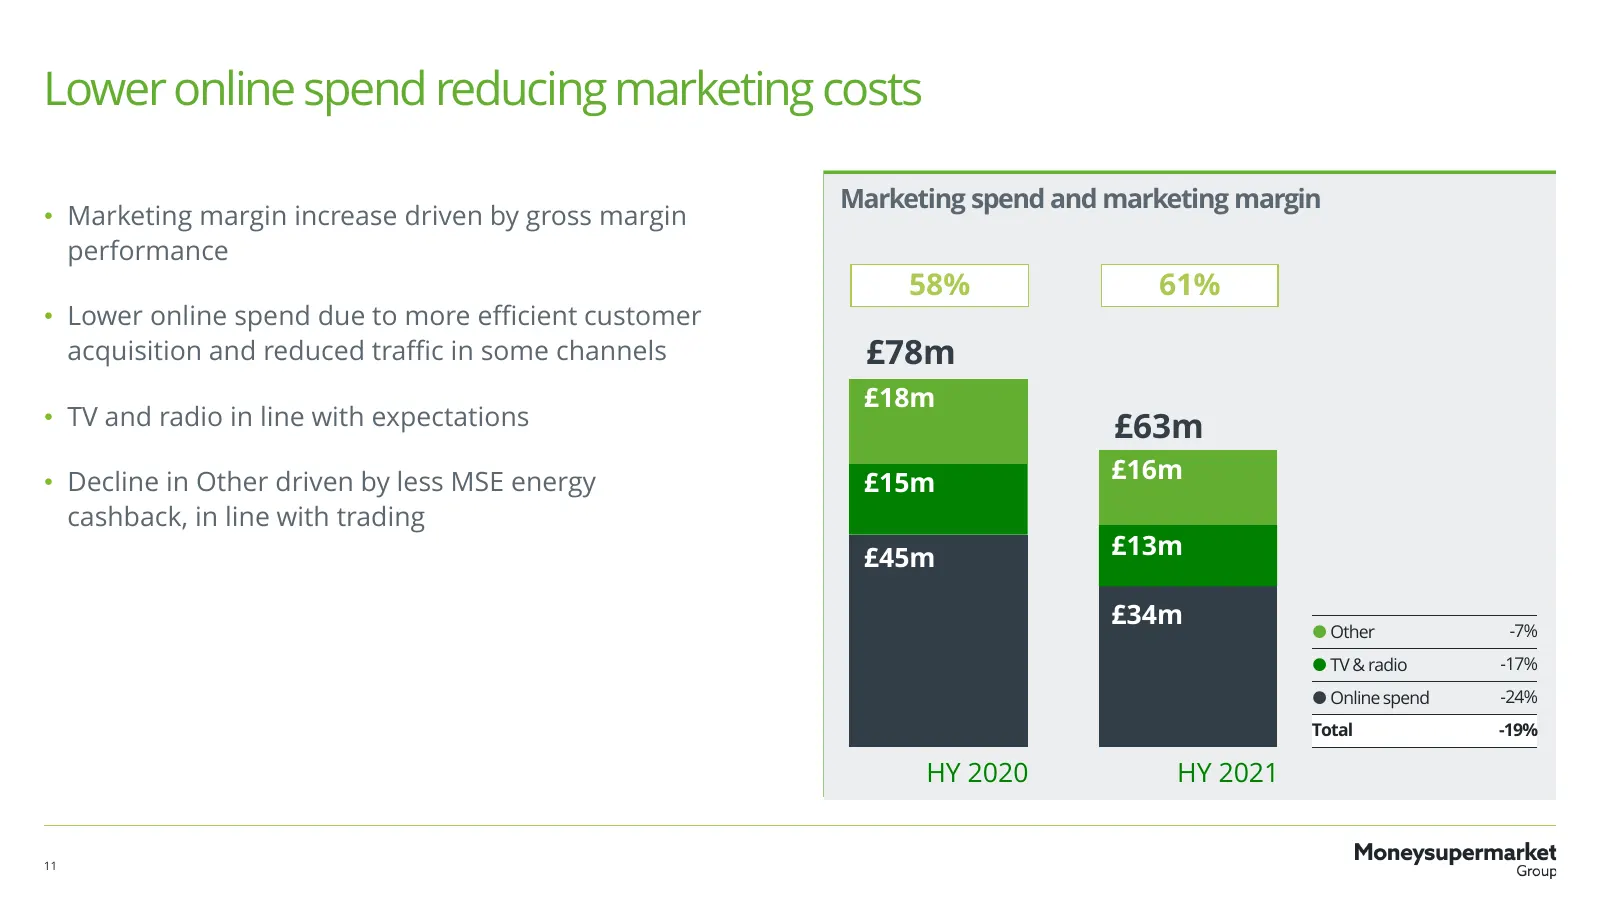
Lower online spend reducing marketing costs Marketing spend and marketing margin • Marketing margin increase driven by gross margin performance 58% 61% • Lower online spend due to more efficient customer acquisition and reduced traffic in some channels £78m £18m • TV and radio in line with expectati
Slide 12: Overall costs down, driven by marketing
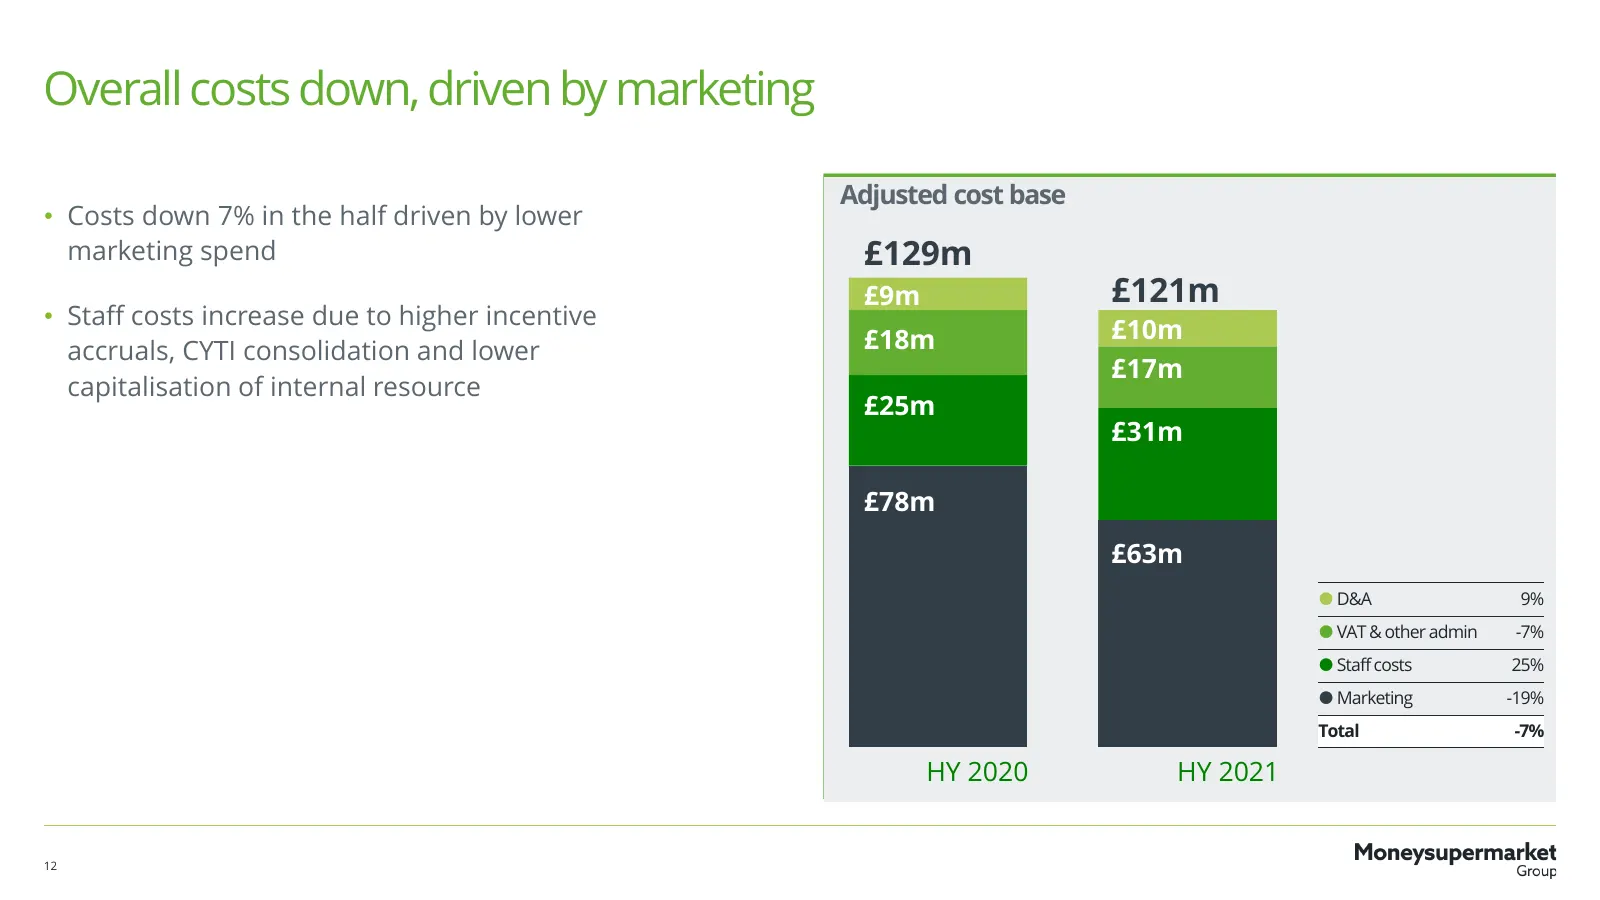
Overall costs down, driven by marketing Adjusted cost base • Costs down 7% in the half driven by lower marketing spend £129m £9m £121m • Staff costs increase due to higher incentive £18m £10m accruals, CYTI consolidation and lower £17m capitalisation of internal resource £25m £31m £78m £63m D&A 9%
Slide 13: Cash generation remains robust
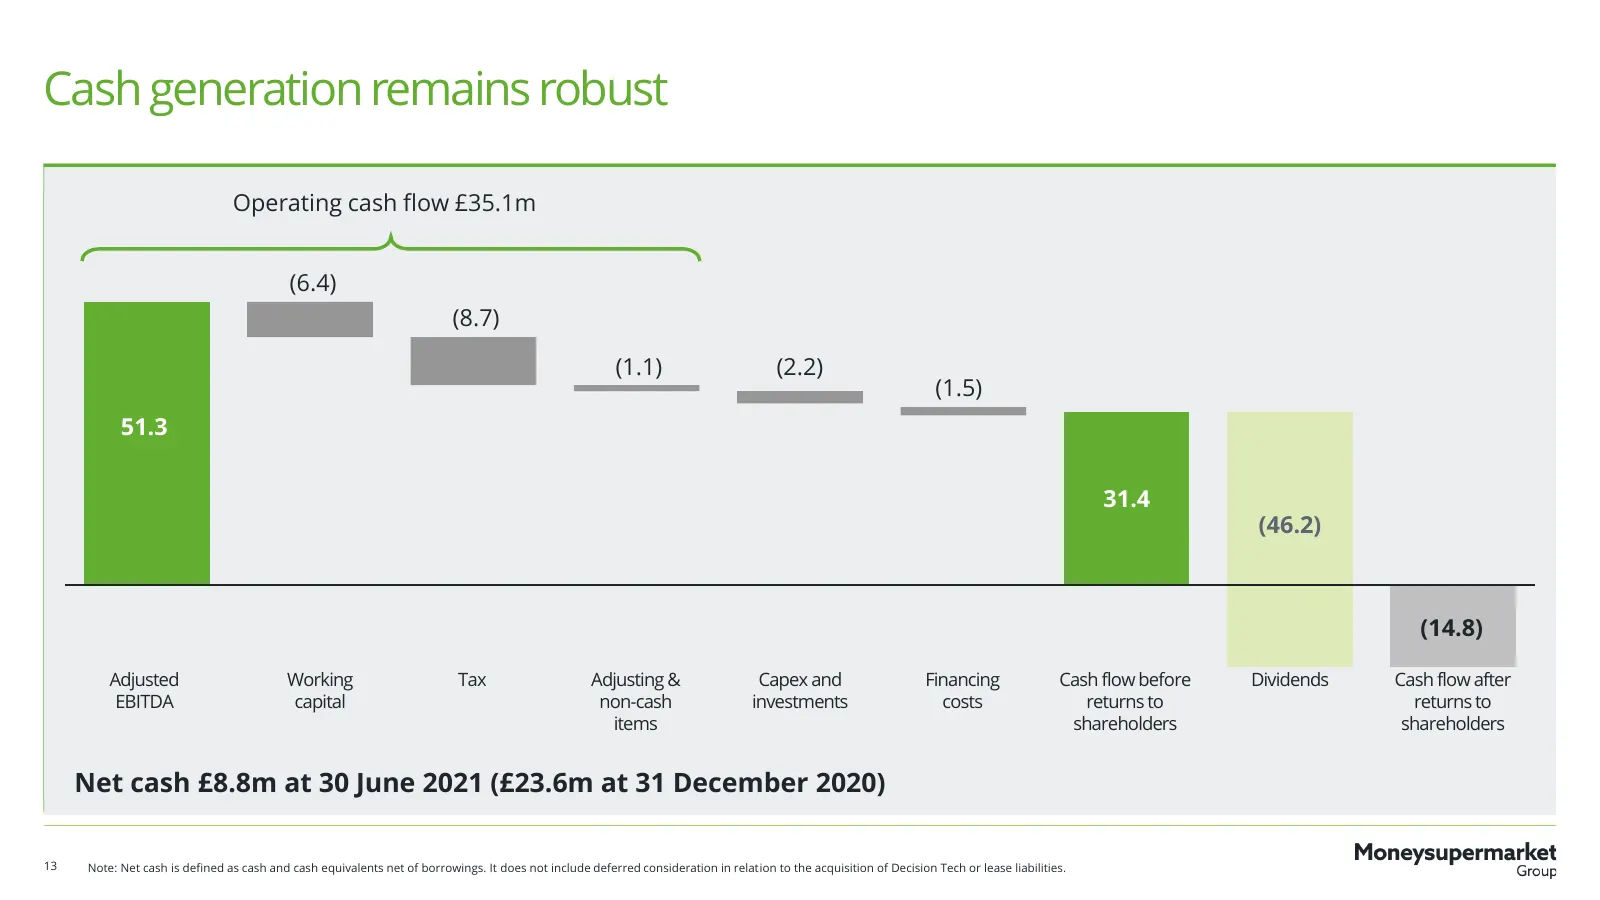
Cash generation remains robust Operating cash flow £35.1m (6.4) (8.7) (1.1) (2.2) (1.5) 51.3 31.4 (46.2) (14.8) Adjusted Working Tax Adjusting & Capex and Financing Cash flow before Dividends Cash flow after EBITDA capital non-cash investments costs returns to returns to items shareholders sharehold
Slide 14: Capital allocation framework remains unchanged
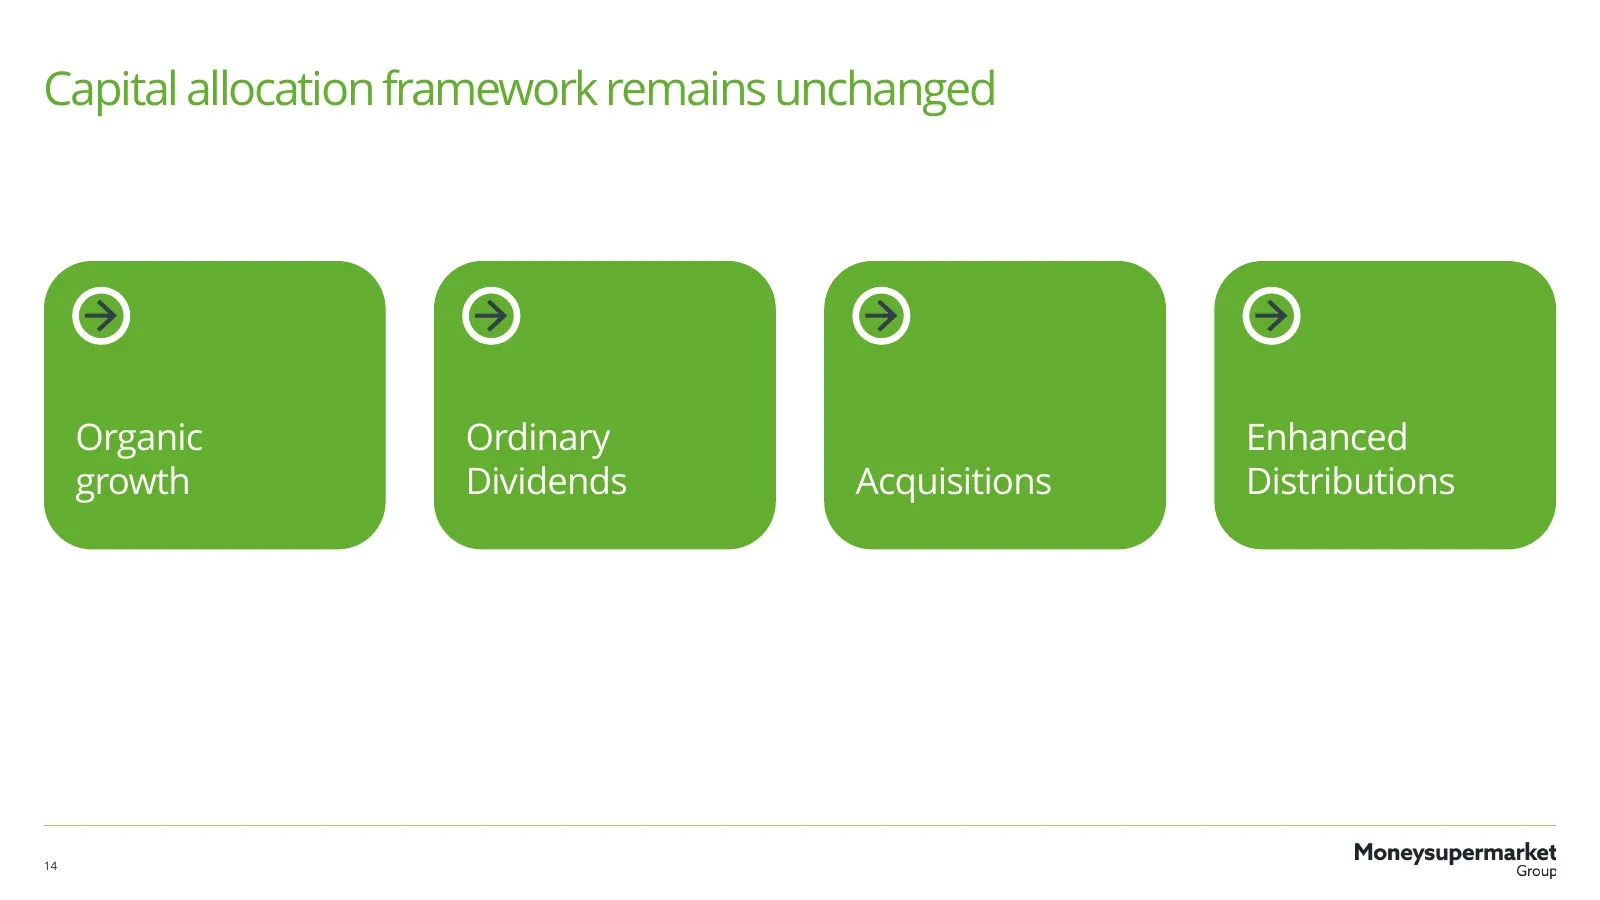
Capital allocation framework remains unchanged Organic Ordinary Enhanced growth Dividends Acquisitions Distributions 14
Slide 15: Outlook
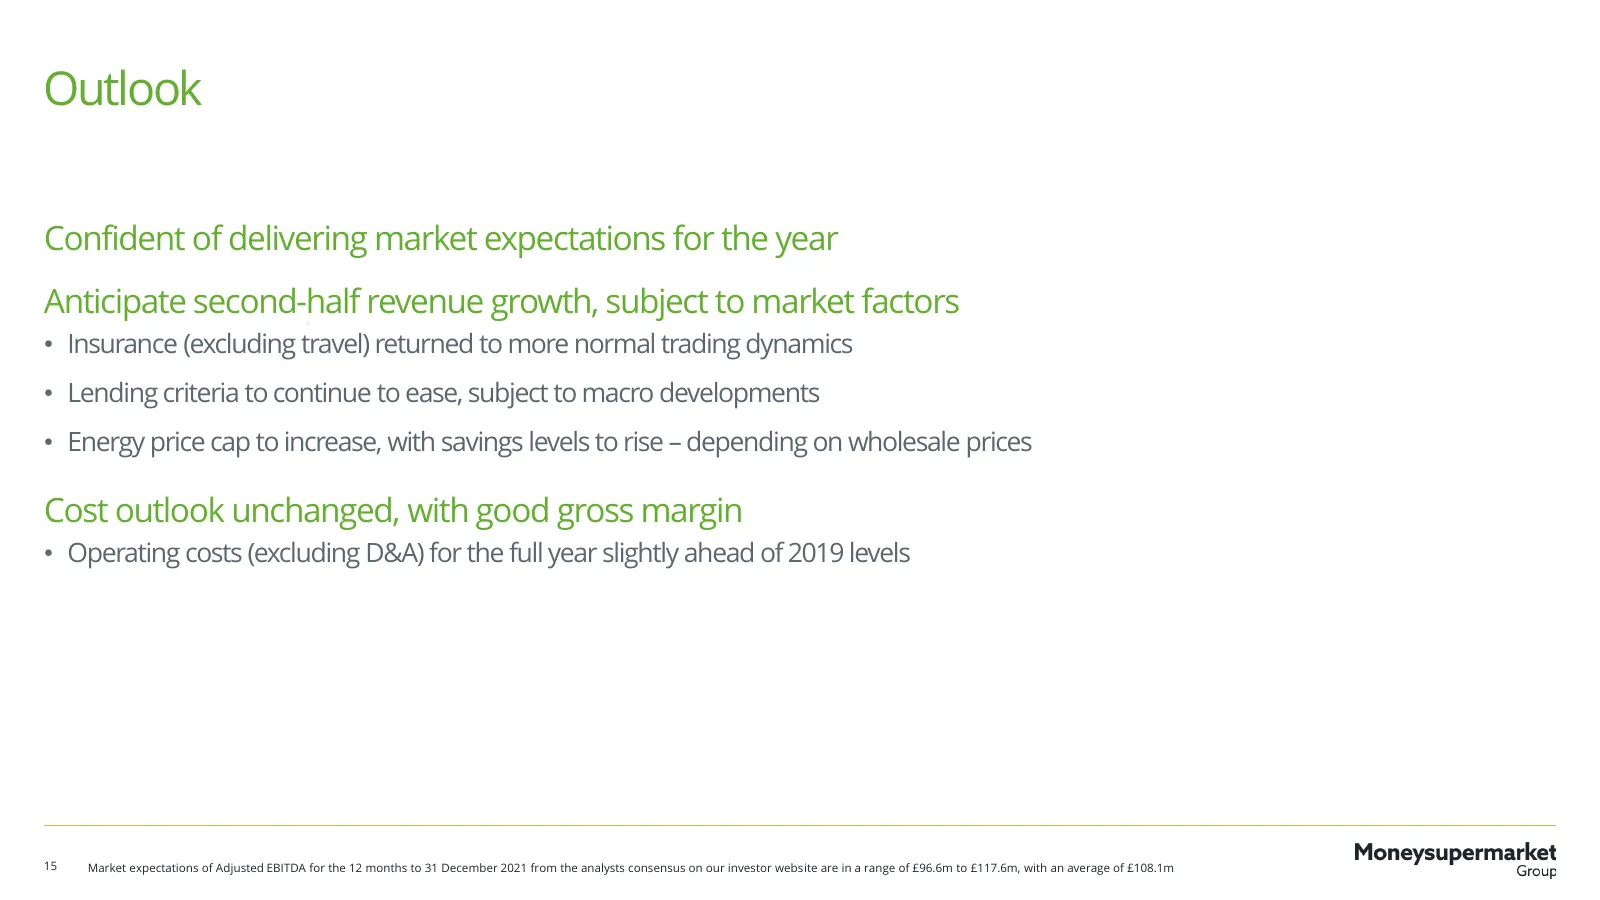
Outlook Confident of delivering market expectations for the year Anticipate second-half revenue growth, subject to market factors • Insurance (excluding travel) returned to more normal trading dynamics • Lending criteria to continue to ease, subject to macro developments • Energy price cap to increa

Slide 16: Peter Duffy, Chief Executive Officer
IMAGE TO FOLLOW Peter Duffy Chief Executive Officer
Slide 17: Our purpose and strategy
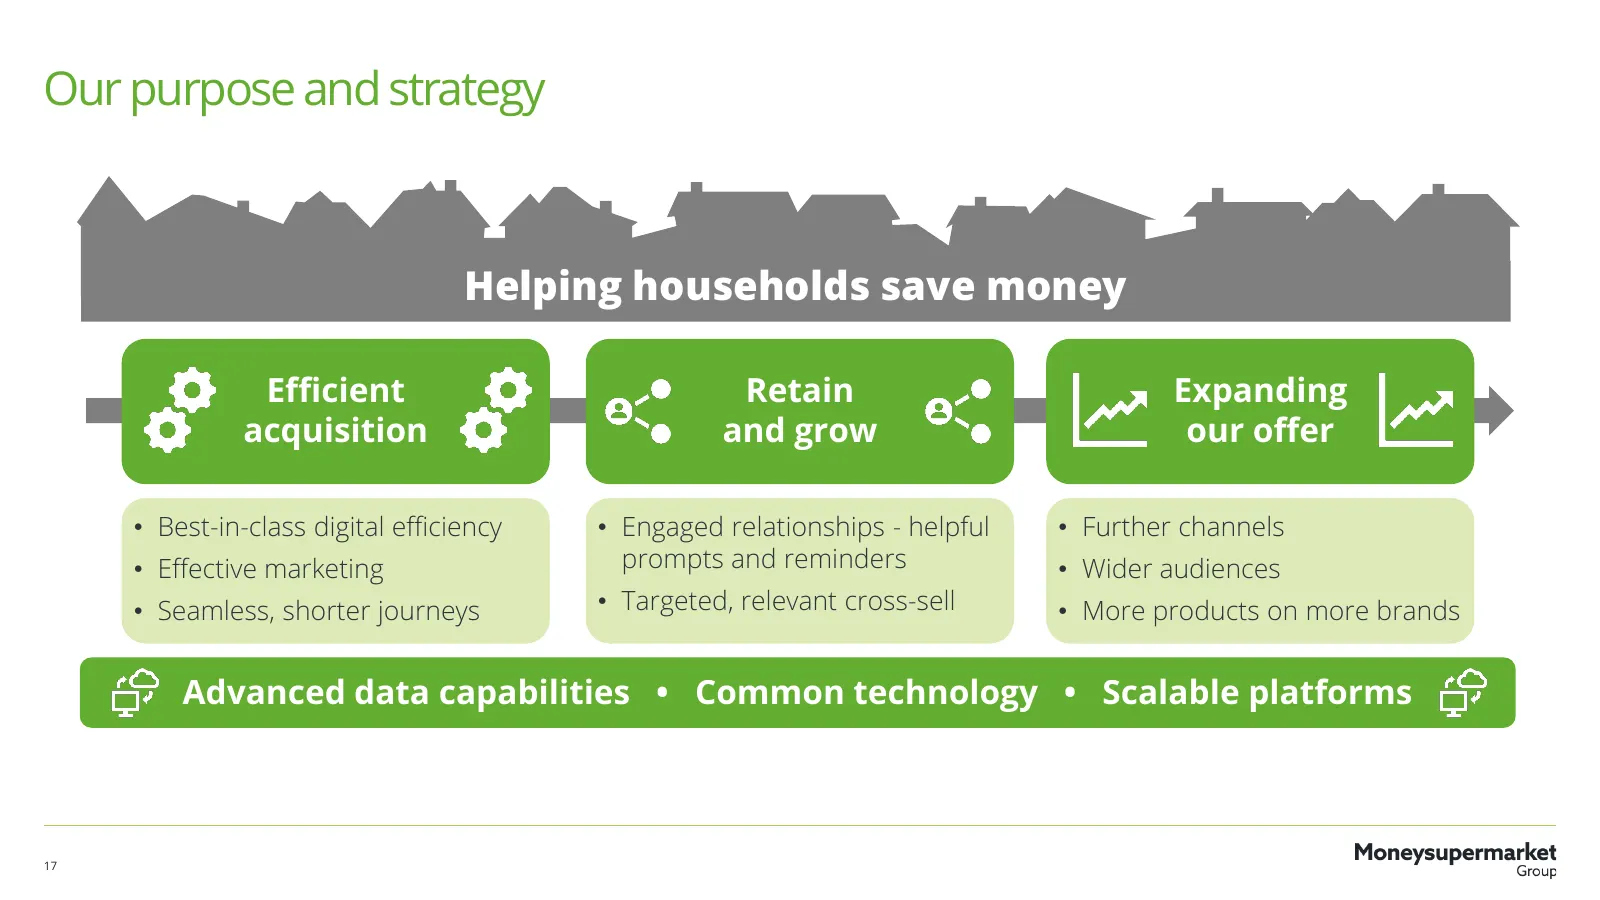
Our purpose and strategy Helping households save money Efficient Retain Expanding acquisition and grow our offer • Best-in-class digital efficiency • Engaged relationships - helpful • Further channels • Effective marketing prompts and reminders • Wider audiences • Seamless, shorter journeys • Target
Slide 18: Delivering our strategy
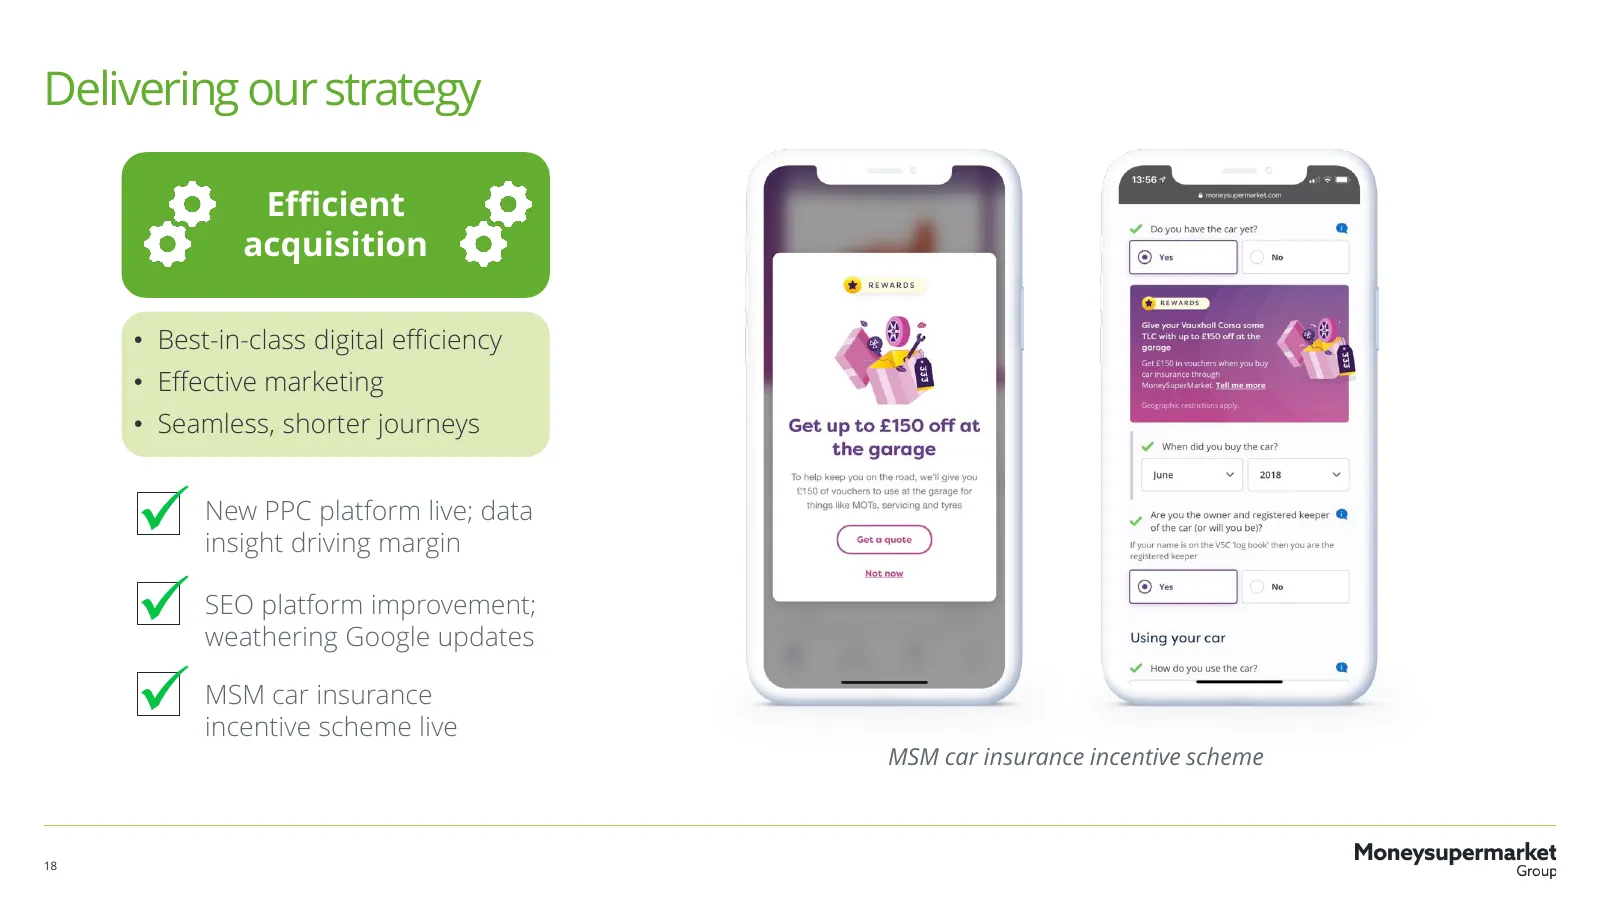
Delivering our strategy Efficient acquisition • Best-in-class digital efficiency • Effective marketing • Seamless, shorter journeys New PPC platform live; data insight driving margin SEO platform improvement; weathering Google updates MSM car insurance incentive scheme live MSM car insurance i
Slide 19: Delivering our strategy
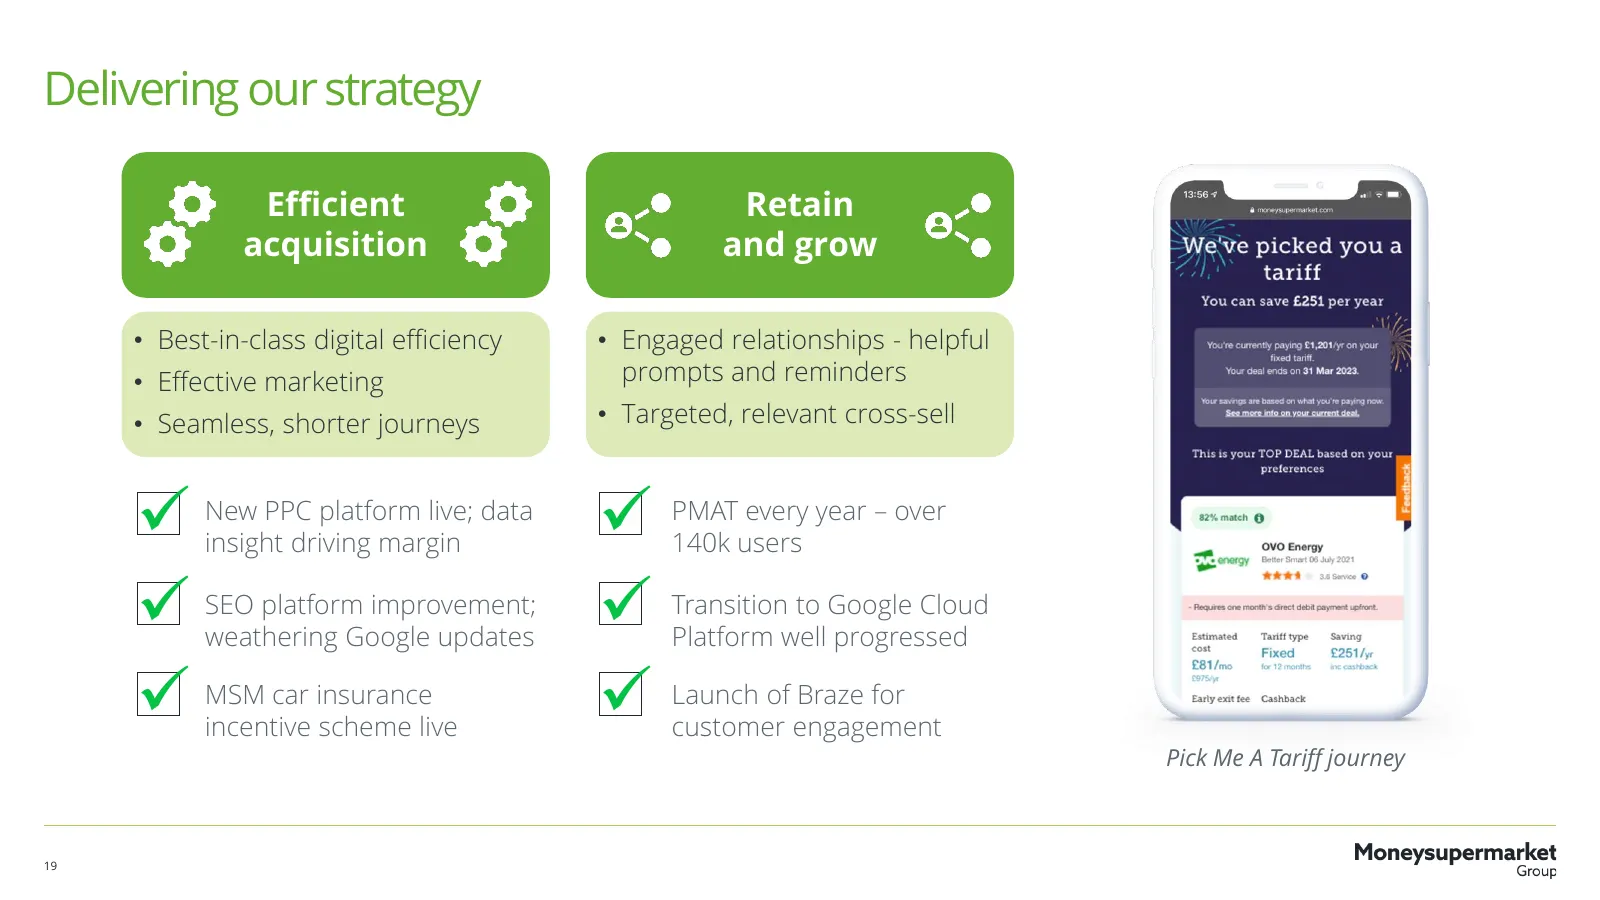
Delivering our strategy Efficient Retain acquisition and grow • Best-in-class digital efficiency • Engaged relationships - helpful • Effective marketing prompts and reminders • Seamless, shorter journeys • Targeted, relevant cross-sell New PPC platform live; data insight driving margin PMAT ever
Slide 20: Delivering our strategy
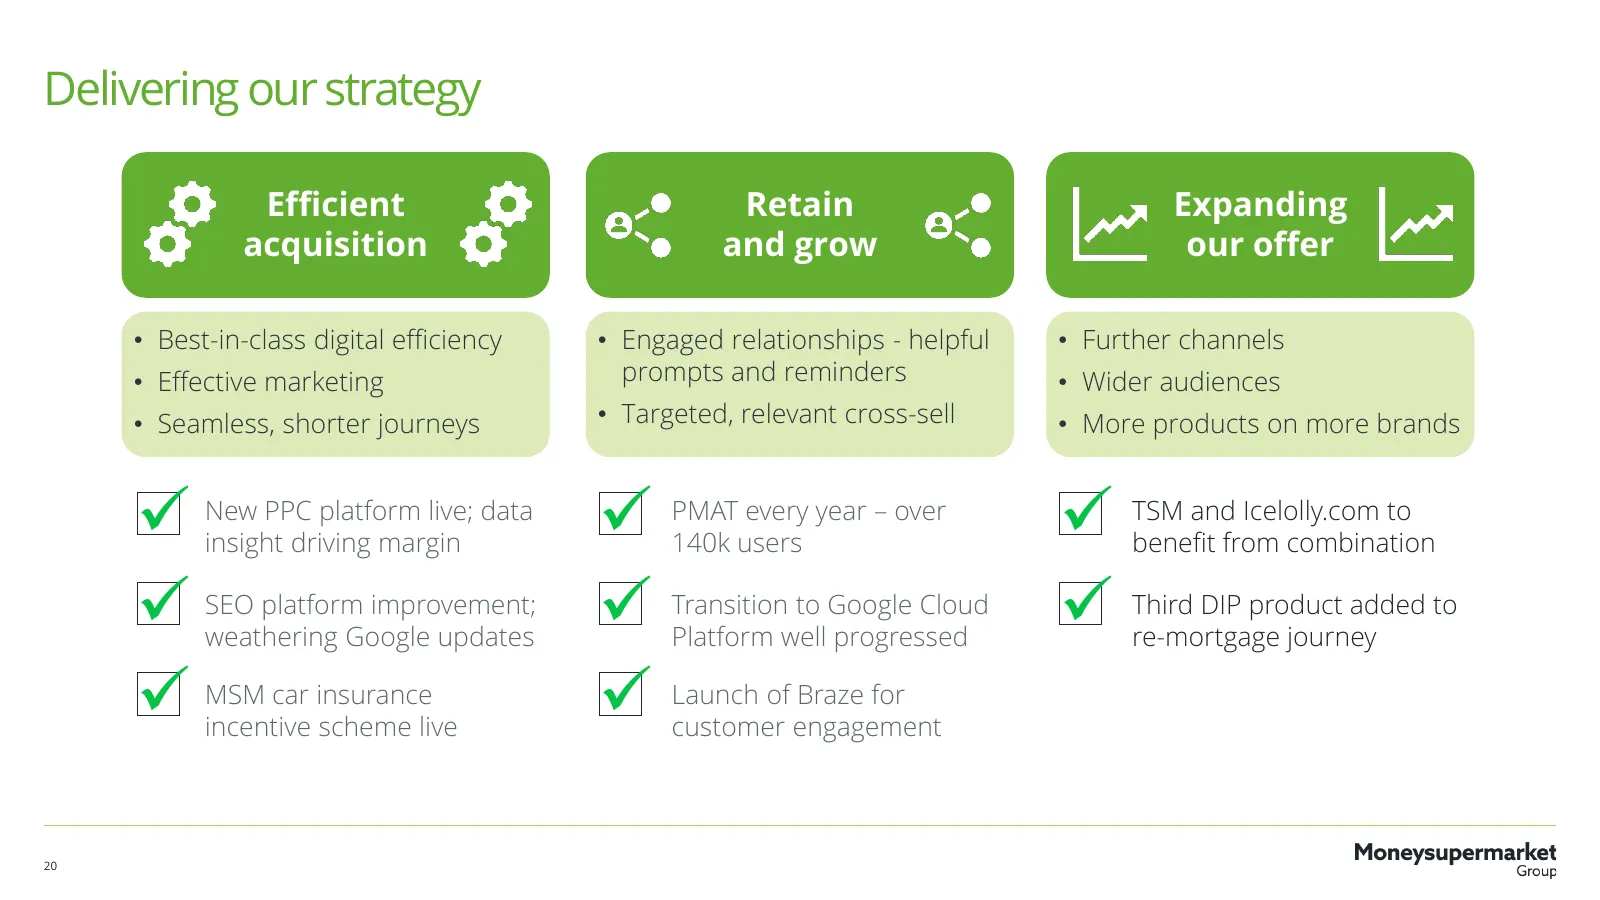
Delivering our strategy Efficient Retain Expanding acquisition and grow our offer • Best-in-class digital efficiency • Engaged relationships - helpful • Further channels • Effective marketing prompts and reminders • Wider audiences • Seamless, shorter journeys • Targeted, relevant cross-sell • More
Slide 21: Building a leading data environment
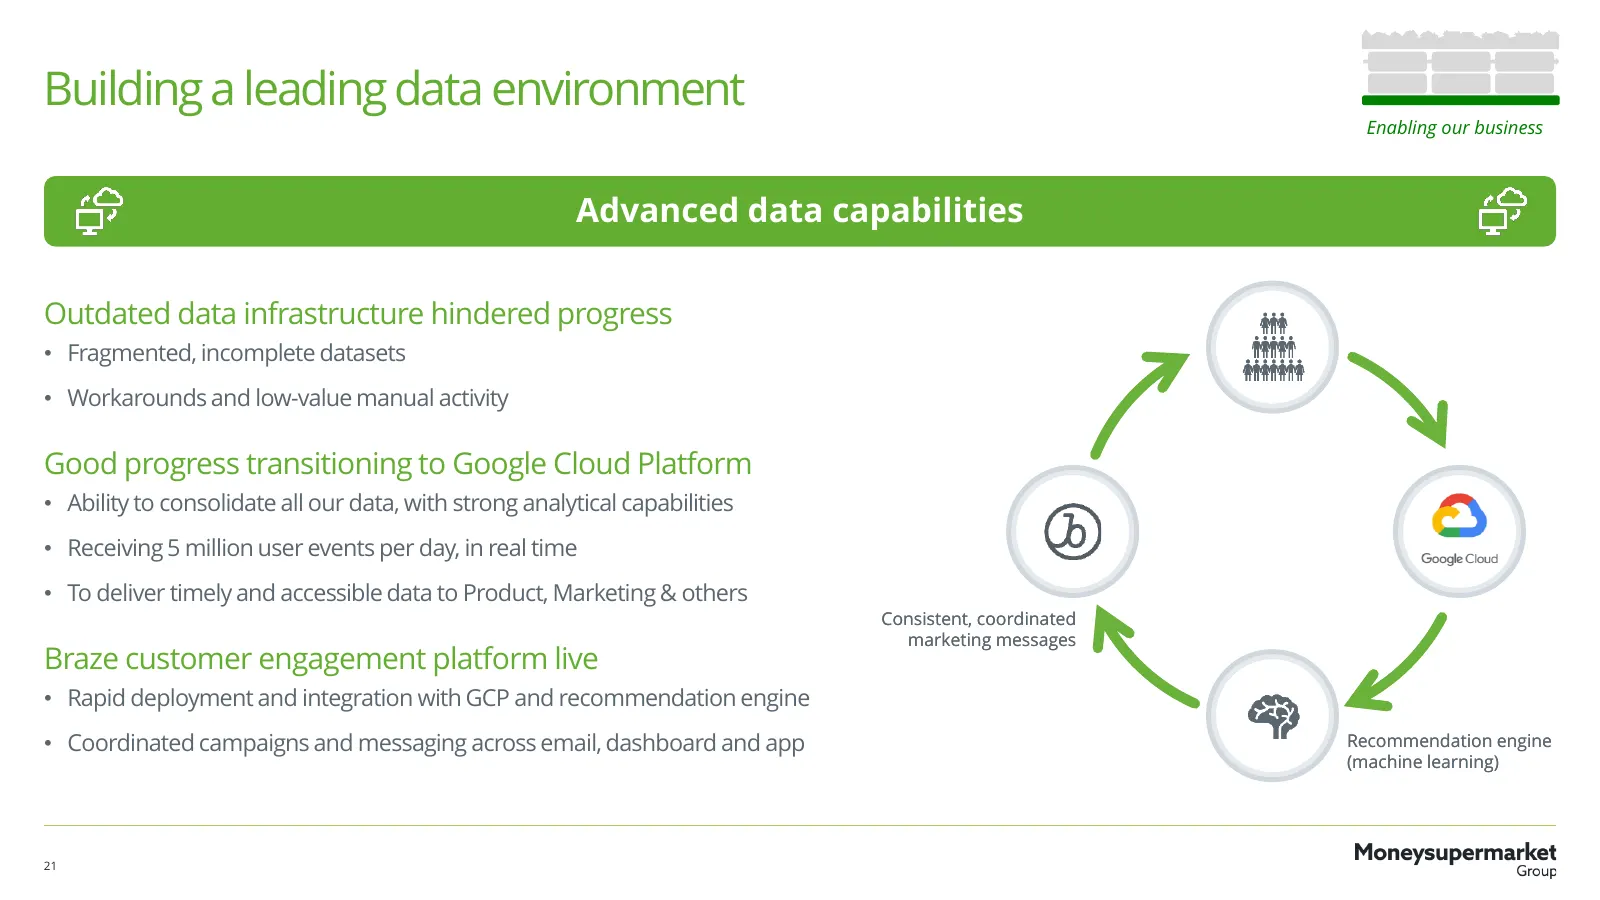
Building a leading data environment Enabling our business Advanced data capabilities Outdated data infrastructure hindered progress • Fragmented, incomplete datasets • Workarounds and low-value manual activity Good progress transitioning to Google Cloud Platform • Ability to consolidate all our data
Slide 22: Platform advantages: Home Services
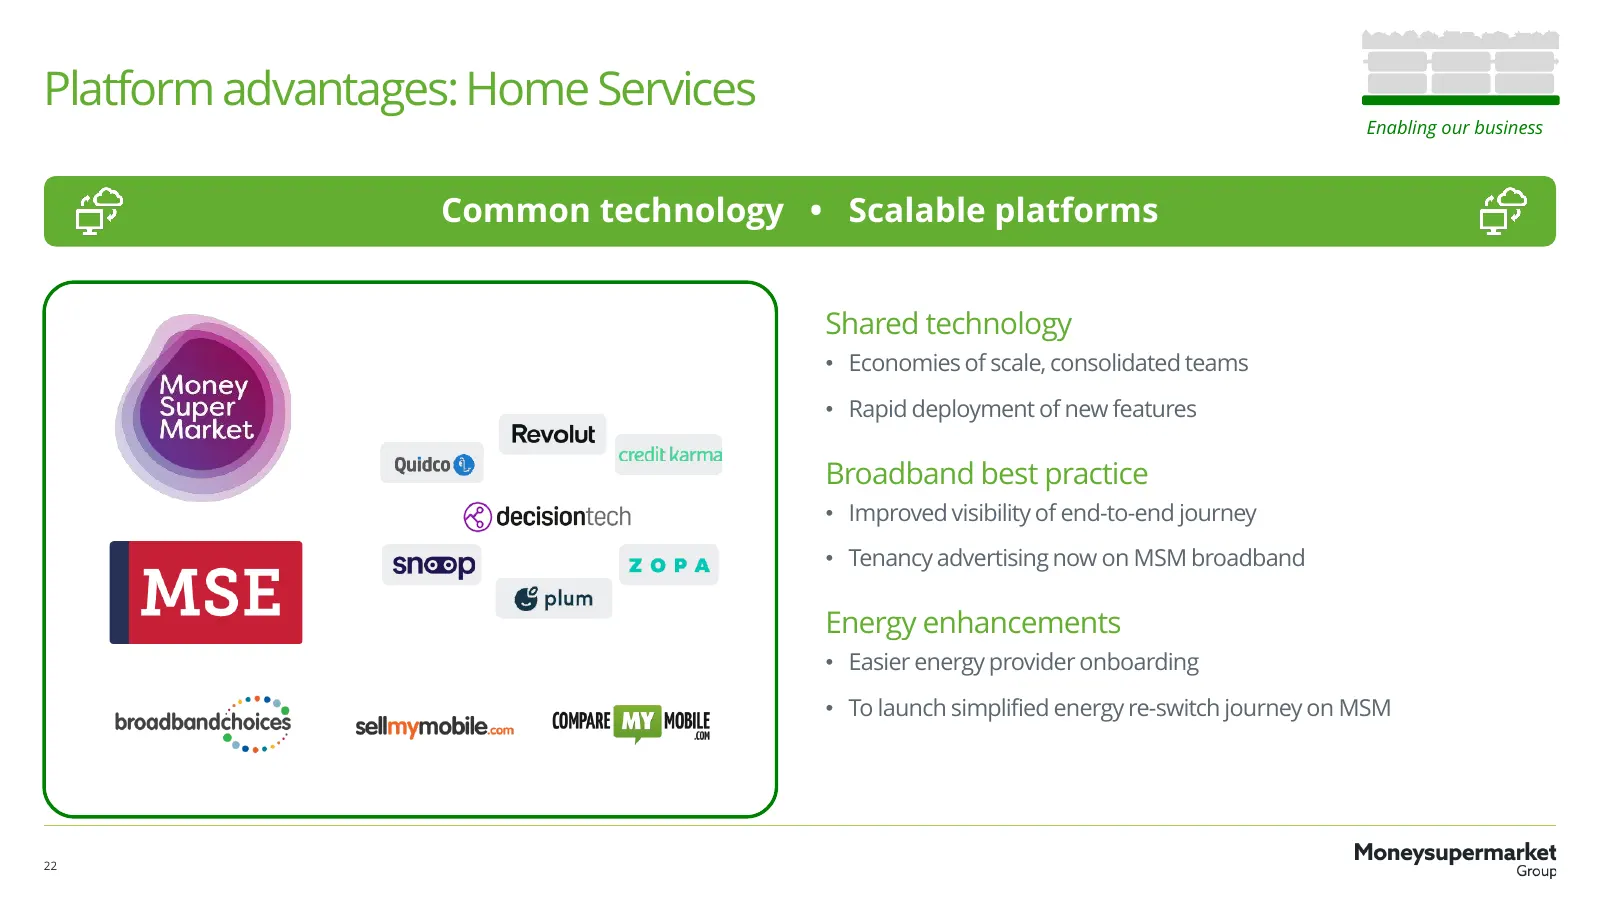
Platform advantages: Home Services Enabling our business Common technology • Scalable platforms Shared technology • Economies of scale, consolidated teams • Rapid deployment of new features Broadband best practice • Improved visibility of end-to-end journey • Tenancy advertising now on MSM broadband
Slide 23: Strategy in action: car insurance
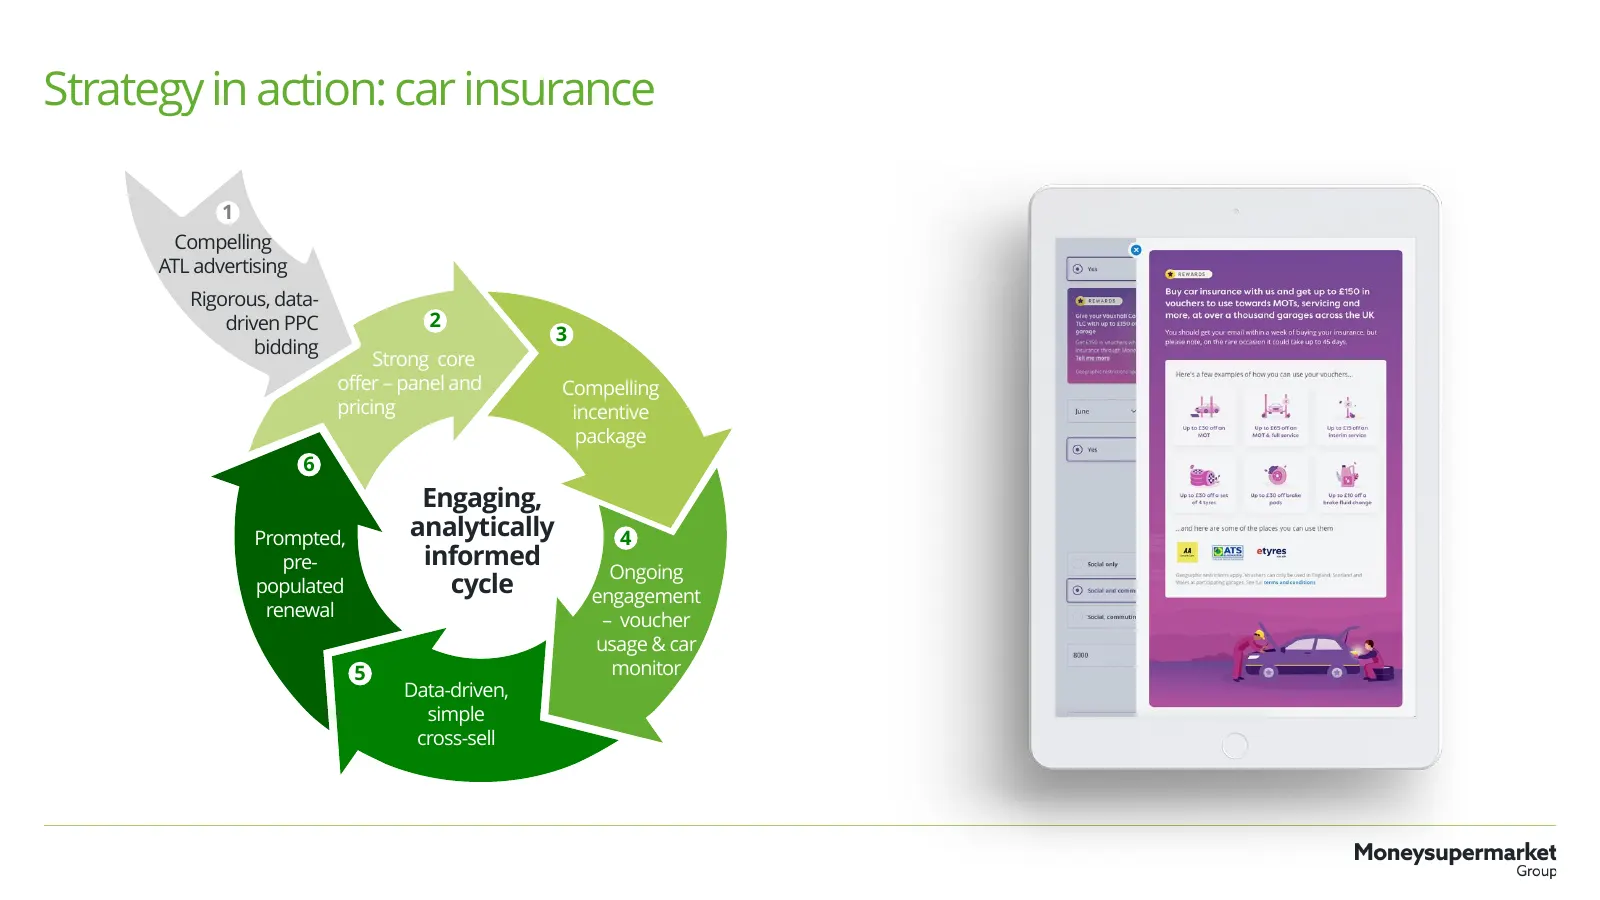
Strategy in action: car insurance 1 Compelling ATL advertising Rigorous, data- driven PPC 2 3 bidding Strong core offer – panel and Compelling pricing incentive package 6 Engaging, Prompted, analytically 4 pre- informed Ongoing populated cycle engagement renewal – voucher usage & car 5 monitor Data-
Slide 24: Good growth in Pick Me A Tariff Every Year
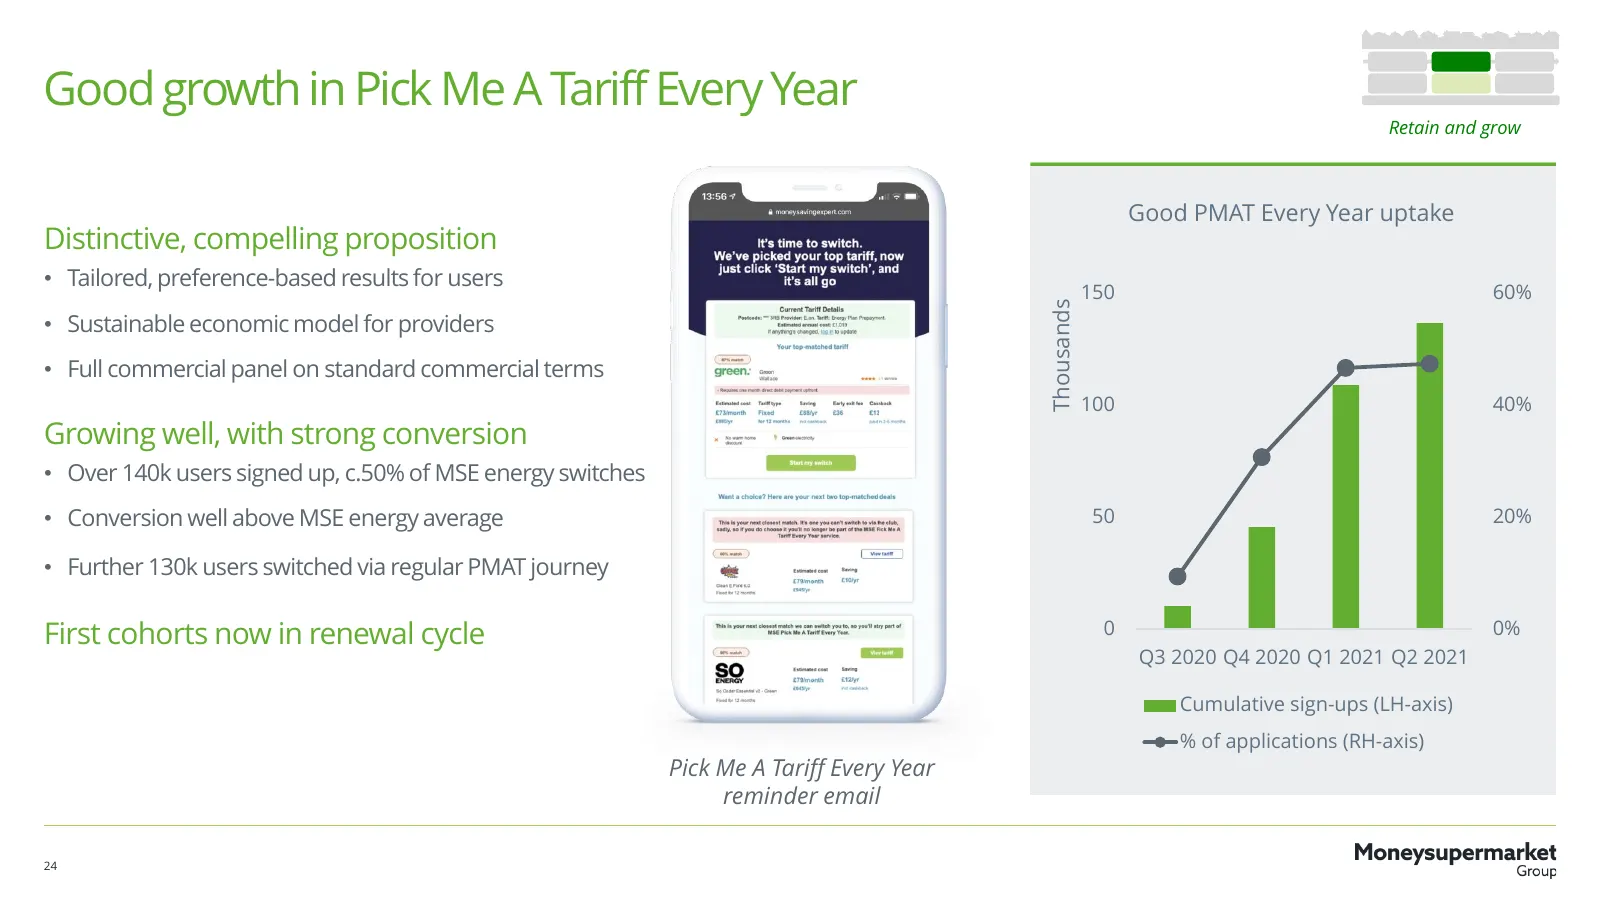
Good growth in Pick Me A Tariff Every Year Retain and grow Good PMAT Every Year uptake Distinctive, compelling proposition • Tailored, preference-based results for users 150 60% Thousands • Sustainable economic model for providers • Full commercial panel on standard commercial terms 100 40% Growing
Slide 25: TravelSupermarket to combine with Icelolly.com
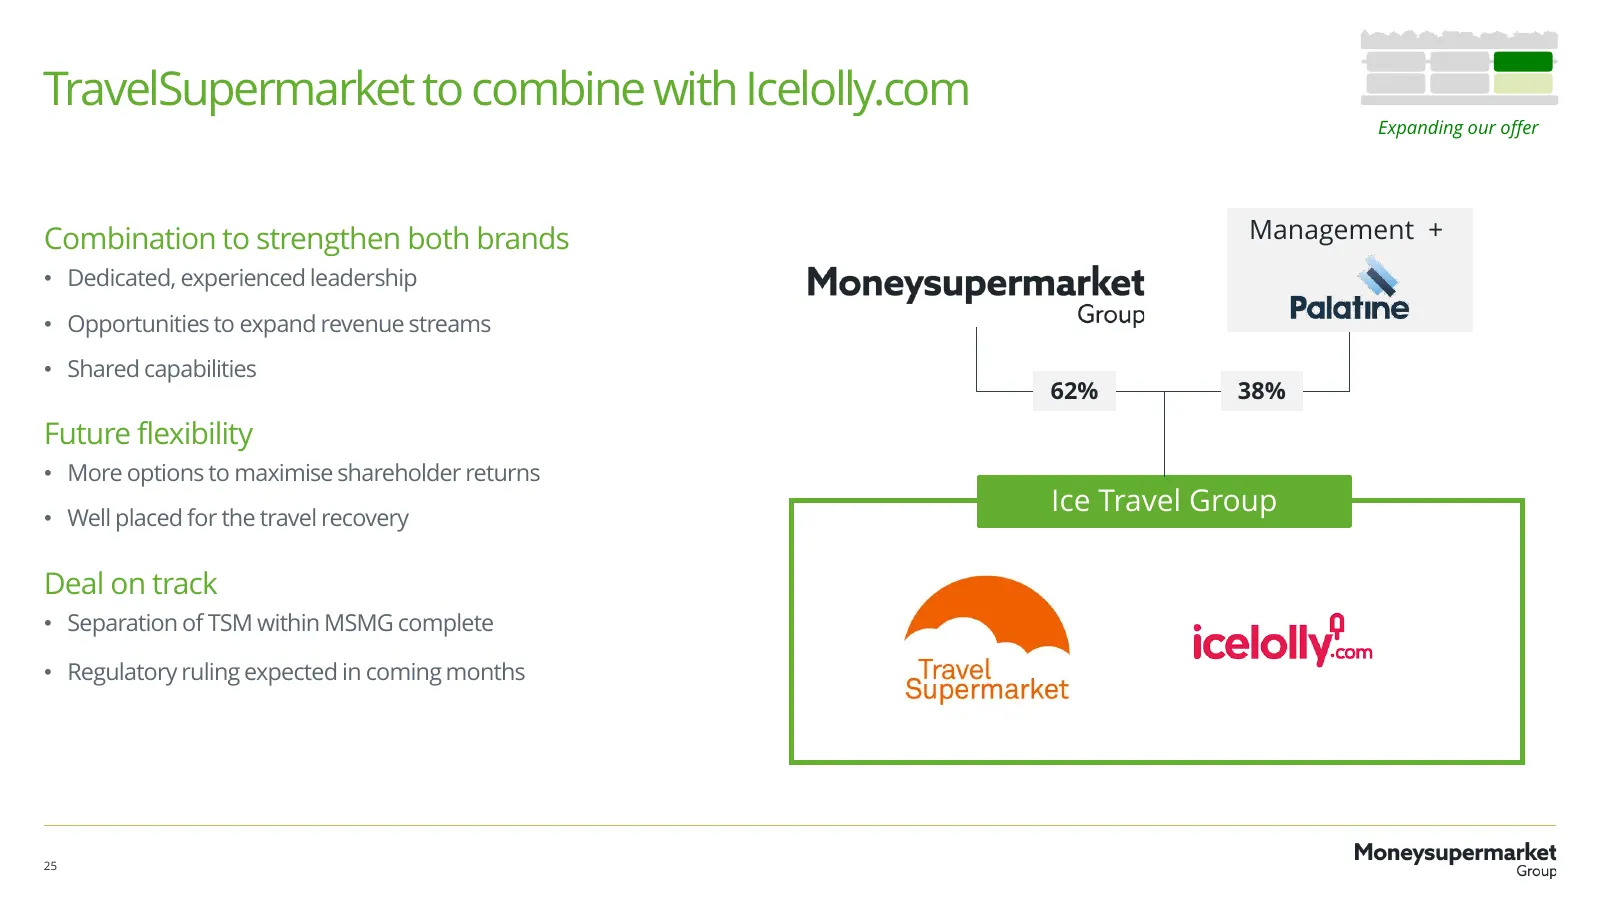
TravelSupermarket to combine with Icelolly.com Expanding our offer Combination to strengthen both brands Management + • Dedicated, experienced leadership • Opportunities to expand revenue streams • Shared capabilities 62% 38% Future flexibility • More options to maximise shareholder returns • Well p
Slide 26: Looking ahead to H2
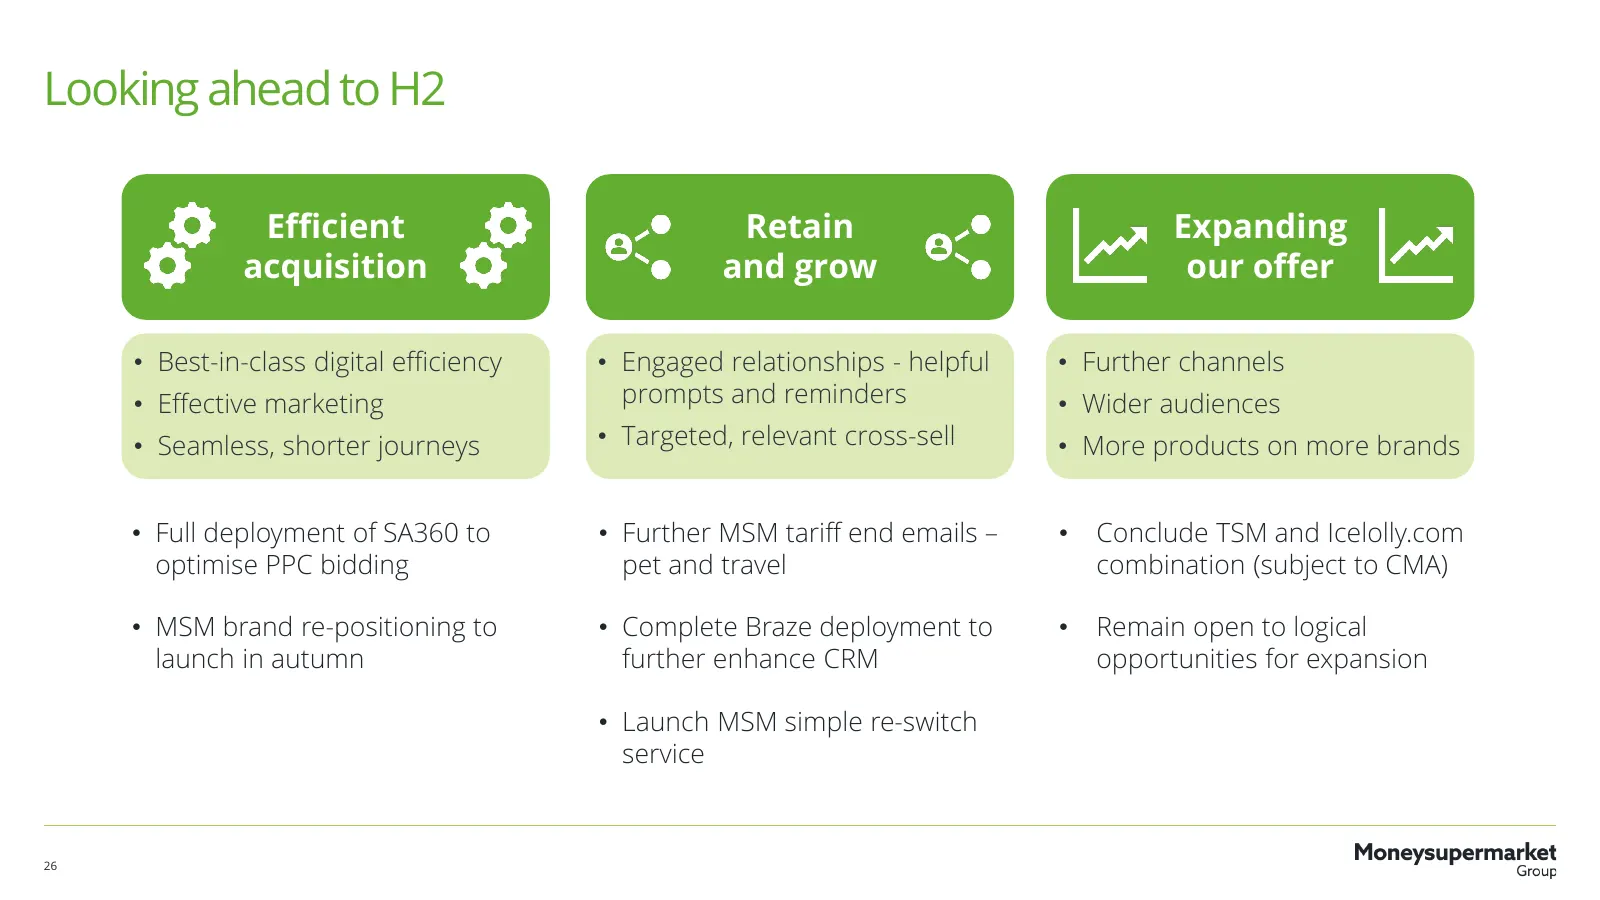
Looking ahead to H2 Efficient Retain Expanding acquisition and grow our offer • Best-in-class digital efficiency • Engaged relationships - helpful • Further channels • Effective marketing prompts and reminders • Wider audiences • Seamless, shorter journeys • Targeted, relevant cross-sell • More prod
Slide 27: Strategic execution on track amid tough market conditions
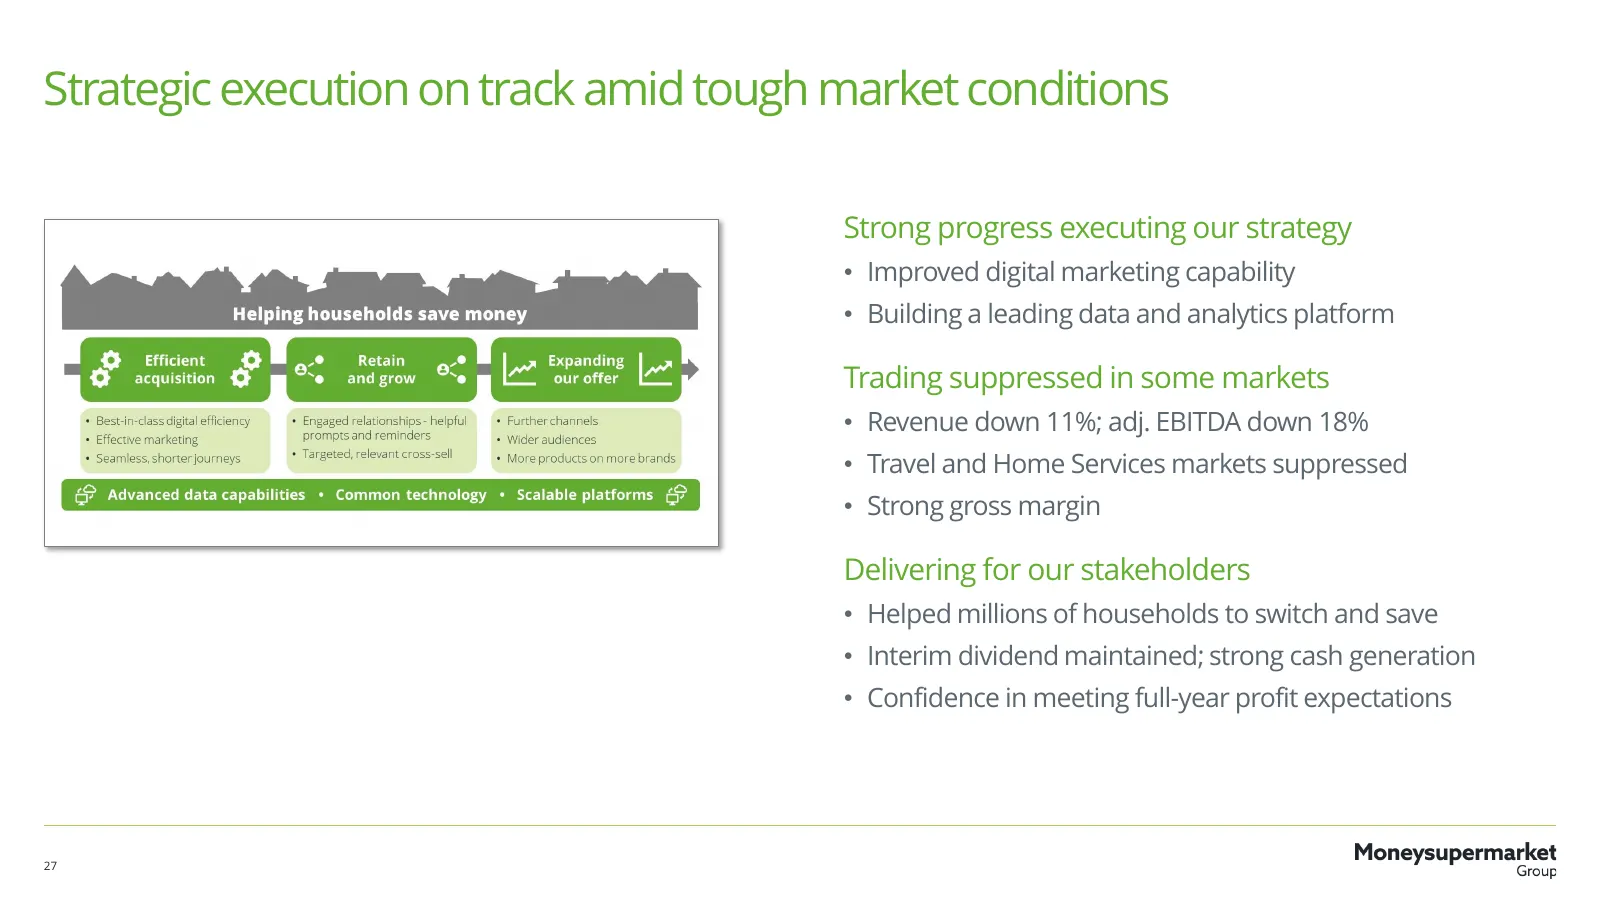
Strategic execution on track amid tough market conditions Strong progress executing our strategy • Improved digital marketing capability • Building a leading data and analytics platform Trading suppressed in some markets • Revenue down 11%; adj. EBITDA down 18% • Travel and Home Services markets sup

Slide 28: Appendix
Appendix
Slide 29: Strategic KPIs
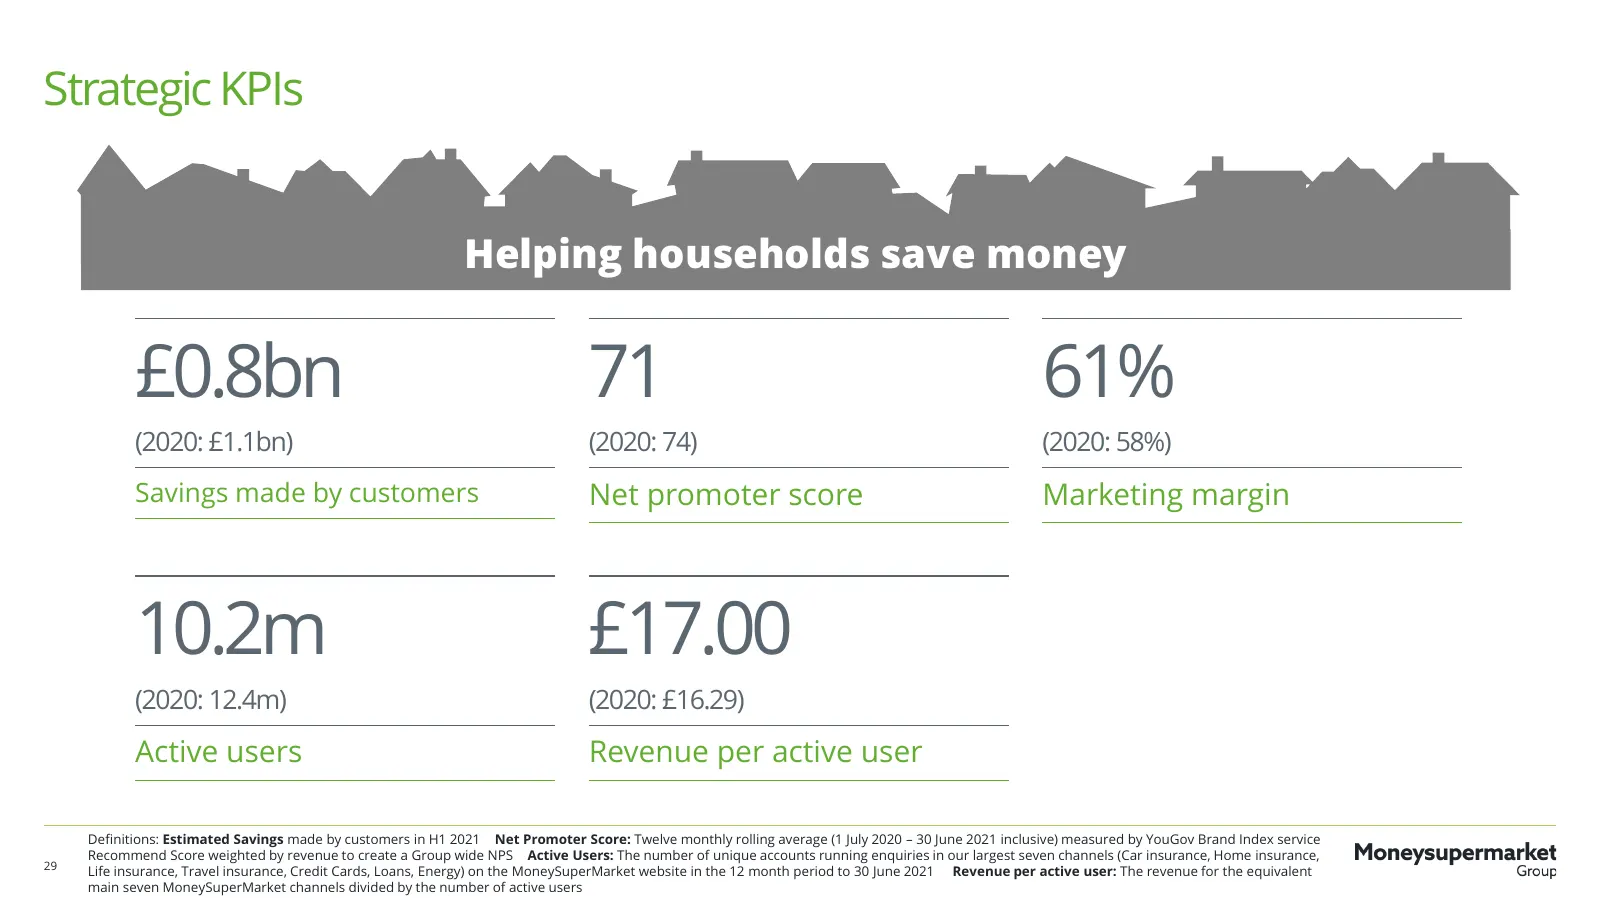
Strategic KPIs Helping households save money £0.8bn 71 61% (2020: £1.1bn) (2020: 74) (2020: 58%) Savings made by customers Net promoter score Marketing margin 10.2m £17.00 (2020: 12.4m) (2020: £16.29) Active users Revenue per active user Definitions: Estimated Savings made by customers in H1 2021 Ne
Slide 30: Fulfilling our purpose and ESG responsibilities
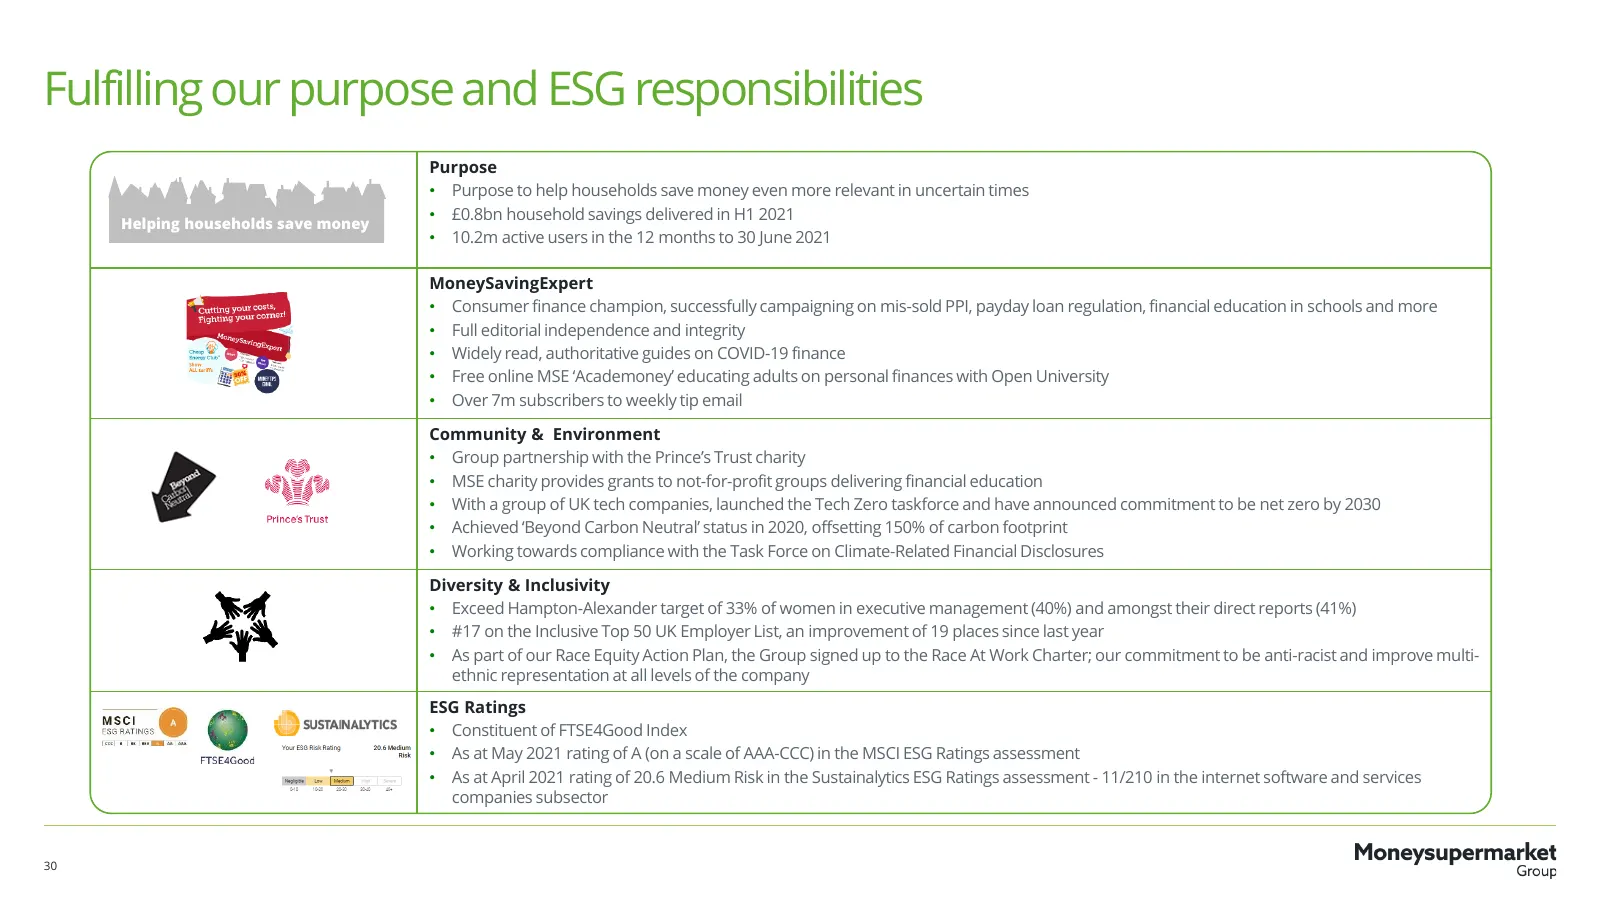
Fulfilling our purpose and ESG responsibilities Purpose • Purpose to help households save money even more relevant in uncertain times • £0.8bn household savings delivered in H1 2021 Helping households save money • 10.2m active users in the 12 months to 30 June 2021 MoneySavingExpert • Consumer finan
Slide 31: Product Engineering investment
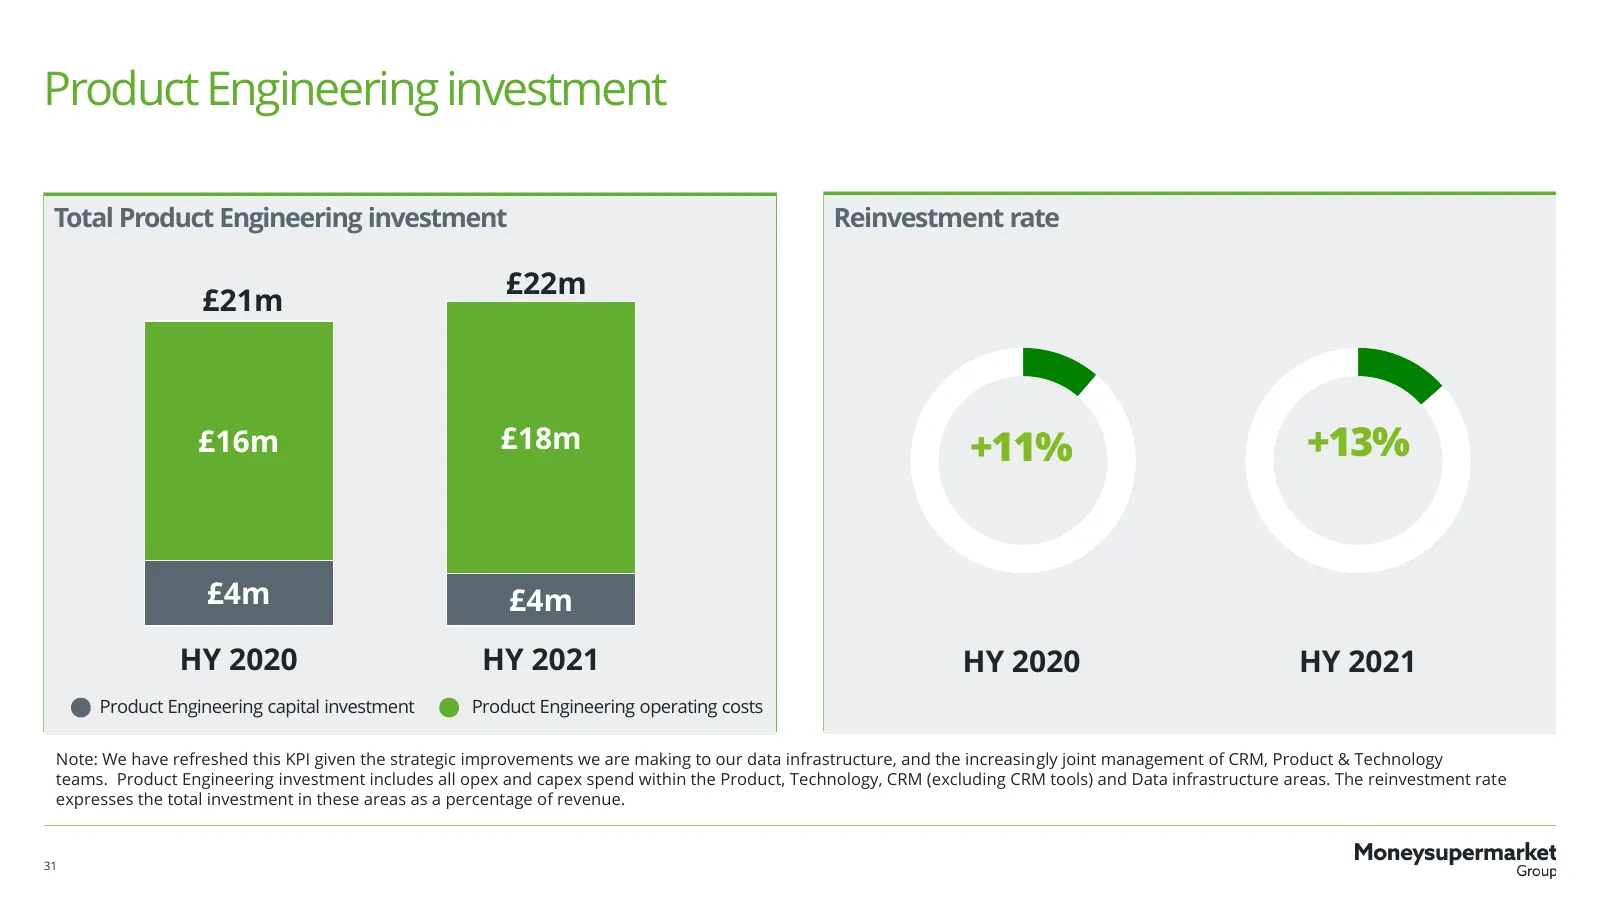
Product Engineering investment Total Product Engineering investment Reinvestment rate £22m £21m £16m £18m +11% +13% £4m £4m HY 2020 HY 2021 HY 2020 HY 2021 Product Engineering capital investment Product Engineering operating costs Note: We have refreshed this KPI given the strategic improvements we
Slide 32: Income Statement
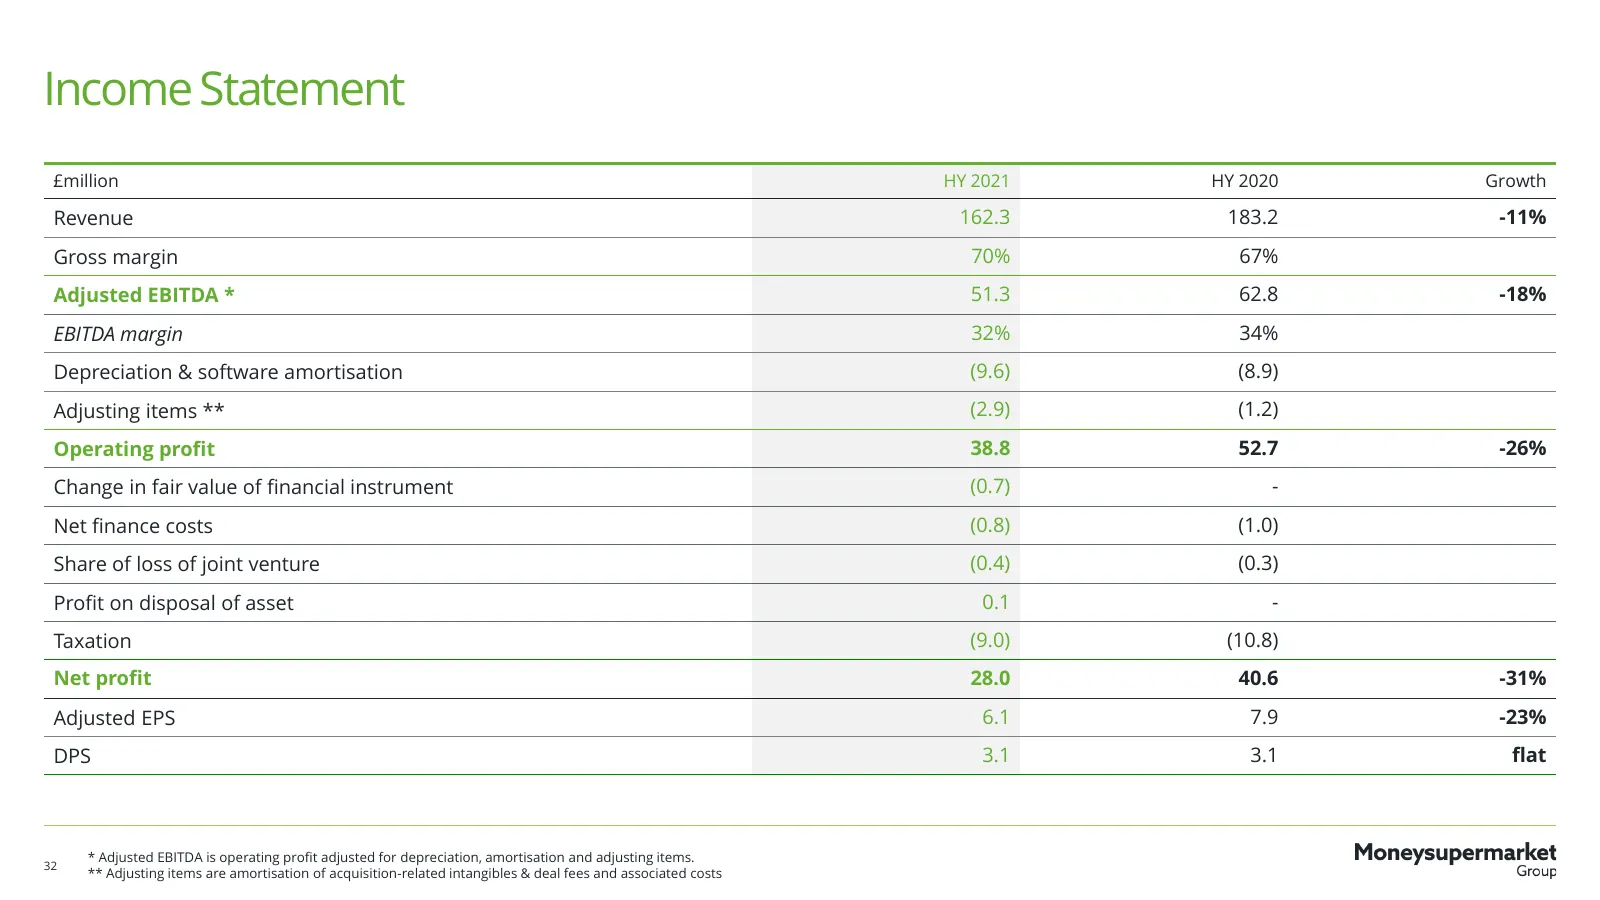
Income Statement £million HY 2021 HY 2020 Growth Revenue 162.3 183.2 -11% Gross margin 70% 67% Adjusted EBITDA * 51.3 62.8 -18% EBITDA margin 32% 34% Depreciation & software amortisation (9.6) (8.9) Adjusting items ** (2.9) (1.2) Operating profit 38.8 52.7 -26% Change in fair value of financial inst
Slide 33: Income Statement
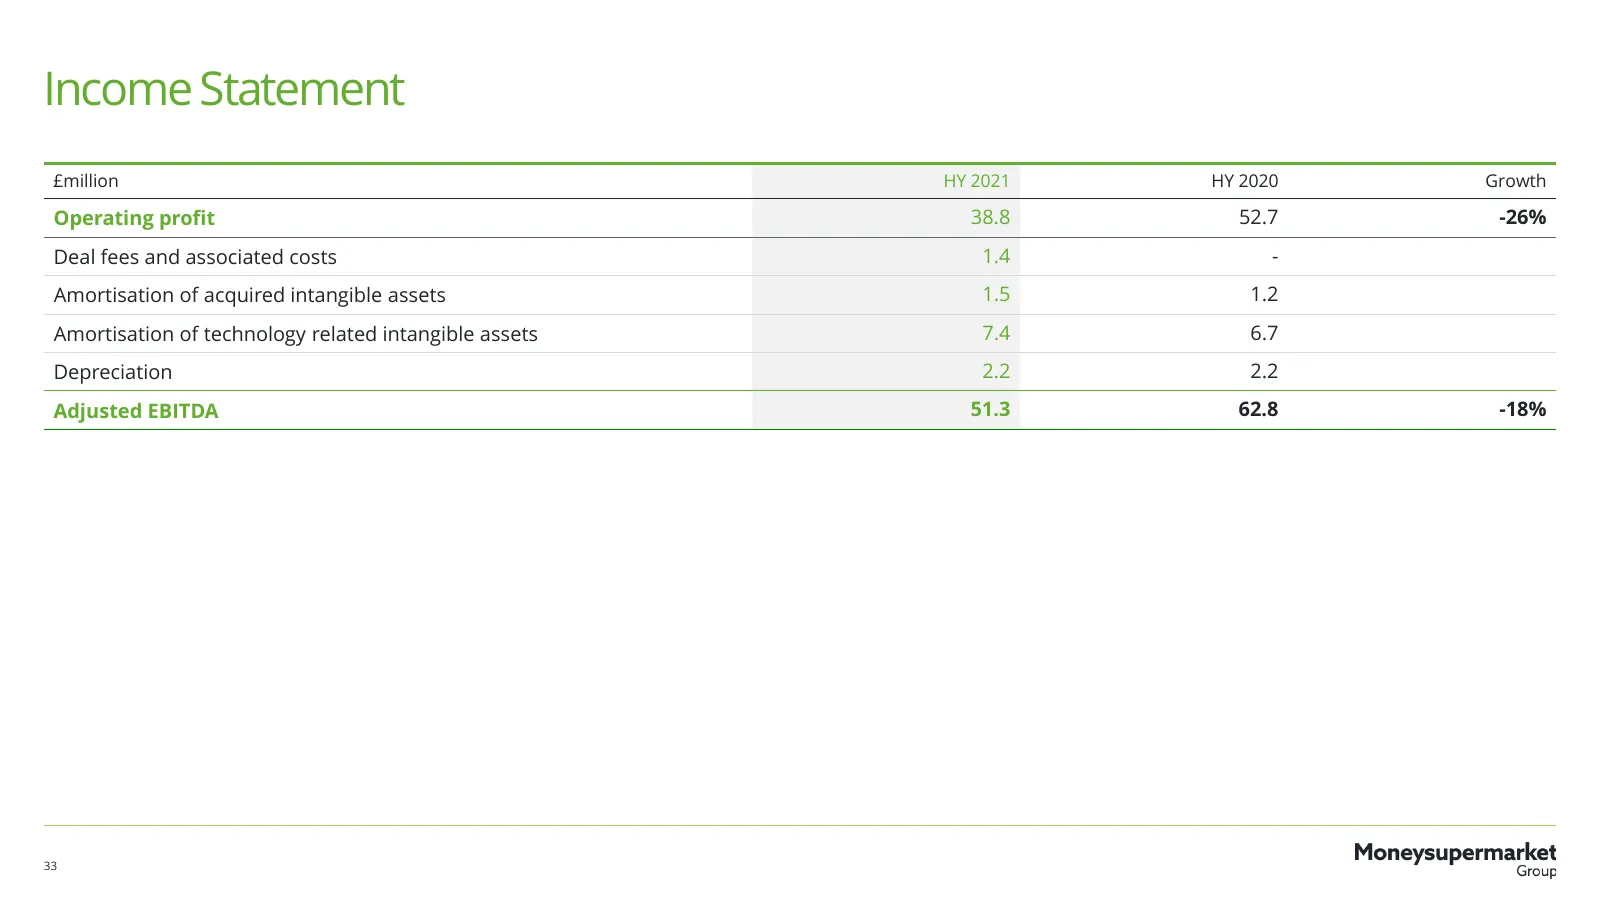
Income Statement £million HY 2021 HY 2020 Growth Operating profit 38.8 52.7 -26% Deal fees and associated costs 1.4 - Amortisation of acquired intangible assets 1.5 1.2 Amortisation of technology related intangible assets 7.4 6.7 Depreciation 2.2 2.2 Adjusted EBITDA 51.3 62.8 -18% 33
Slide 34: Segmental measure of adjusted EBITDA contribution: notes
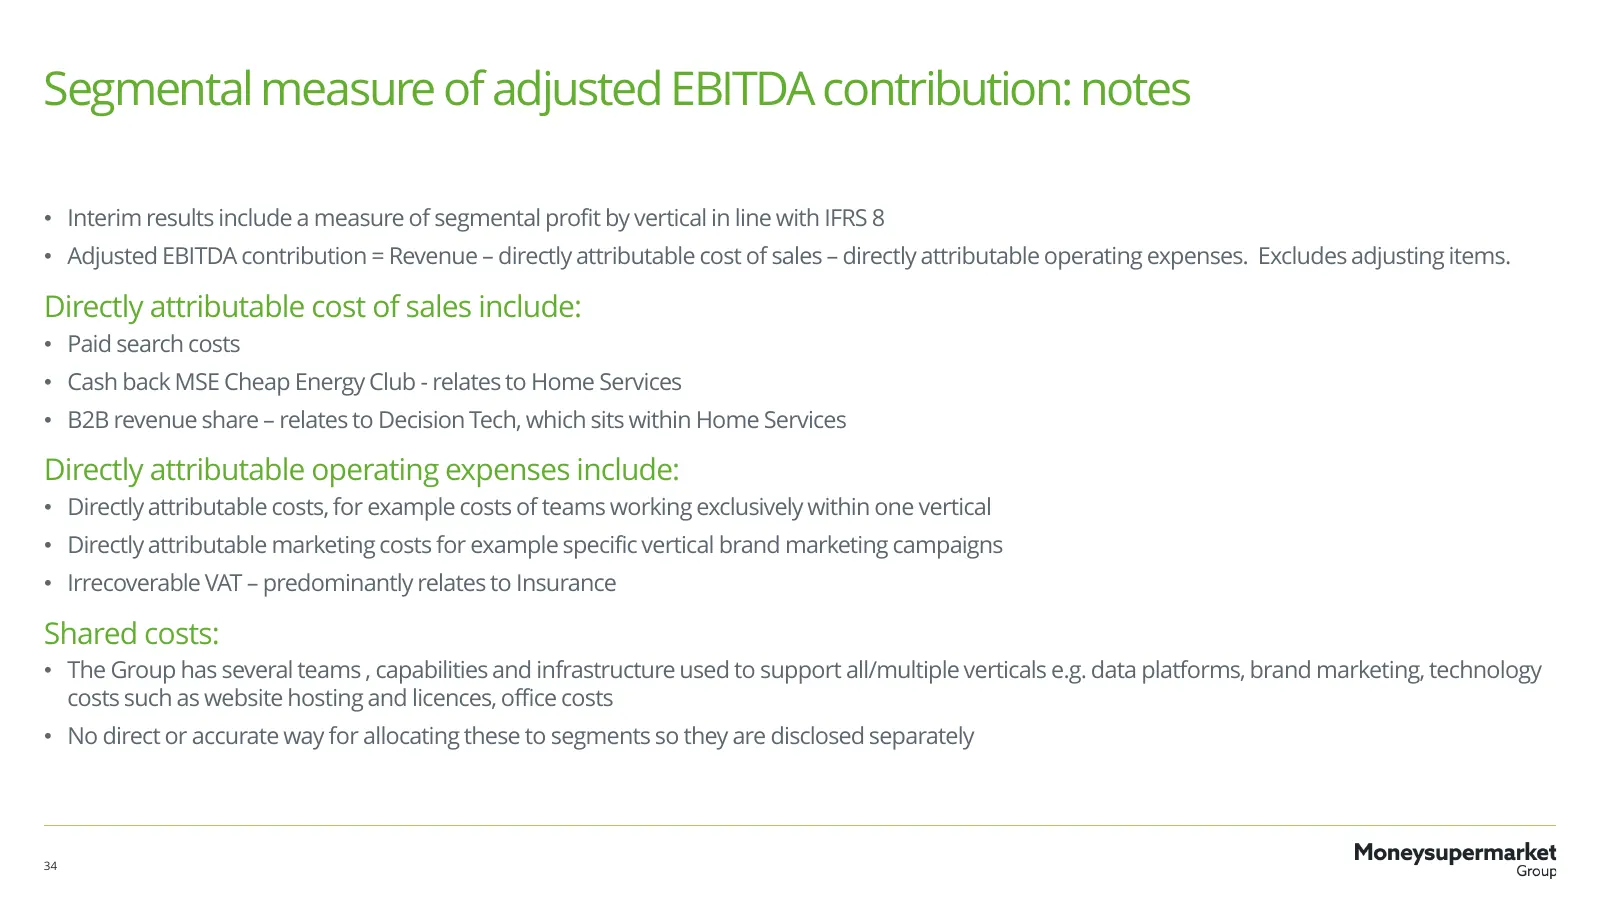
Segmental measure of adjusted EBITDA contribution: notes • Interim results include a measure of segmental profit by vertical in line with IFRS 8 • Adjusted EBITDA contribution = Revenue – directly attributable cost of sales – directly attributable operating expenses. Excludes adjusting items. Direct
Slide 35: Segmental measure of adjusted EBITDA contribution
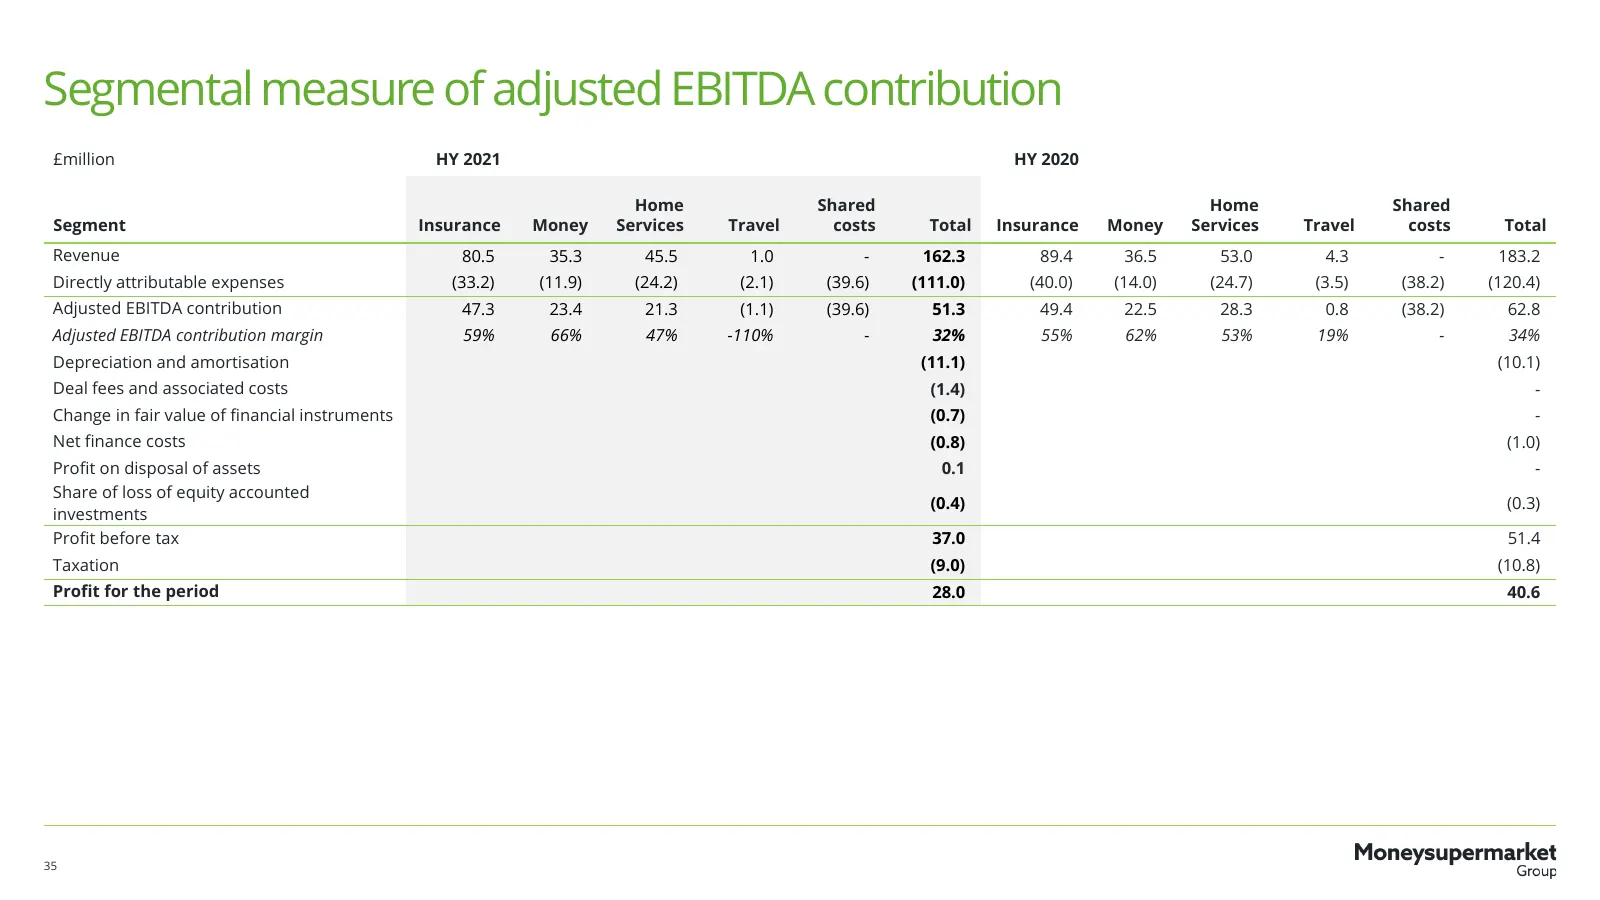
Segmental measure of adjusted EBITDA contribution £million HY 2021 HY 2020 Home Shared Home Shared Segment Insurance Money Services Travel costs Total Insurance Money Services Travel costs Total Revenue 80.5 35.3 45.5 1.0 - 162.3 89.4 36.5 53.0 4.3 - 183.2 Directly attributable expenses (33.2) (11.9
Slide 36: Historical quarterly revenue under new segmental reporting
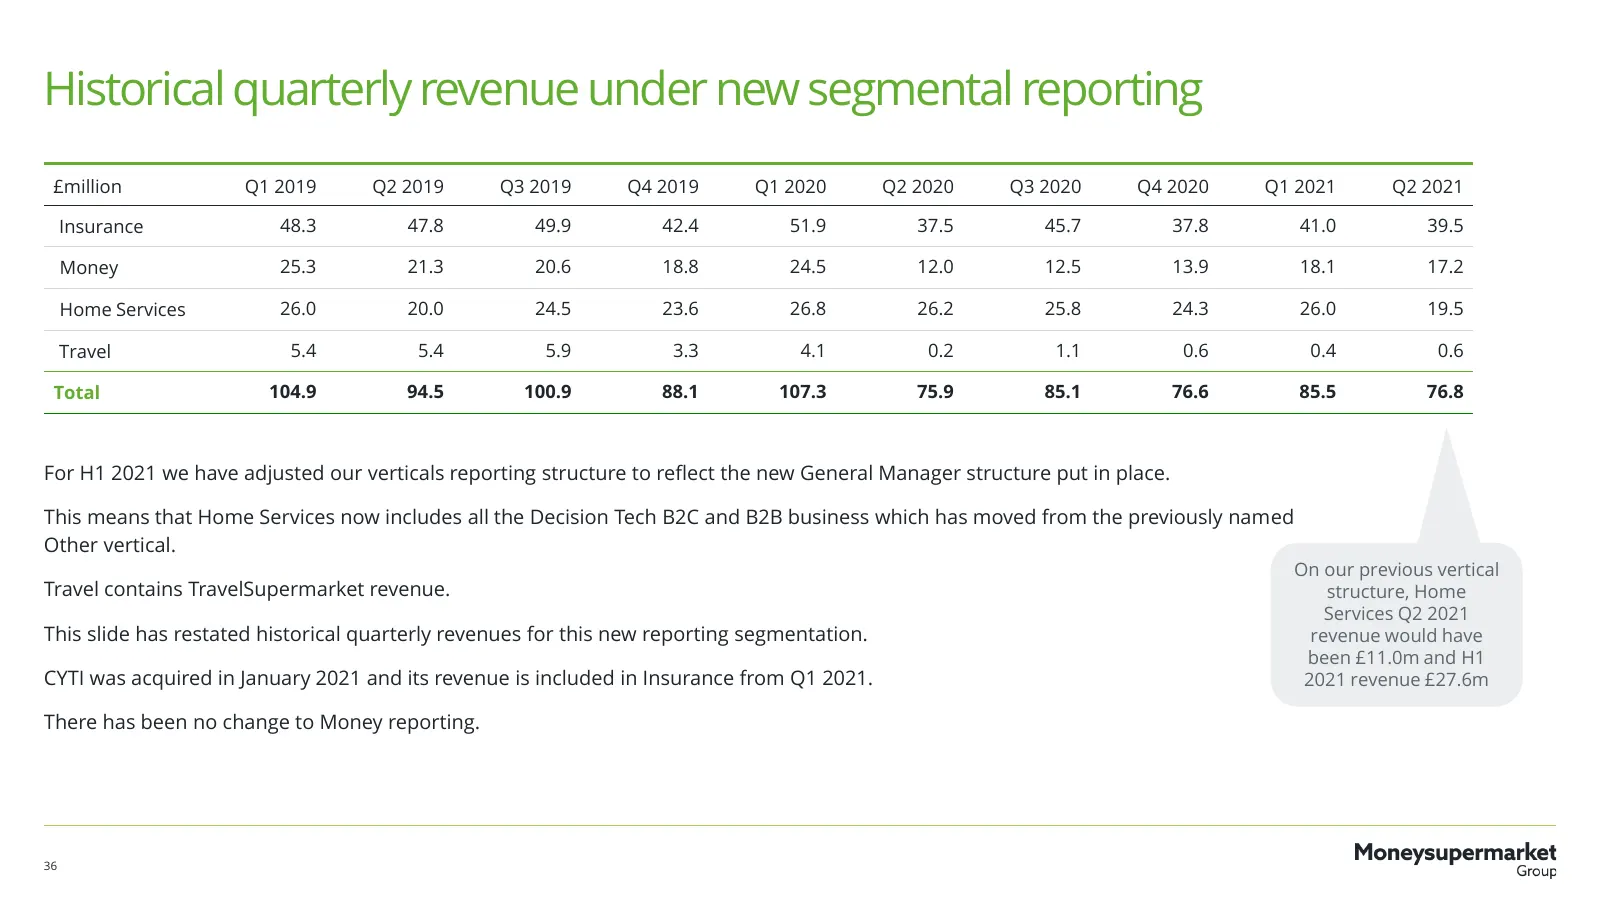
Historical quarterly revenue under new segmental reporting £million Q1 2019 Q2 2019 Q3 2019 Q4 2019 Q1 2020 Q2 2020 Q3 2020 Q4 2020 Q1 2021 Q2 2021 Insurance 48.3 47.8 49.9 42.4 51.9 37.5 45.7 37.8 41.0 39.5 Money 25.3 21.3 20.6 18.8 24.5 12.0 12.5 13.9 18.1 17.2 Home Services 26.0 20.0 24.5 23.6 26

Slide 37: Moneysupermarket Group
Moneysupermarket Group
Source: company website
More decks from Mony Group PLC
 H1 2026 Earnings Presentation32 slides · Jul 21, 2026
 FY2025 Earnings Presentation34 slides · Feb 23, 2026
 H1 2025 Earnings Presentation33 slides · Jul 21, 2025
 FY2024 Earnings Presentation33 slides · Feb 17, 2025
 H1 2024 Earnings Presentation34 slides · Jul 22, 2024
 Moneysupermarket Group — FY2023 Earnings Presentation33 slides · Feb 19, 2024