Quanterix Corporation · NASDAQ:QTRX
Quanterix — Technical Presentation (October 2015)
20 slides from Quanterix's technical presentation, Oct 29, 2015
Slide 1: A Cytokine Assay Challenge: Sensitivity and Specificity
A Cytokine Assay Challenge: Sensitivity and Specificity Jane Ruppel, Genentech Proteins Powering NextGen Healthcare 29 October 2015
Slide 2: Outline
Outline Background: Purpose of study Analyte Key factors in assay development Assay characterization Summary 2 2
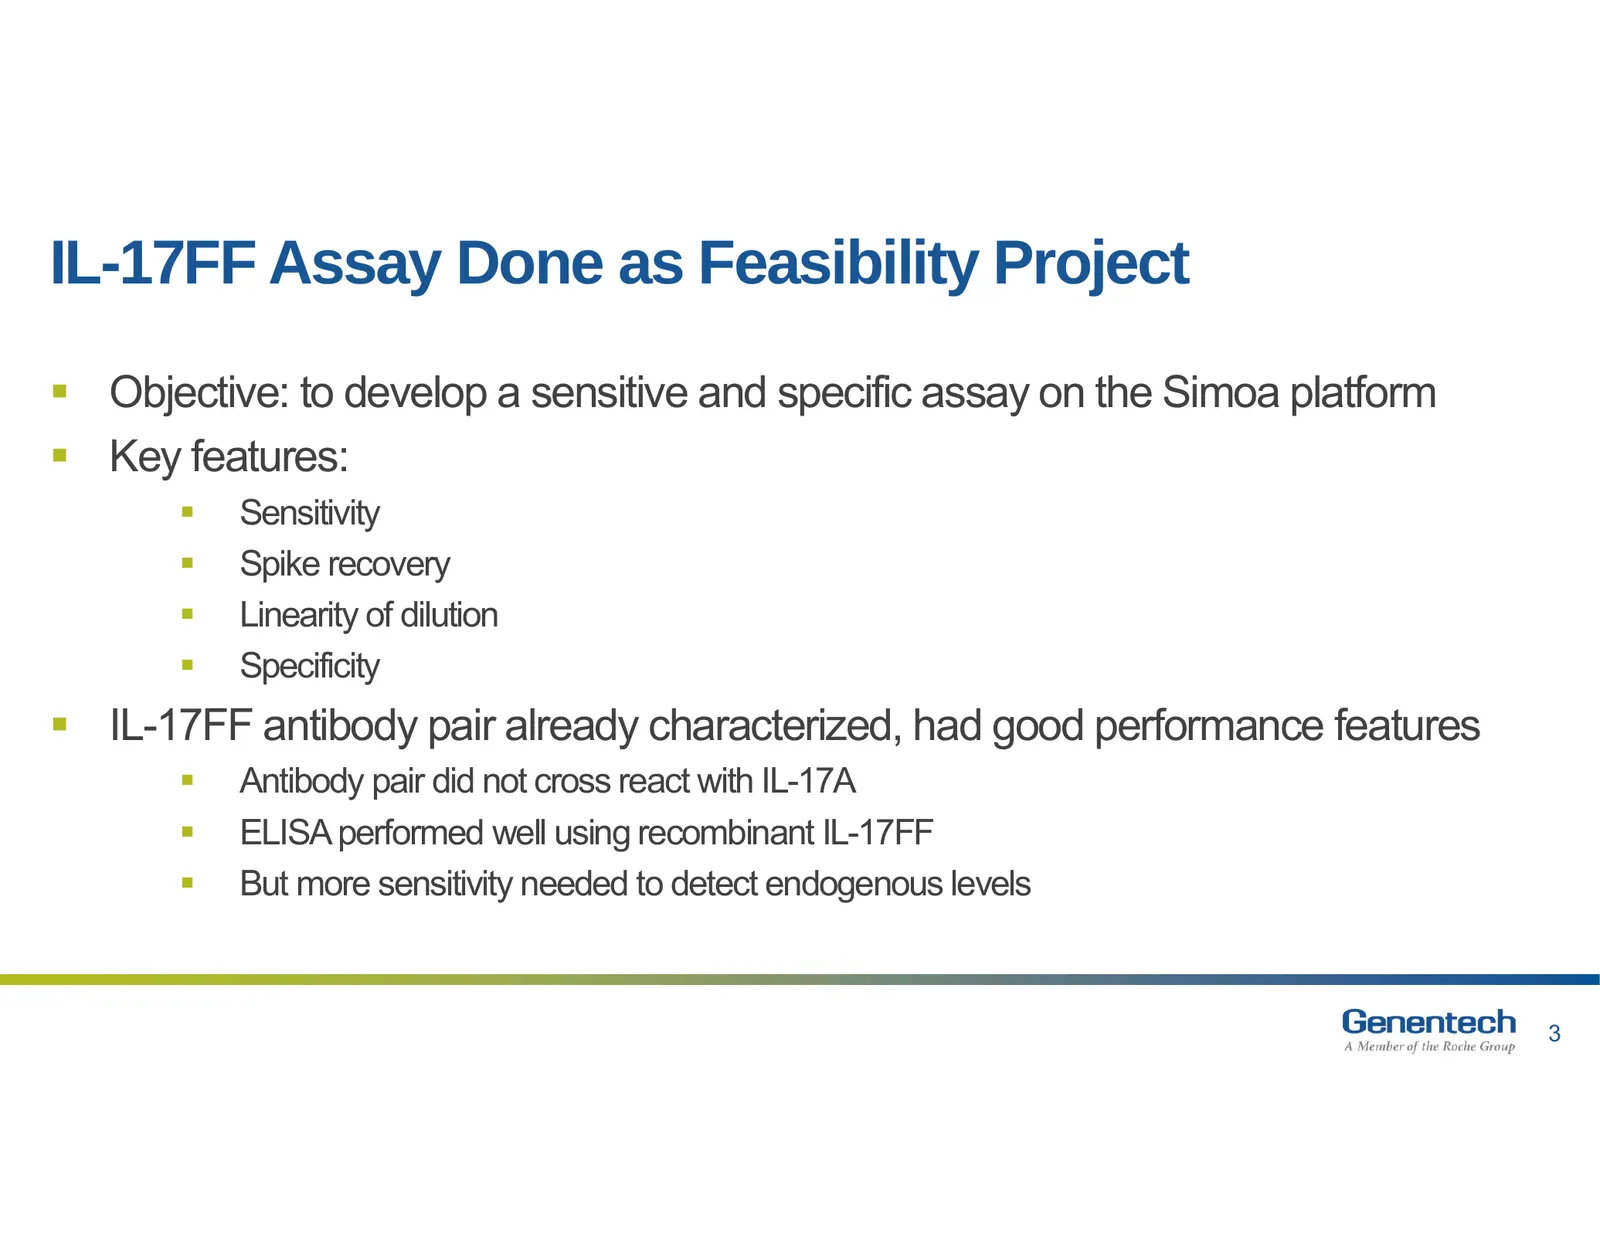
Slide 3: IL-17FF Assay Done as Feasibility Project
IL-17FF Assay Done as Feasibility Project Objective: to develop a sensitive and specific assay on the Simoa platform Key features: Sensitivity Spike recovery Linearity of dilution Specificity IL-17FF antibody pair already characterized, had good performance features Antibody pair did
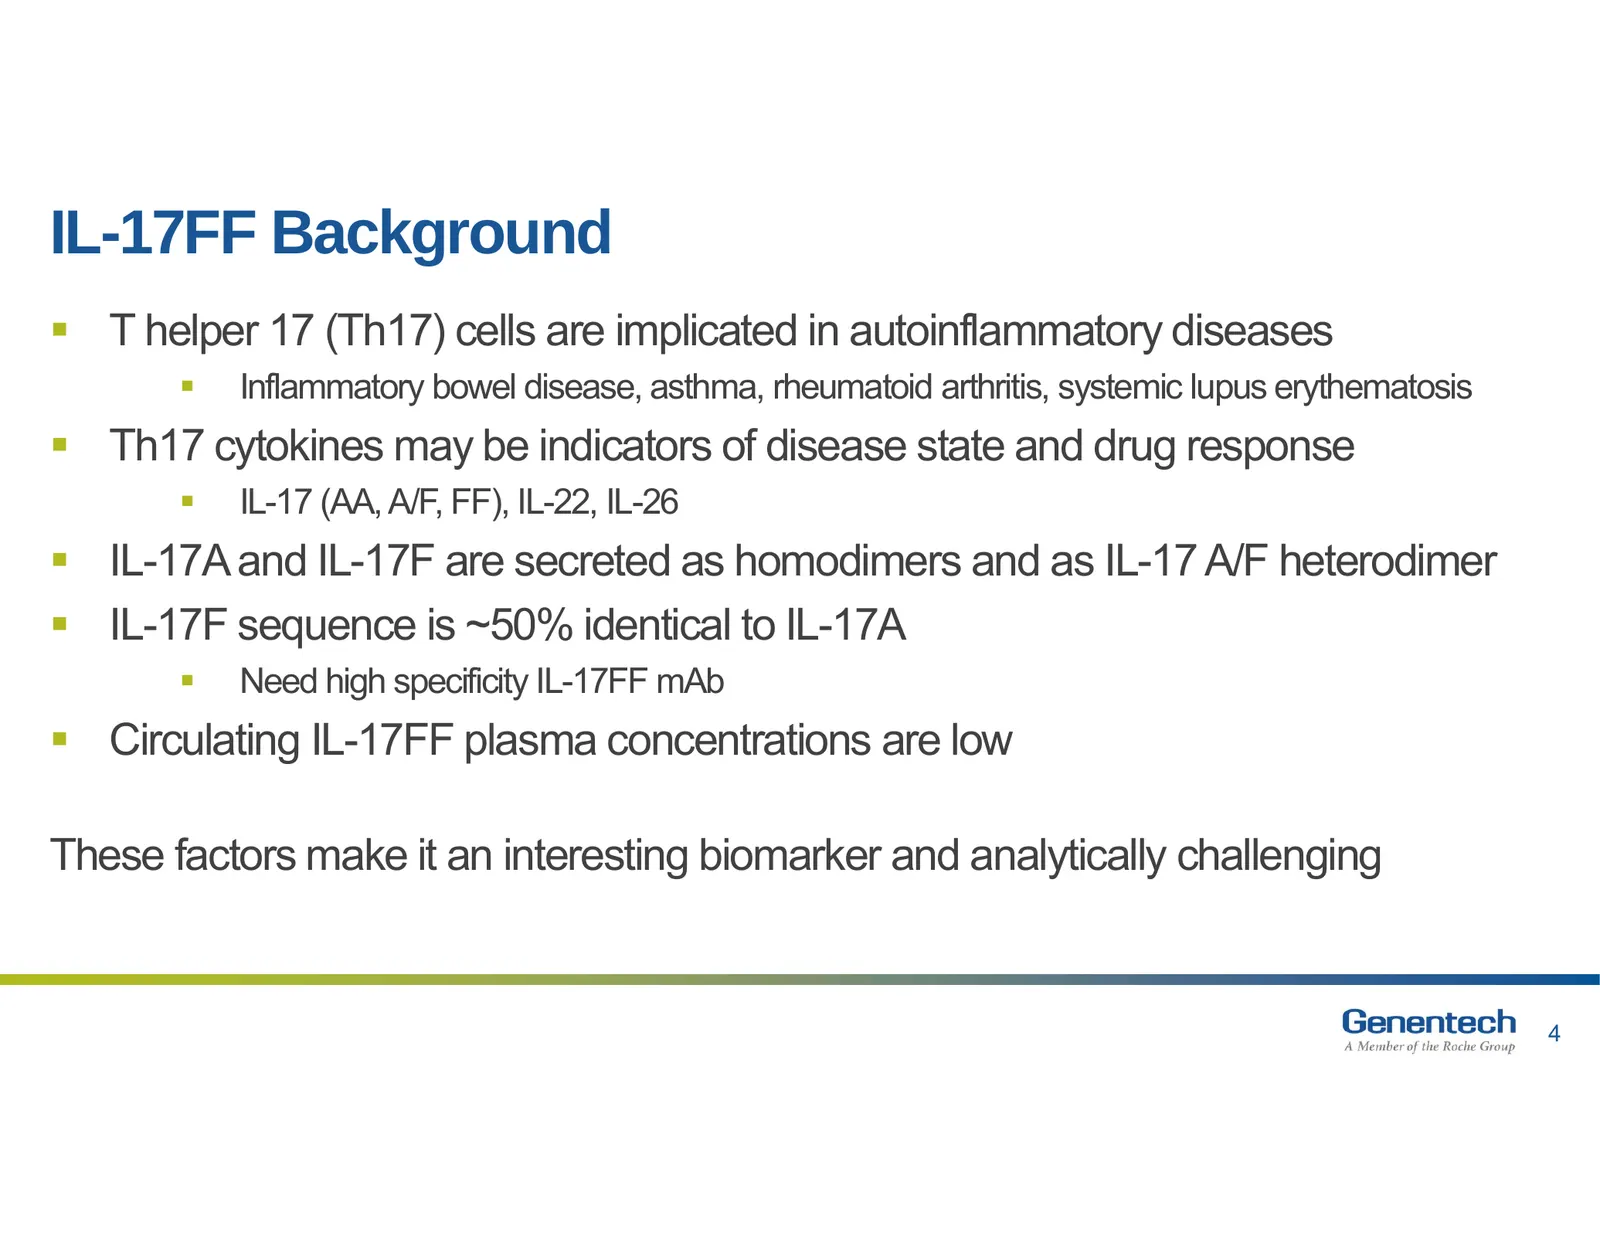
Slide 4: IL-17FF Background
IL-17FF Background T helper 17 (Th17) cells are implicated in autoinflammatory diseases Inflammatory bowel disease, asthma, rheumatoid arthritis, systemic lupus erythematosis Th17 cytokines may be indicators of disease state and drug response IL-17 (AA, A/F, FF), IL-22, IL-26 IL-17A and IL
Slide 5: Assay Development Starting Point
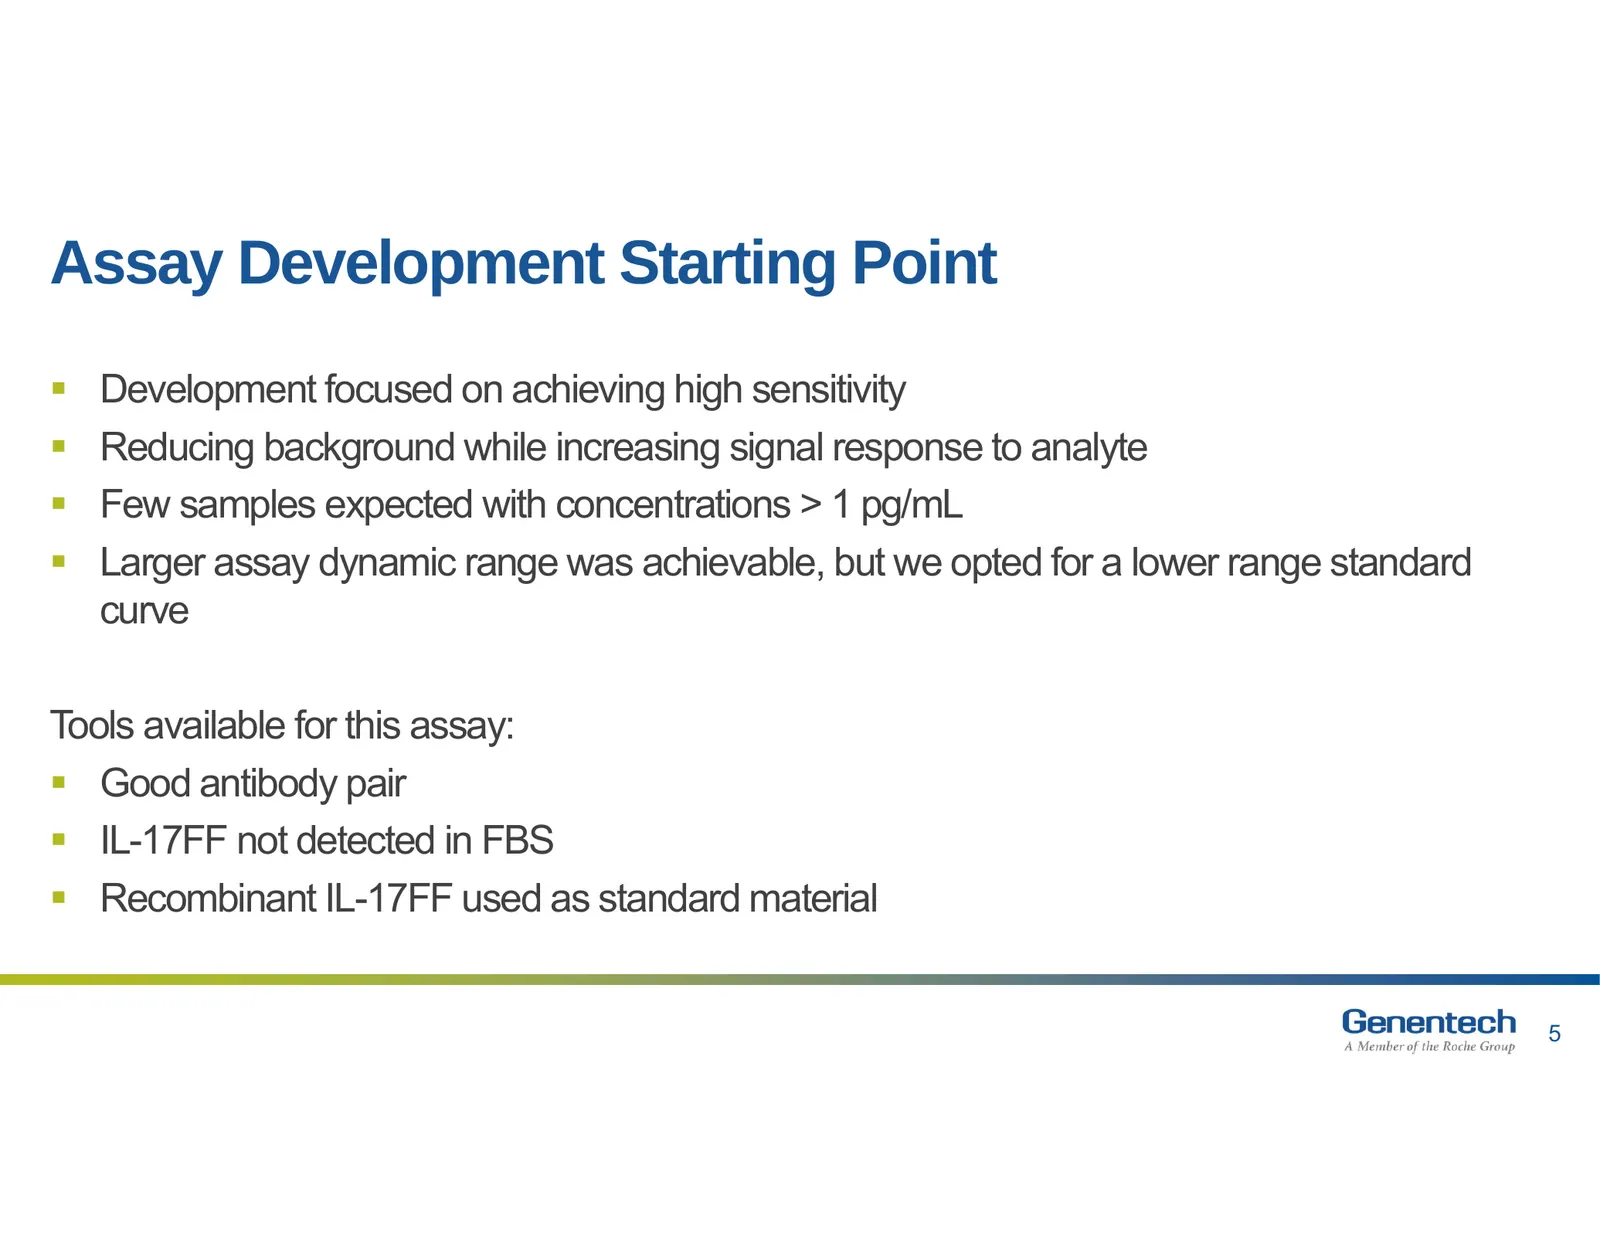
Assay Development Starting Point Development focused on achieving high sensitivity Reducing background while increasing signal response to analyte Few samples expected with concentrations > 1 pg/mL Larger assay dynamic range was achievable, but we opted for a lower range standard curve Tools
Slide 6: Diluent and Reagents Optimized for Sensitivity
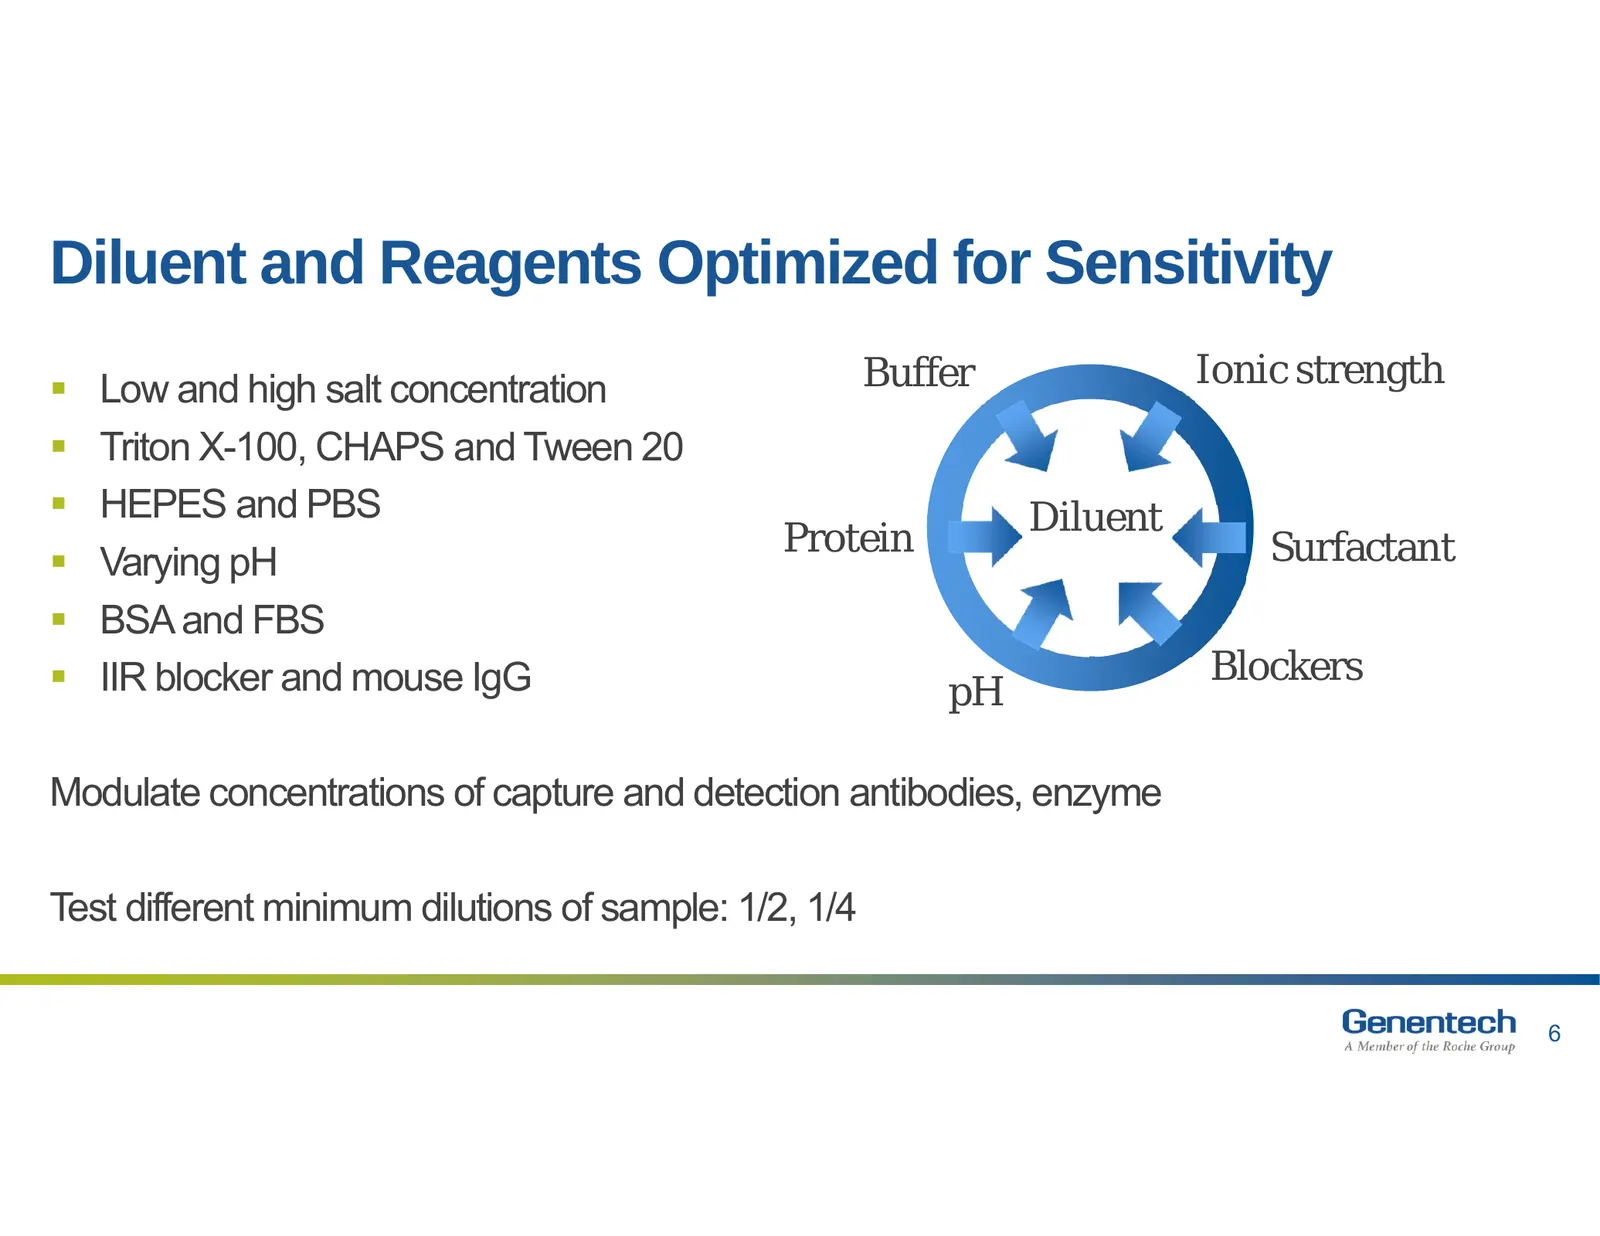
Diluent and Reagents Optimized for Sensitivity Low and high salt concentration Buffer Ionic strength Triton X-100, CHAPS and Tween 20 HEPES and PBS Diluent Protein Surfactant Varying pH BSA and FBS IIR blocker and mouse IgG Blockers pH Modulate concentrations of capture and detection ant
Slide 7: Final IL17FF Assay Configuration
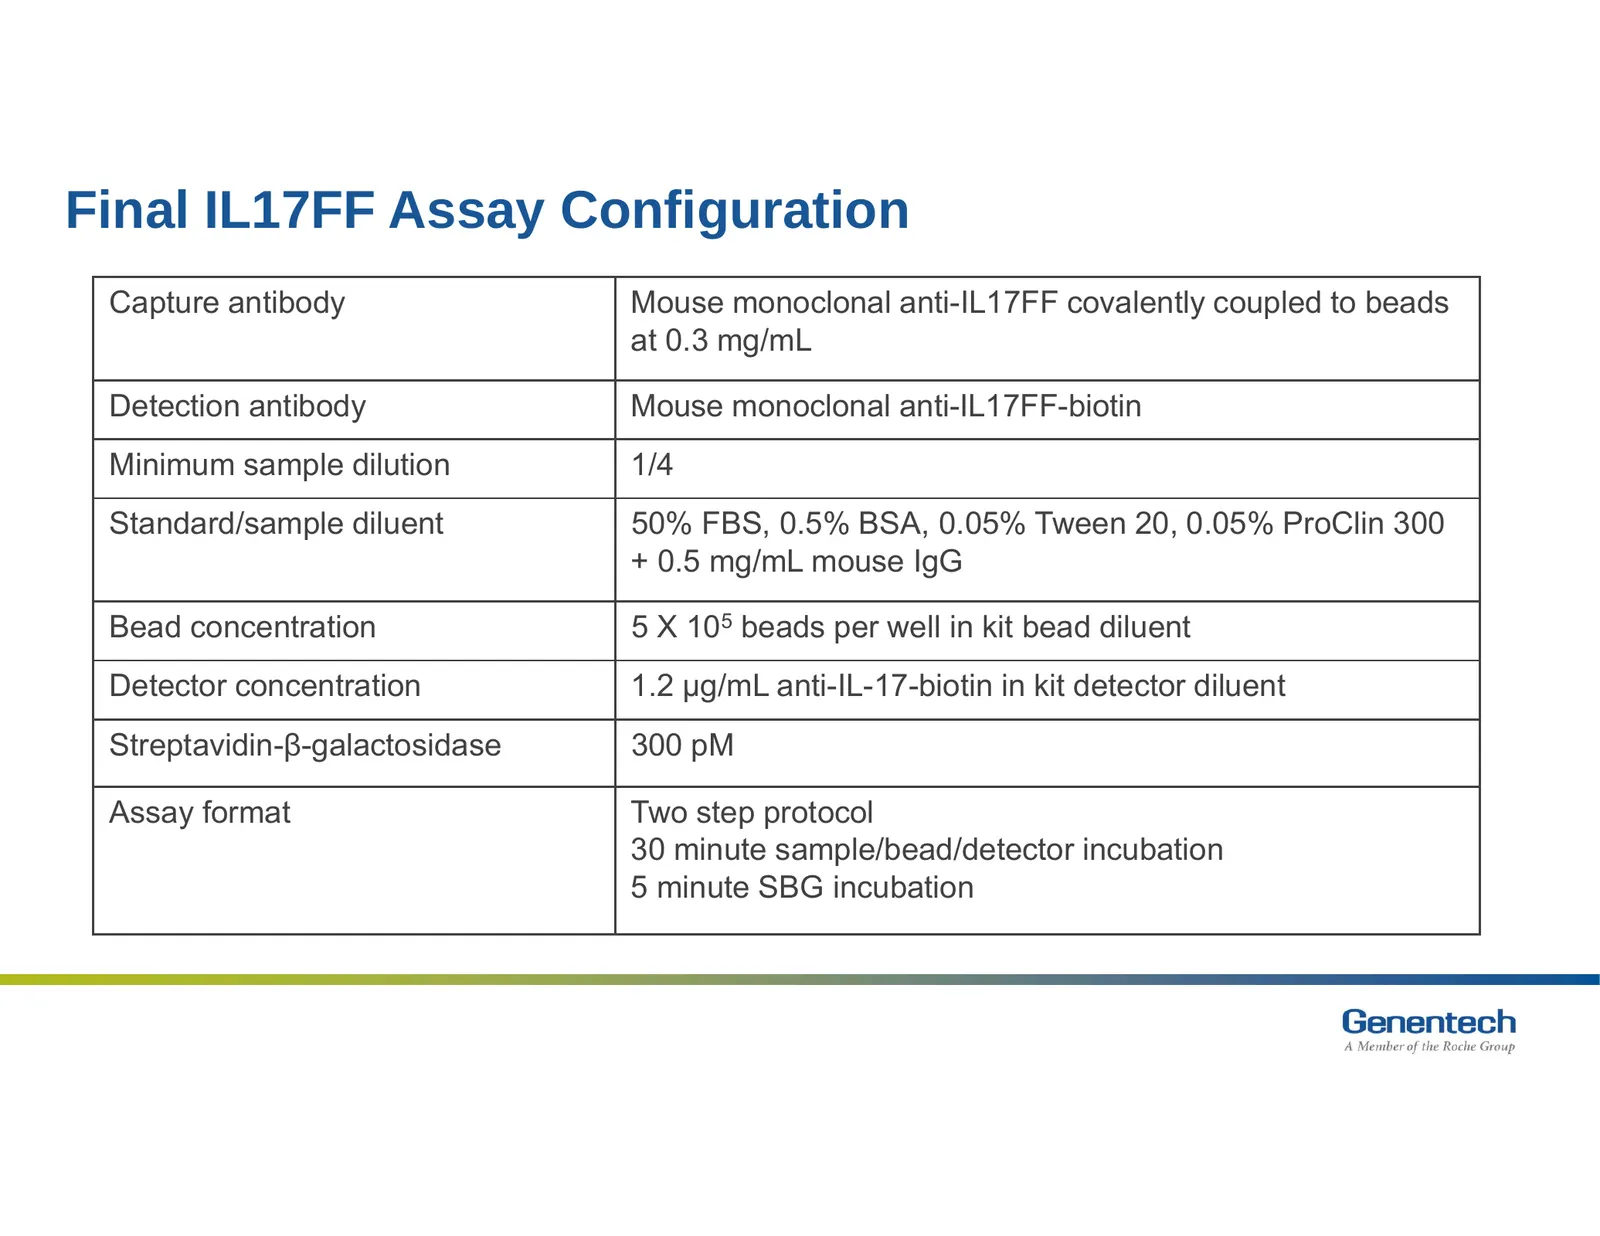
Final IL17FF Assay Configuration Capture antibody Mouse monoclonal anti-IL17FF covalently coupled to beads at 0.3 mg/mL Detection antibody Mouse monoclonal anti-IL17FF-biotin Minimum sample dilution 1/4 Standard/sample diluent 50% FBS, 0.5% BSA, 0.05% Tween 20, 0.05% ProClin 300 + 0.5 mg/mL mouse Ig
Slide 8: LLOQ of 0.02 pg/mL was Achieved Based on Variability of Standard
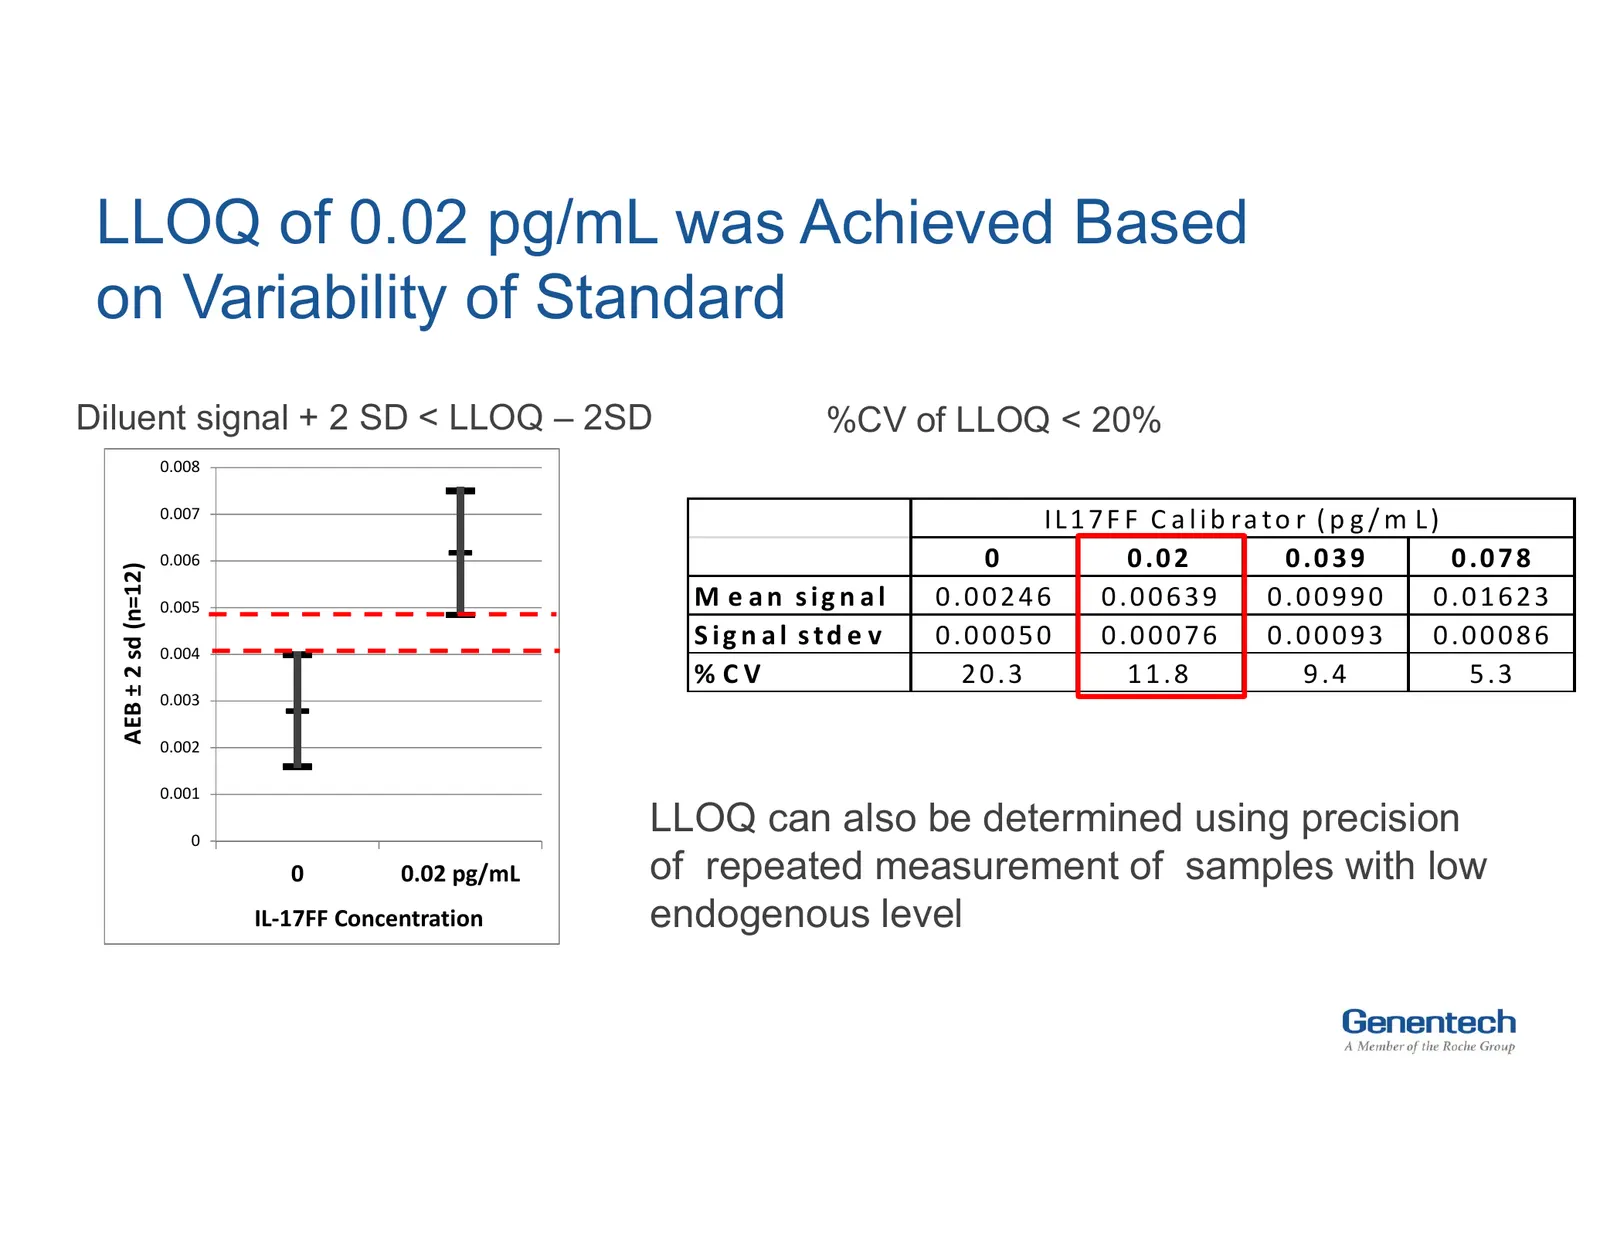
LLOQ of 0.02 pg/mL was Achieved Based on Variability of Standard Diluent signal + 2 SD < LLOQ – 2SD %CV of LLOQ < 20% 0.008 0.007 I L 1 7 F F C a l i b ra t o r ( p g / m L ) 0.006 0 0 .0 2 0 .0 3 9 0 .0 7 8 AEB ± 2 sd (n=12) 0.005 M e an sig n al 0.00246 0.00639 0.00990 0.01623 0.004 S ig n a l s t
Slide 9: Approaches for Spike Recovery
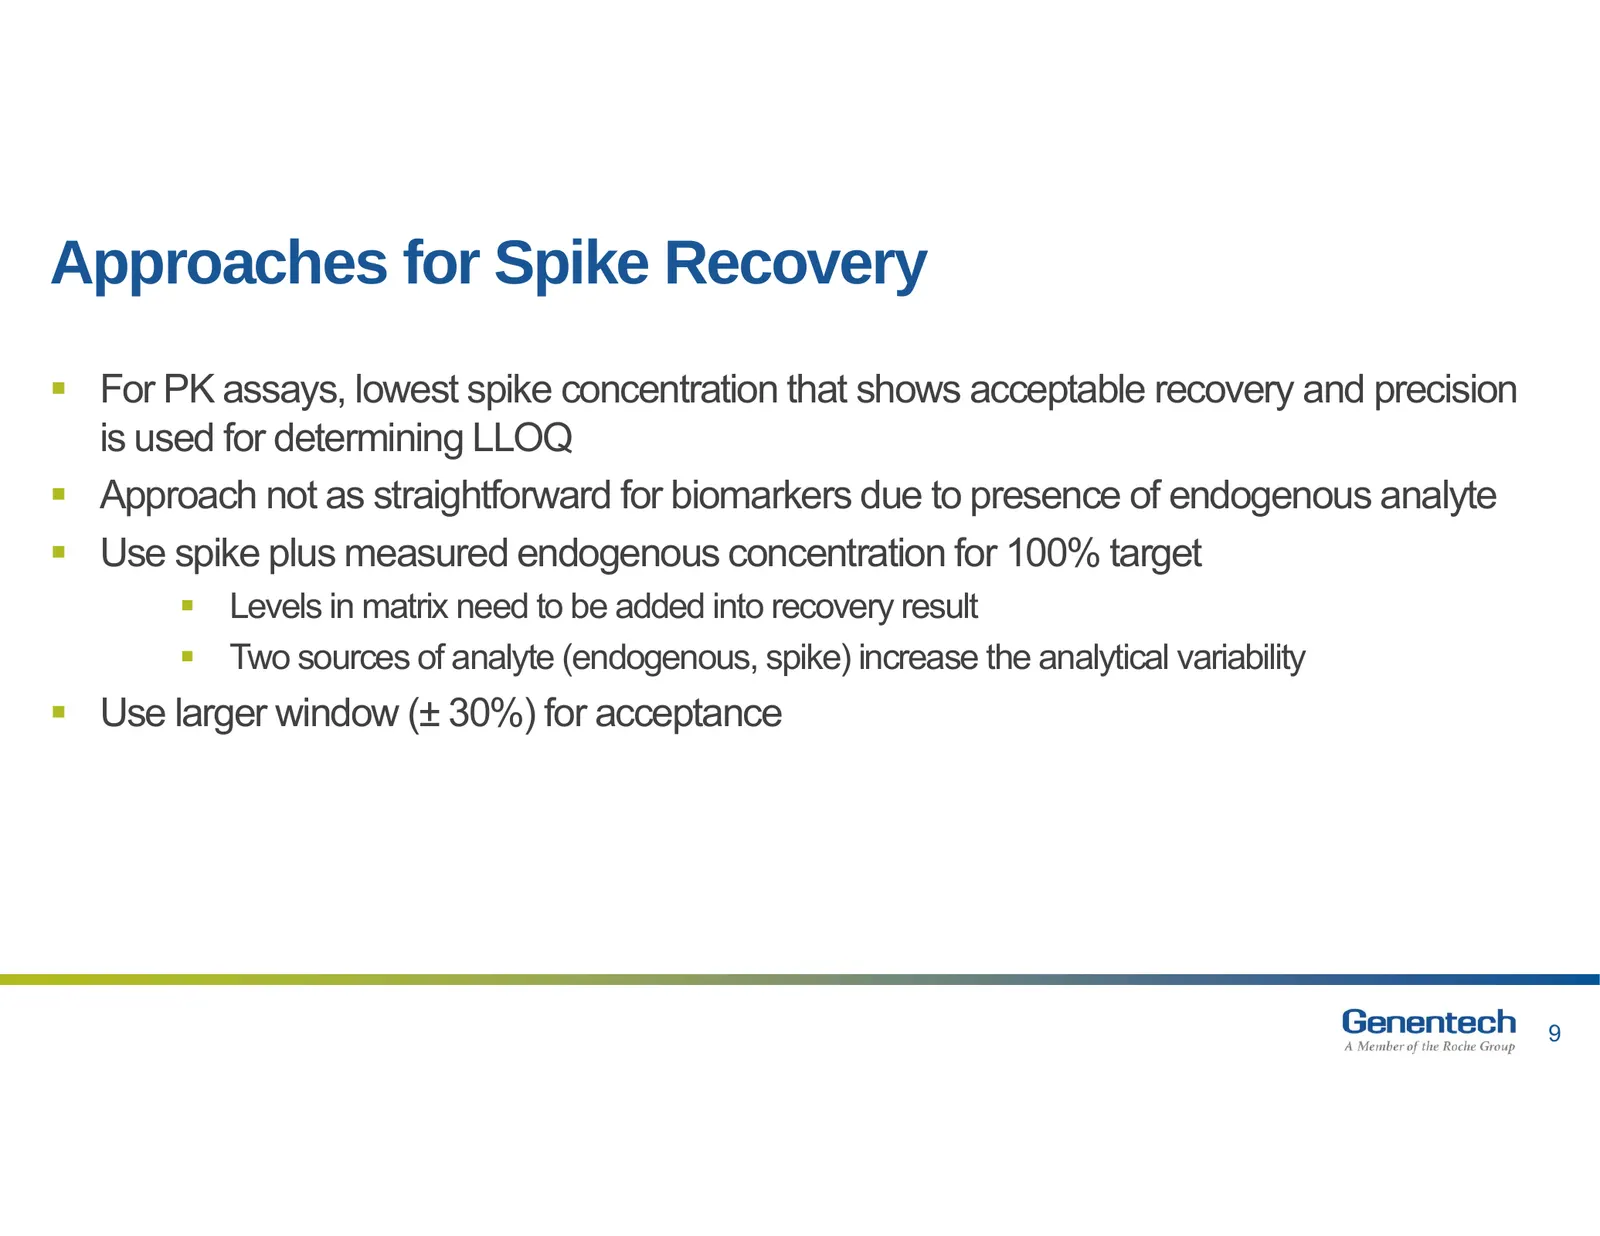
Approaches for Spike Recovery For PK assays, lowest spike concentration that shows acceptable recovery and precision is used for determining LLOQ Approach not as straightforward for biomarkers due to presence of endogenous analyte Use spike plus measured endogenous concentration for 100% targe
Slide 10: Spike Recovery Was Acceptable
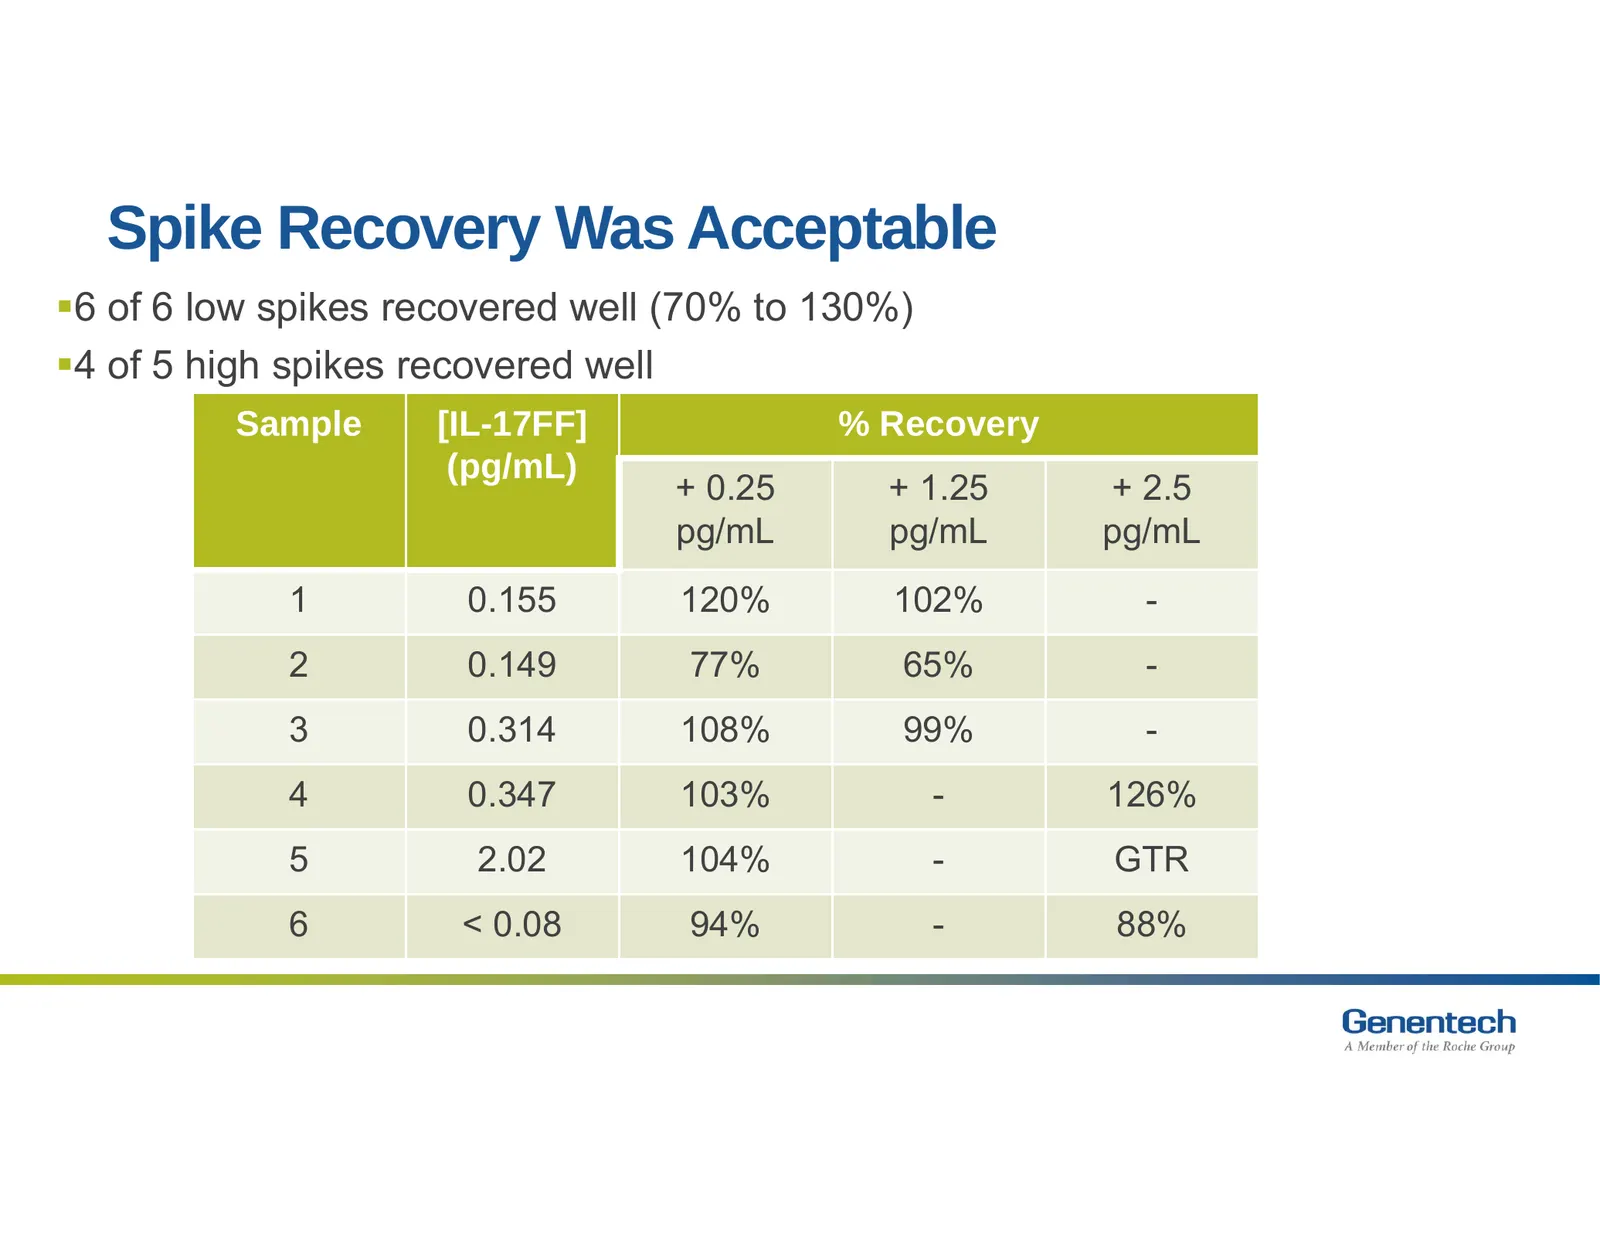
Spike Recovery Was Acceptable 6 of 6 low spikes recovered well (70% to 130%) 4 of 5 high spikes recovered well Sample [IL-17FF] % Recovery (pg/mL) + 0.25 + 1.25 + 2.5 pg/mL pg/mL pg/mL 1 0.155 120% 102% - 2 0.149 77% 65% - 3 * 0.314 108% 99% - 4 0.347 103% - 126% 5 2.02 104% - GTR 6 < 0.08 94% - 8
Slide 11: Linearity of Dilution of Endogenous Human Serum Samples was Acceptable
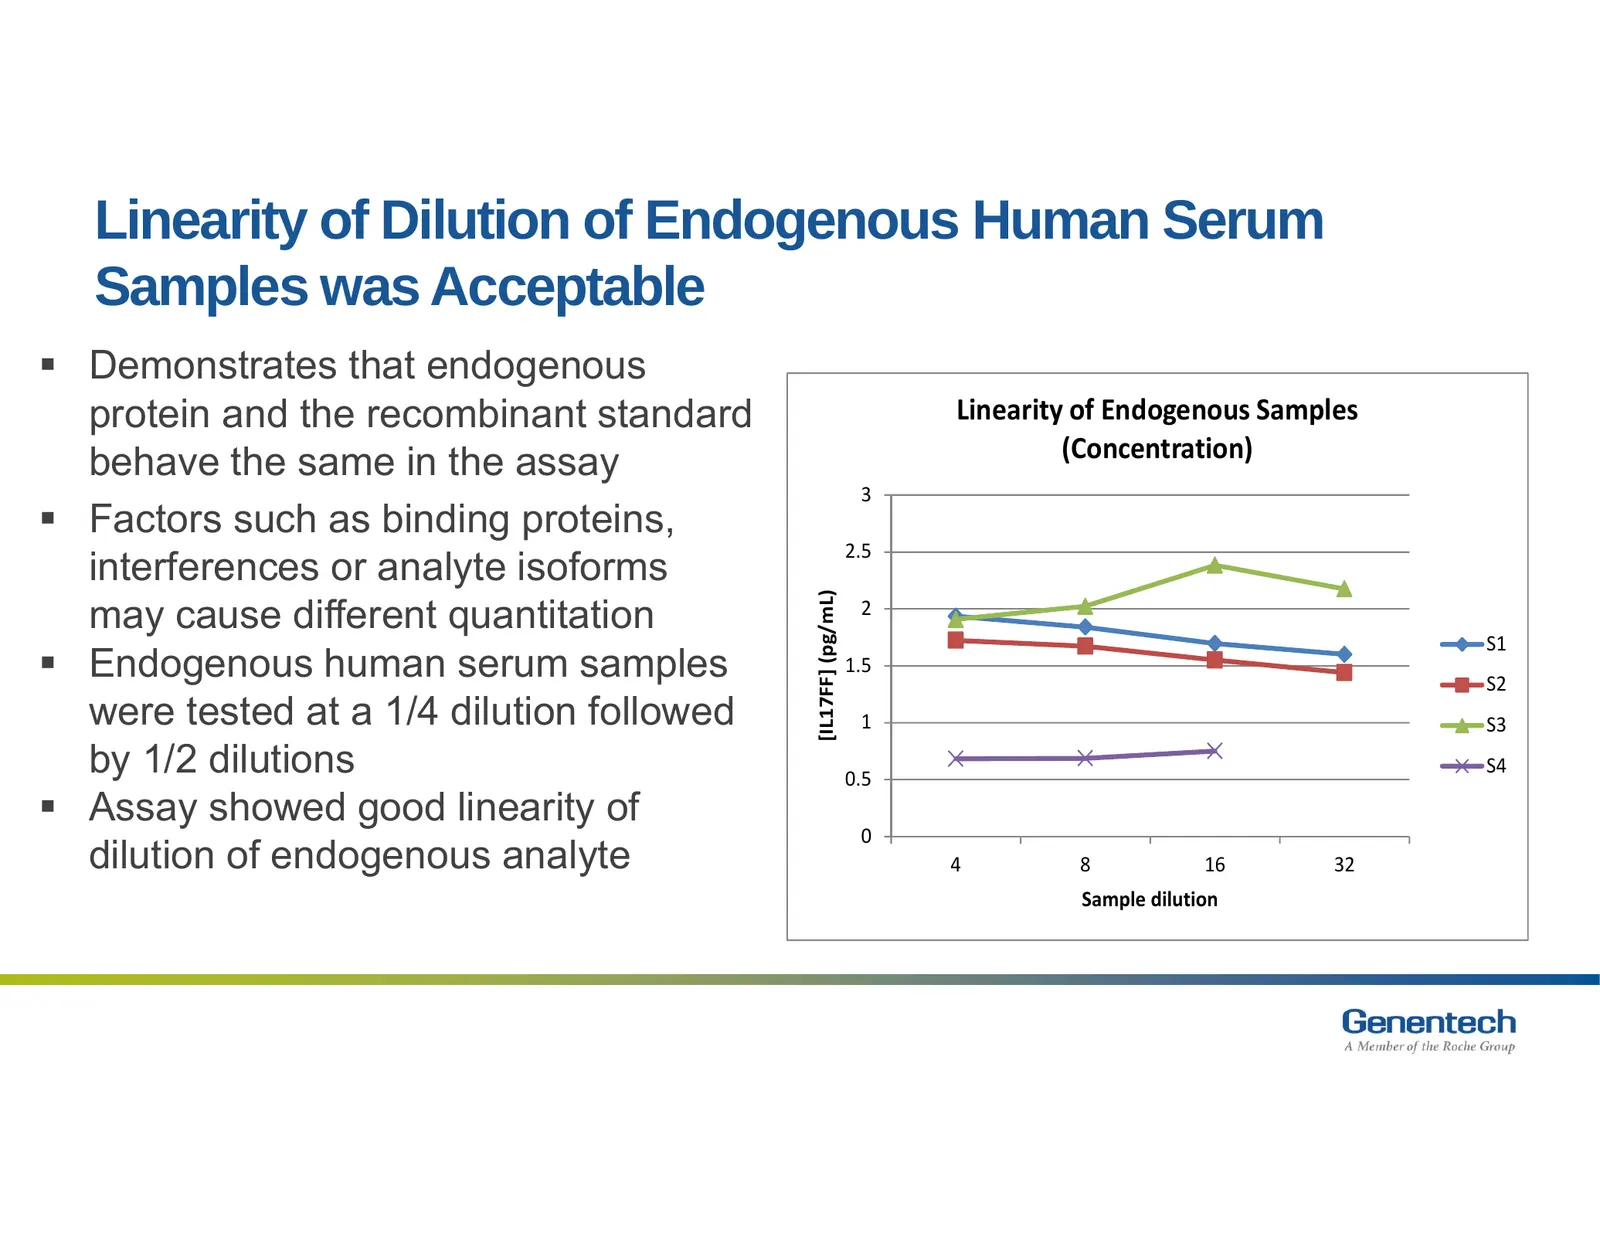
Linearity of Dilution of Endogenous Human Serum Samples was Acceptable Demonstrates that endogenous protein and the recombinant standard Linearity of Endogenous Samples (Concentration) behave the same in the assay 3 Factors such as binding proteins, 2.5 interferences or analyte isoforms [IL17FF]
Slide 12: Is the Measurement Specific?
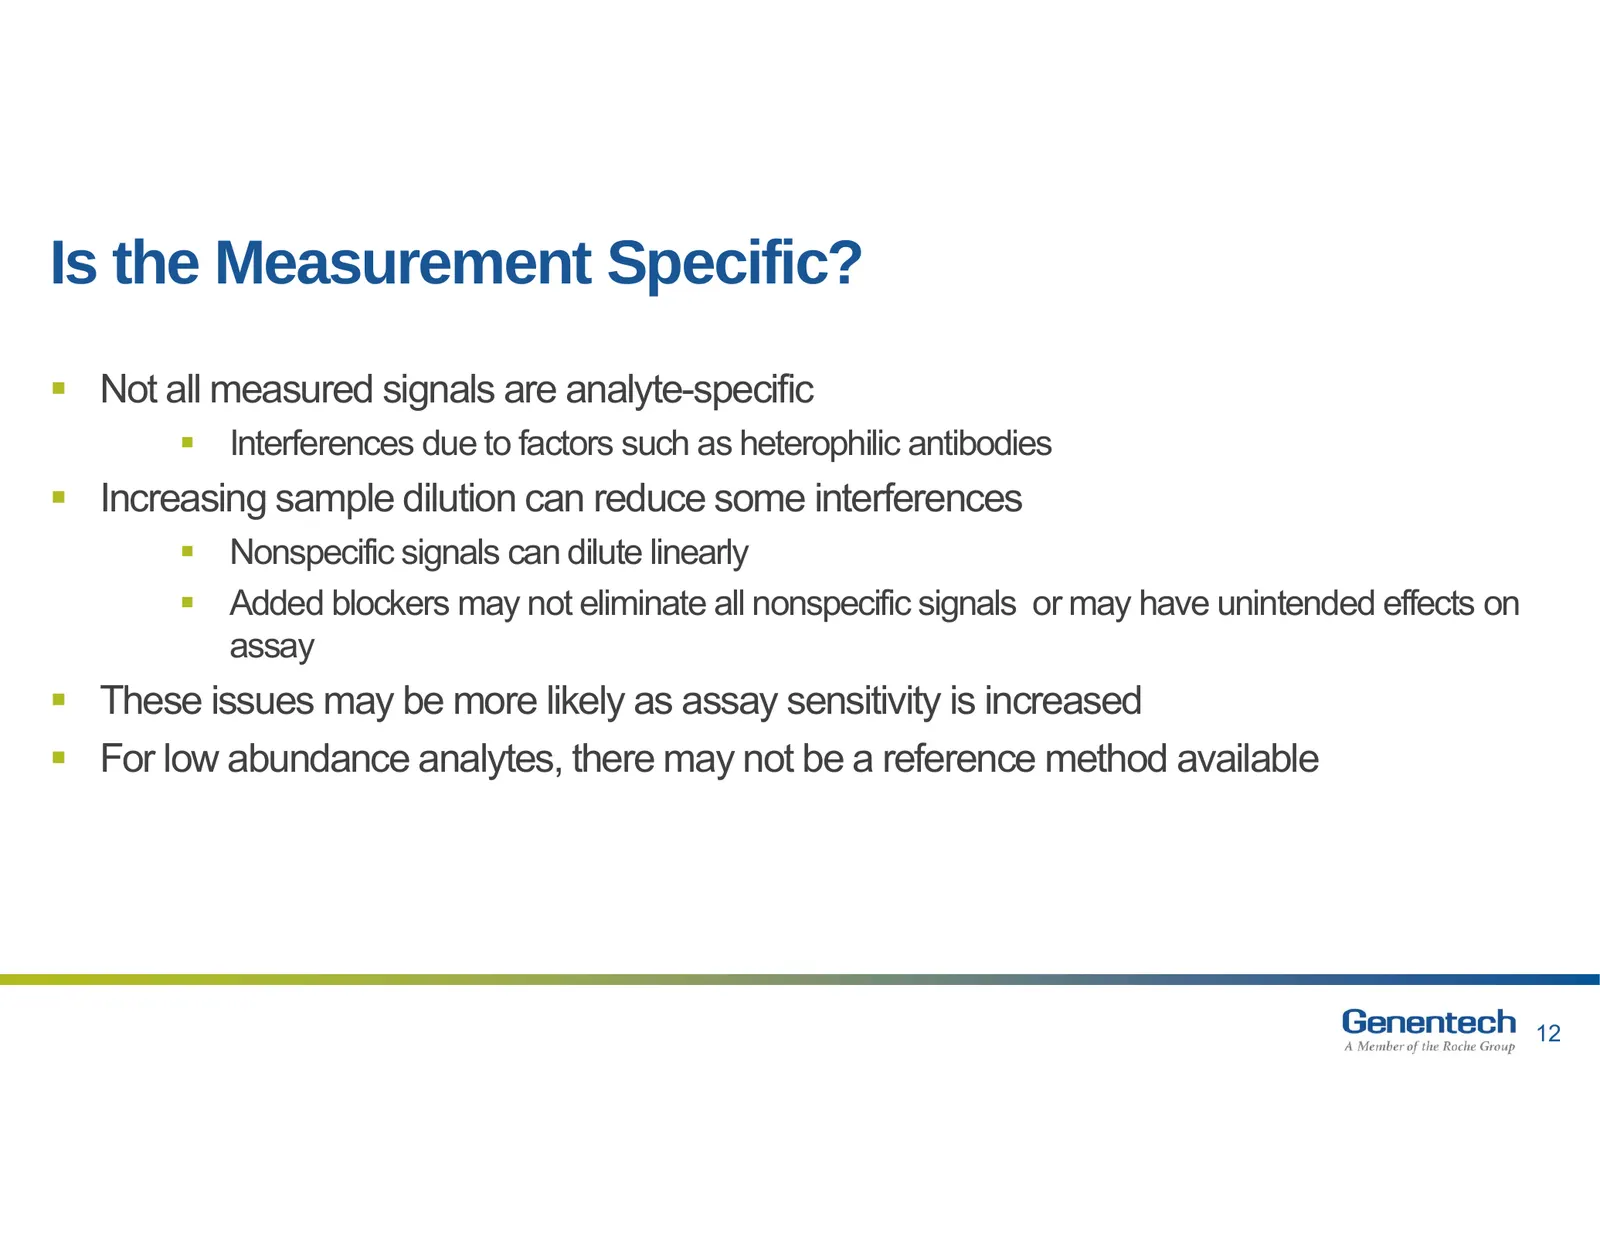
Is the Measurement Specific? Not all measured signals are analyte-specific Interferences due to factors such as heterophilic antibodies Increasing sample dilution can reduce some interferences Nonspecific signals can dilute linearly Added blockers may not eliminate all nonspecific signals
Slide 13: Some Methods for Testing Specificity
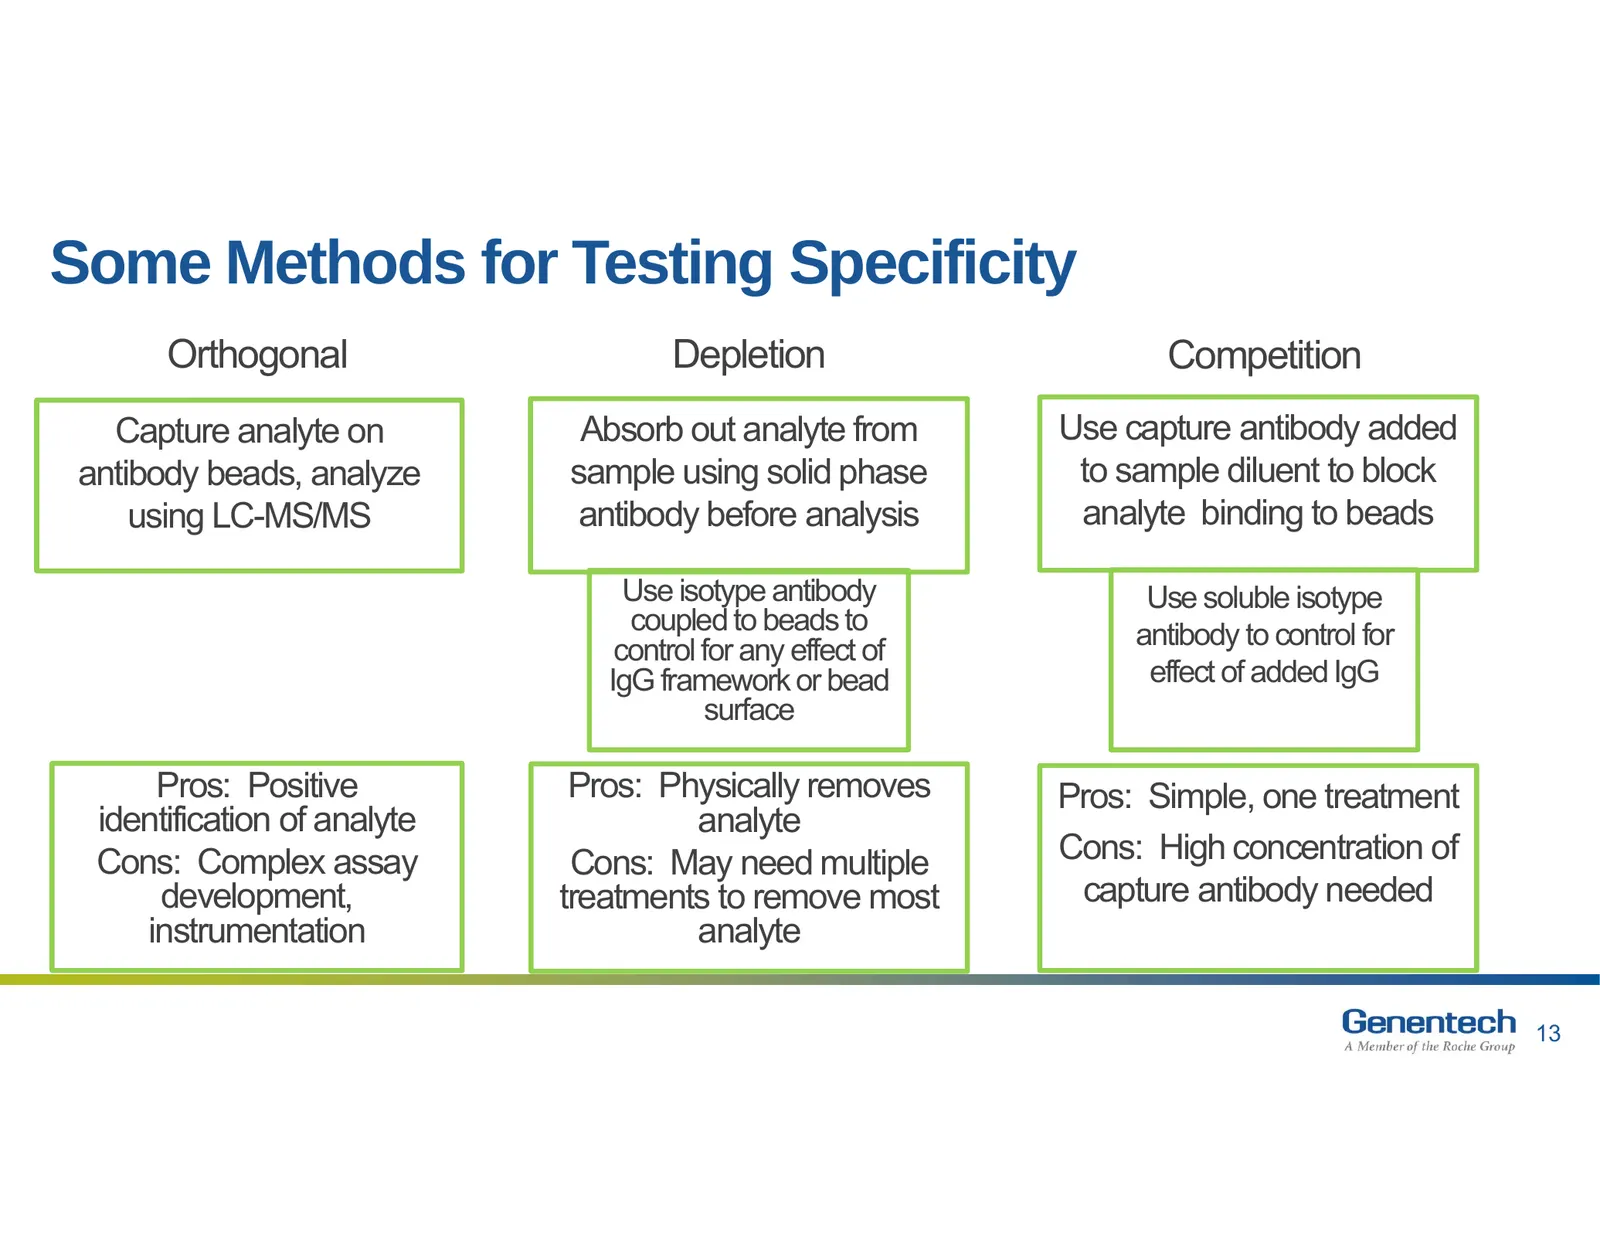
Some Methods for Testing Specificity Orthogonal Depletion Competition Capture analyte on Absorb out analyte from Use capture antibody added antibody beads, analyze sample using solid phase to sample diluent to block using LC-MS/MS antibody before analysis analyte binding to beads Use isotype antibod
Slide 14: Specificity Using Competition with Capture Antibody
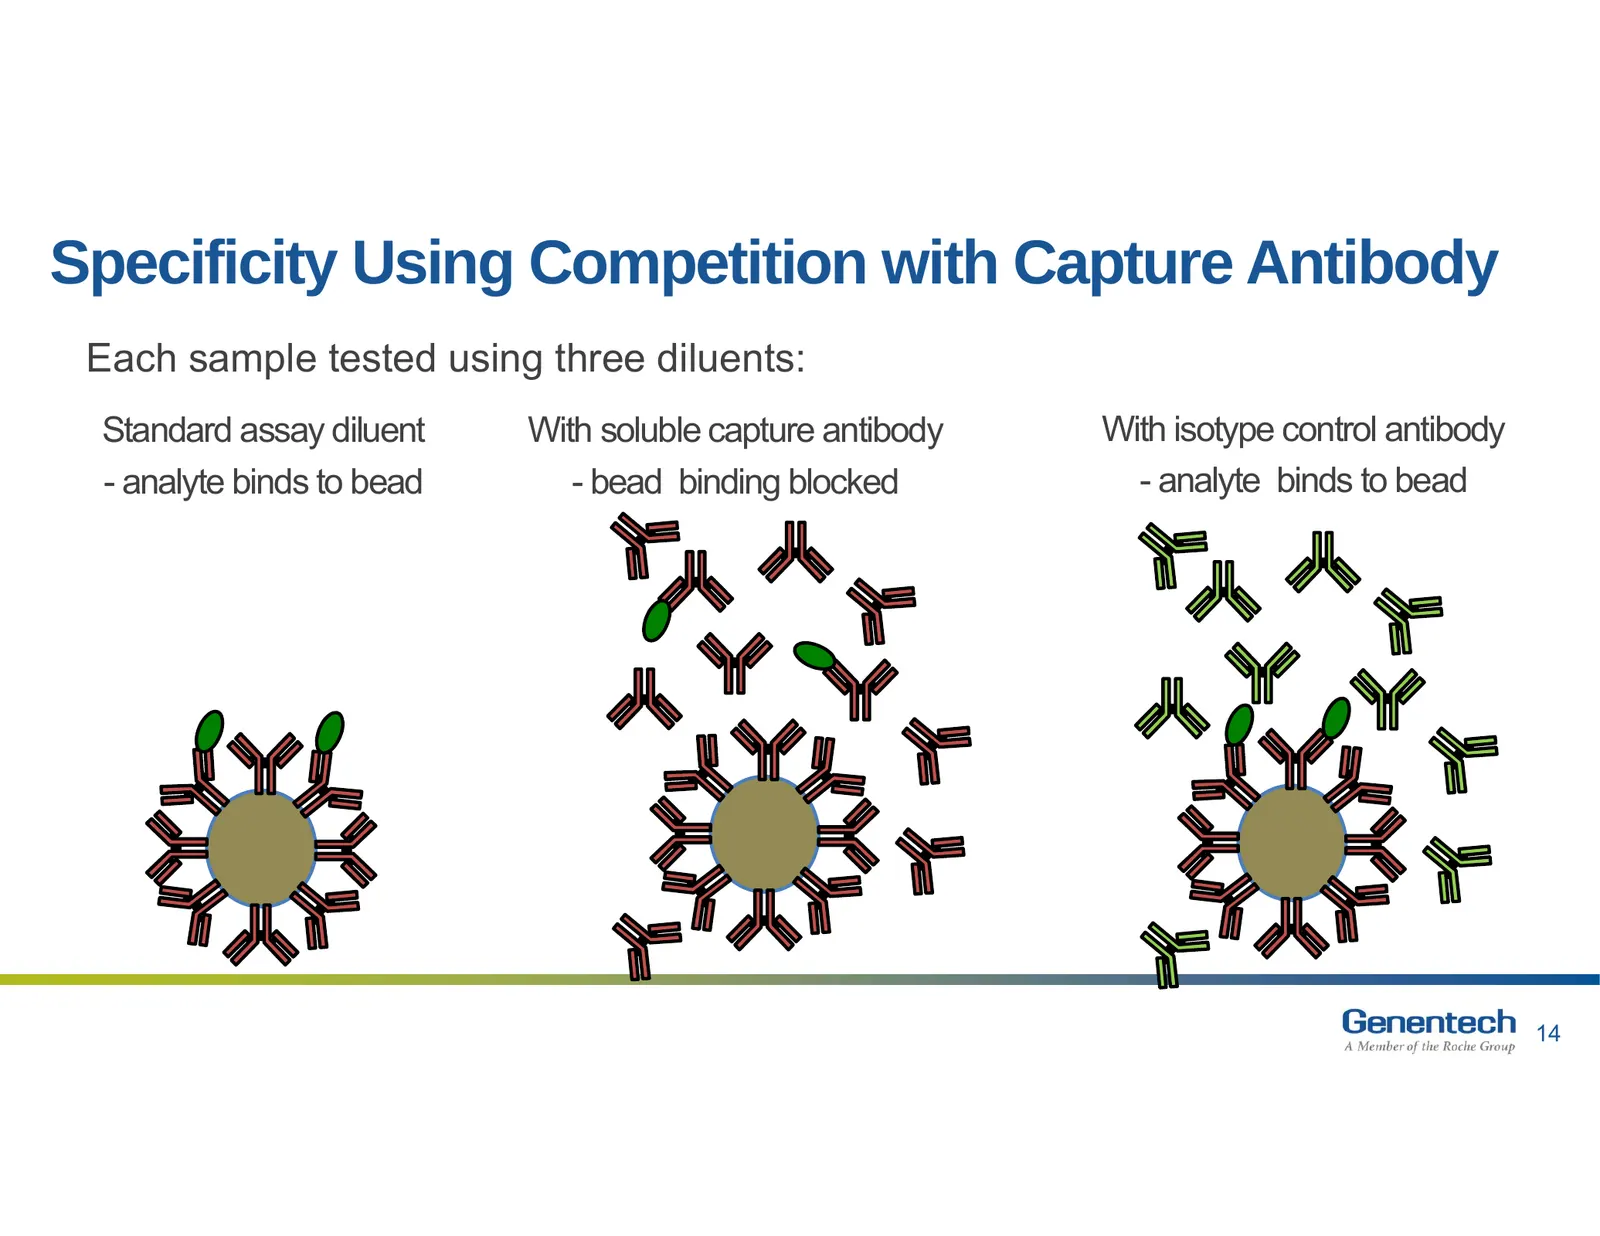
Specificity Using Competition with Capture Antibody Each sample tested using three diluents: Standard assay diluent With soluble capture antibody With isotype control antibody - analyte binds to bead - bead binding blocked - analyte binds to bead 14 14
Slide 15: Example of Specificity Issue in a Different Assay/Platform
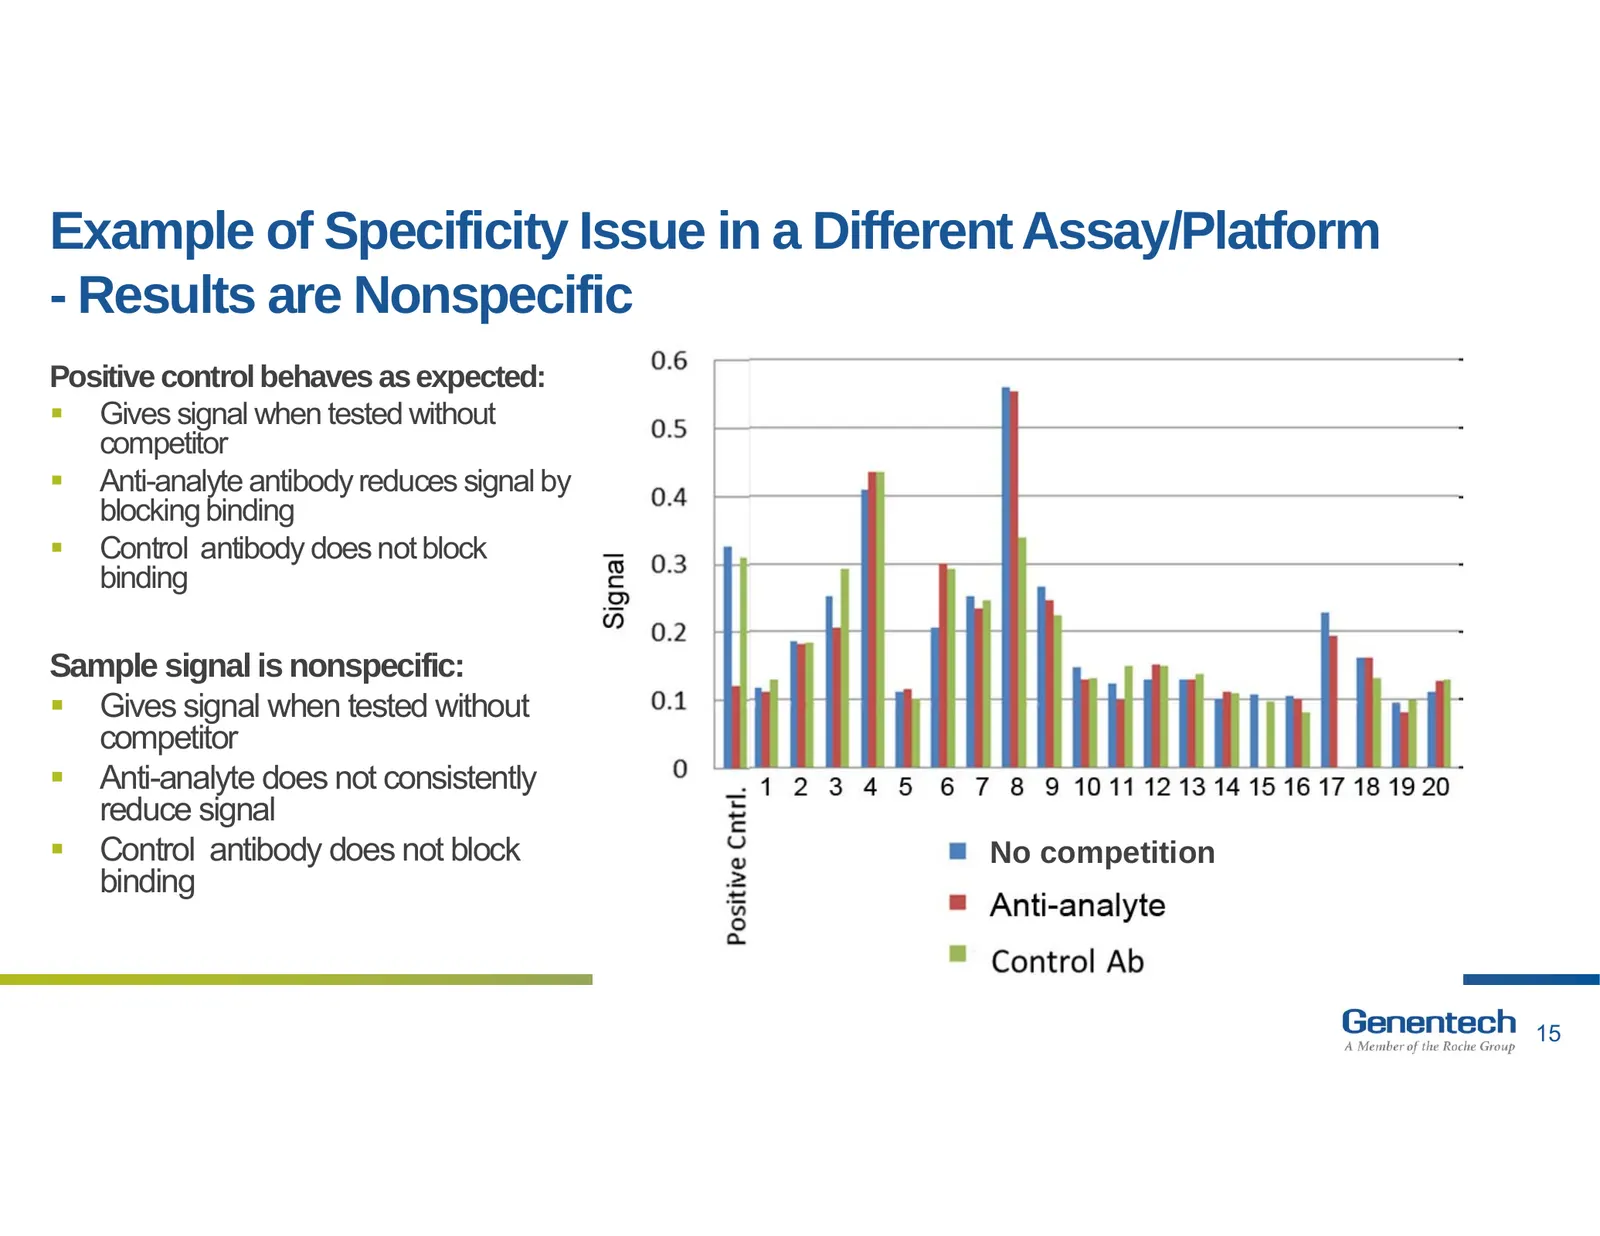
Example of Specificity Issue in a Different Assay/Platform - Results are Nonspecific Positive control behaves as expected: Gives signal when tested without competitor Anti-analyte antibody reduces signal by blocking binding Control antibody does not block binding Sample signal is nonspecific:
Slide 16: IL17FF Assay Specificity Was Acceptable
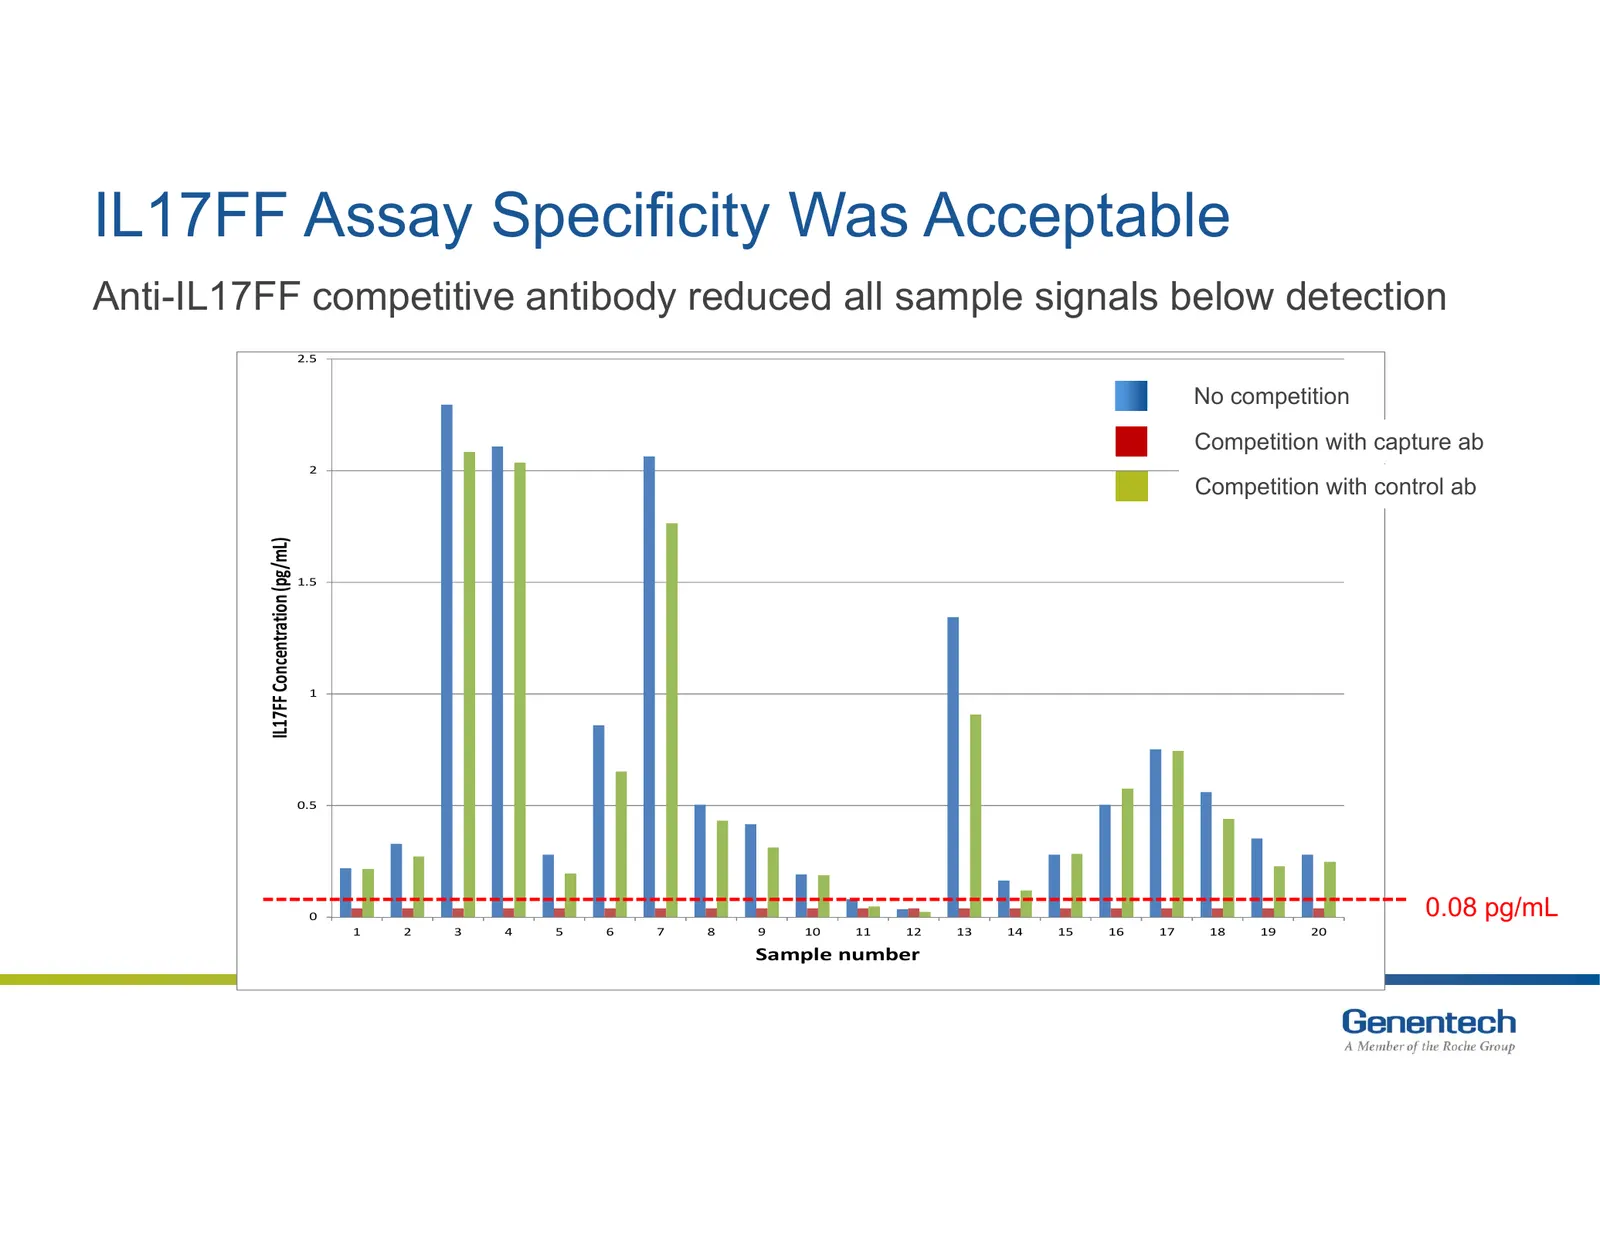
IL17FF Assay Specificity Was Acceptable Anti-IL17FF competitive antibody reduced all sample signals below detection 2.5 Sample With 9076 With isotype No competition Competition with capture ab 2 Competition with control ab IL17FF Concentration (pg/mL) 1.5 1 0.5 0 0.08 pg/mL 1 2 3 4 5 6 7 8 9 10 11 1
Slide 17: Summary
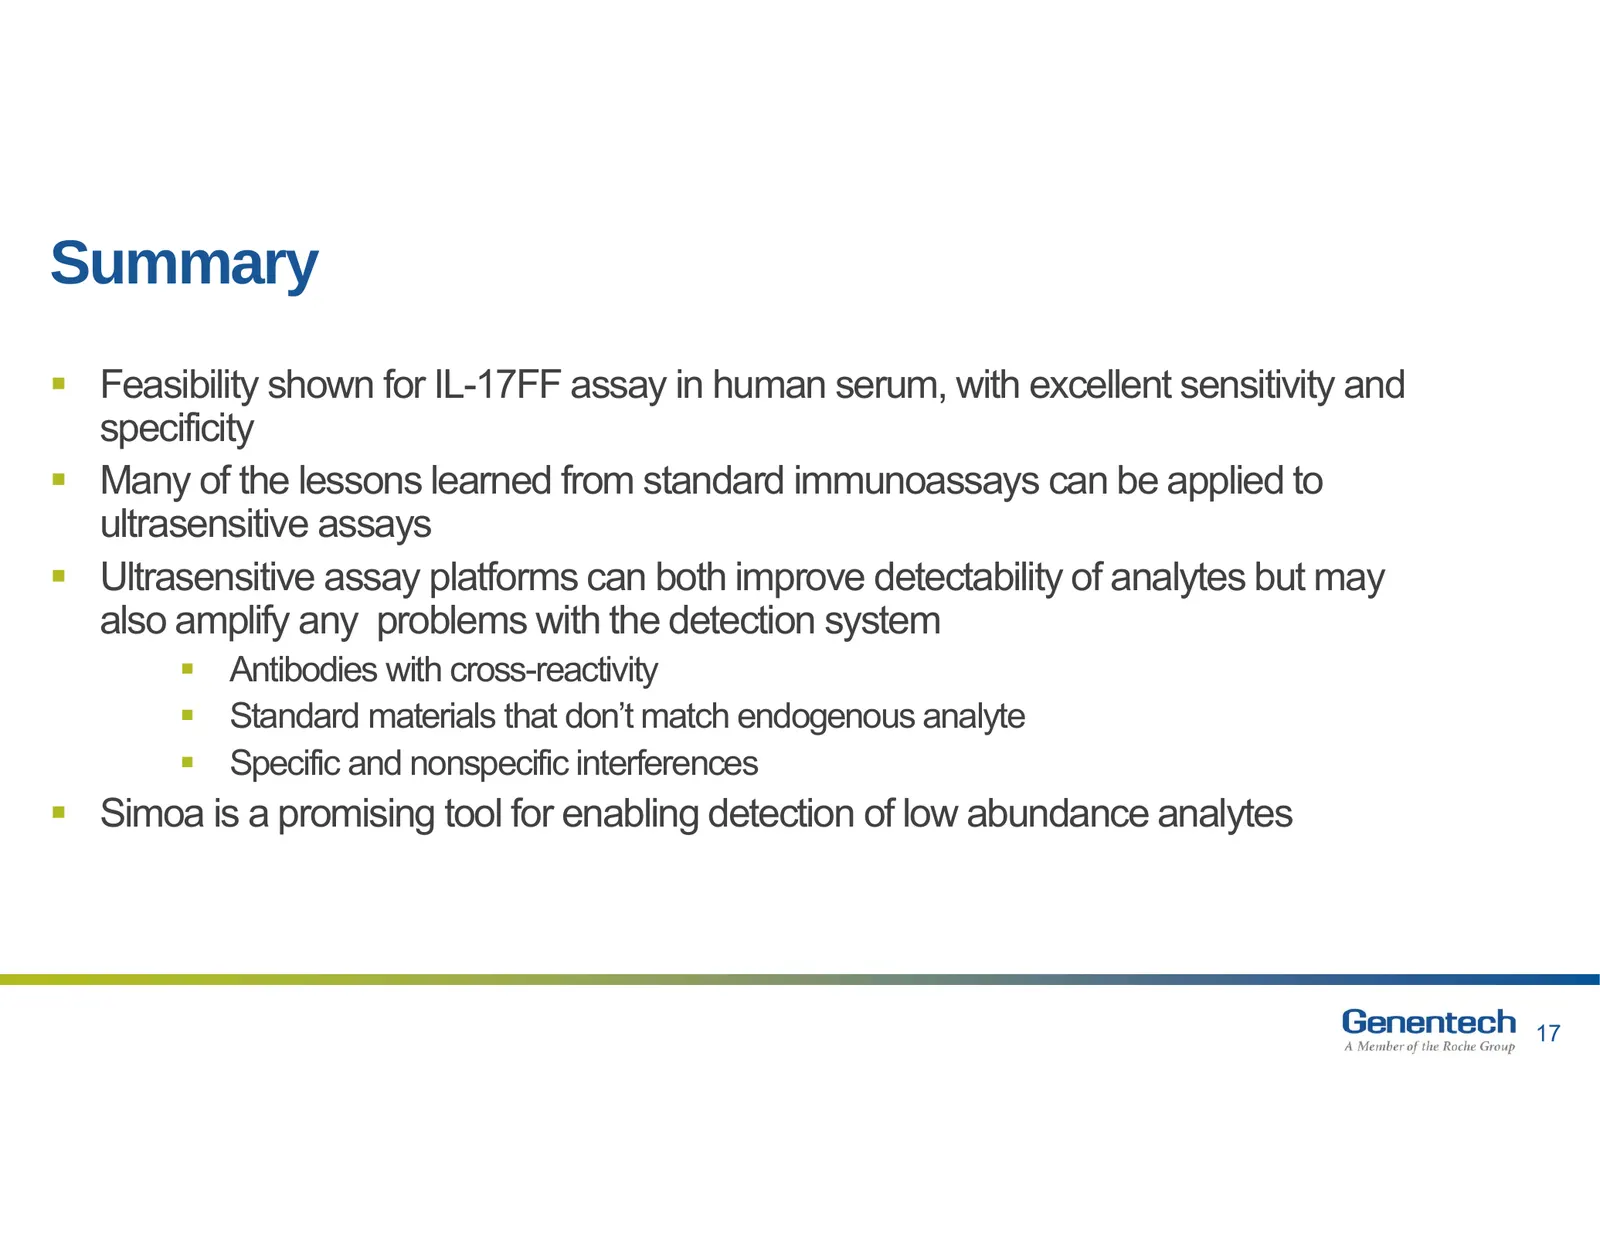
Summary Feasibility shown for IL-17FF assay in human serum, with excellent sensitivity and specificity Many of the lessons learned from standard immunoassays can be applied to ultrasensitive assays Ultrasensitive assay platforms can both improve detectability of analytes but may also amplify a
Slide 18: Acknowledgments
Acknowledgments Cecilia Leddy Jessica Li Cheryl Schofield Ann Brady Kristin Wallace Eric Wakshull 18 18

Slide 19: Thank You
THANK YOU Genentech ‘A Member of the Roche Group
Slide 20: Doing now what patients need next
Doing now what patients need next 20
Source: Internet Archive copy of quanterix.com
More decks from Quanterix Corporation
 Q3 2026 Earnings Presentation21 slides · Nov 9, 2026
 Q2 2026 Earnings Presentation21 slides · Aug 10, 2026
 Q1 2026 Earnings Presentation17 slides · May 6, 2026
 FY2025 Earnings Presentation14 slides · Mar 2, 2026
 Q3 2025 Earnings Presentation11 slides · Nov 10, 2025
 Q2 2025 Earnings Presentation12 slides · Aug 7, 2025