comScore, Inc. · NASDAQ:SCOR
comScore — Q3 2011 Earnings Presentation
49 slides from comScore's earnings presentation, September 2011

Slide 1: State of the Internet
State of the Internet September 2011 Bryan Goski Director, comScore Marketing Solutions
Slide 2: Agenda
Agenda Worldwide Context US Vital Signs State of the Internet – Video – Search – Mobile – eCommerce Monetization © comScore, Inc. Proprietary and Confidential. 2
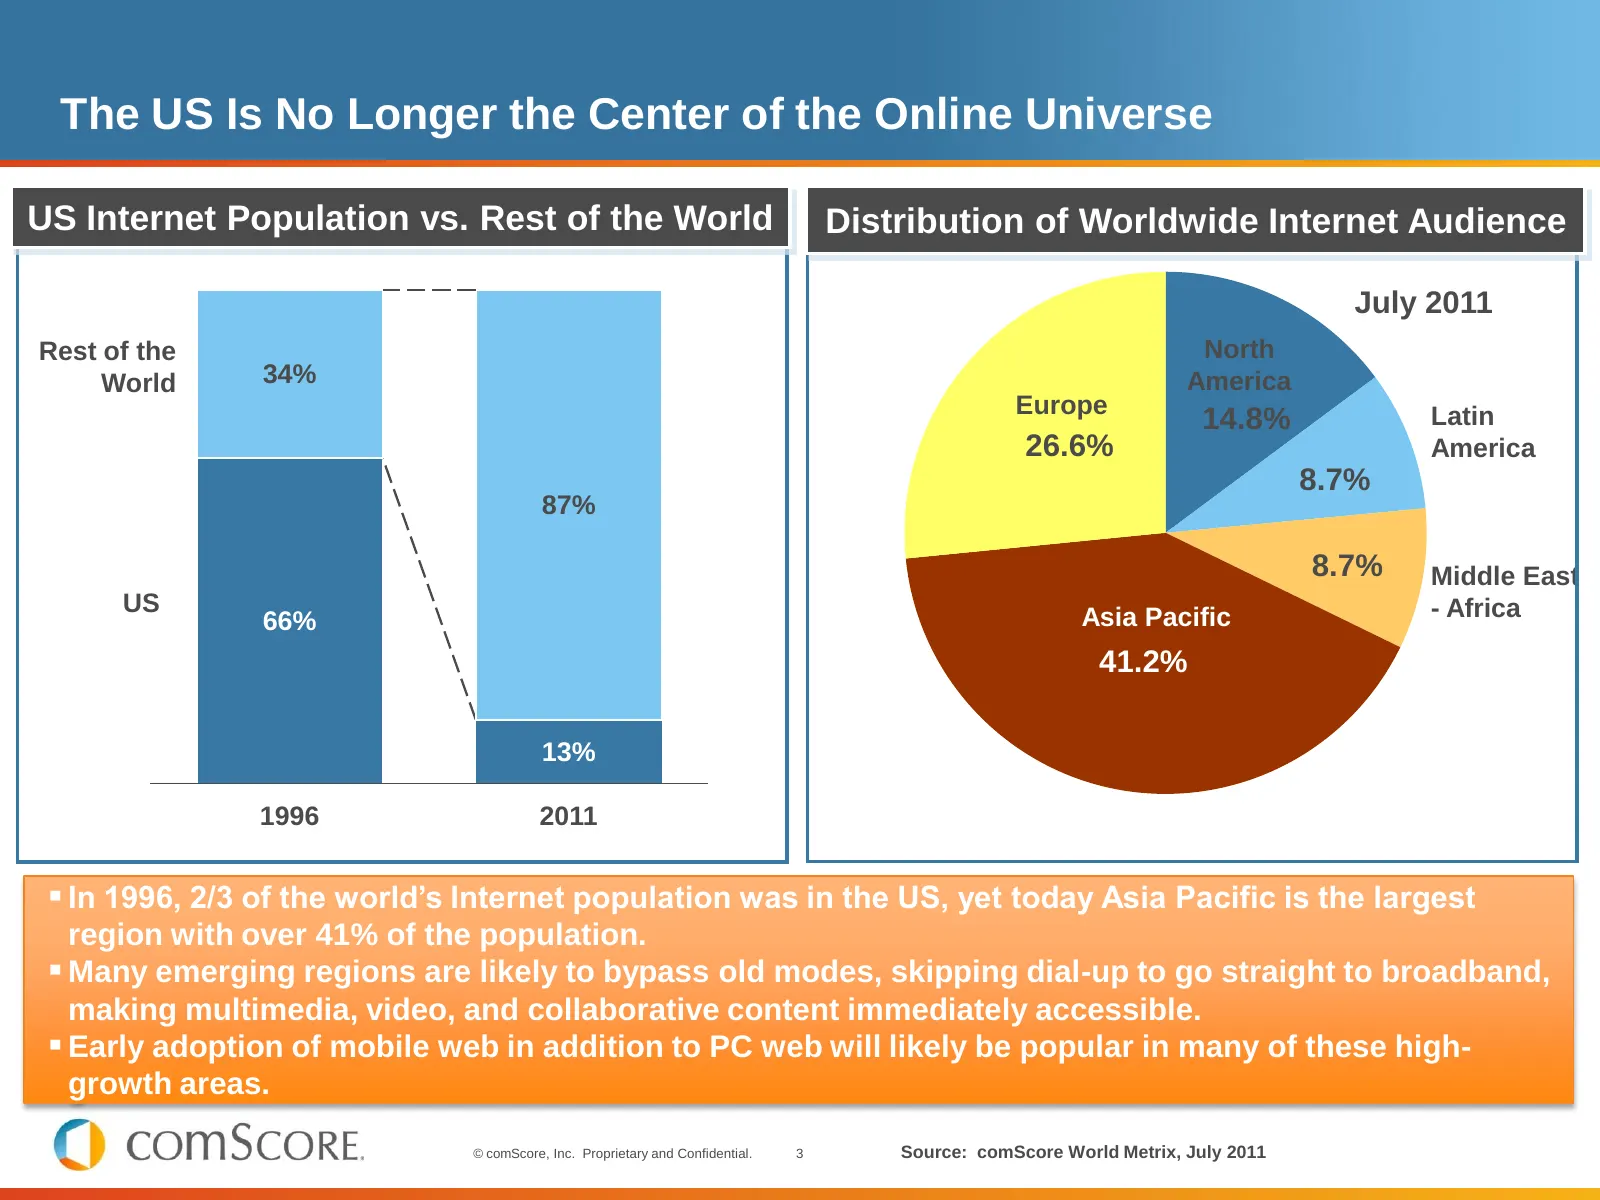
Slide 3: The US Is No Longer the Center of the Online Universe
The US Is No Longer the Center of the Online Universe US Internet Population vs. Rest of the World Distribution of Worldwide Internet Audience July 2011 Rest of the North World 34% America Europe Latin 14.8% 26.6% America 8.7% 87% 8.7% Middle East US - Africa 66% Asia Pacific 41.2% 13% 1996 2011 I
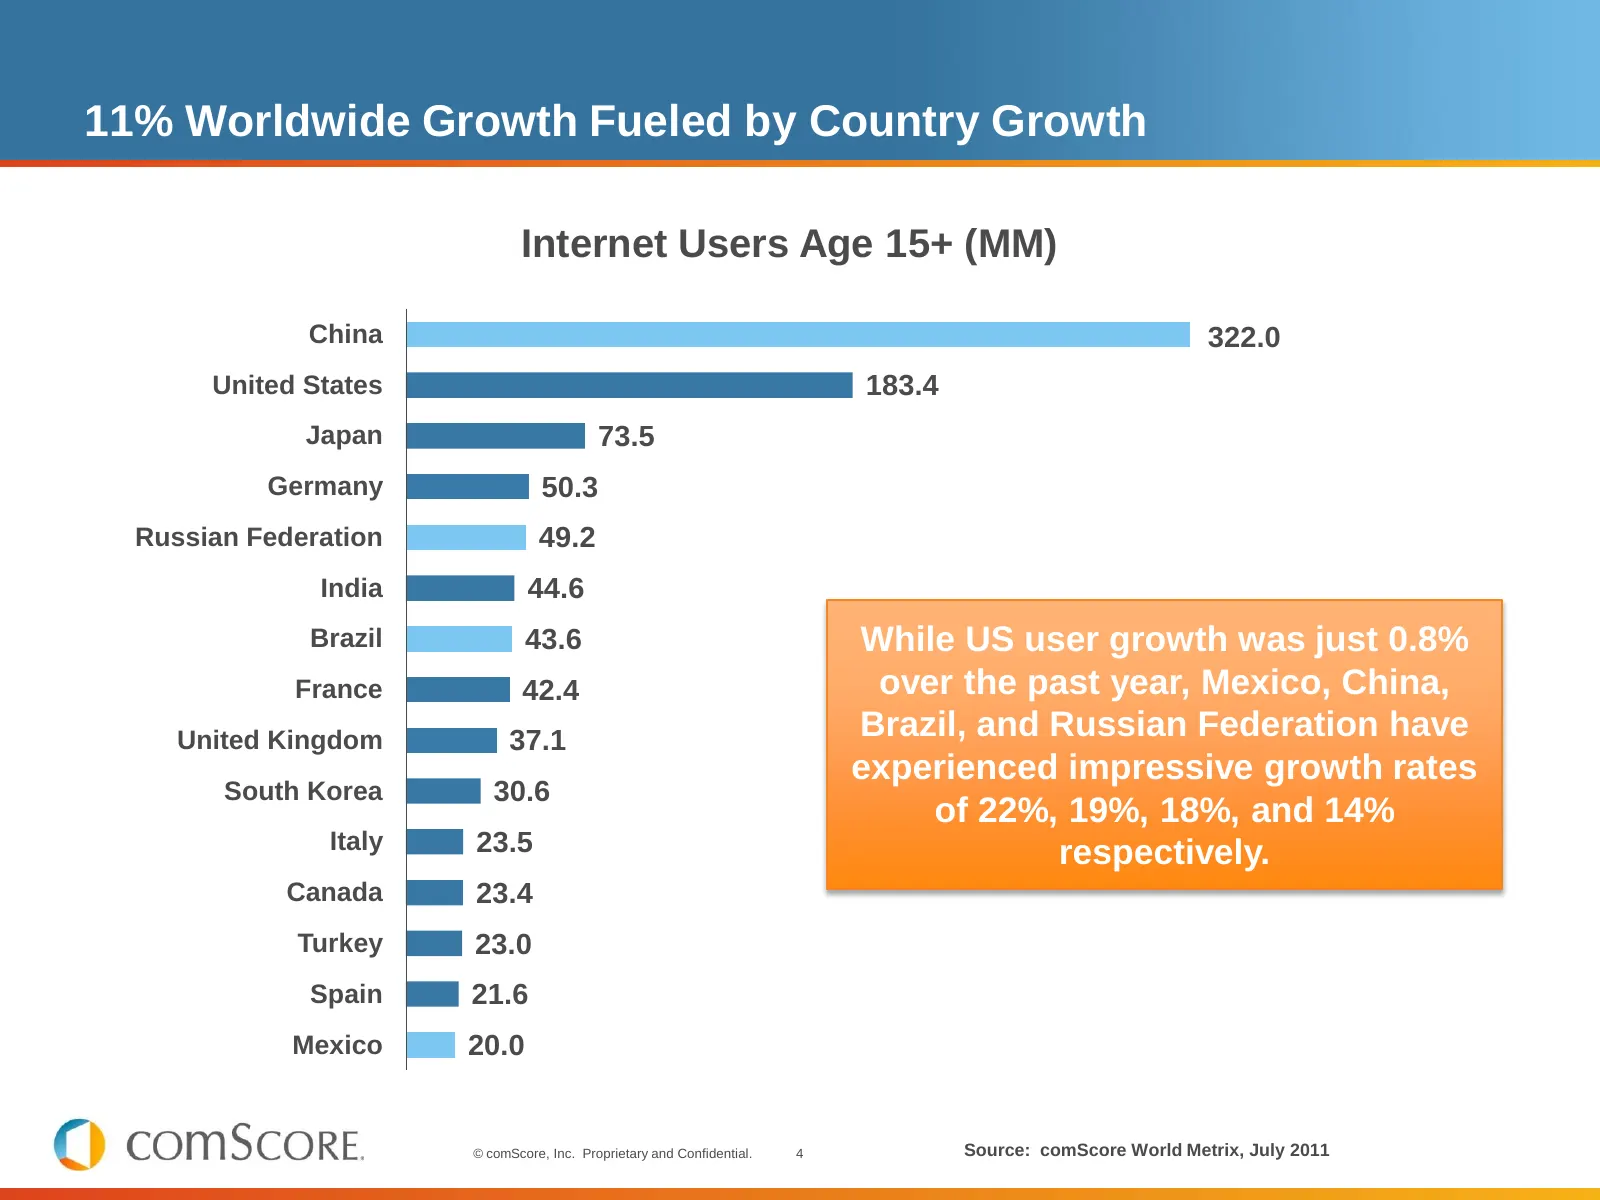
Slide 4: 11% Worldwide Growth Fueled by Country Growth
11% Worldwide Growth Fueled by Country Growth Internet Users Age 15+ (MM) China 322.0 United States 183.4 Japan 73.5 Germany 50.3 Russian Federation 49.2 India 44.6 Brazil 43.6 While US user growth was just 0.8% France 42.4 over the past year, Mexico, China, United Kingdom 37.1 Brazil, and Russian F
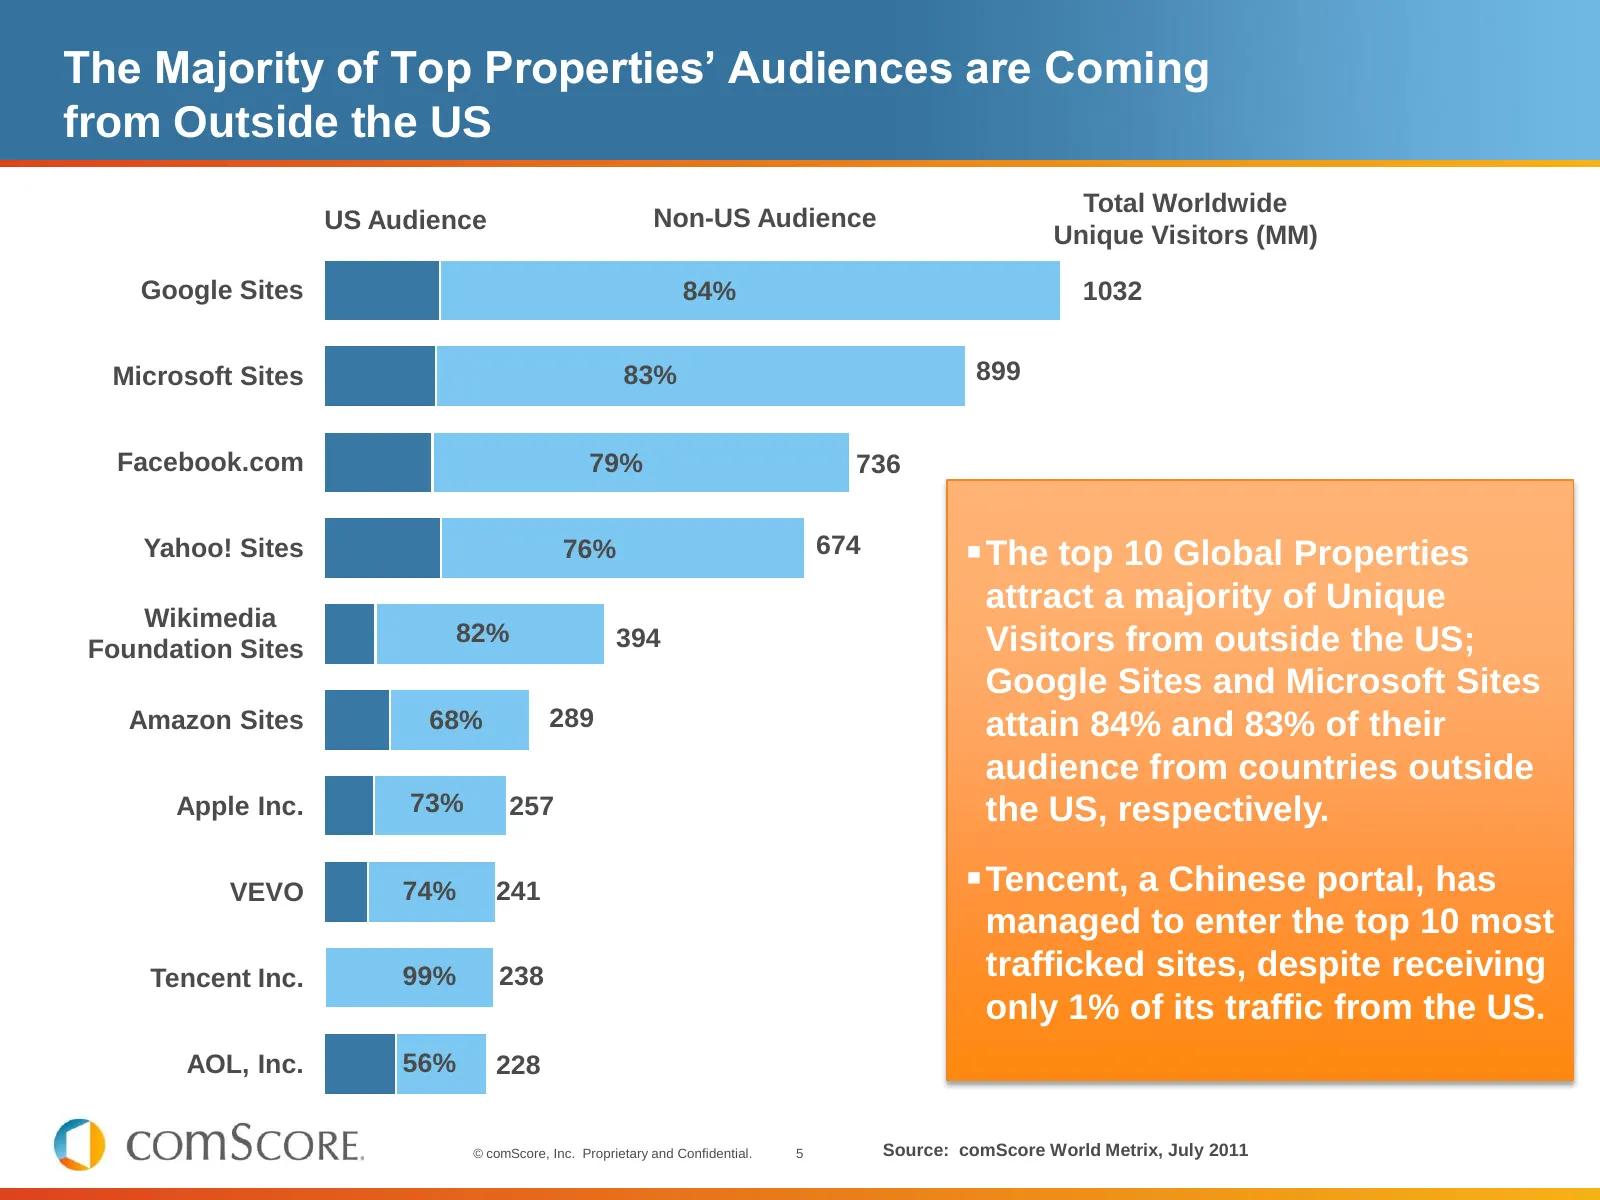
Slide 5: The Majority of Top Properties' Audiences are Coming from Outside the US
The Majority of Top Properties’ Audiences are Coming from Outside the US Total Worldwide US Audience Non-US Audience Unique Visitors (MM) Google Sites 84% 1032 Microsoft Sites 83% 899 Facebook.com 79% 736 Yahoo! Sites 76% 674 The top 10 Global Properties attract a majority of Unique Wikimedia 82%
Slide 6: Agenda
Agenda Worldwide Context US Vital Signs State of the Internet – Video – Search – Mobile – eCommerce Monetization © comScore, Inc. Proprietary and Confidential. 6
Slide 7: A Snapshot of US Internet Activity
A Snapshot of US Internet Activity In July 2011: 215.1 million Americans used the Internet. – Average user was online 25.3 days in the month, for a total of 34.8 hours, and viewed 3,029 pages 86.0% of Internet visitors viewed an online video in the US, for an average of 18.2 hours each. 93% of
Slide 8: Is the US Internet Really Still Growing?
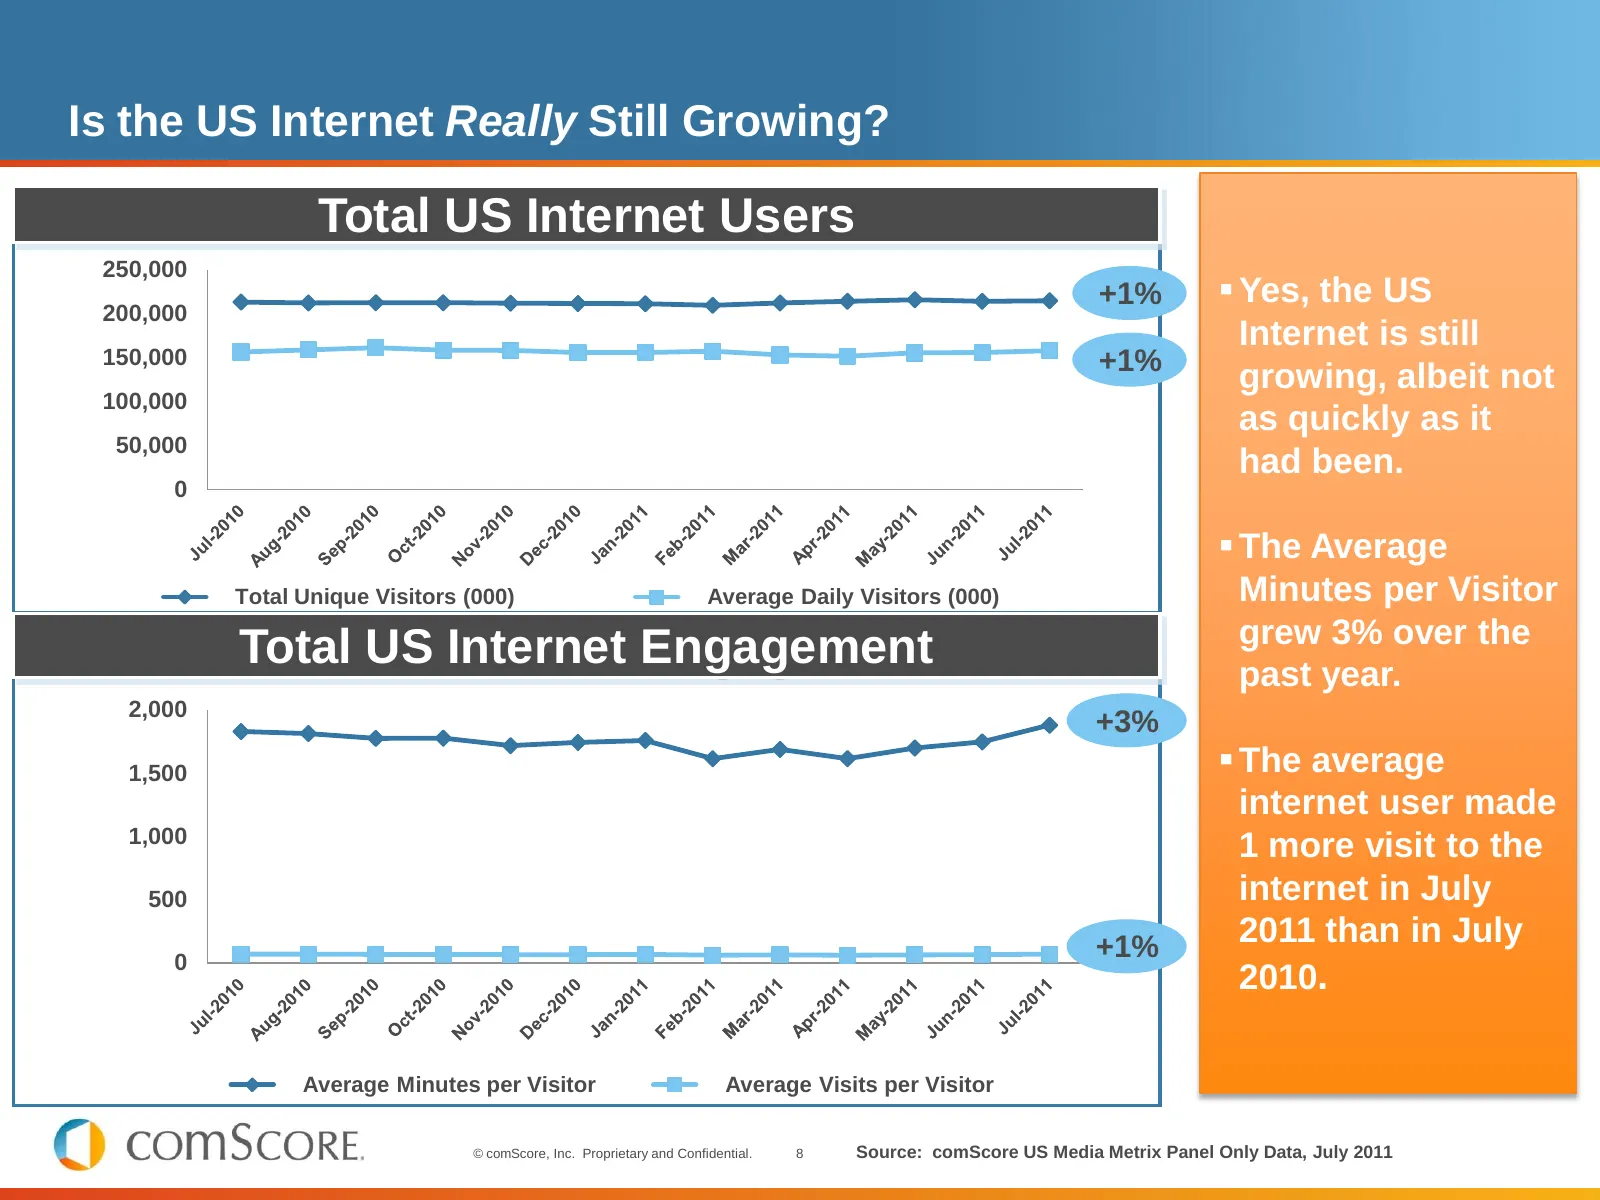
Is the US Internet Really Still Growing? Total US Internet Users 250,000 +1% Yes, the US 200,000 Internet is still 150,000 +1% growing, albeit not 100,000 as quickly as it 50,000 had been. 0 The Average Total Unique Visitors (000) Average Daily Visitors (000) Minutes per Visitor grew 3% over the
Slide 9: Which Categories are Driving Web Growth?
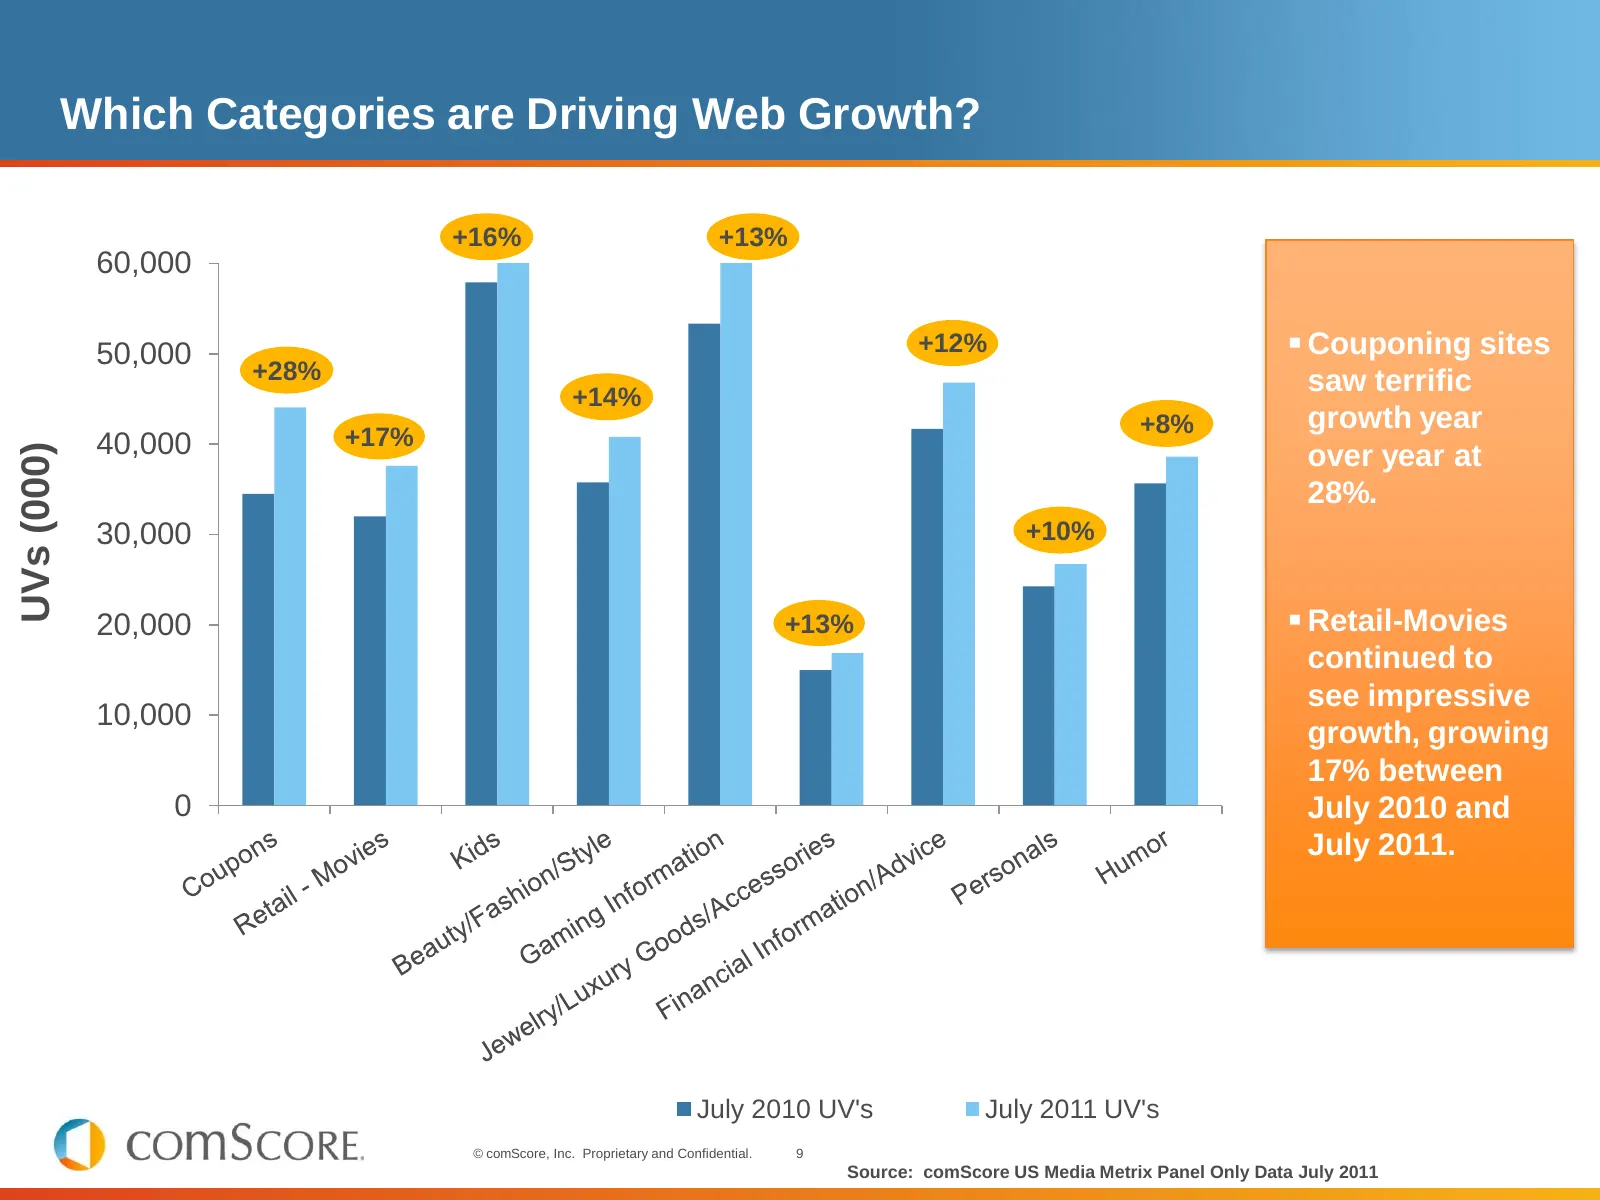
Which Categories are Driving Web Growth? +16% +13% 60,000 50,000 +12% Couponing sites +28% saw terrific +14% +8% growth year 40,000 +17% UVs (000) over year at 28%. 30,000 +10% 20,000 +13% Retail-Movies continued to see impressive 10,000 growth, growing 17% between 0 July 2010 and July 2011. Jul
Slide 10: What Properties are Driving Web Growth?
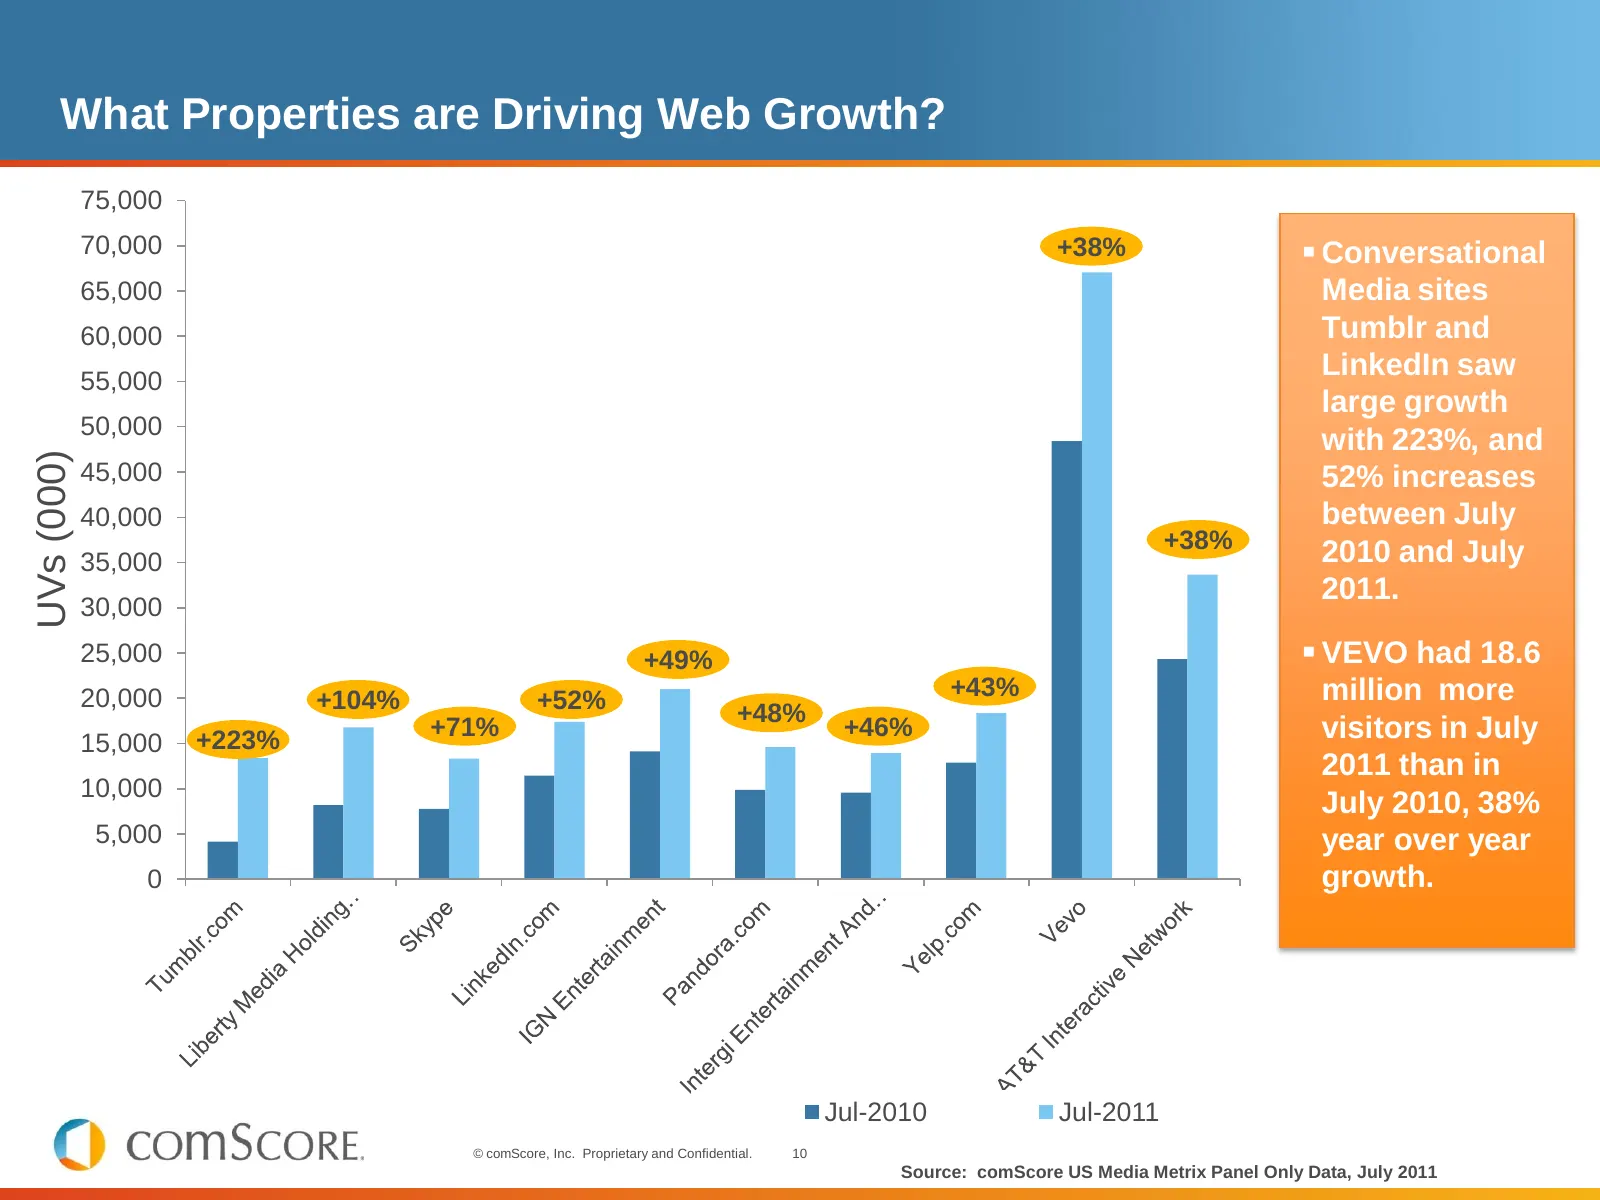
What Properties are Driving Web Growth? 75,000 70,000 +38% Conversational 65,000 Media sites 60,000 Tumblr and 55,000 LinkedIn saw large growth 50,000 with 223%, and UVs (000) 45,000 52% increases 40,000 between July +38% 2010 and July 35,000 2011. 30,000 25,000 +49% VEVO had 18.6 20,000 +43% mi
Slide 11: Sources for Fastest Growing Sites
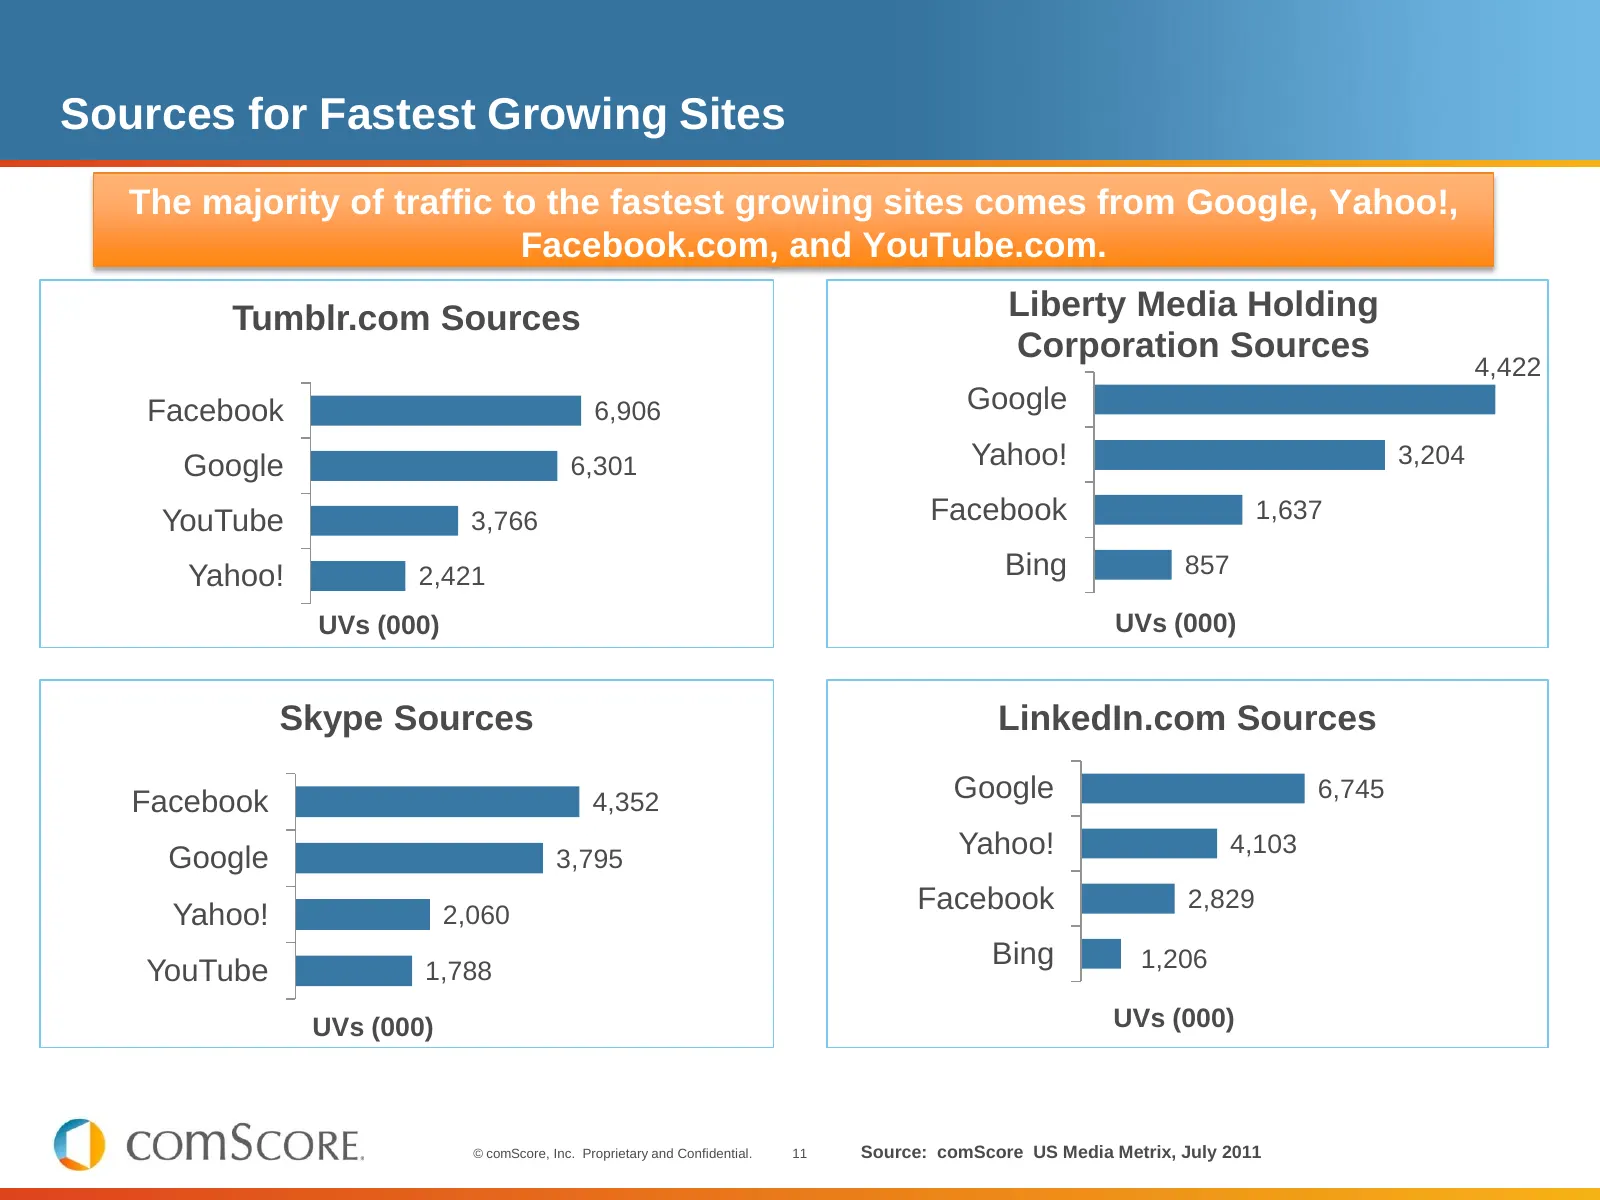
Sources for Fastest Growing Sites The majority of traffic to the fastest growing sites comes from Google, Yahoo!, Facebook.com, and YouTube.com. Tumblr.com Sources Liberty Media Holding Corporation Sources 4,422 Facebook 6,906 Google Google 6,301 Yahoo! 3,204 YouTube 3,766 Facebook 1,637 Yahoo! 2,42
Slide 12: Unique Visitors to social networking sites have increased 5% year over year
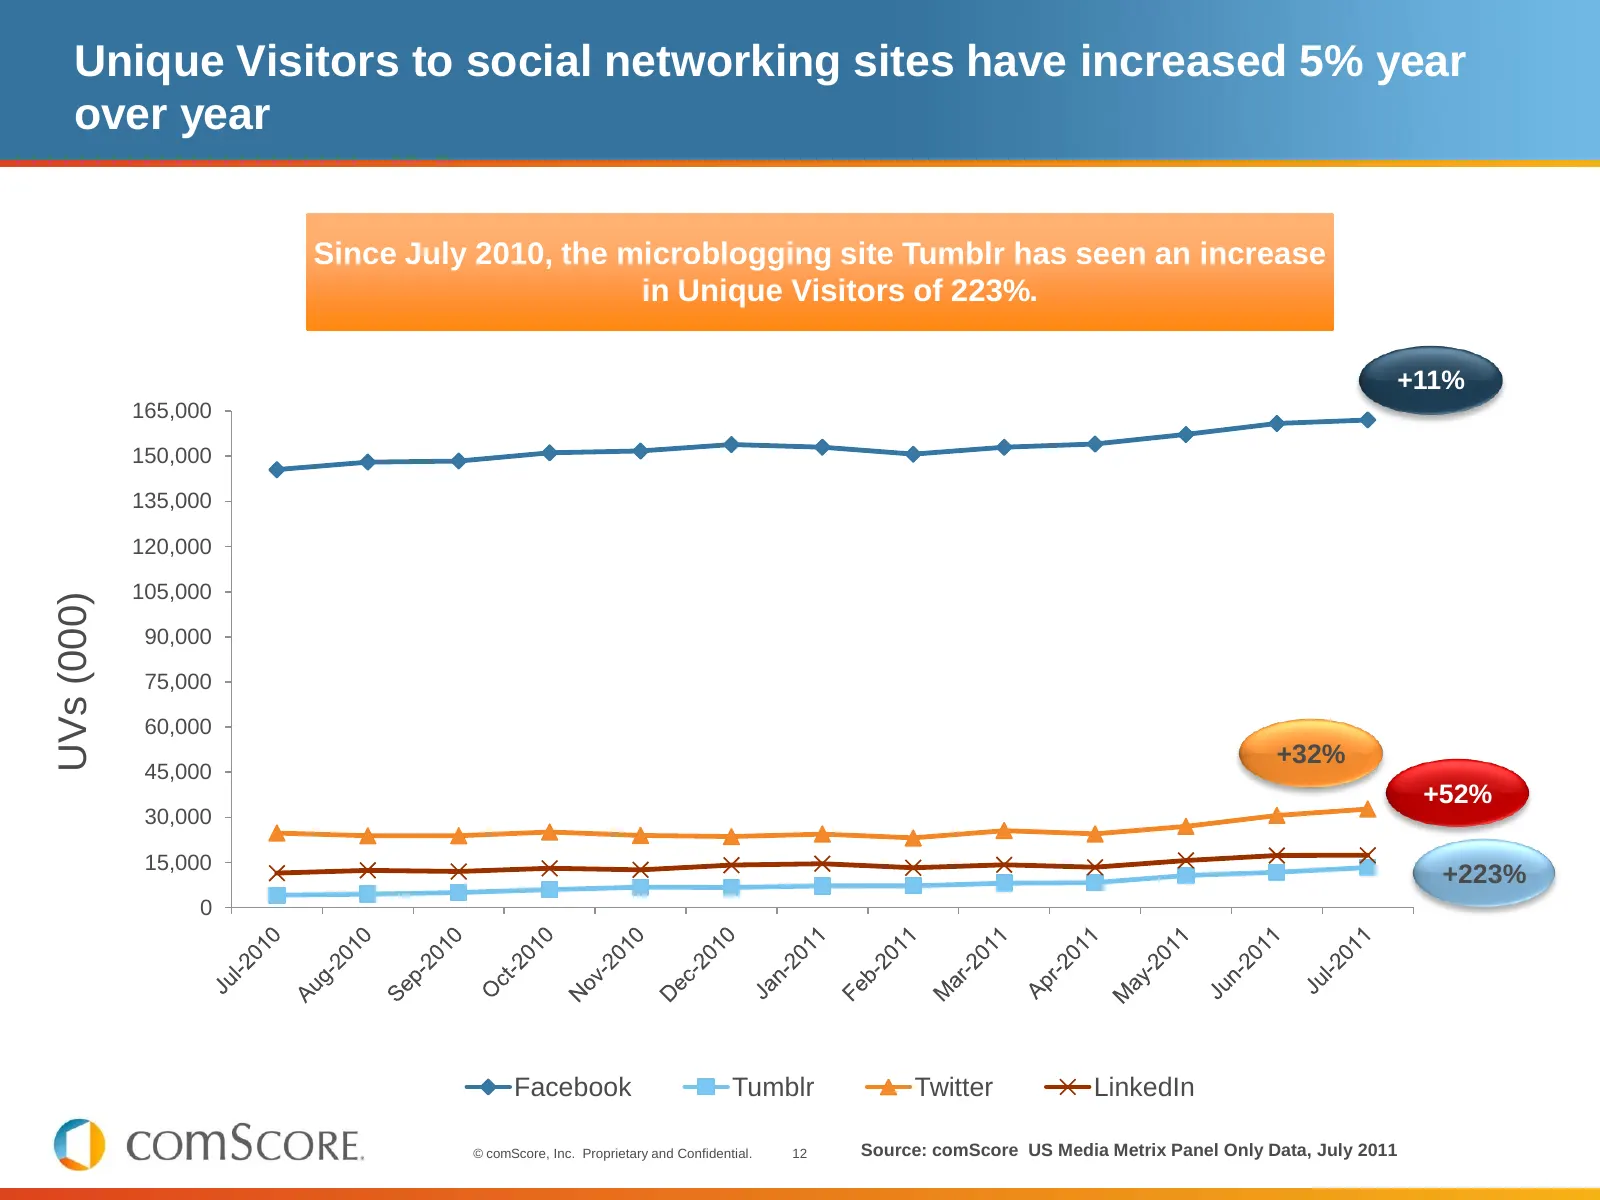
Unique Visitors to social networking sites have increased 5% year over year Since July 2010, the microblogging site Tumblr has seen an increase in Unique Visitors of 223%. +11% 165,000 150,000 135,000 120,000 105,000 UVs (000) 90,000 75,000 60,000 +32% 45,000 +52% 30,000 15,000 +223% 0 Facebook Tumb
Slide 13: Google+: The Future of Social Networking?
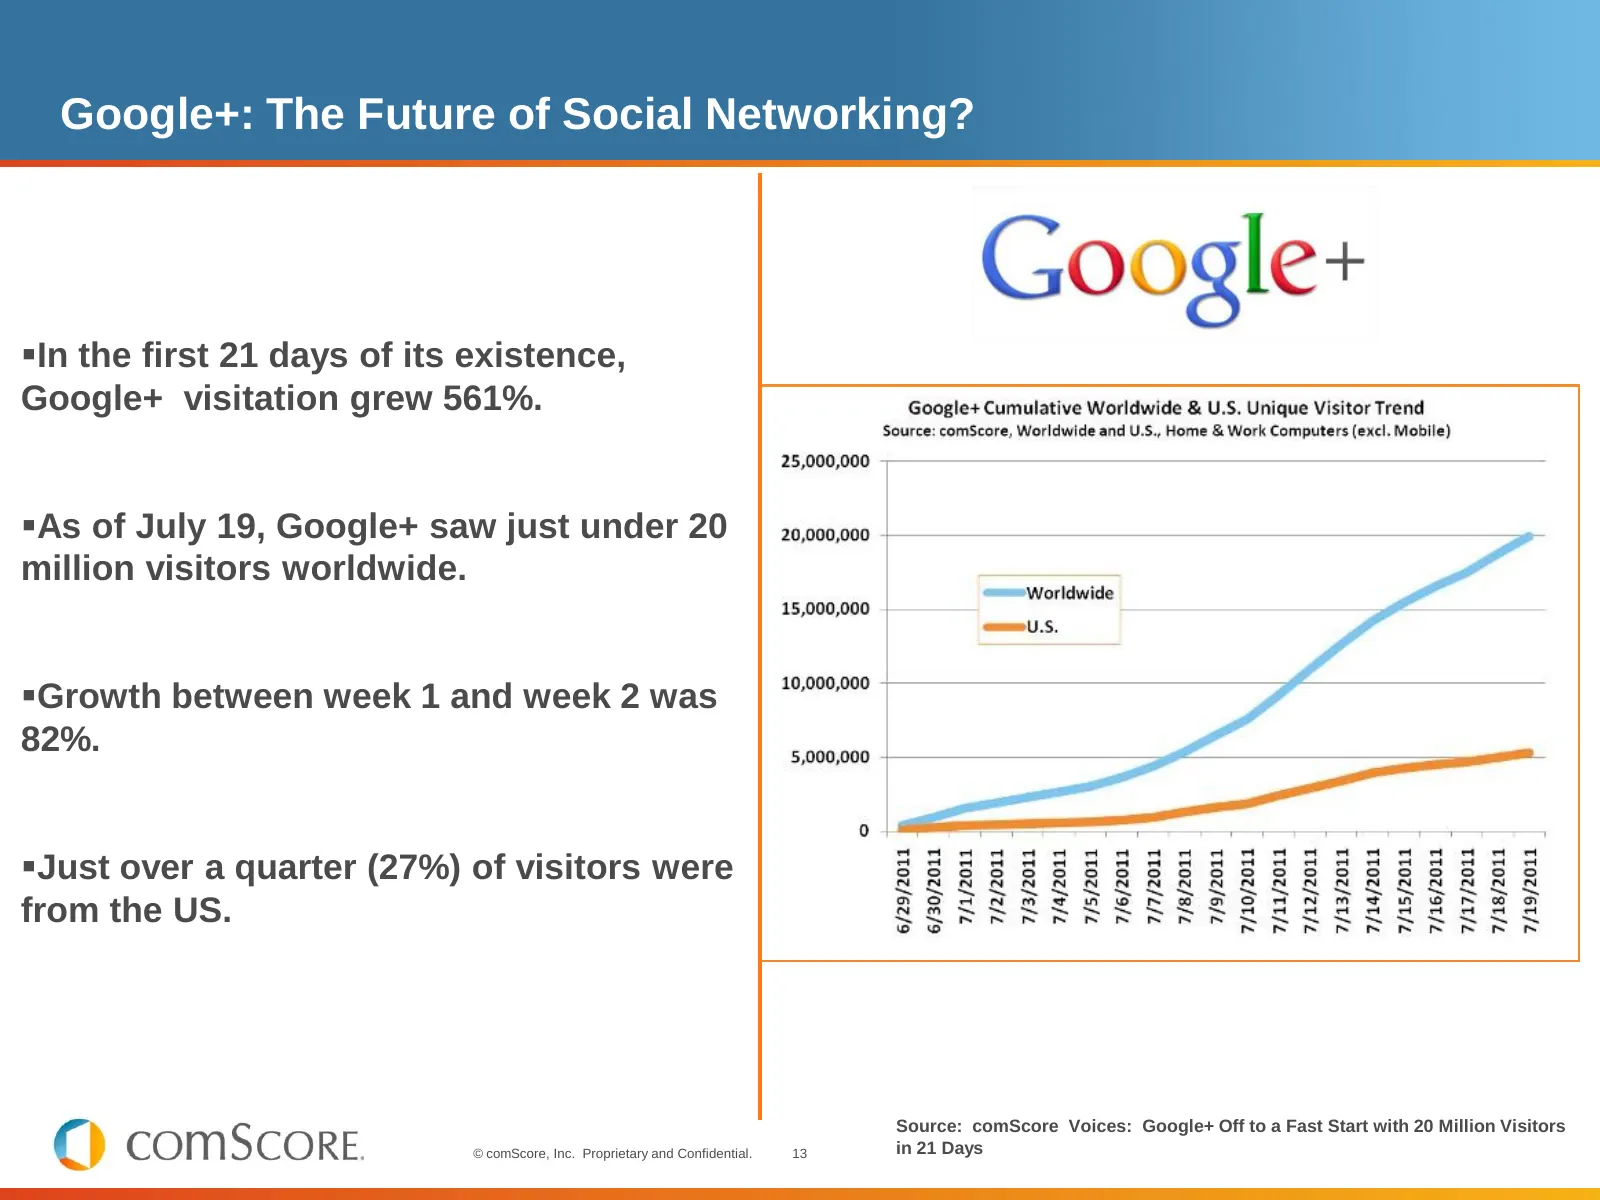
Google+: The Future of Social Networking? In the first 21 days of its existence, Google+ visitation grew 561%. As of July 19, Google+ saw just under 20 million visitors worldwide. Growth between week 1 and week 2 was 82%. Just over a quarter (27%) of visitors were from the US. Source: comScore V
Slide 14: Google+: The Future of Social Networking?
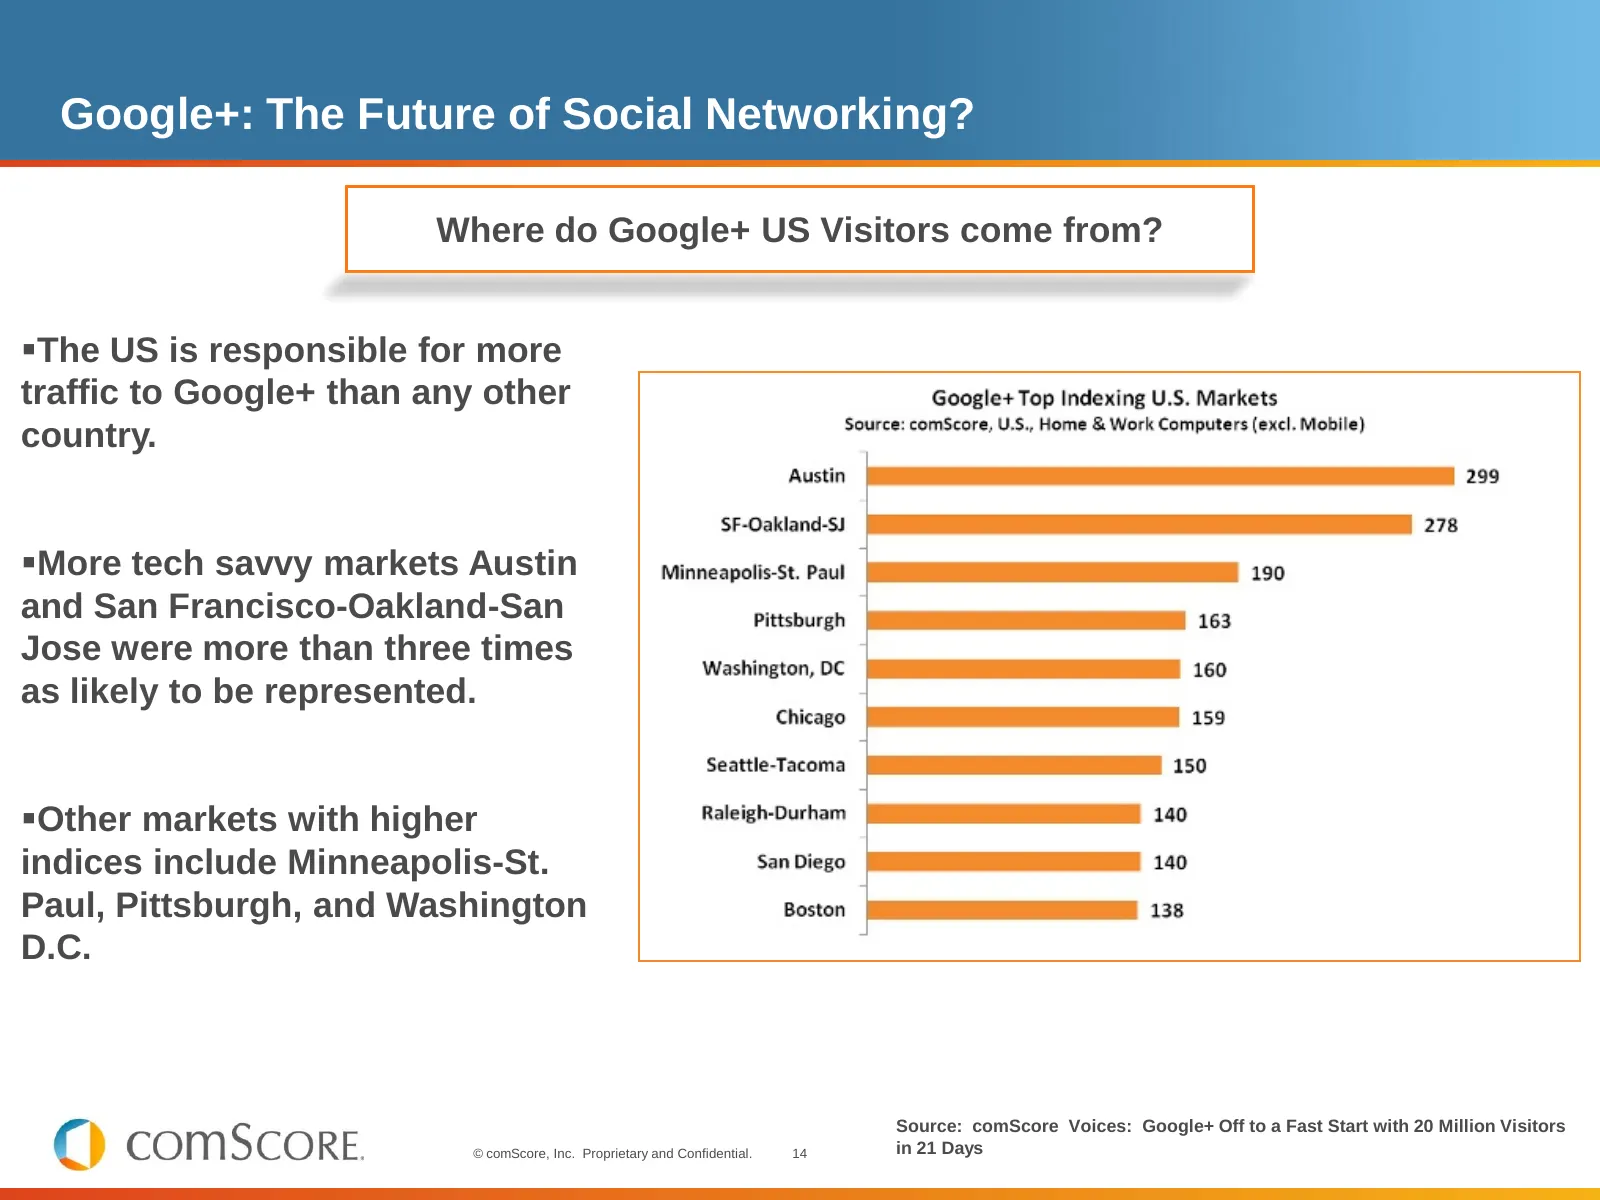
Google+: The Future of Social Networking? Where do Google+ US Visitors come from? The US is responsible for more traffic to Google+ than any other country. More tech savvy markets Austin and San Francisco-Oakland-San Jose were more than three times as likely to be represented. Other markets with
Slide 15: Agenda
Agenda Worldwide Context US Vital Signs State of the Internet – Video – Search – Mobile – eCommerce Monetization © comScore, Inc. Proprietary and Confidential. 15
Slide 16: Online Video Viewing Is Growing Strongly with Significant Growth Potential
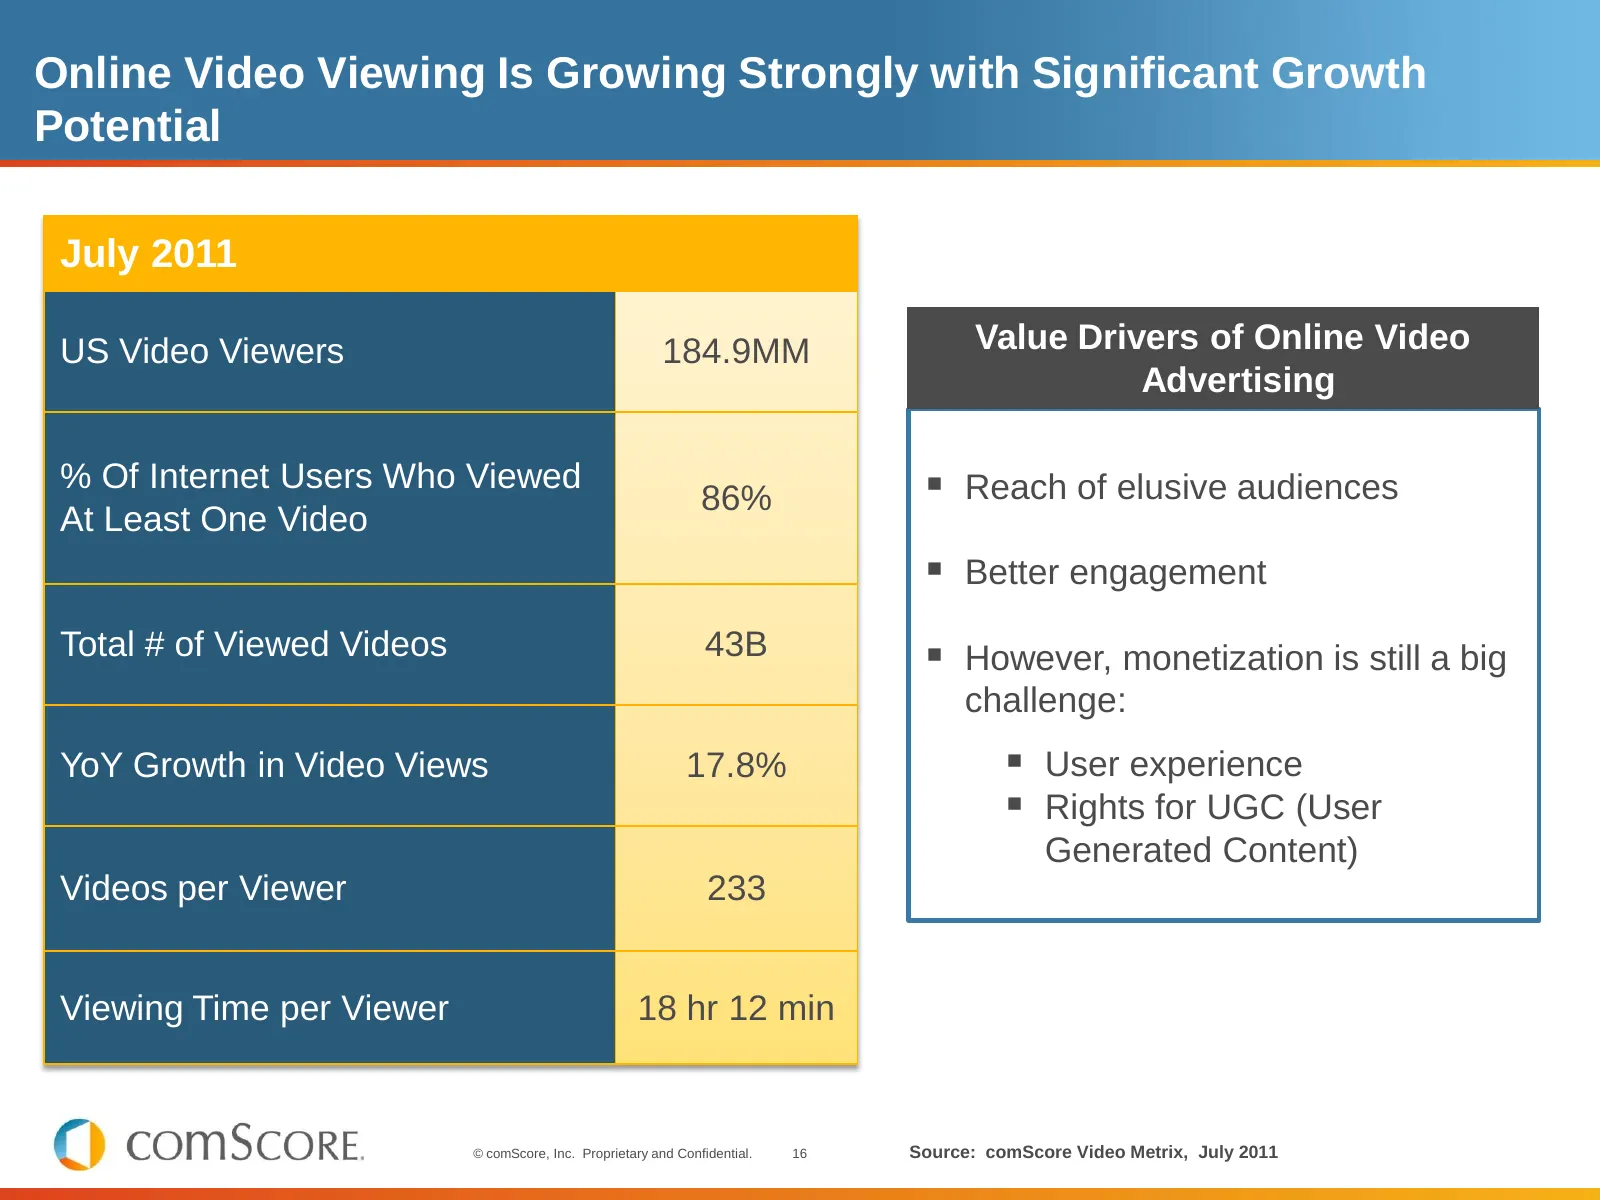
Online Video Viewing Is Growing Strongly with Significant Growth Potential July 2011 US Video Viewers 184.9MM Value Drivers of Online Video Advertising % Of Internet Users Who Viewed 86% Reach of elusive audiences At Least One Video Better engagement Total # of Viewed Videos 43B However, monet
Slide 17: Time Spent Streaming Jumps as Long-Form Content Floods the Web
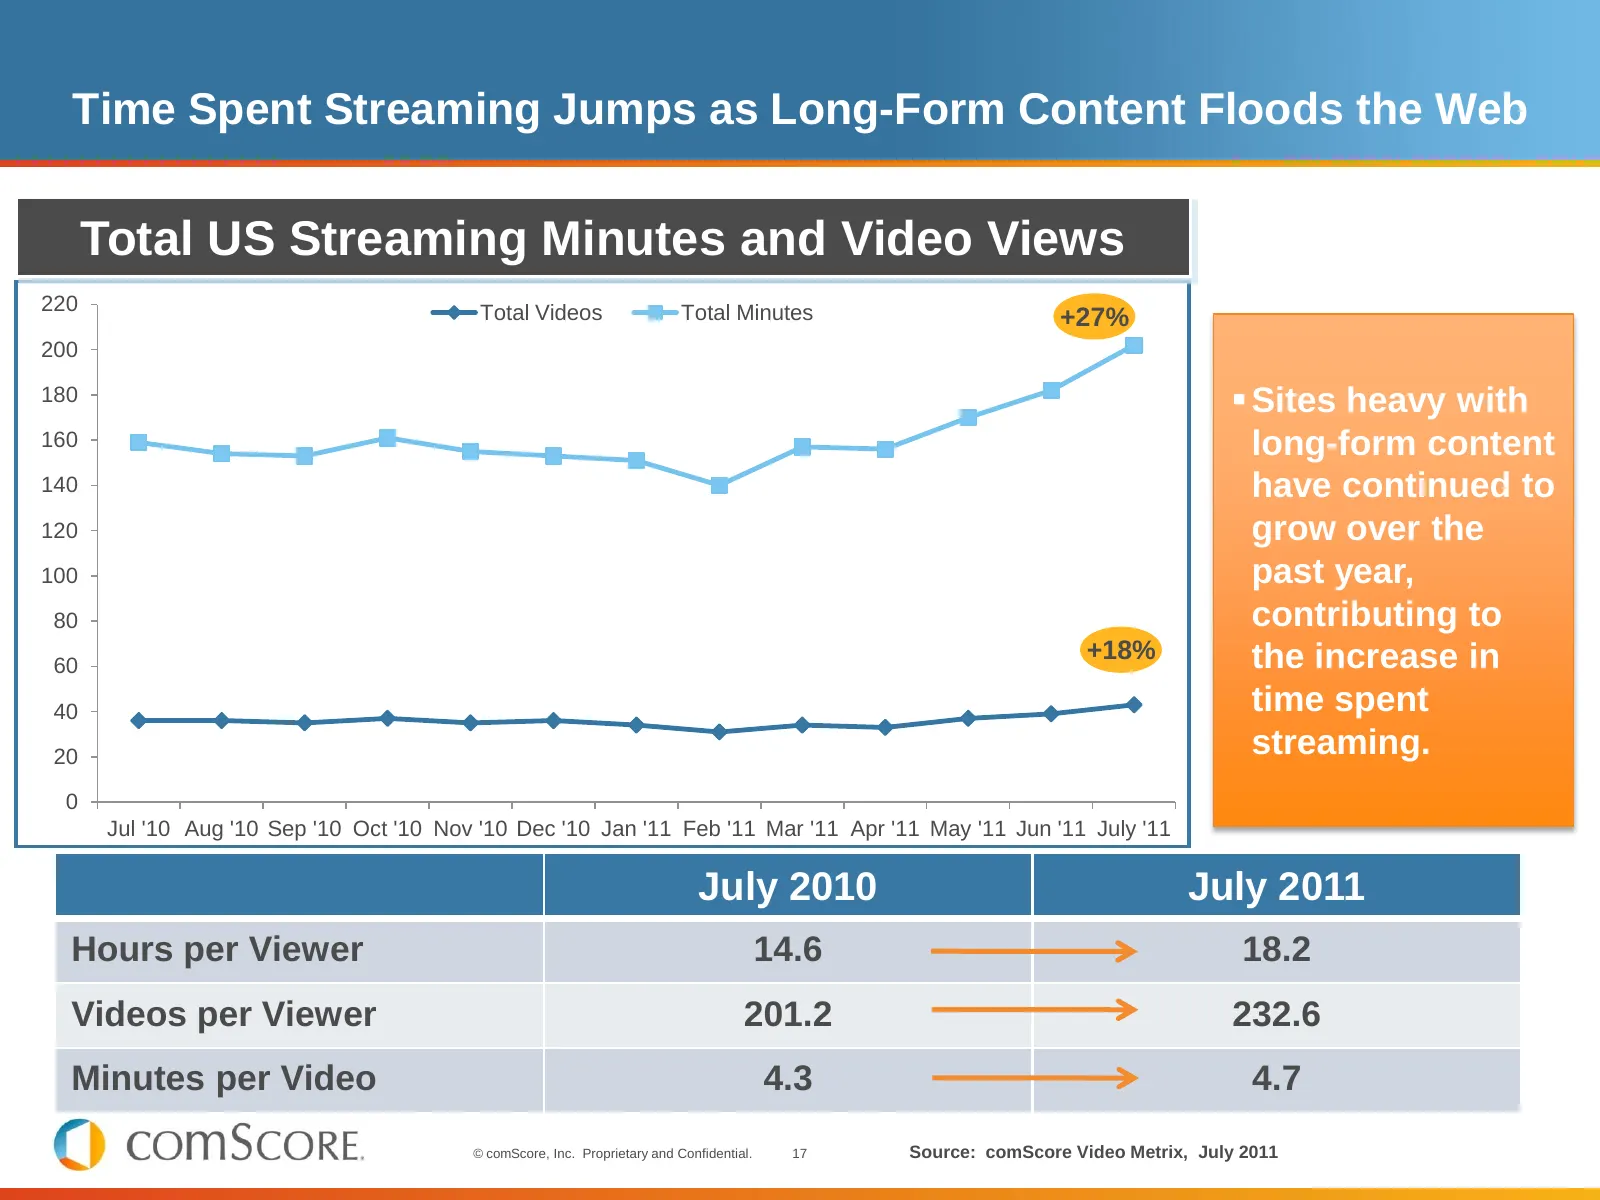
Time Spent Streaming Jumps as Long-Form Content Floods the Web Total US Streaming Minutes and Video Views 220 Total Videos Total Minutes +27% 200 180 Sites heavy with 160 long-form content 140 have continued to 120 grow over the 100 past year, 80 contributing to +18% the increase in 60 40 time spe
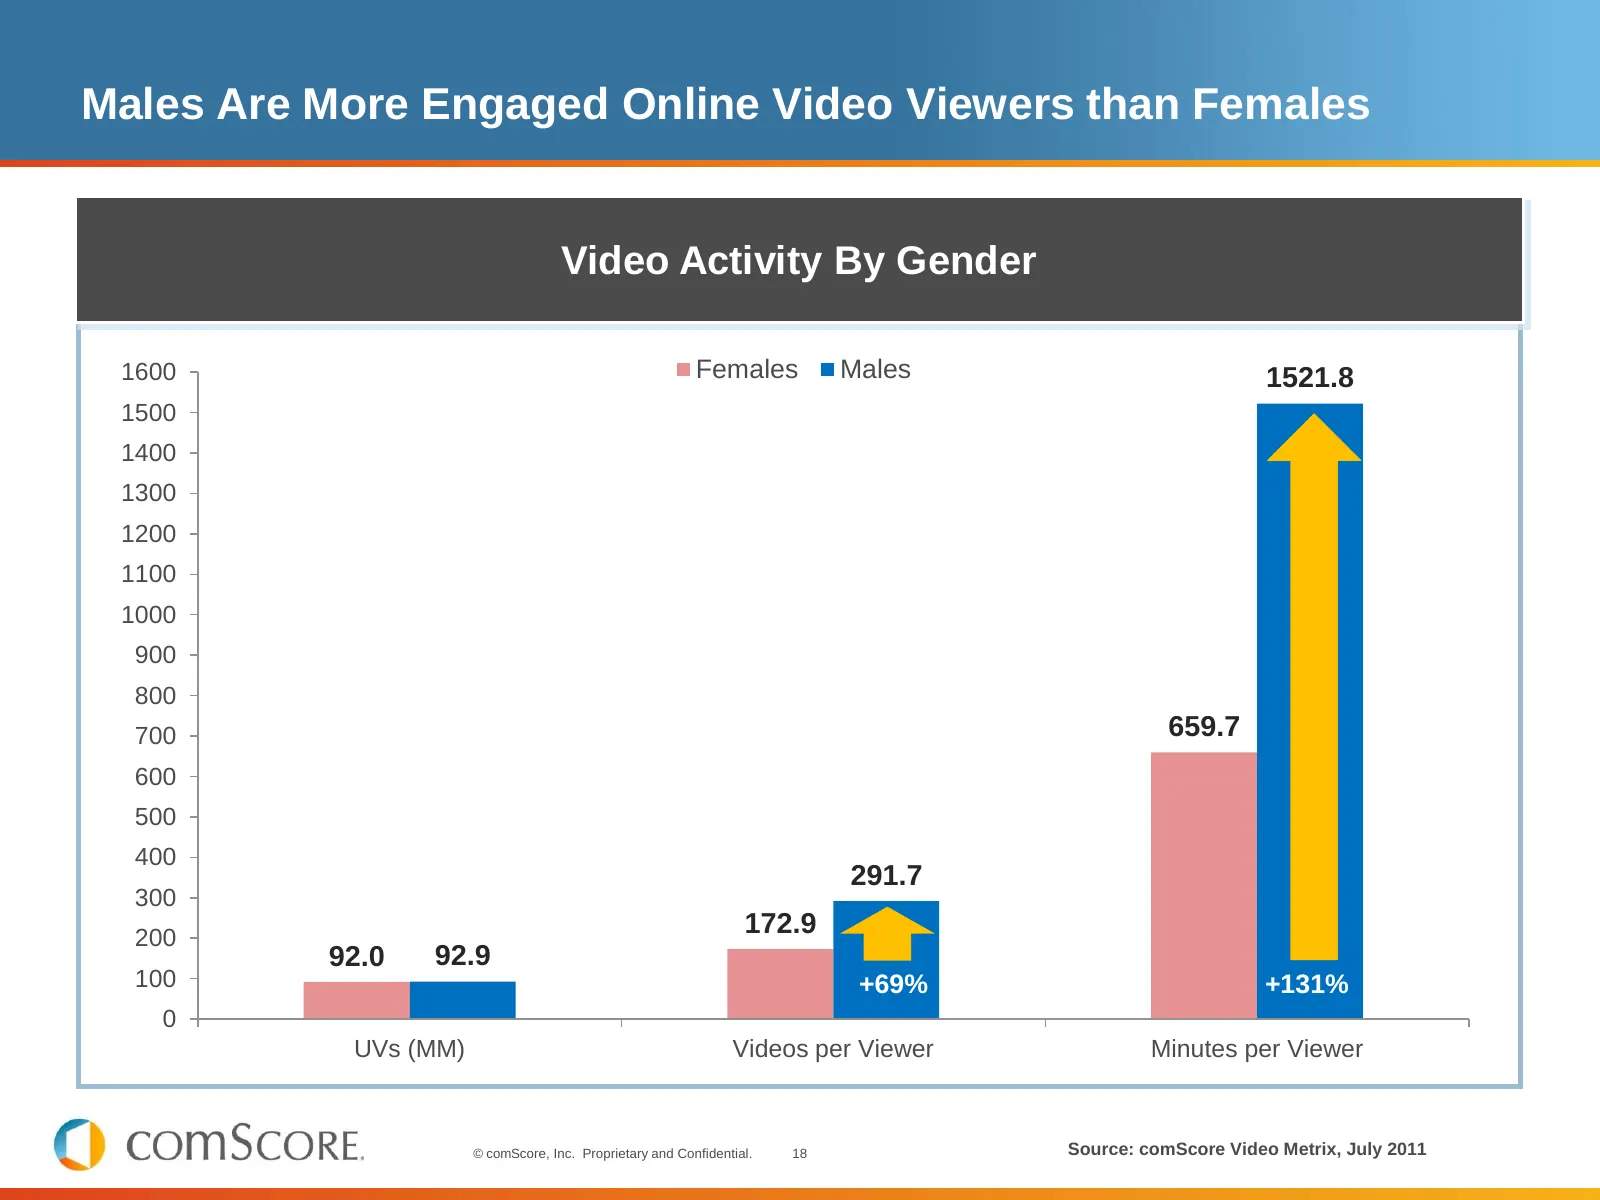
Slide 18: Males Are More Engaged Online Video Viewers than Females
Males Are More Engaged Online Video Viewers than Females Video Activity By Gender 1600 Females Males 1521.8 1500 1400 1300 1200 1100 1000 900 800 700 659.7 600 500 400 291.7 300 172.9 +116% 200 92.0 92.9 +120% 100 +66% +69% +131% 0 UVs (MM) Videos per Viewer Minutes per Viewer © comScore, Inc. Propr
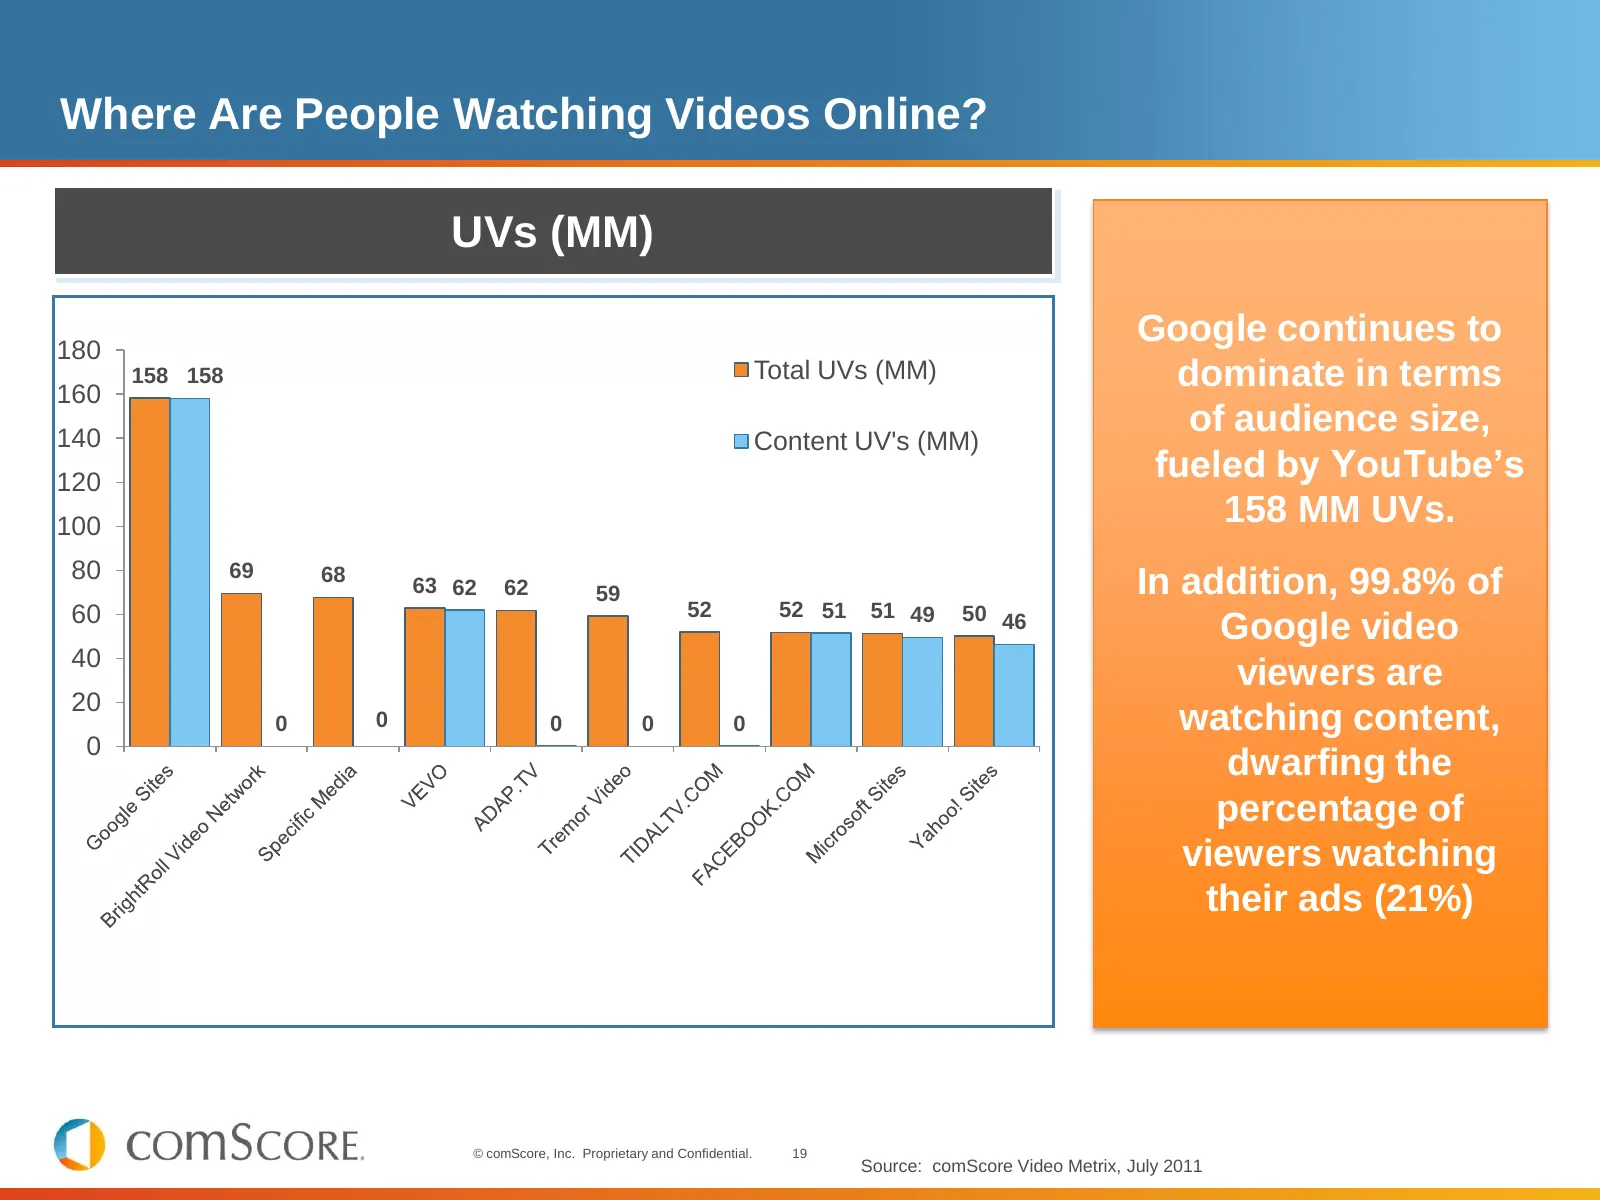
Slide 19: Where Are People Watching Videos Online?
Where Are People Watching Videos Online? UVs (MM) 180 Google continues to 160 158 158 Total UVs (MM) dominate in terms 140 of audience size, Content UV's (MM) 120 fueled by YouTube’s 100 158 MM UVs. 80 69 68 63 62 62 59 In addition, 99.8% of 60 52 52 51 51 49 50 46 Google video 40 viewers are 20 0 0
Slide 20: Agenda
Agenda Worldwide Context US Vital Signs State of the Internet – Video – Search – Mobile – eCommerce Monetization © comScore, Inc. Proprietary and Confidential. 20
Slide 21: The Search Market Overview: Key Highlights & Trends
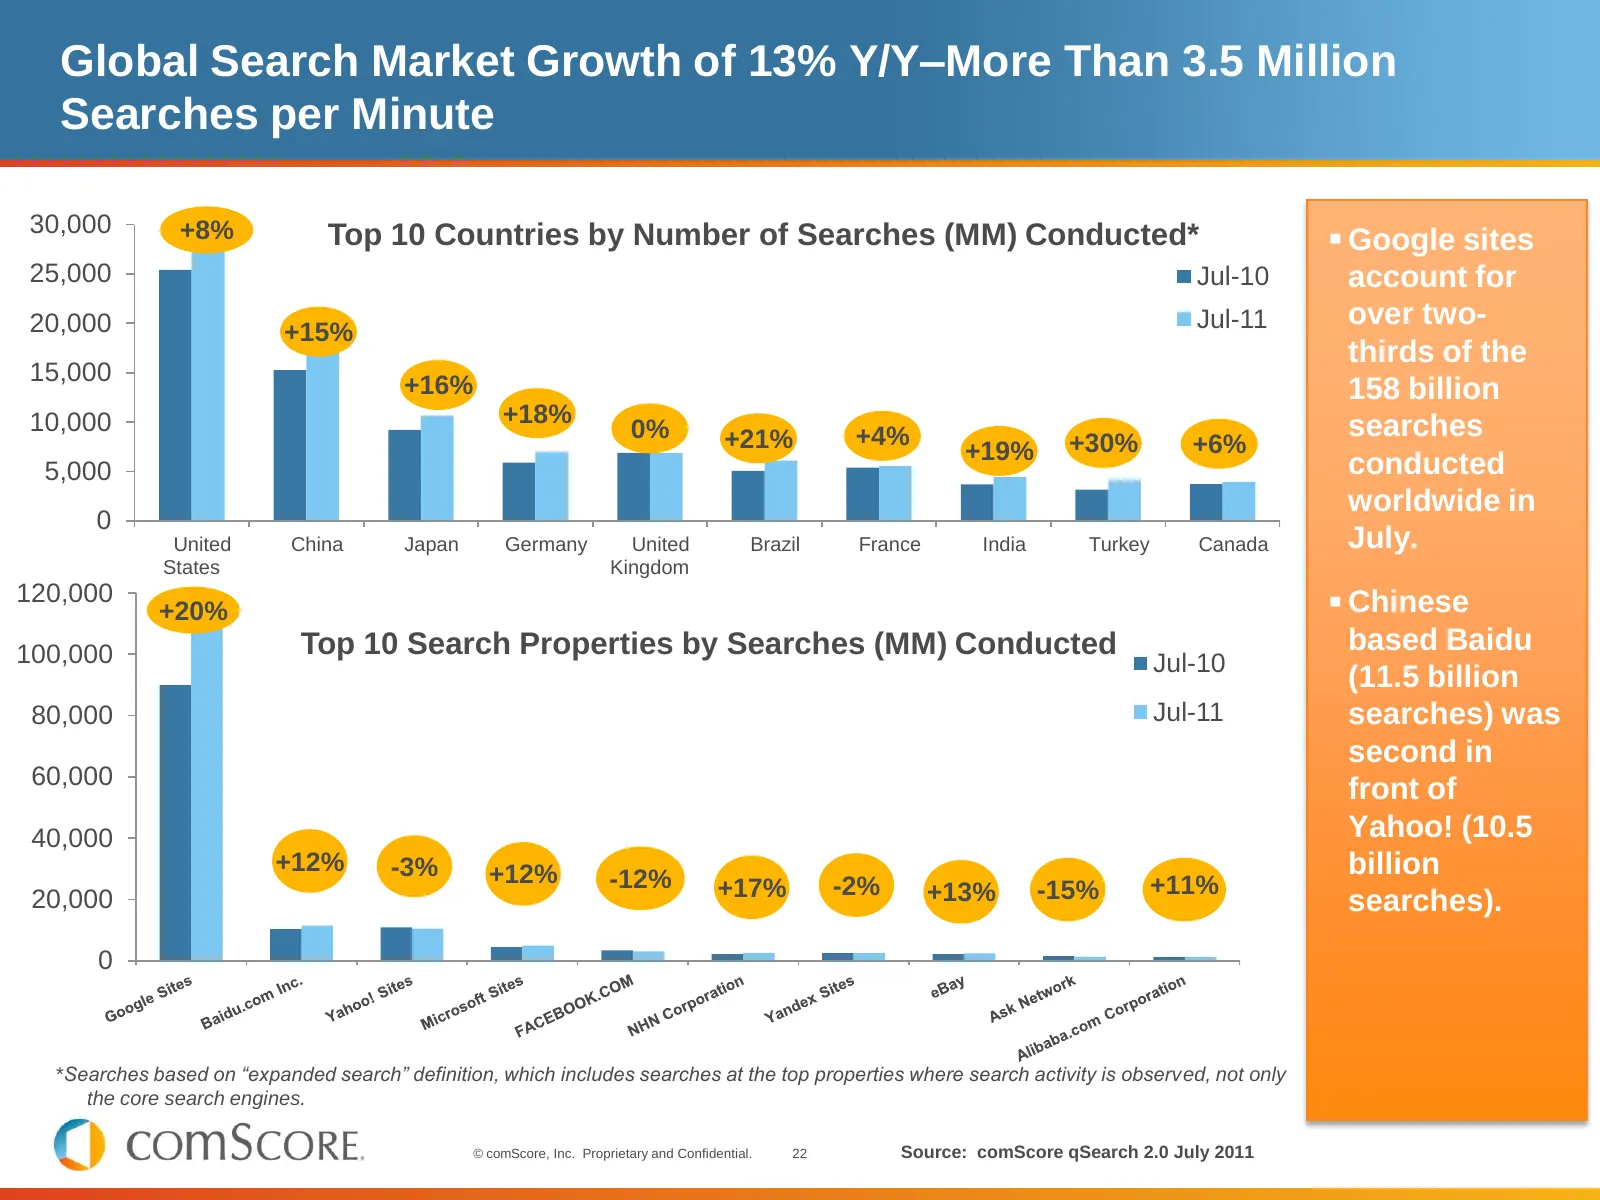
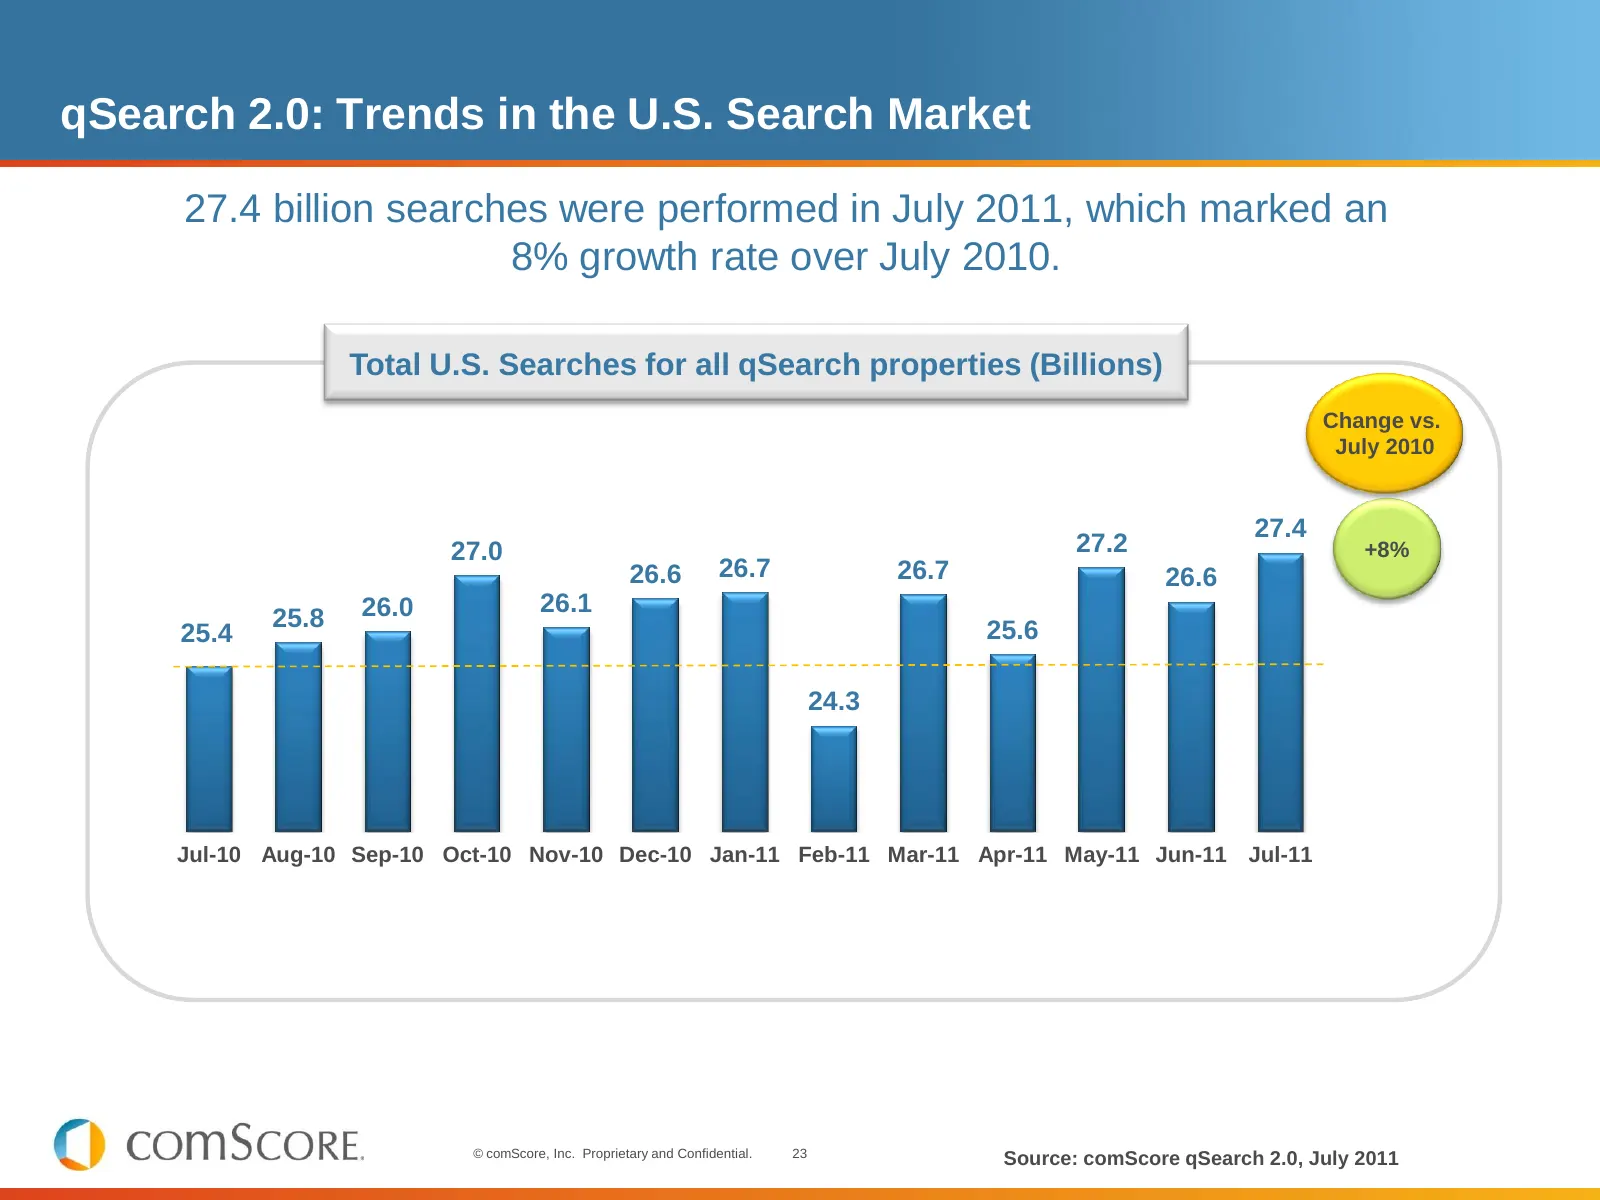
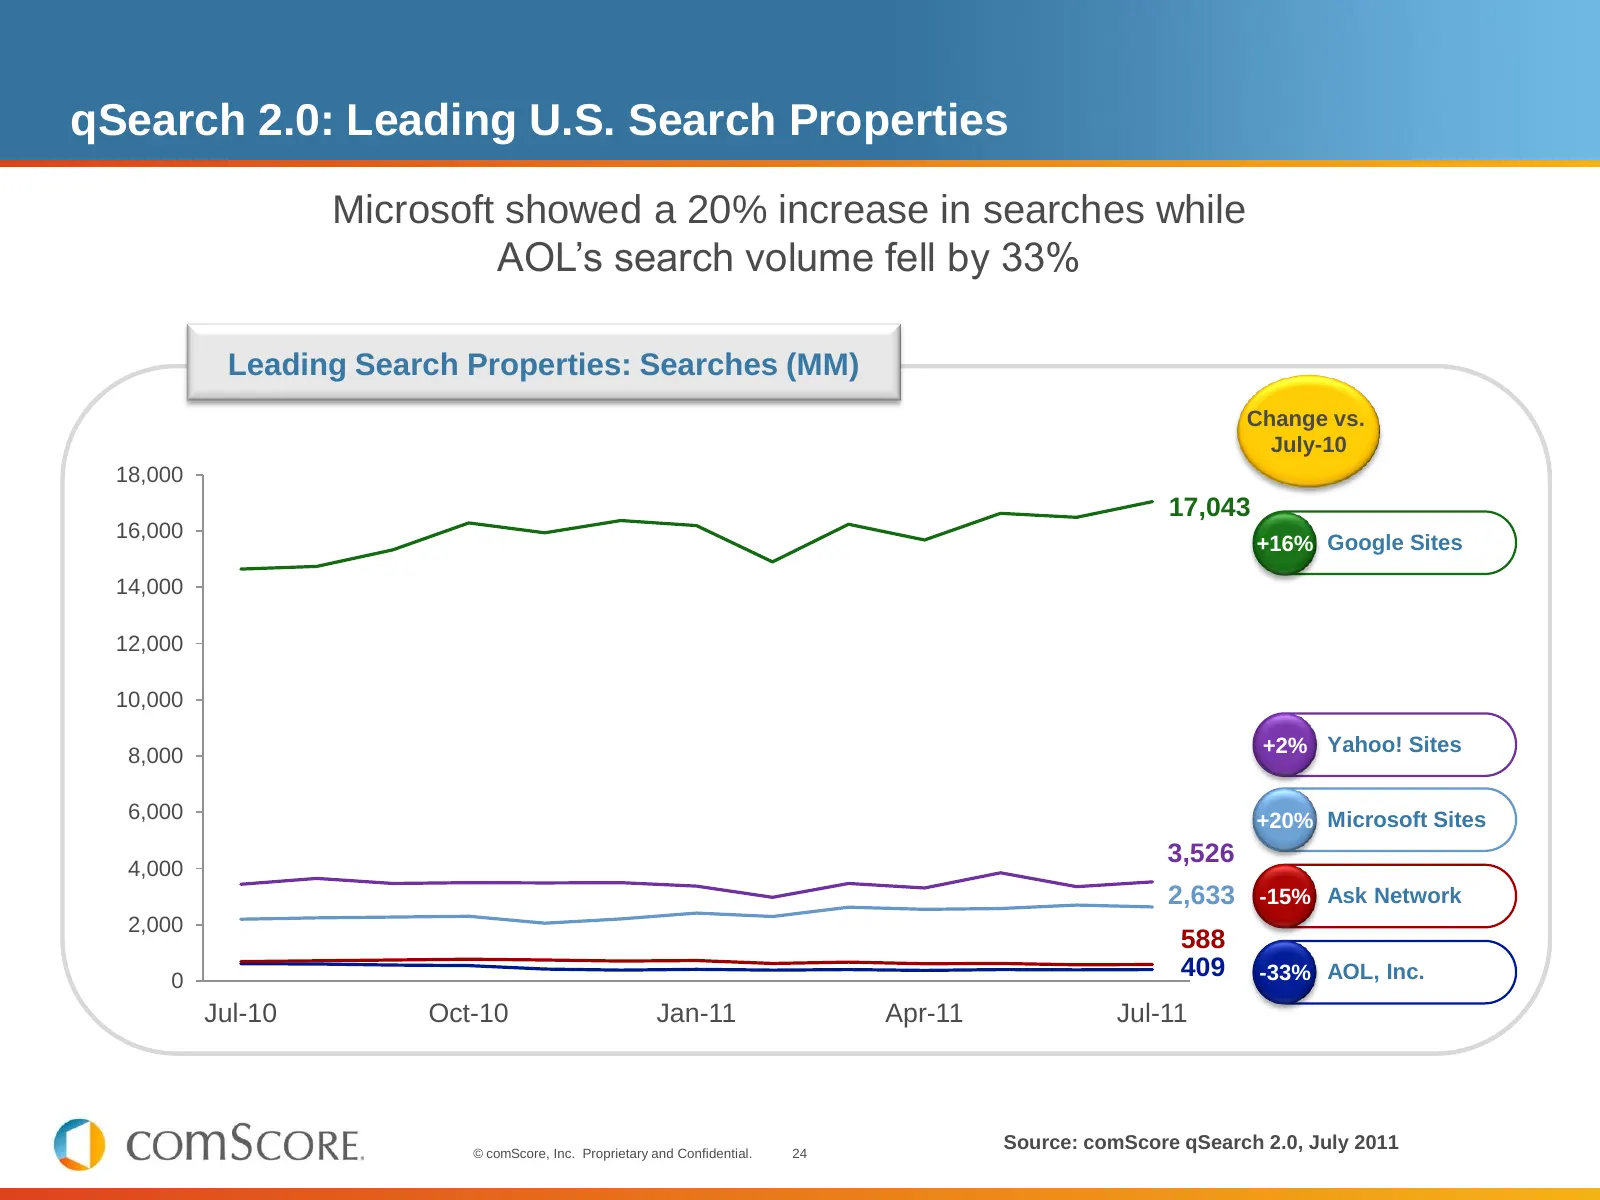
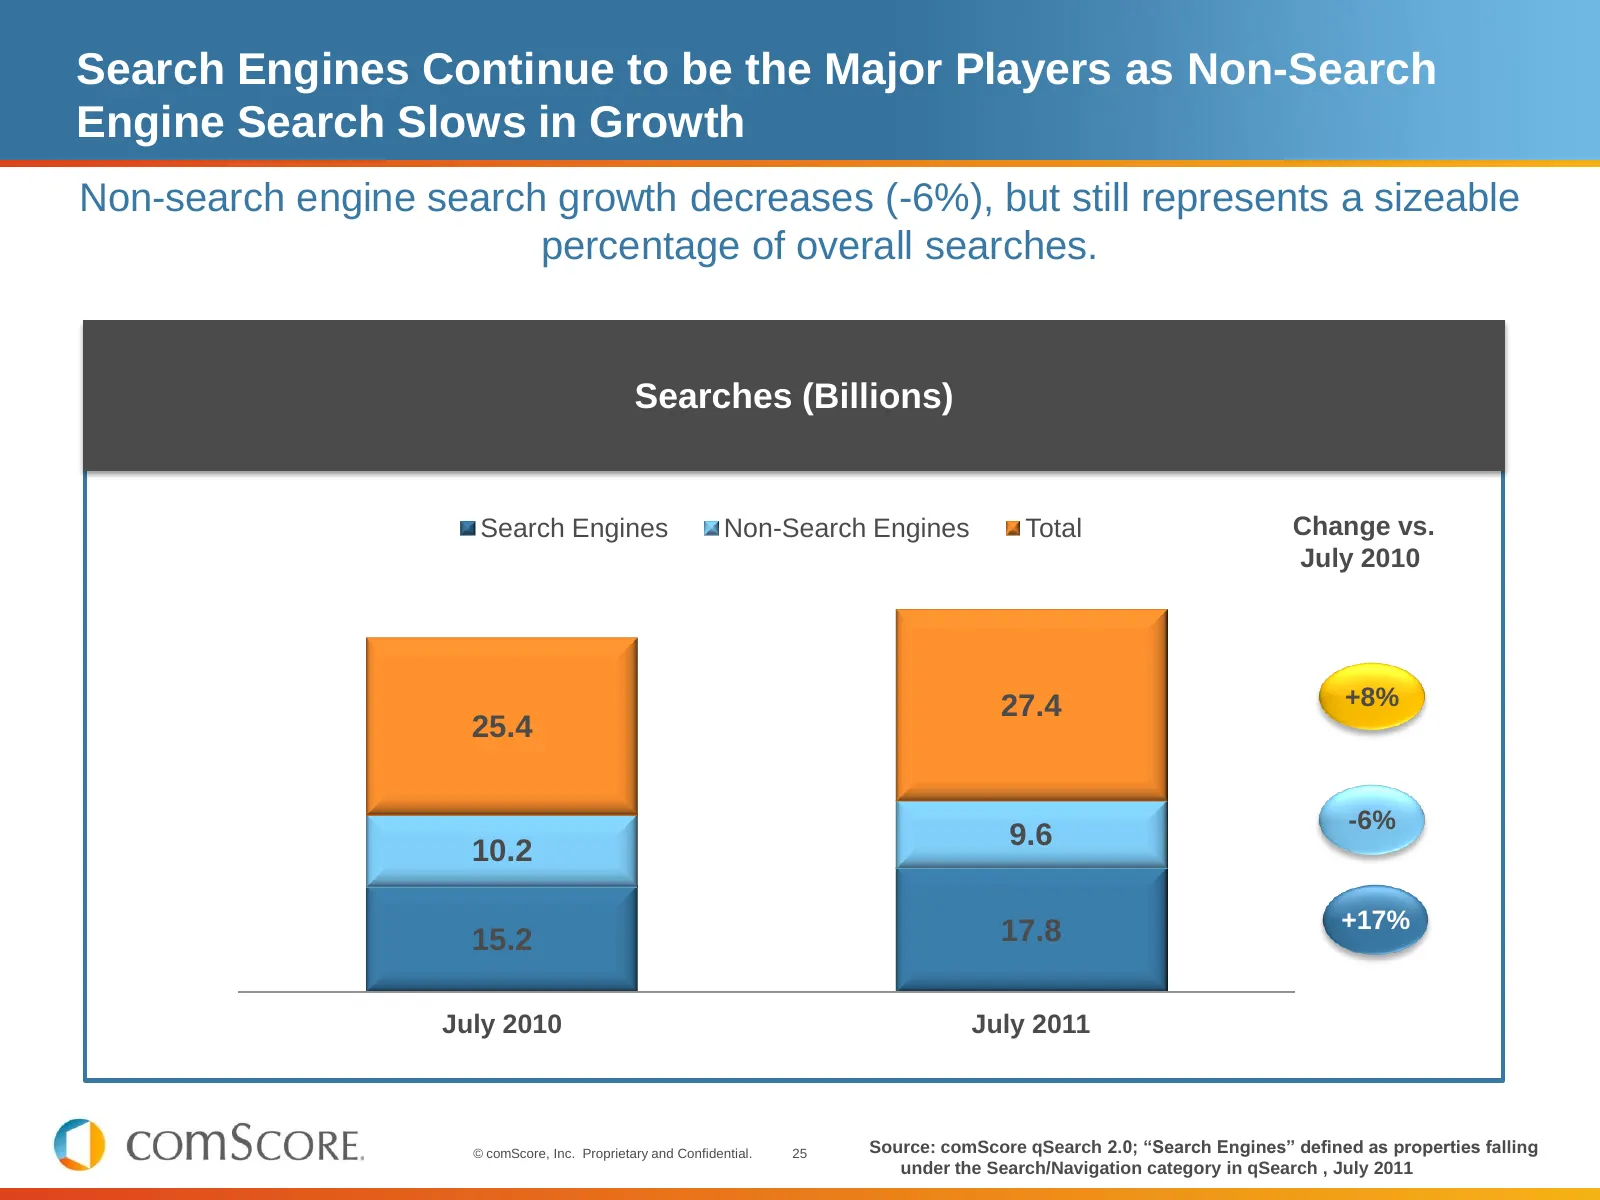
The Search Market Overview: Key Highlights & Trends In July 2011: Today’s Search Landscape by qSearch At 27.4 billion searches in July 2011, the search landscape has grown 8% in the past year. Search growth is driven by increased intensity (+3%). Leading Search Properties Microsoft, Yahoo!, and
Slide 22: Global Search Market Growth of 13% Y/Y
Global Search Market Growth of 13% Y/Y–More Than 3.5 Million Searches per Minute 30,000 +8% Top 10 Countries by Number of Searches (MM) Conducted* Google sites 25,000 Jul-10 account for 20,000 Jul-11 over two- +15% thirds of the 15,000 +16% 158 billion 10,000 +18% 0% +21% +4% searches +19% +30% +6
Slide 23: qSearch 2.0: Trends in the U.S. Search Market
qSearch 2.0: Trends in the U.S. Search Market 27.4 billion searches were performed in July 2011, which marked an 8% growth rate over July 2010. Total U.S. Searches for all qSearch properties (Billions) Change vs. July 2010 27.4 27.0 27.2 +8% 26.6 26.7 26.7 26.6 26.0 26.1 25.8 25.6 25.4 24.3 Jul-10 A
Slide 24: qSearch 2.0: Leading U.S. Search Properties
qSearch 2.0: Leading U.S. Search Properties Microsoft showed a 20% increase in searches while AOL’s search volume fell by 33% Leading Search Properties: Searches (MM) Change vs. July-10 18,000 17,043 16,000 +16% Google Sites 14,000 12,000 10,000 8,000 +2% Yahoo! Sites 6,000 +20% Microsoft Sites 3,52
Slide 25: Search Engines Continue to be the Major Players as Non-Search Engine Search Slows
Search Engines Continue to be the Major Players as Non-Search Engine Search Slows in Growth Non-search engine search growth decreases (-6%), but still represents a sizeable percentage of overall searches. Searches (Billions) Search Engines Non-Search Engines Total Change vs. July 2010 27.4 +8% 25.4
Slide 26: qSearch 2.0: Alternative U.S. Search Properties
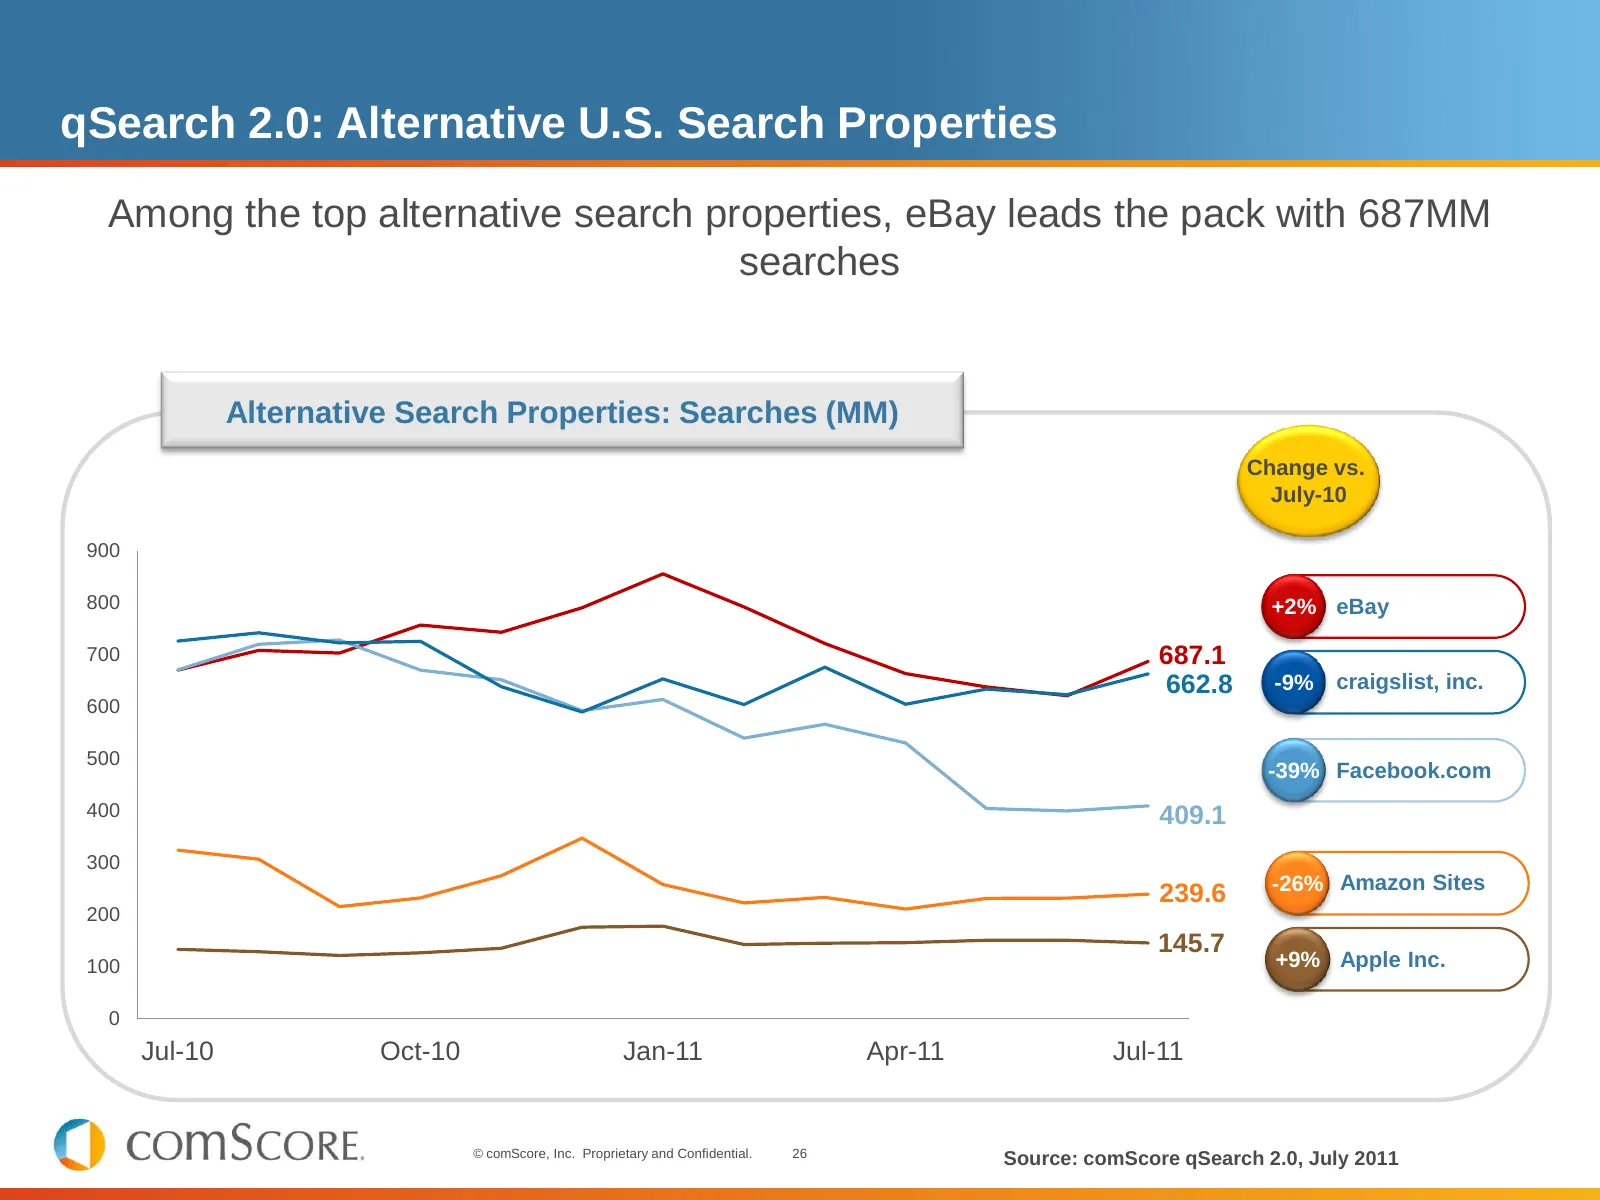
qSearch 2.0: Alternative U.S. Search Properties Among the top alternative search properties, eBay leads the pack with 687MM searches Alternative Search Properties: Searches (MM) Change vs. July-10 900 800 +2% eBay 700 687.1 662.8 -9% craigslist, inc. 600 500 -39% Facebook.com 400 409.1 300 239.6 -26
Slide 27: The Great East Coast Earthquake of 2011
The Great East Coast Earthquake of 2011 An animated look at U.S. Internet usage by minute between the hours of 1:40pm and 3:00pm comScore Voices: Internet Seismometer Off the Charts from Yesterday’s Quake © comScore, Inc. Proprietary and Confidential. 27 http://blog.comscore.com/2011/08/internet_sei
Slide 28: The Great East Coast Earthquake of 2011
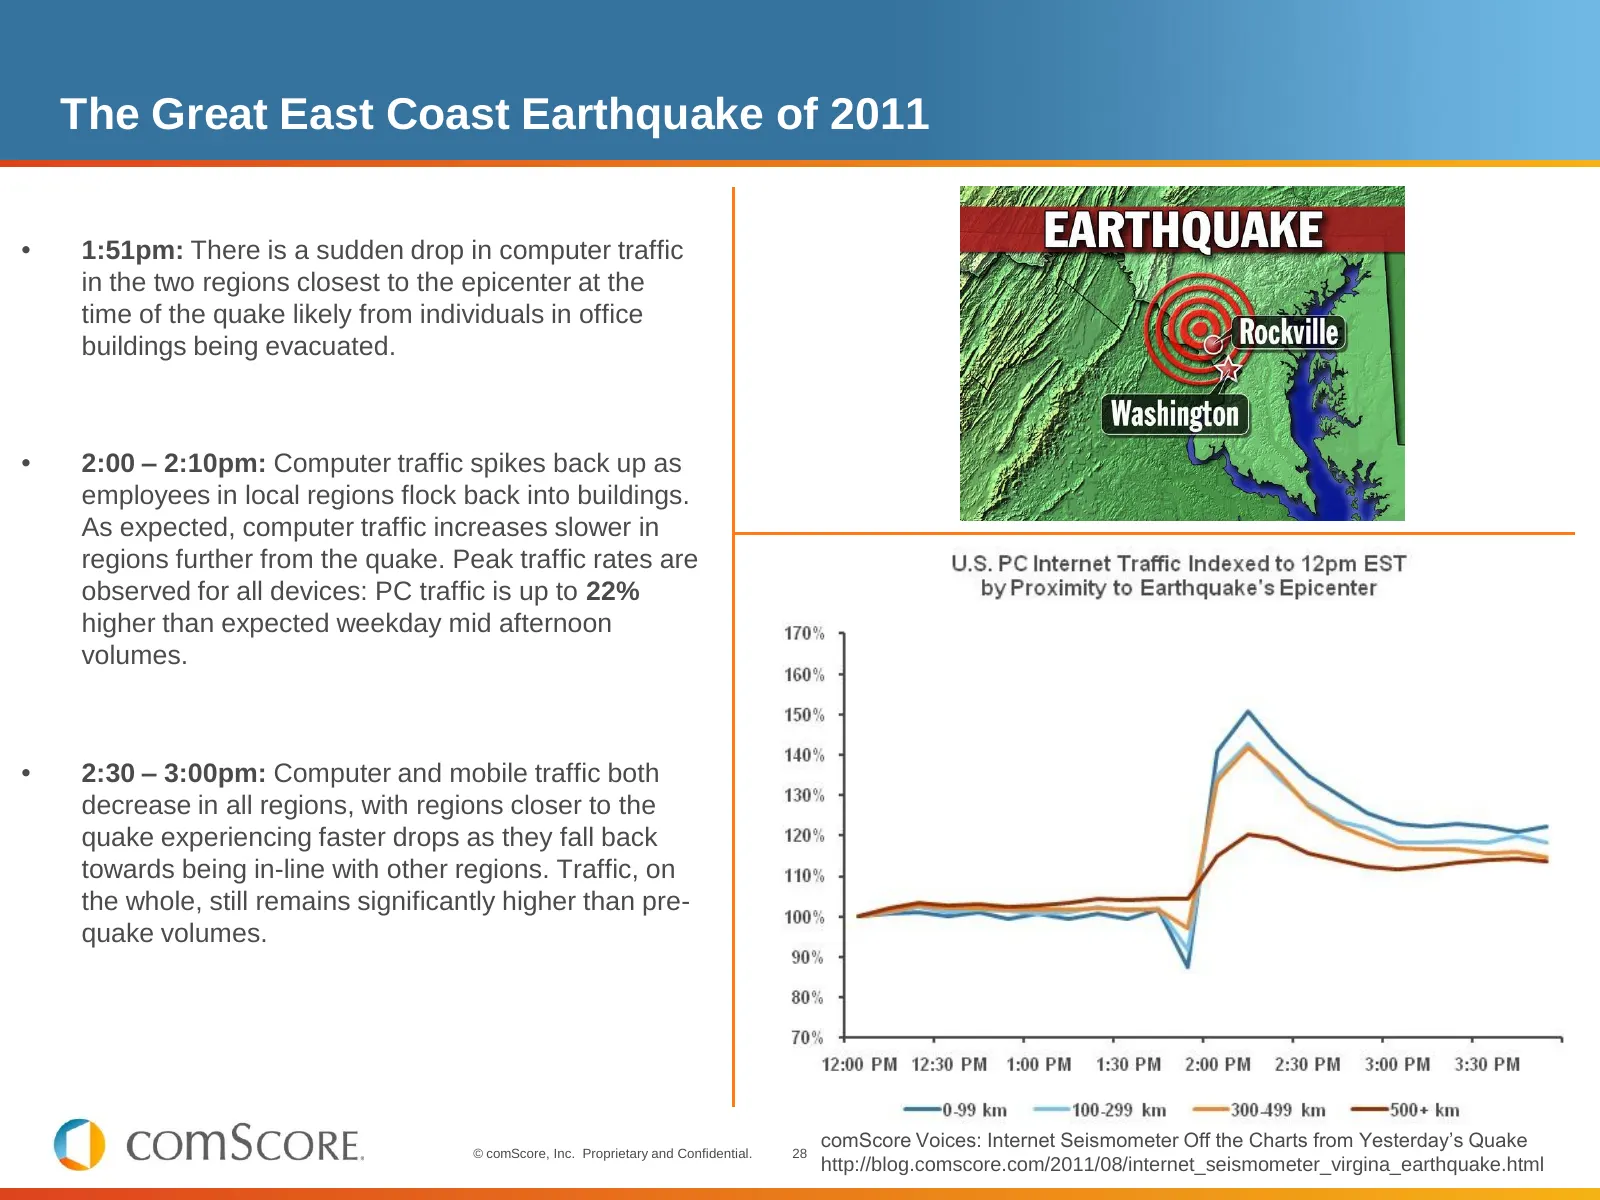
The Great East Coast Earthquake of 2011 • 1:51pm: There is a sudden drop in computer traffic in the two regions closest to the epicenter at the time of the quake likely from individuals in office buildings being evacuated. • 2:00 – 2:10pm: Computer traffic spikes back up as employees in local region
Slide 29: Agenda
Agenda Worldwide Context US Vital Signs State of the Internet – Video – Search – Mobile – eCommerce Monetization © comScore, Inc. Proprietary and Confidential. 29
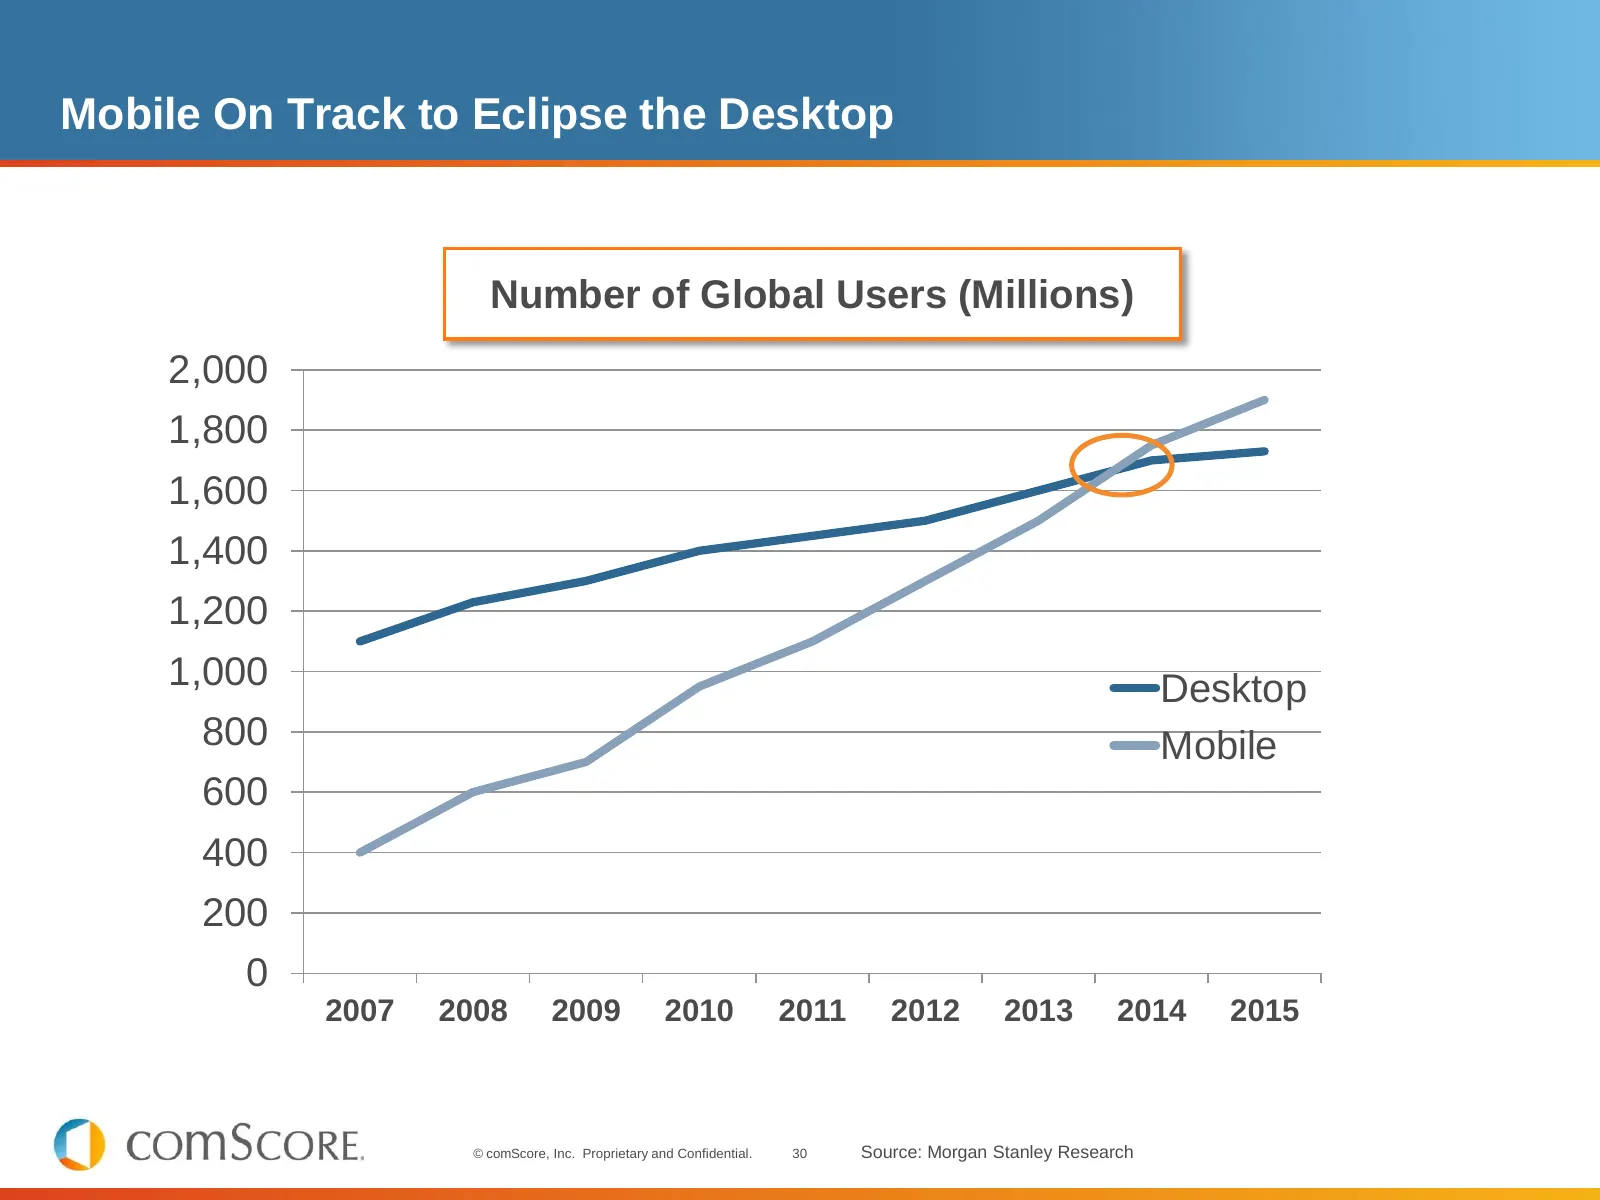
Slide 30: Mobile On Track to Eclipse the Desktop
Mobile On Track to Eclipse the Desktop Number of Global Users (Millions) 2,000 1,800 1,600 1,400 1,200 1,000 Desktop 800 Mobile 600 400 200 0 2007 2008 2009 2010 2011 2012 2013 2014 2015 © comScore, Inc. Proprietary and Confidential. 30 Source: Morgan Stanley Research
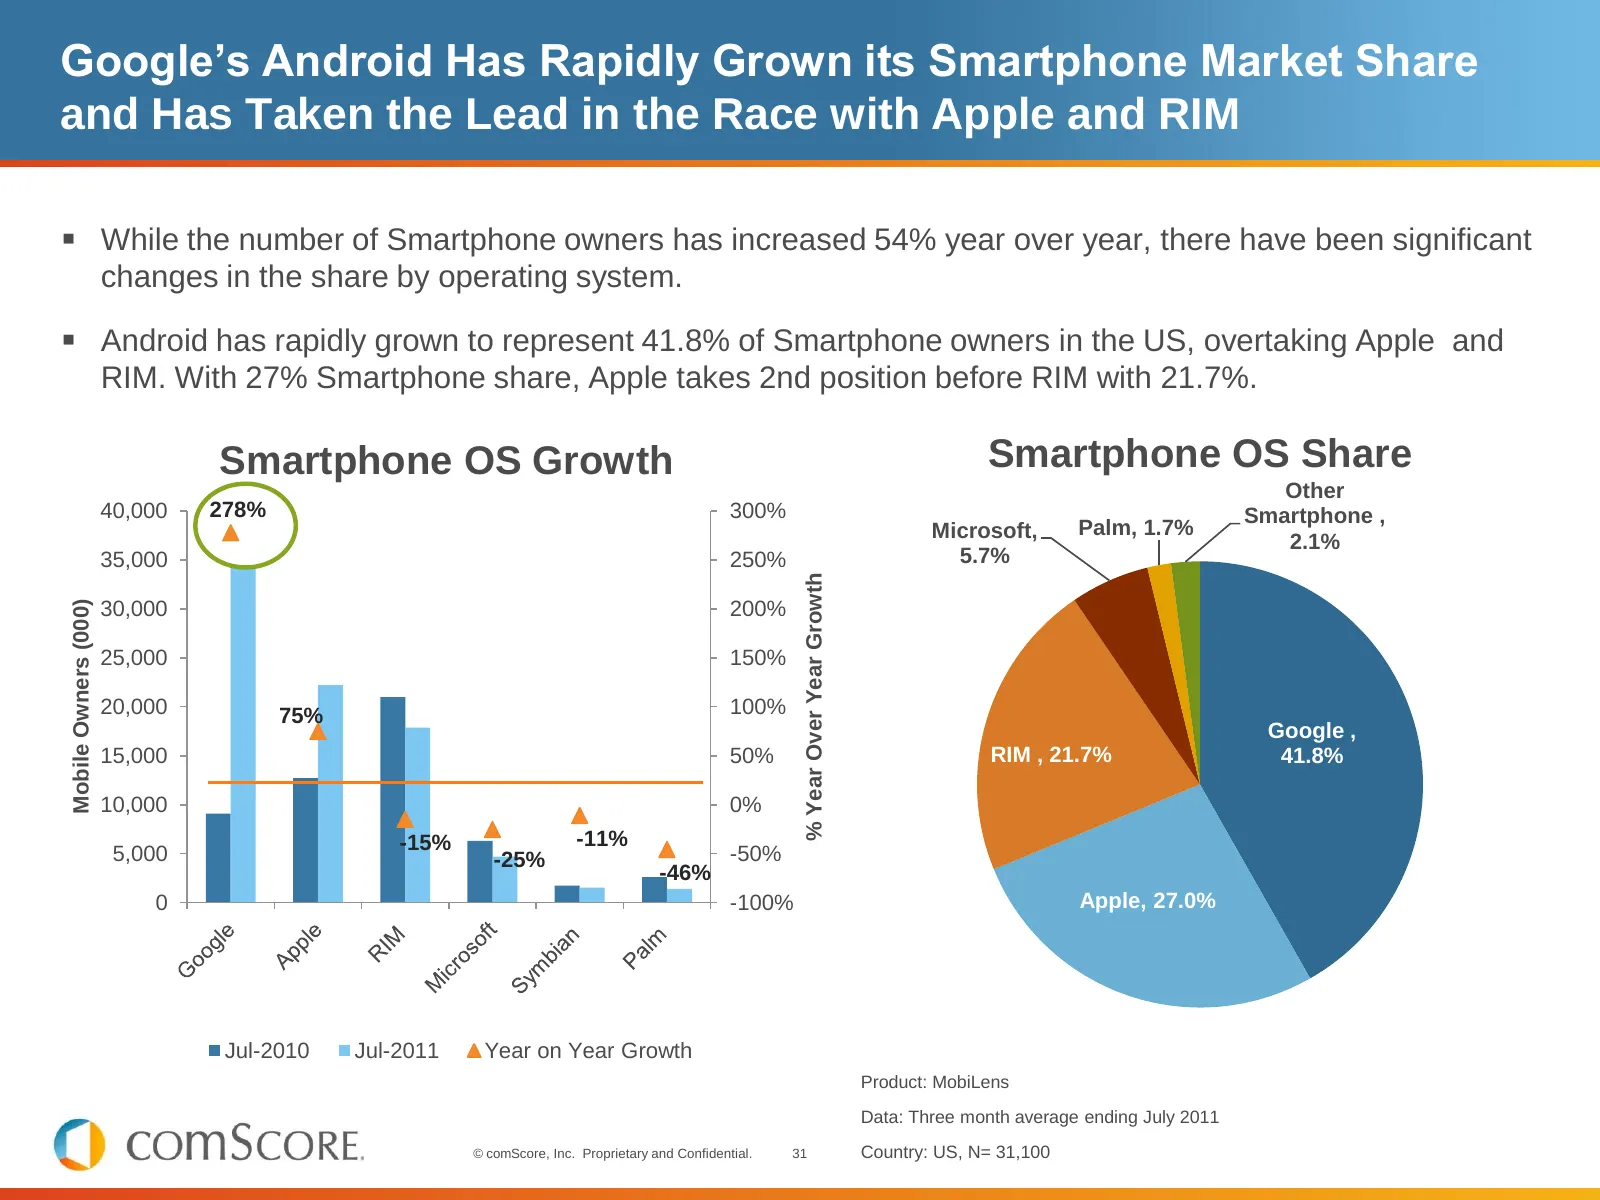
Slide 31: Google's Android Has Rapidly Grown its Smartphone Market Share
Google’s Android Has Rapidly Grown its Smartphone Market Share and Has Taken the Lead in the Race with Apple and RIM While the number of Smartphone owners has increased 54% year over year, there have been significant changes in the share by operating system. Android has rapidly grown to represen
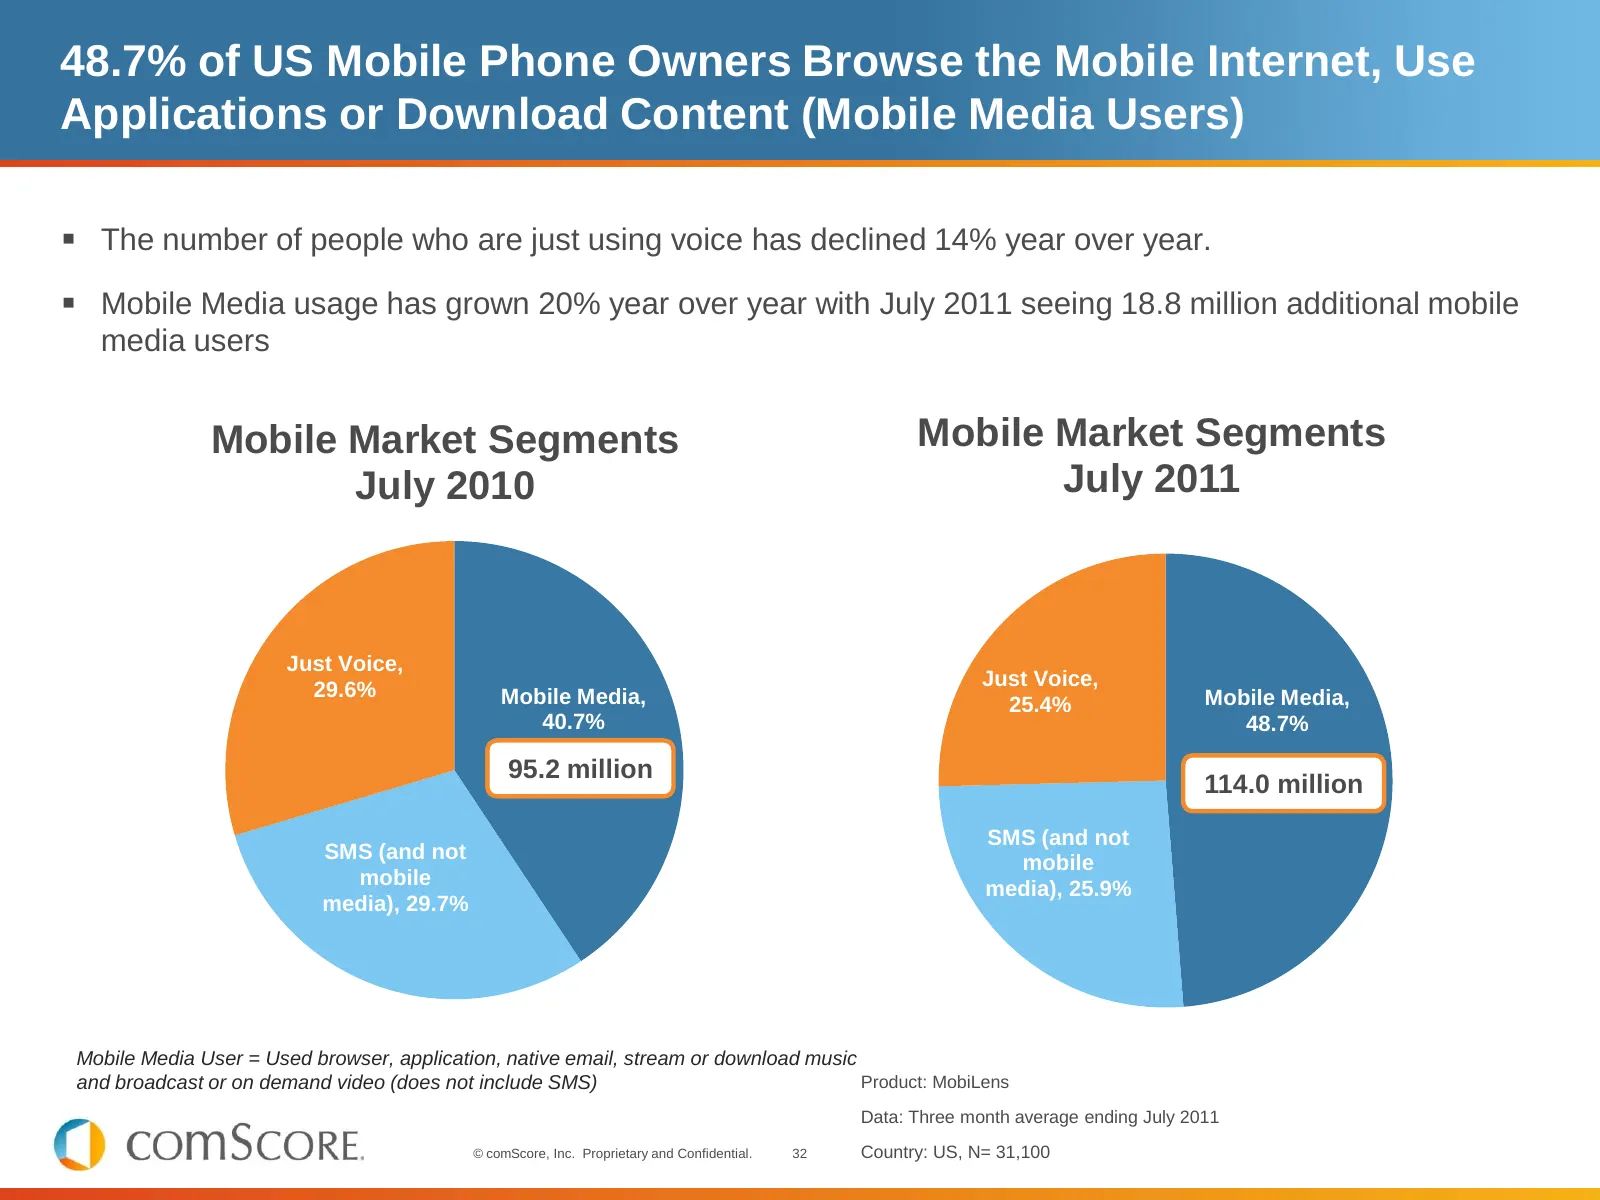
Slide 32: 48.7% of US Mobile Phone Owners Browse the Mobile Internet, Use Applications or Download Content
48.7% of US Mobile Phone Owners Browse the Mobile Internet, Use Applications or Download Content (Mobile Media Users) The number of people who are just using voice has declined 14% year over year. Mobile Media usage has grown 20% year over year with July 2011 seeing 18.8 million additional mobil
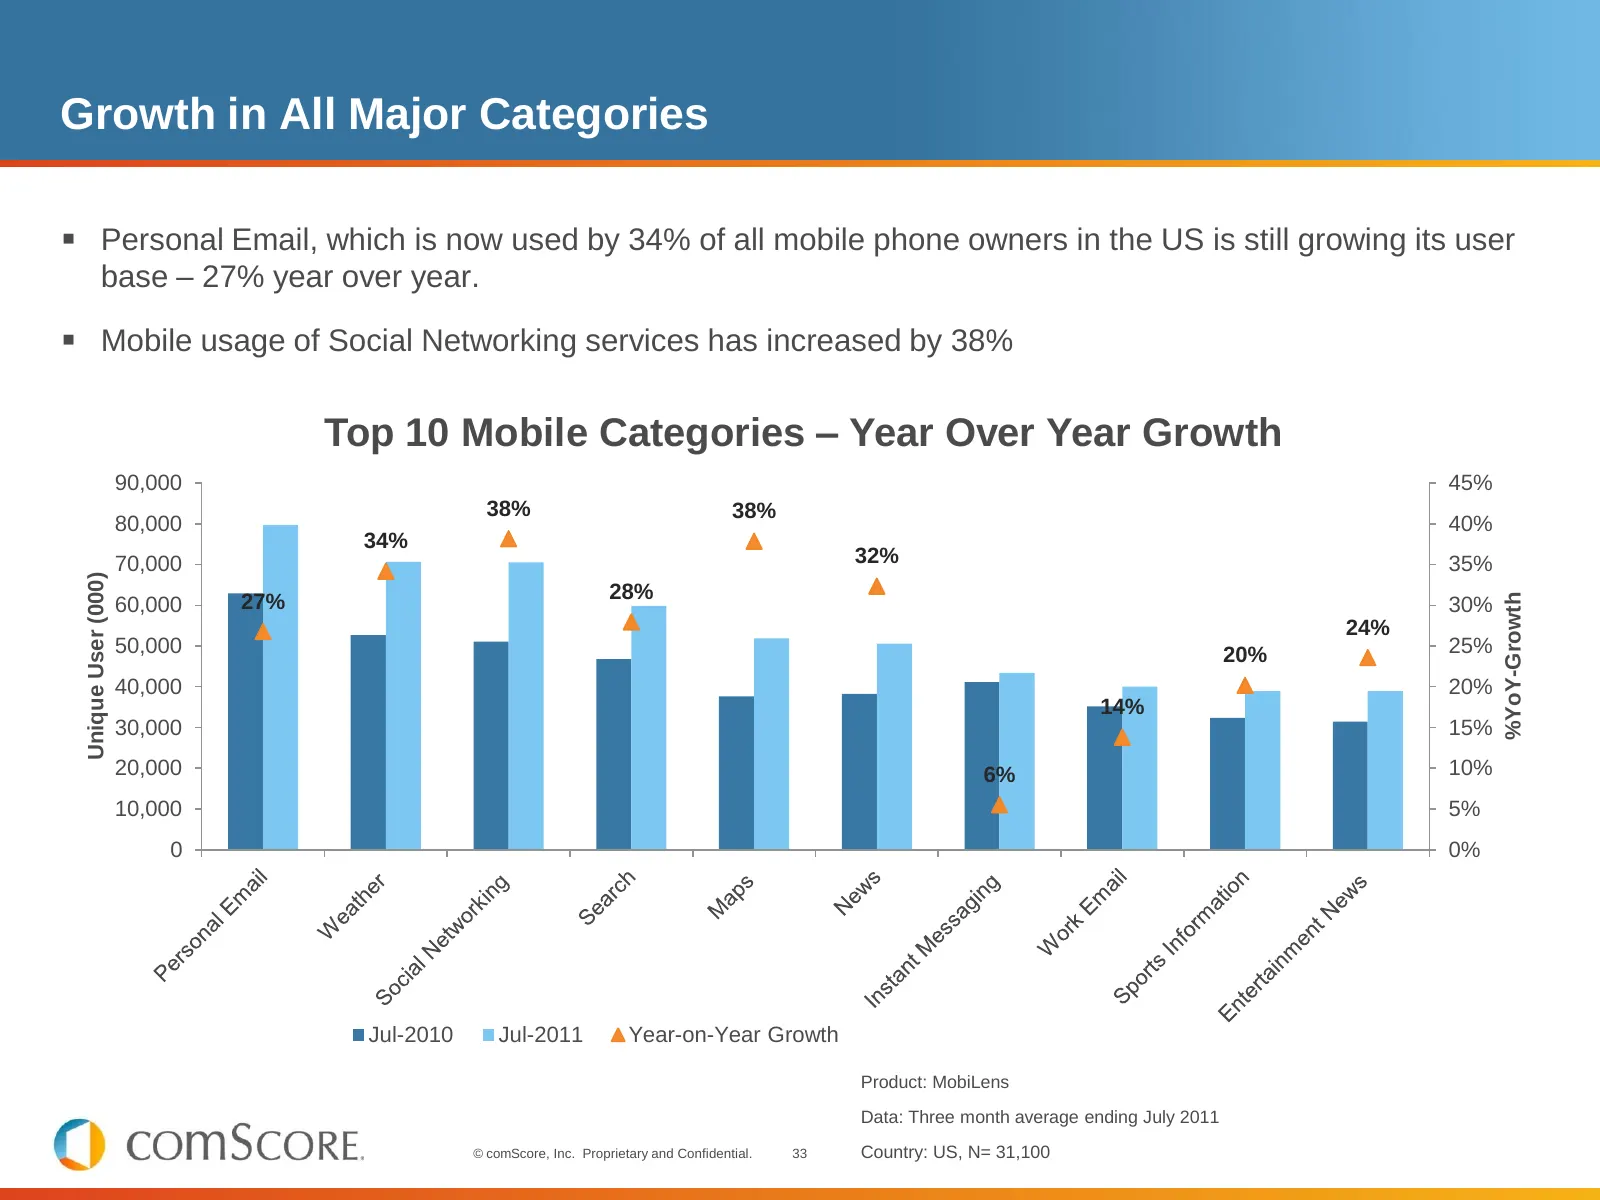
Slide 33: Growth in All Major Categories
Growth in All Major Categories Personal Email, which is now used by 34% of all mobile phone owners in the US is still growing its user base – 27% year over year. Mobile usage of Social Networking services has increased by 38% Top 10 Mobile Categories – Year Over Year Growth 90,000 45% 38% 38% 80
Slide 34: Social Networking Services With Check-In Functions on the Rise
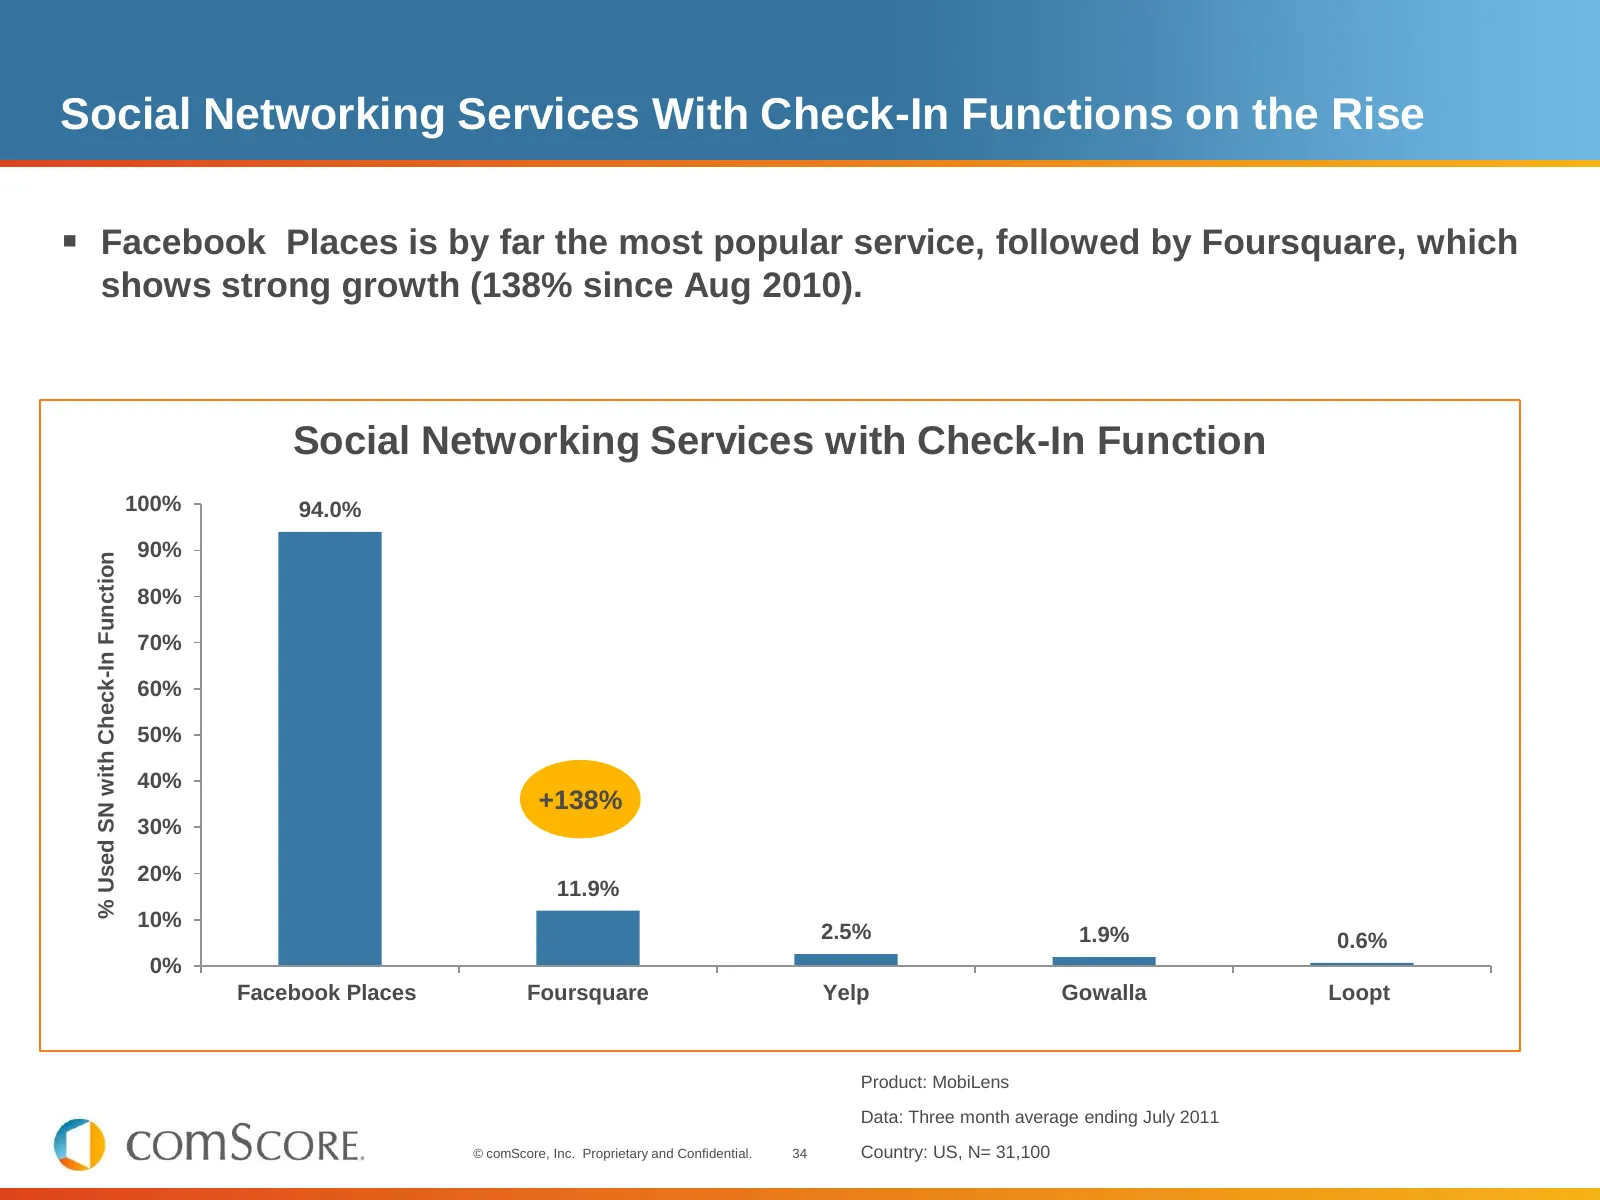
Social Networking Services With Check-In Functions on the Rise Facebook Places is by far the most popular service, followed by Foursquare, which shows strong growth (138% since Aug 2010). Social Networking Services with Check-In Function 100% 94.0% 90% % Used SN with Check-In Function 80% 70% 60%
Slide 35: Location is Key
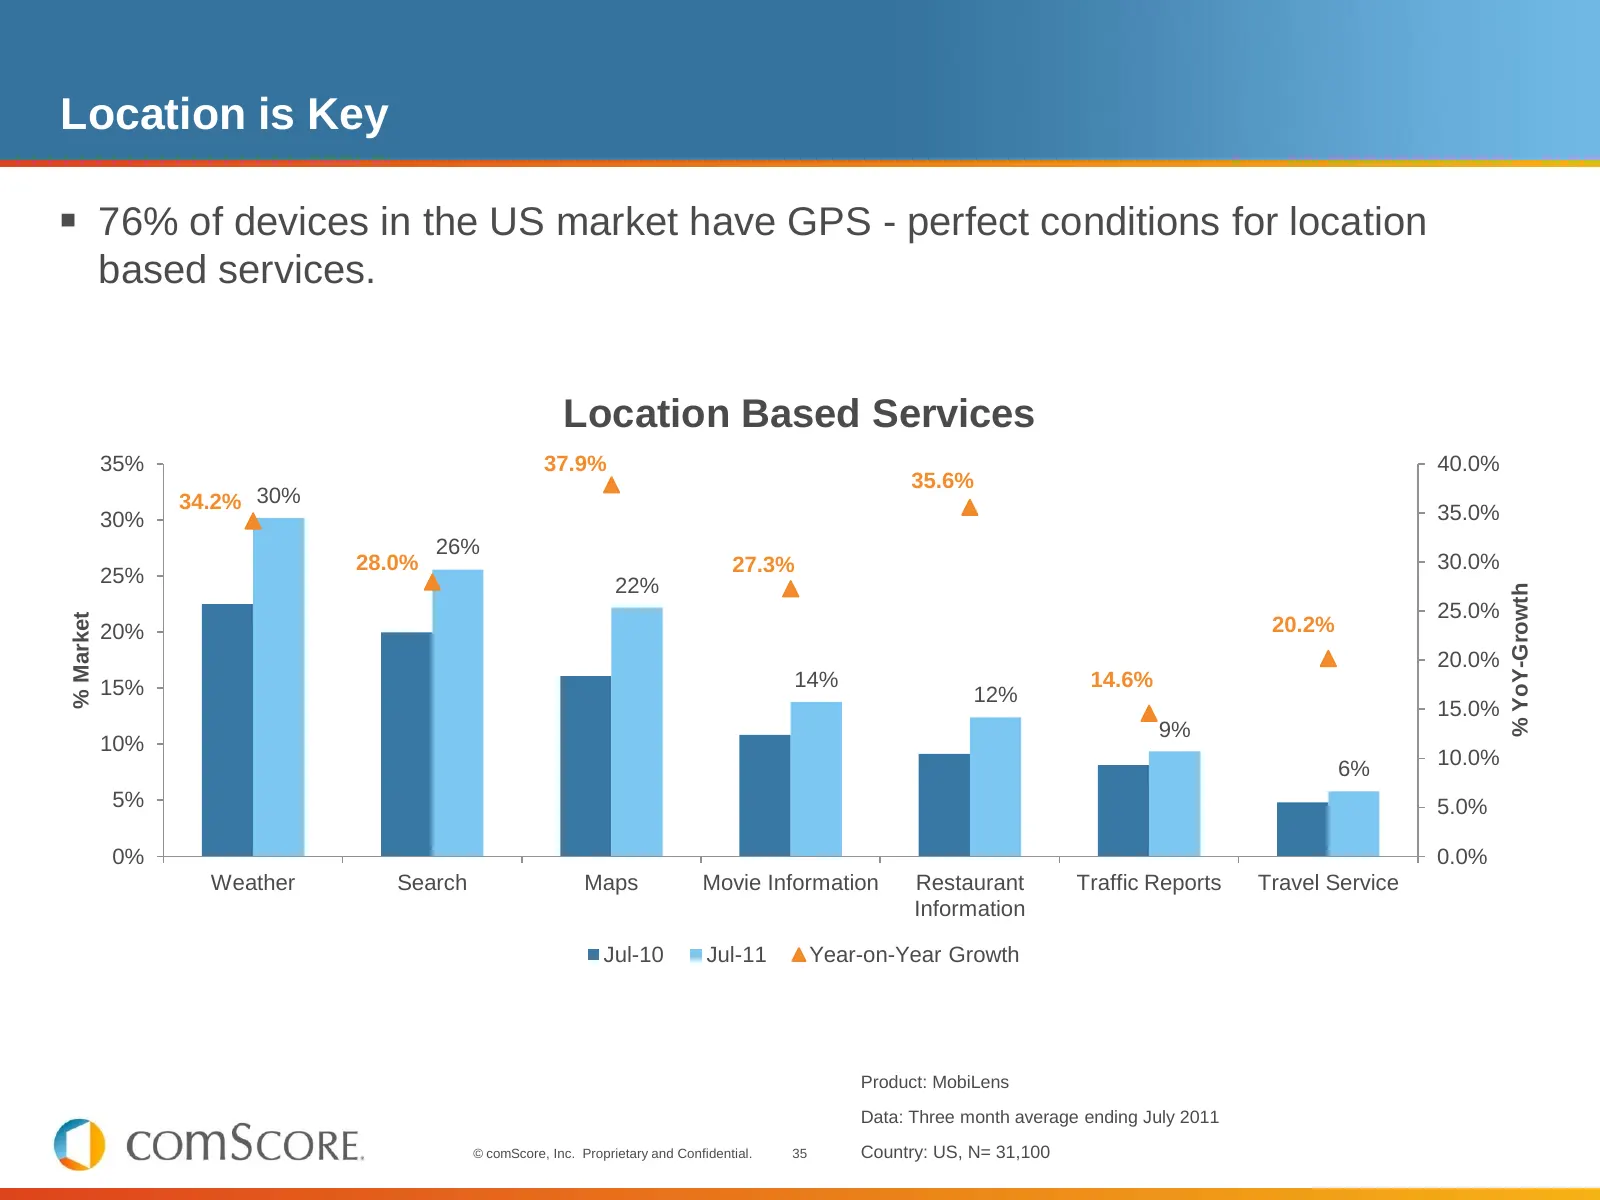
Location is Key 76% of devices in the US market have GPS - perfect conditions for location based services. Location Based Services 35% 37.9% 40.0% 35.6% 34.2% 30% 35.0% 30% 26% 28.0% 27.3% 30.0% 25% 22% % YoY-Growth 25.0% % Market 20% 20.2% 20.0% 15% 14% 14.6% 12% 15.0% 9% 10% 6% 10.0% 5% 5.0% 0%
Slide 36: The Mobile Phone as Constant Everyday Companion
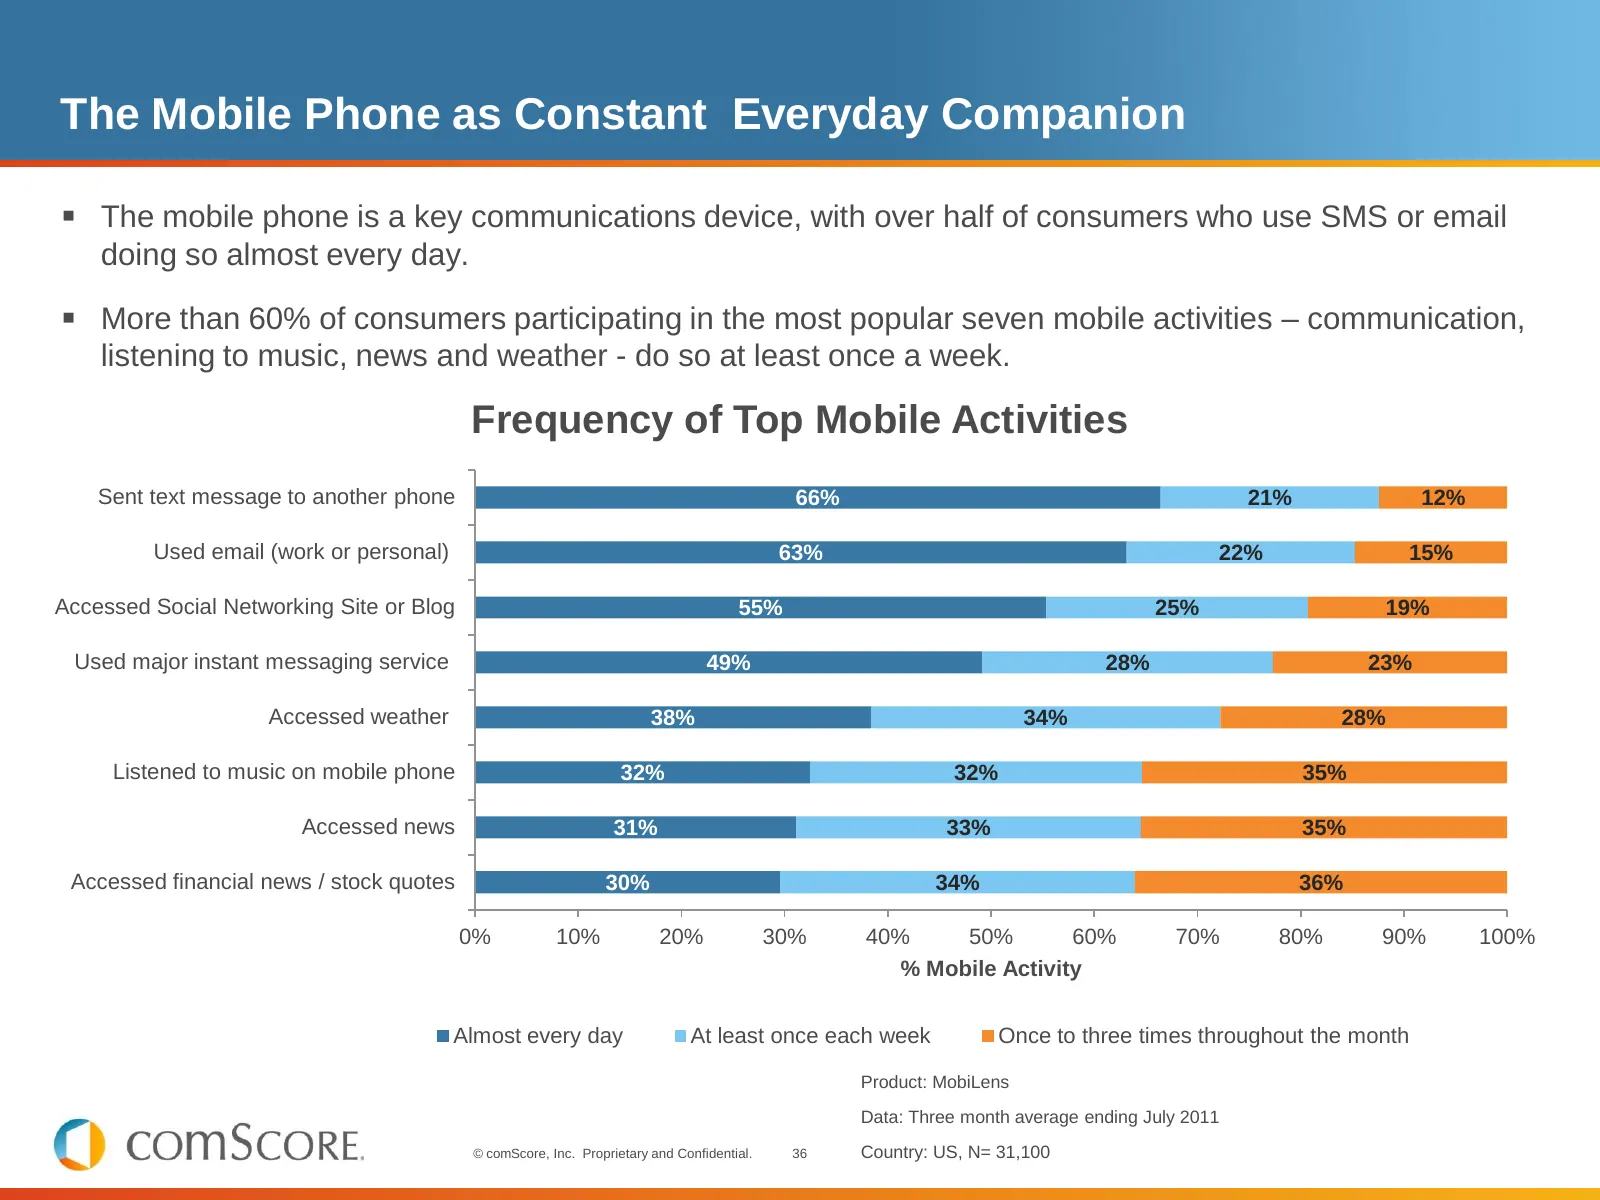
The Mobile Phone as Constant Everyday Companion The mobile phone is a key communications device, with over half of consumers who use SMS or email doing so almost every day. More than 60% of consumers participating in the most popular seven mobile activities – communication, listening to music, n
Slide 37: Agenda
Agenda Worldwide Context US Vital Signs State of the Internet – Video – Search – Mobile – eCommerce Monetization © comScore, Inc. Proprietary and Confidential. 37
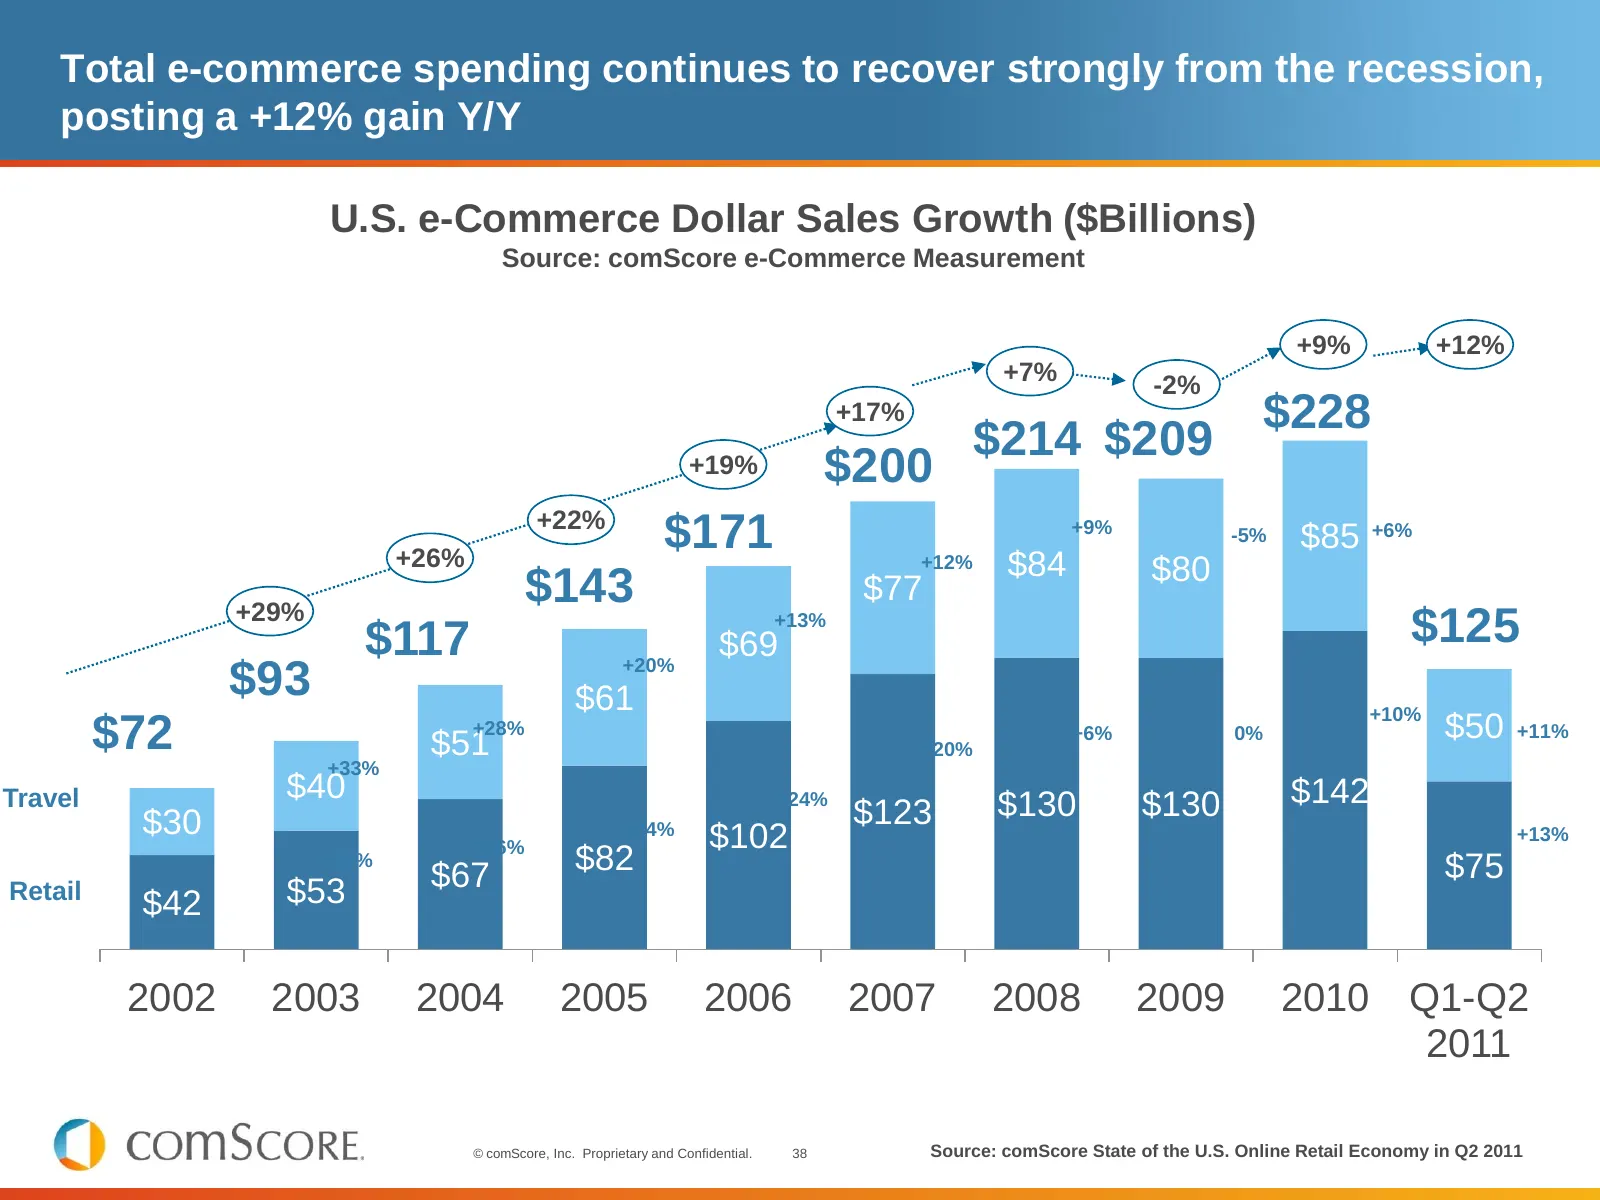
Slide 38: Total e-commerce spending continues to recover strongly from the recession
Total e-commerce spending continues to recover strongly from the recession, posting a +12% gain Y/Y U.S. e-Commerce Dollar Sales Growth ($Billions) Source: comScore e-Commerce Measurement +9% +12% +7% -2% +17% $228 $214 $209 +19% $200 +22% +26% $171 +9% -5% $85 +6% +12% $84 $80 +29% $143 $77 $117 $6
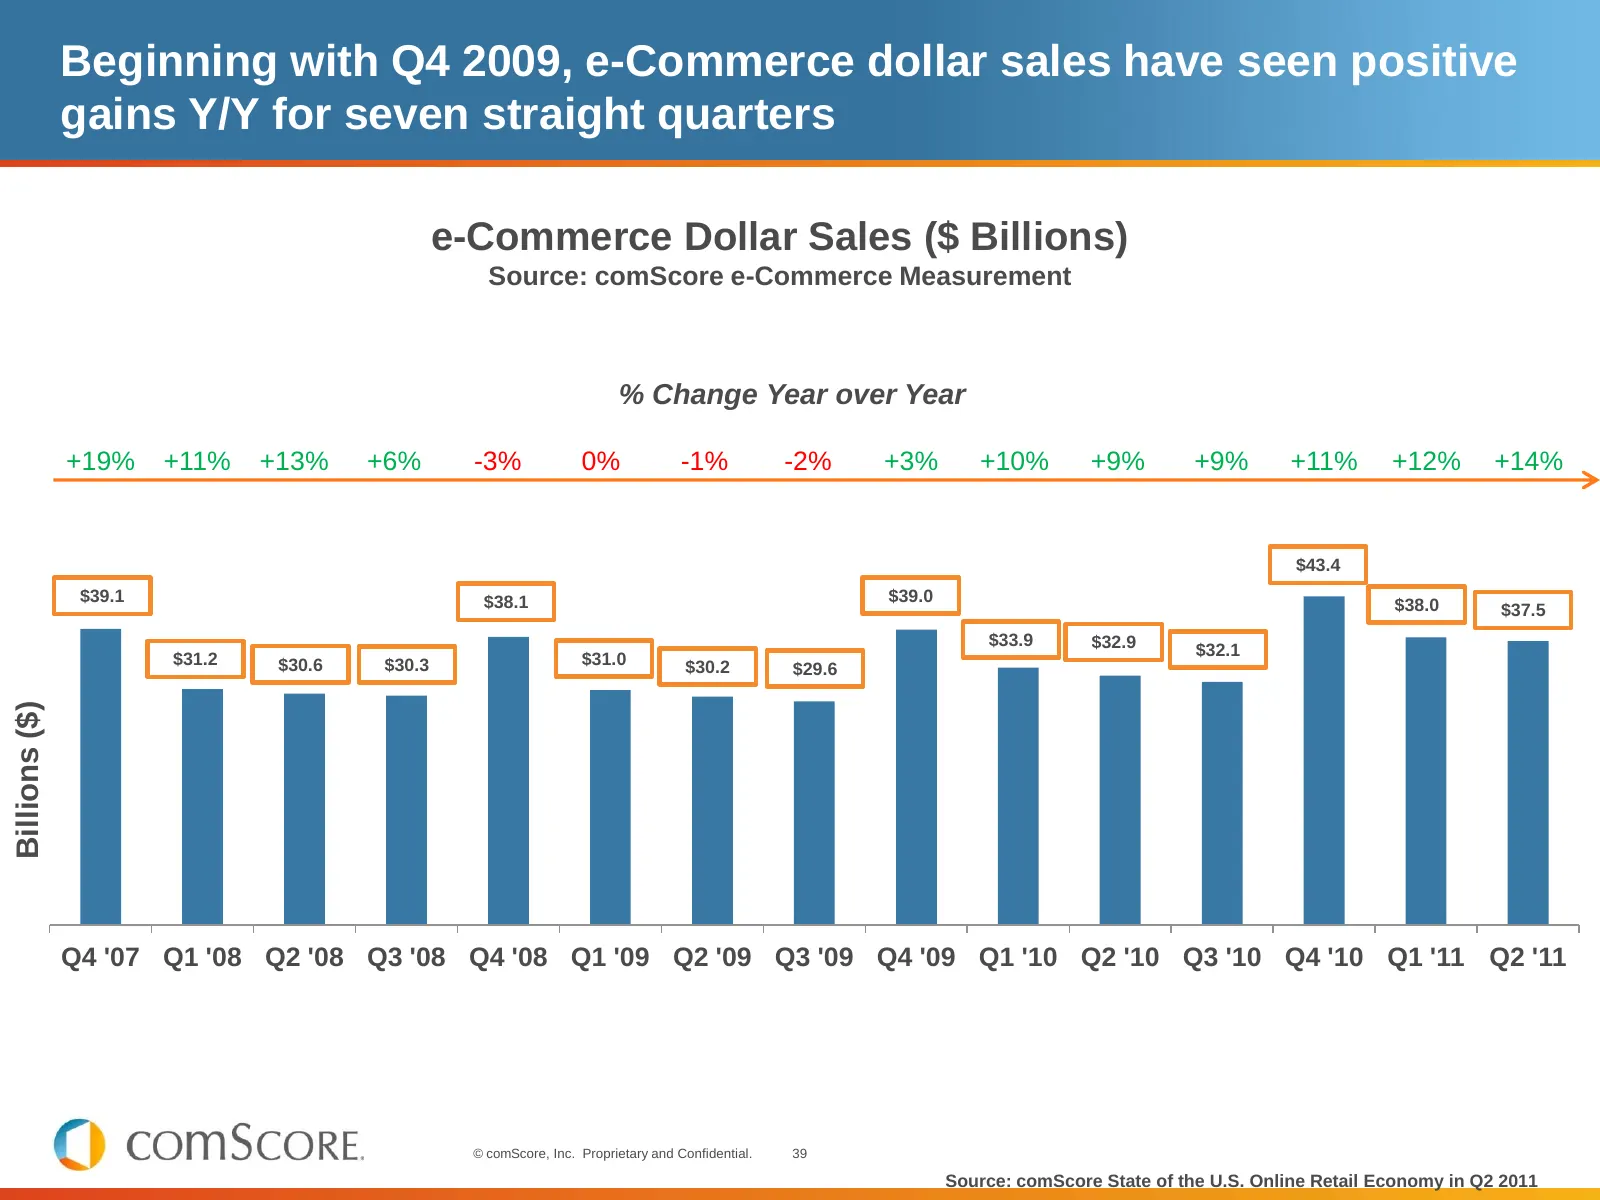
Slide 39: e-Commerce dollar sales positive gains Y/Y for seven straight quarters
Beginning with Q4 2009, e-Commerce dollar sales have seen positive gains Y/Y for seven straight quarters e-Commerce Dollar Sales ($ Billions) Source: comScore e-Commerce Measurement % Change Year over Year +19% +11% +13% +6% -3% 0% -1% -2% +3% +10% +9% +9% +11% +12% +14% $43.4 $39.1 $38.1 $39.0 $38.
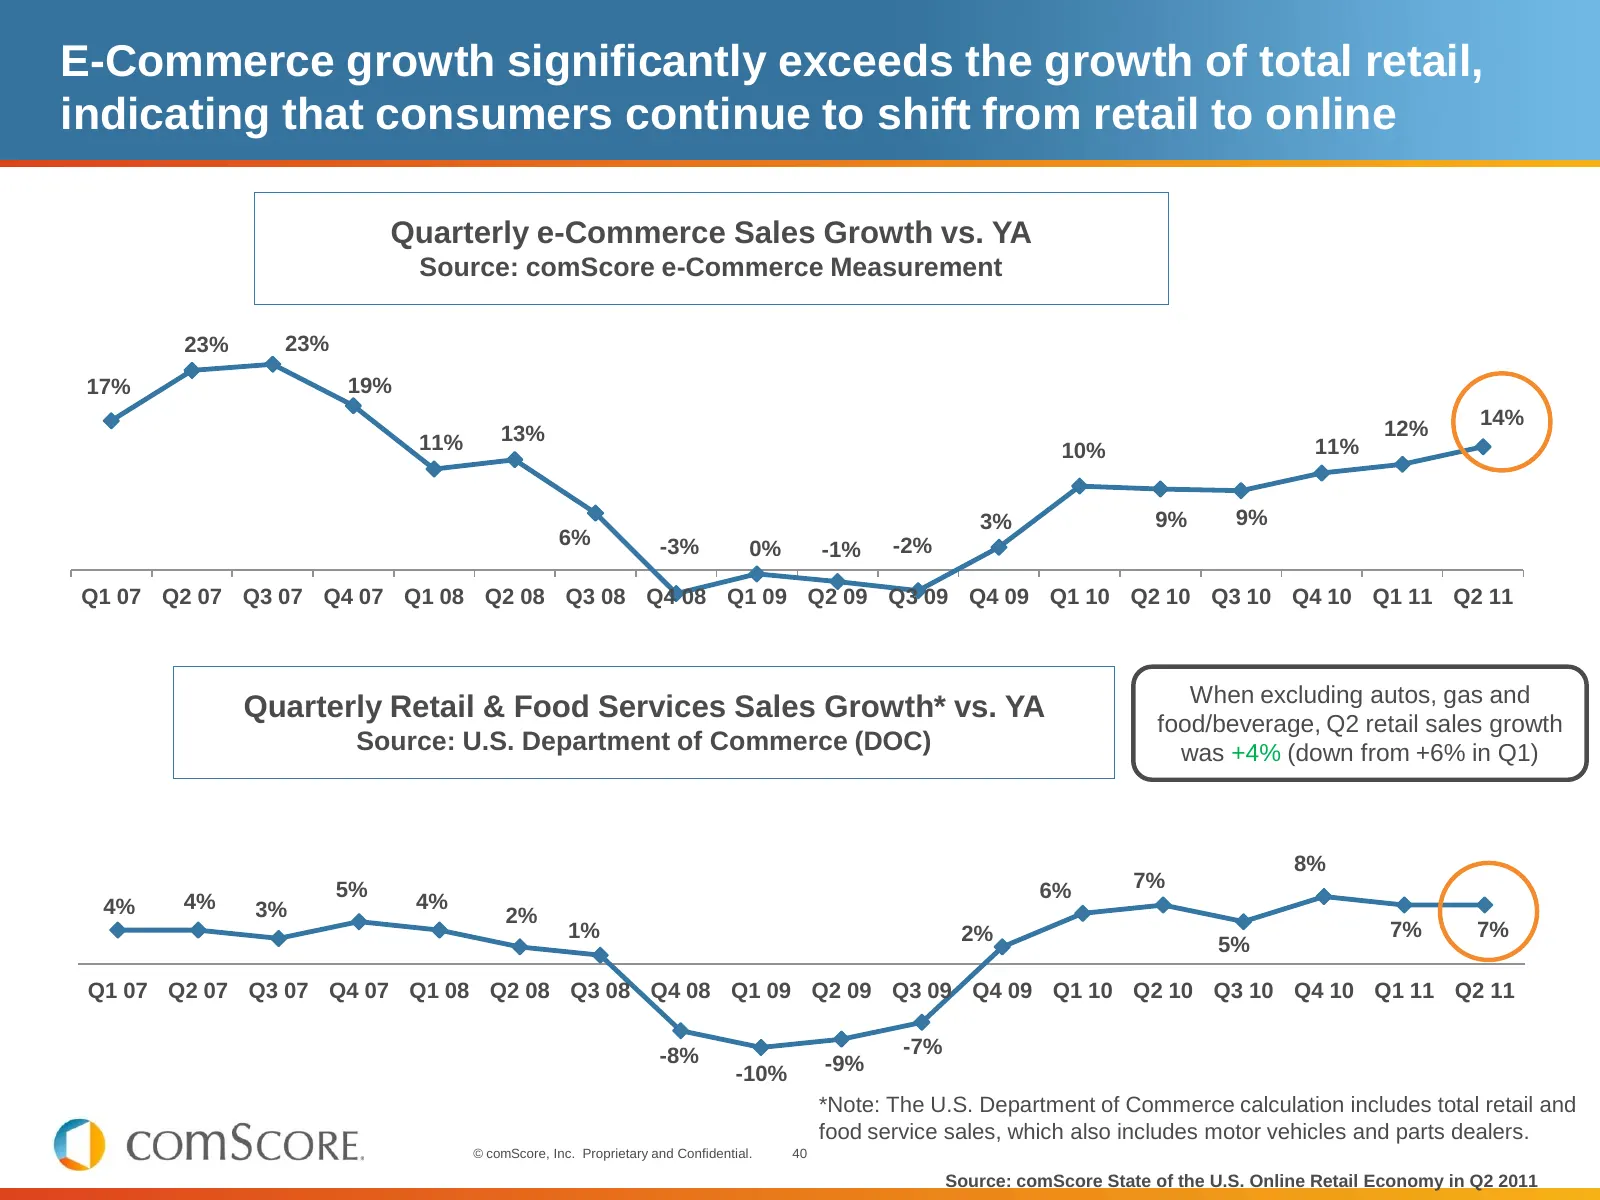
Slide 40: E-Commerce growth significantly exceeds the growth of total retail
E-Commerce growth significantly exceeds the growth of total retail, indicating that consumers continue to shift from retail to online Quarterly e-Commerce Sales Growth vs. YA Source: comScore e-Commerce Measurement 23% 23% 17% 19% 14% 13% 12% 11% 10% 11% 3% 9% 9% 6% -3% -2% 0% -1% Q1 07 Q2 07 Q3 07
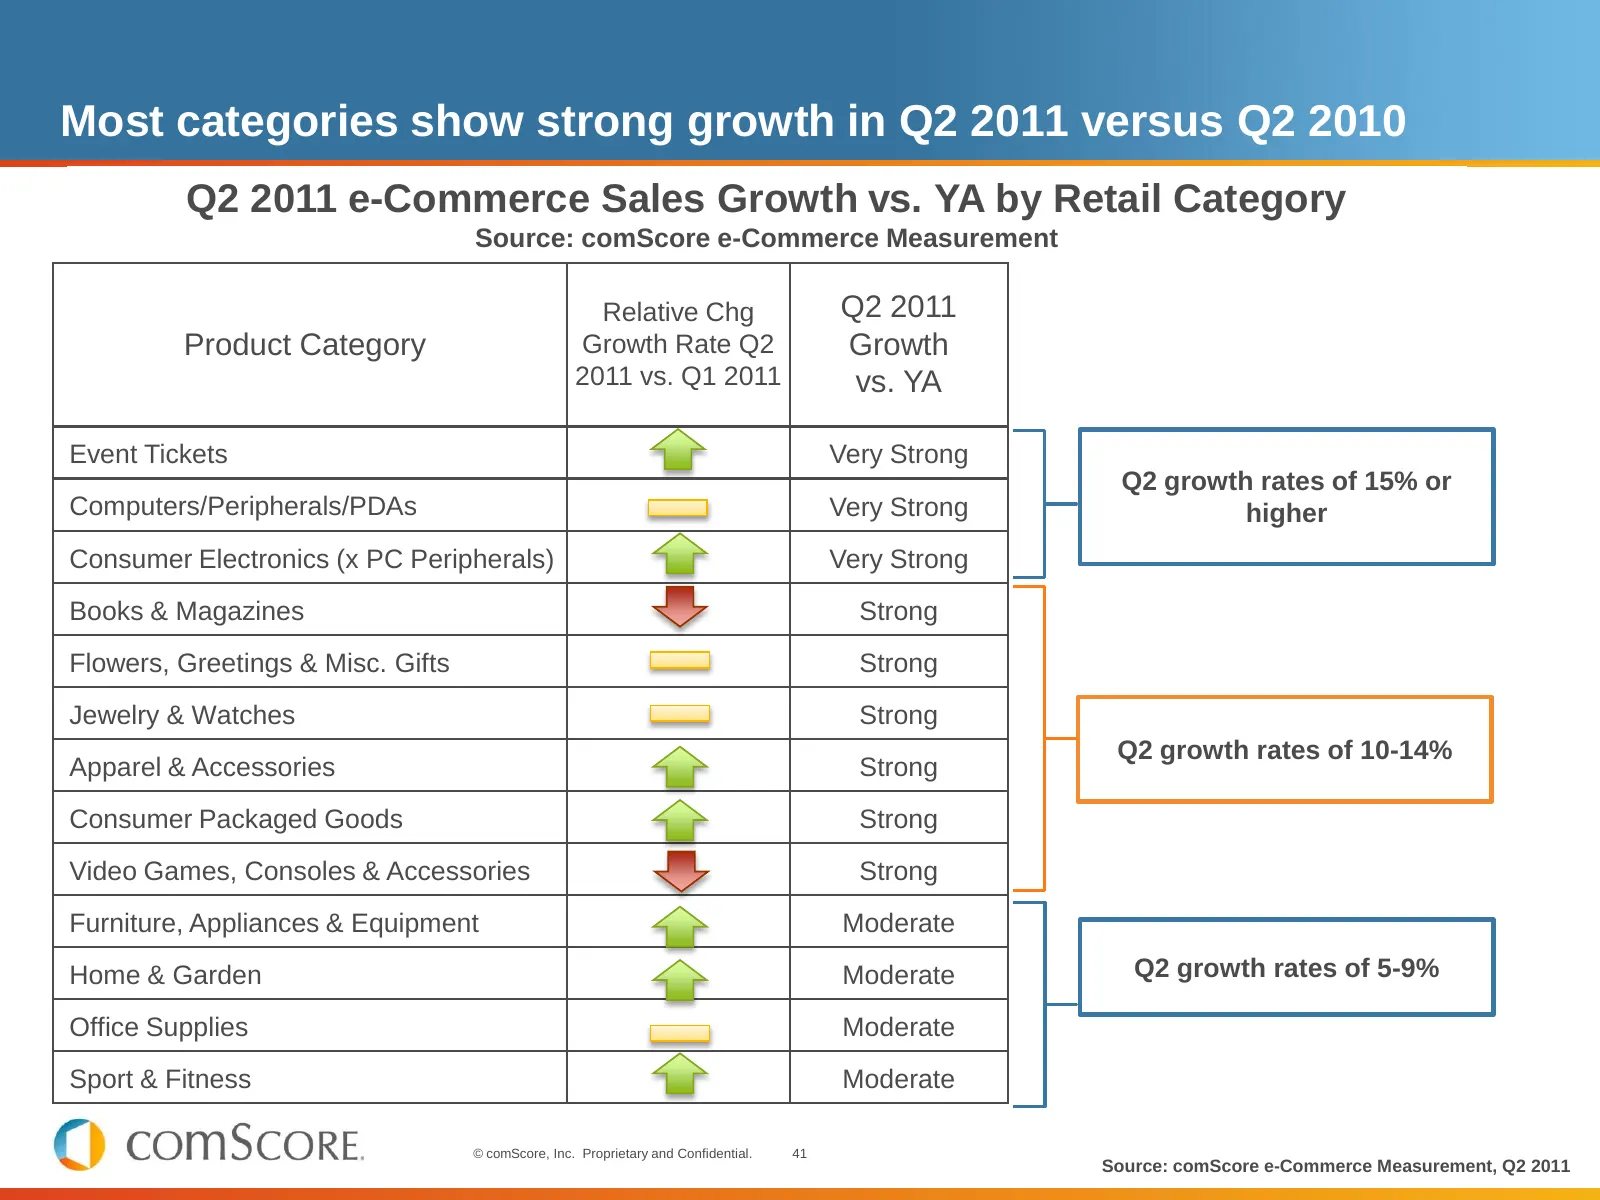
Slide 41: Most categories show strong growth in Q2 2011 versus Q2 2010
Most categories show strong growth in Q2 2011 versus Q2 2010 Q2 2011 e-Commerce Sales Growth vs. YA by Retail Category Source: comScore e-Commerce Measurement Relative Chg Q2 2011 Product Category Growth Rate Q2 Growth 2011 vs. Q1 2011 vs. YA Event Tickets Very Strong Q2 growth rates of 15% or Compu
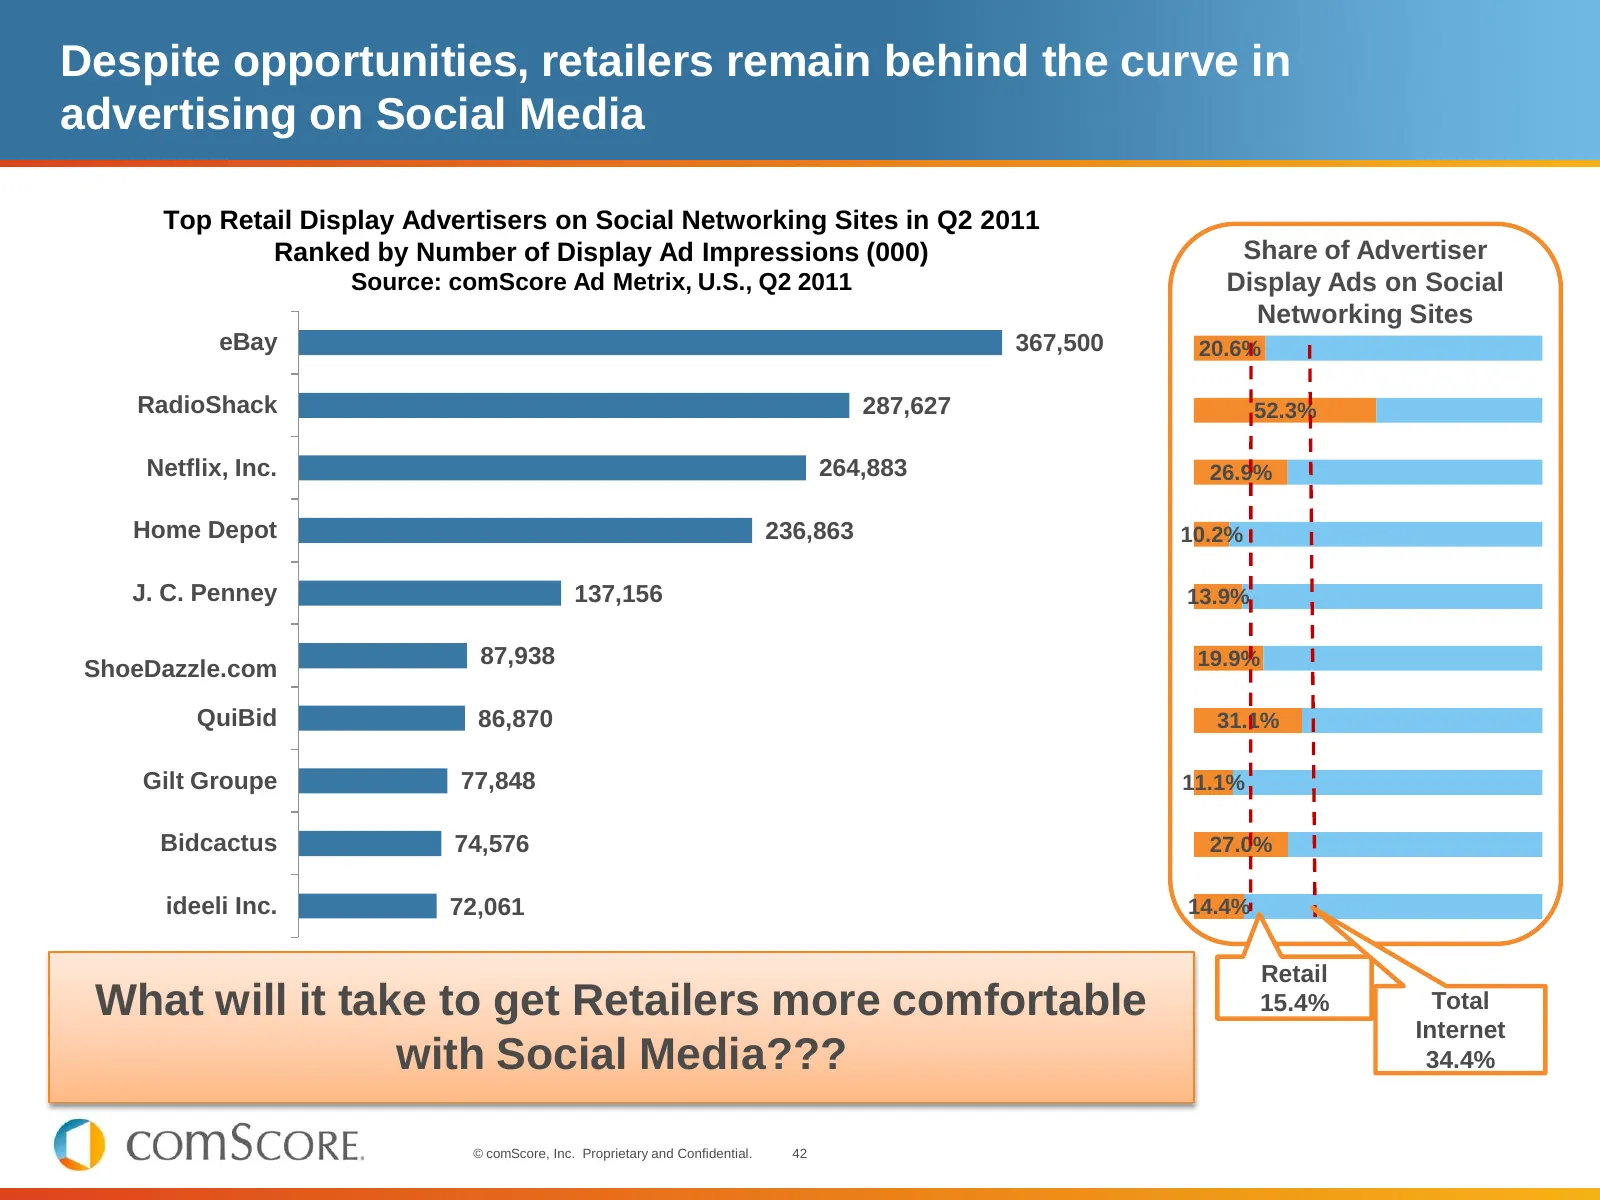
Slide 42: Retailers remain behind the curve in advertising on Social Media
Despite opportunities, retailers remain behind the curve in advertising on Social Media Top Retail Display Advertisers on Social Networking Sites in Q2 2011 Ranked by Number of Display Ad Impressions (000) Share of Advertiser Source: comScore Ad Metrix, U.S., Q2 2011 Display Ads on Social Networking
Slide 43: Agenda
Agenda Worldwide Context US Vital Signs State of the Internet – Video – Search – Mobile – eCommerce Monetization © comScore, Inc. Proprietary and Confidential. 43
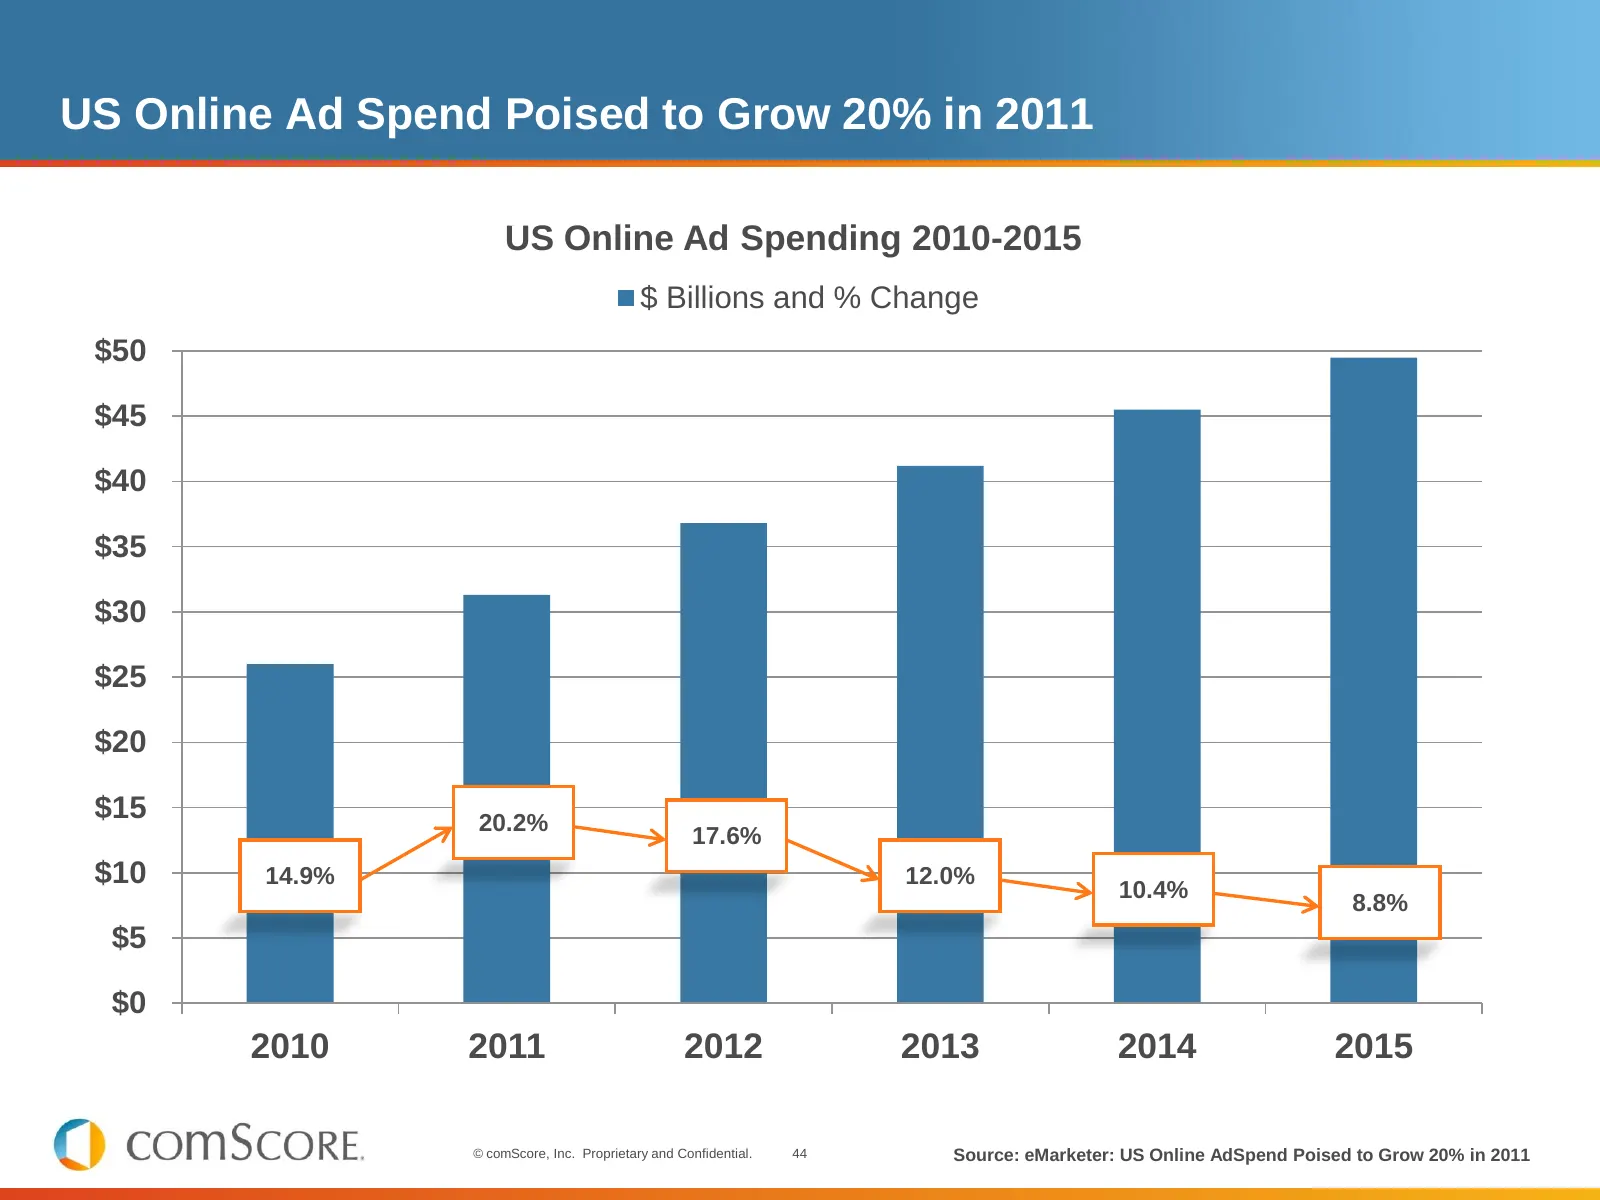
Slide 44: US Online Ad Spend Poised to Grow 20% in 2011
US Online Ad Spend Poised to Grow 20% in 2011 US Online Ad Spending 2010-2015 $ Billions and % Change $50 $45 $40 $35 $30 $25 $20 $15 20.2% 17.6% $10 14.9% 12.0% 10.4% 8.8% $5 $0 2010 2011 2012 2013 2014 2015 © comScore, Inc. Proprietary and Confidential. 44 Source: eMarketer: US Online AdSpend Pois
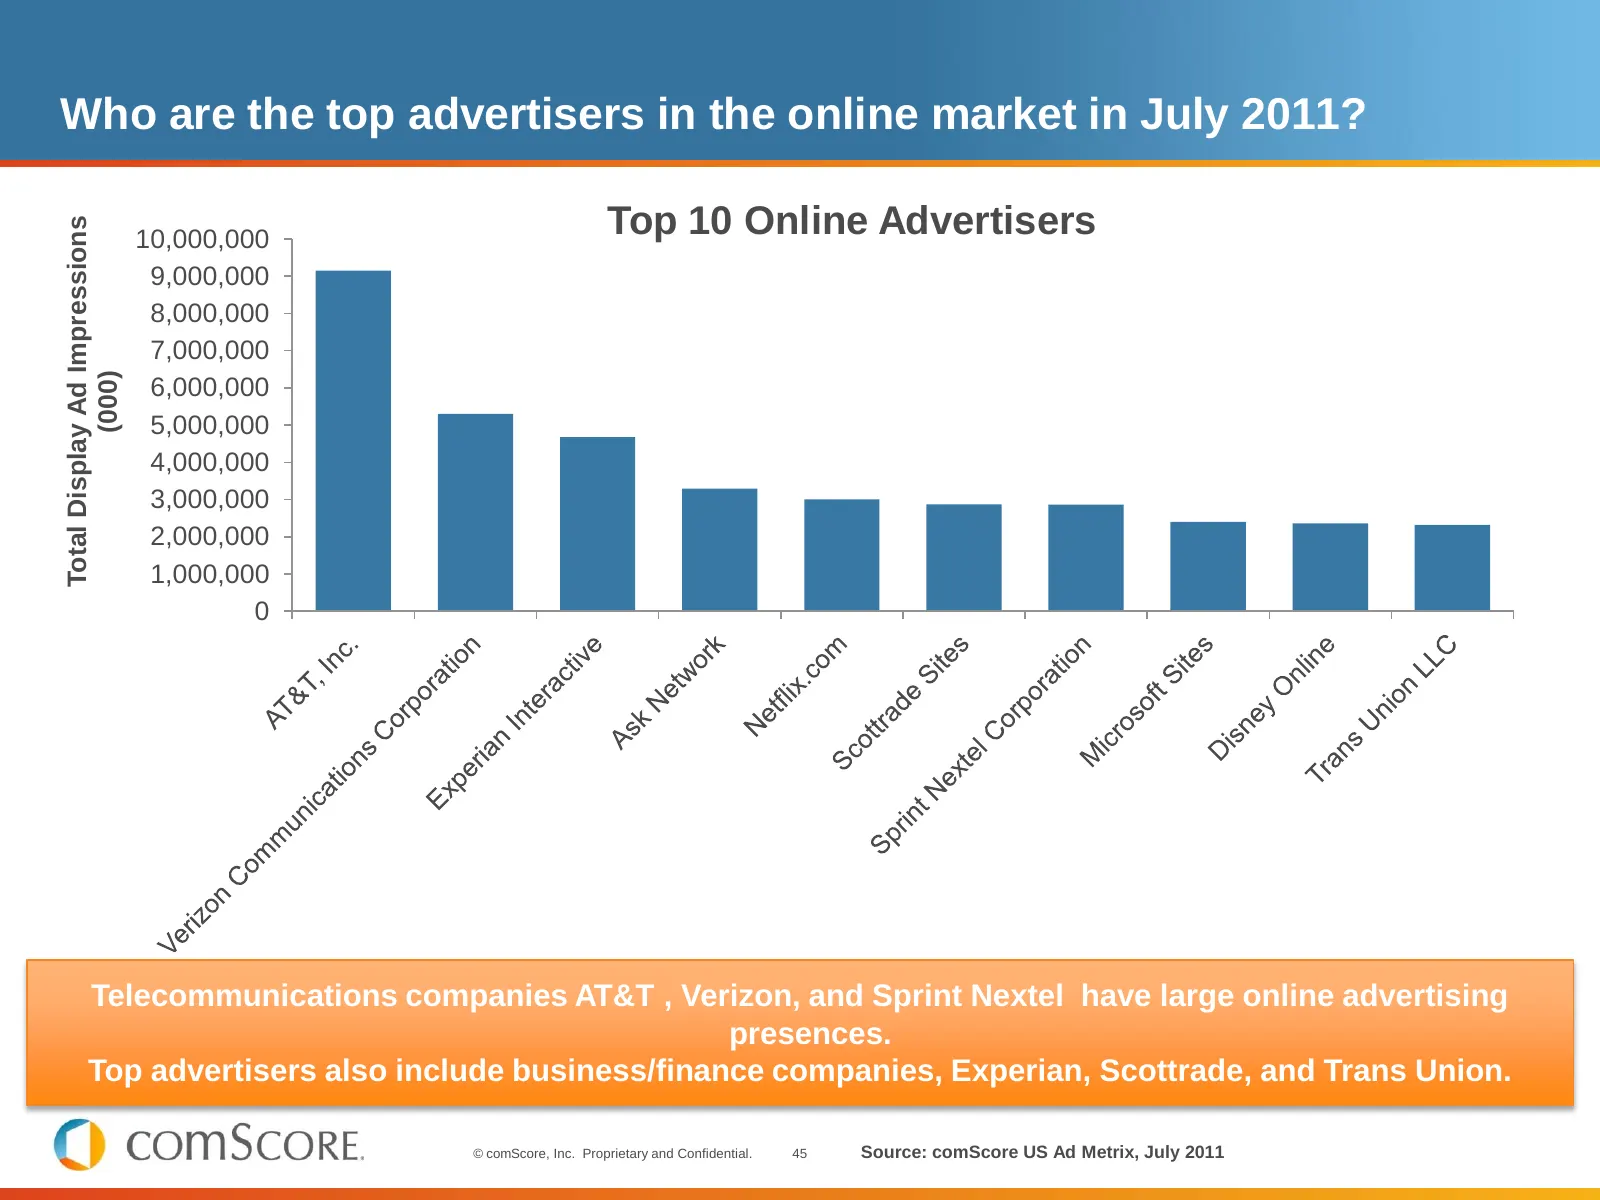
Slide 45: Who are the top advertisers in the online market?
Who are the top advertisers in the online market in July 2011? Top 10 Online Advertisers Total Display Ad Impressions 10,000,000 9,000,000 8,000,000 7,000,000 (000) 6,000,000 5,000,000 4,000,000 3,000,000 2,000,000 1,000,000 0 Telecommunications companies AT&T , Verizon, and Sprint Nextel have large
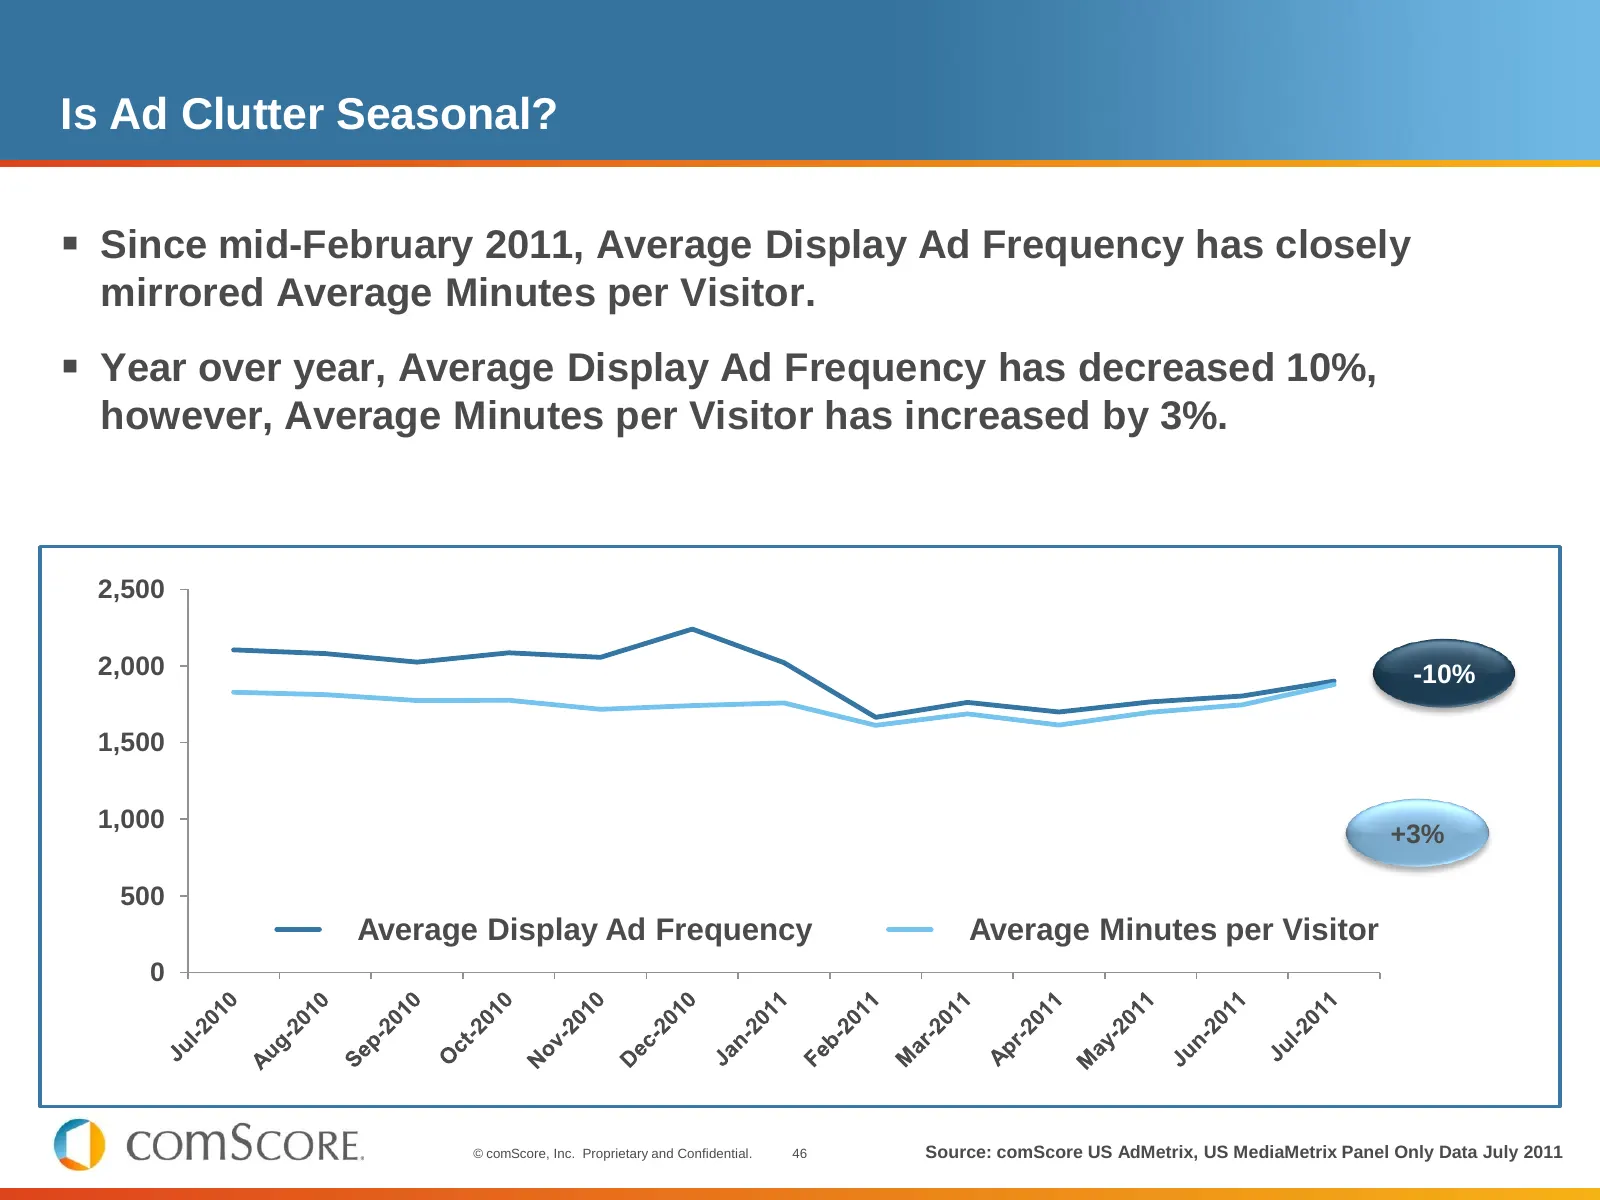
Slide 46: Is Ad Clutter Seasonal?
Is Ad Clutter Seasonal? Since mid-February 2011, Average Display Ad Frequency has closely mirrored Average Minutes per Visitor. Year over year, Average Display Ad Frequency has decreased 10%, however, Average Minutes per Visitor has increased by 3%. 2,500 2,000 -10% 1,500 1,000 +3% 500 Average D
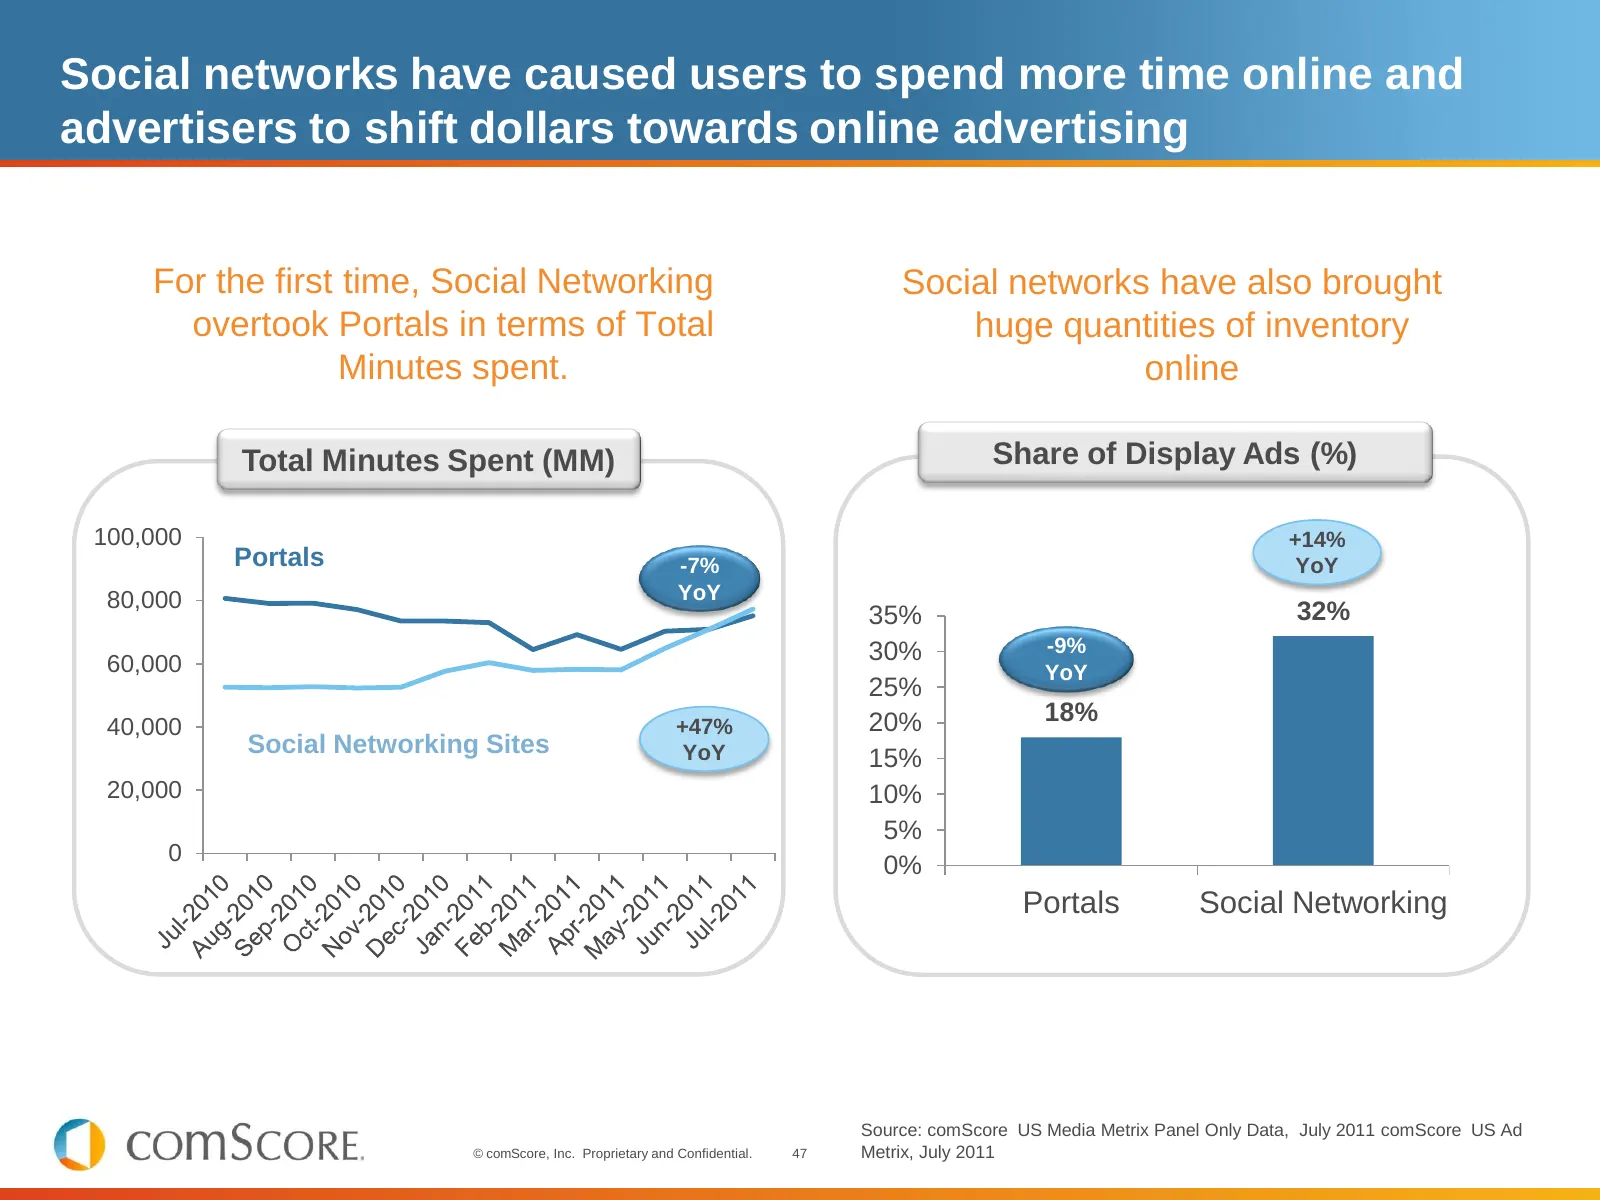
Slide 47: Social networks have caused users to spend more time online
Social networks have caused users to spend more time online and advertisers to shift dollars towards online advertising For the first time, Social Networking Social networks have also brought overtook Portals in terms of Total huge quantities of inventory Minutes spent. online Total Minutes Spent (M
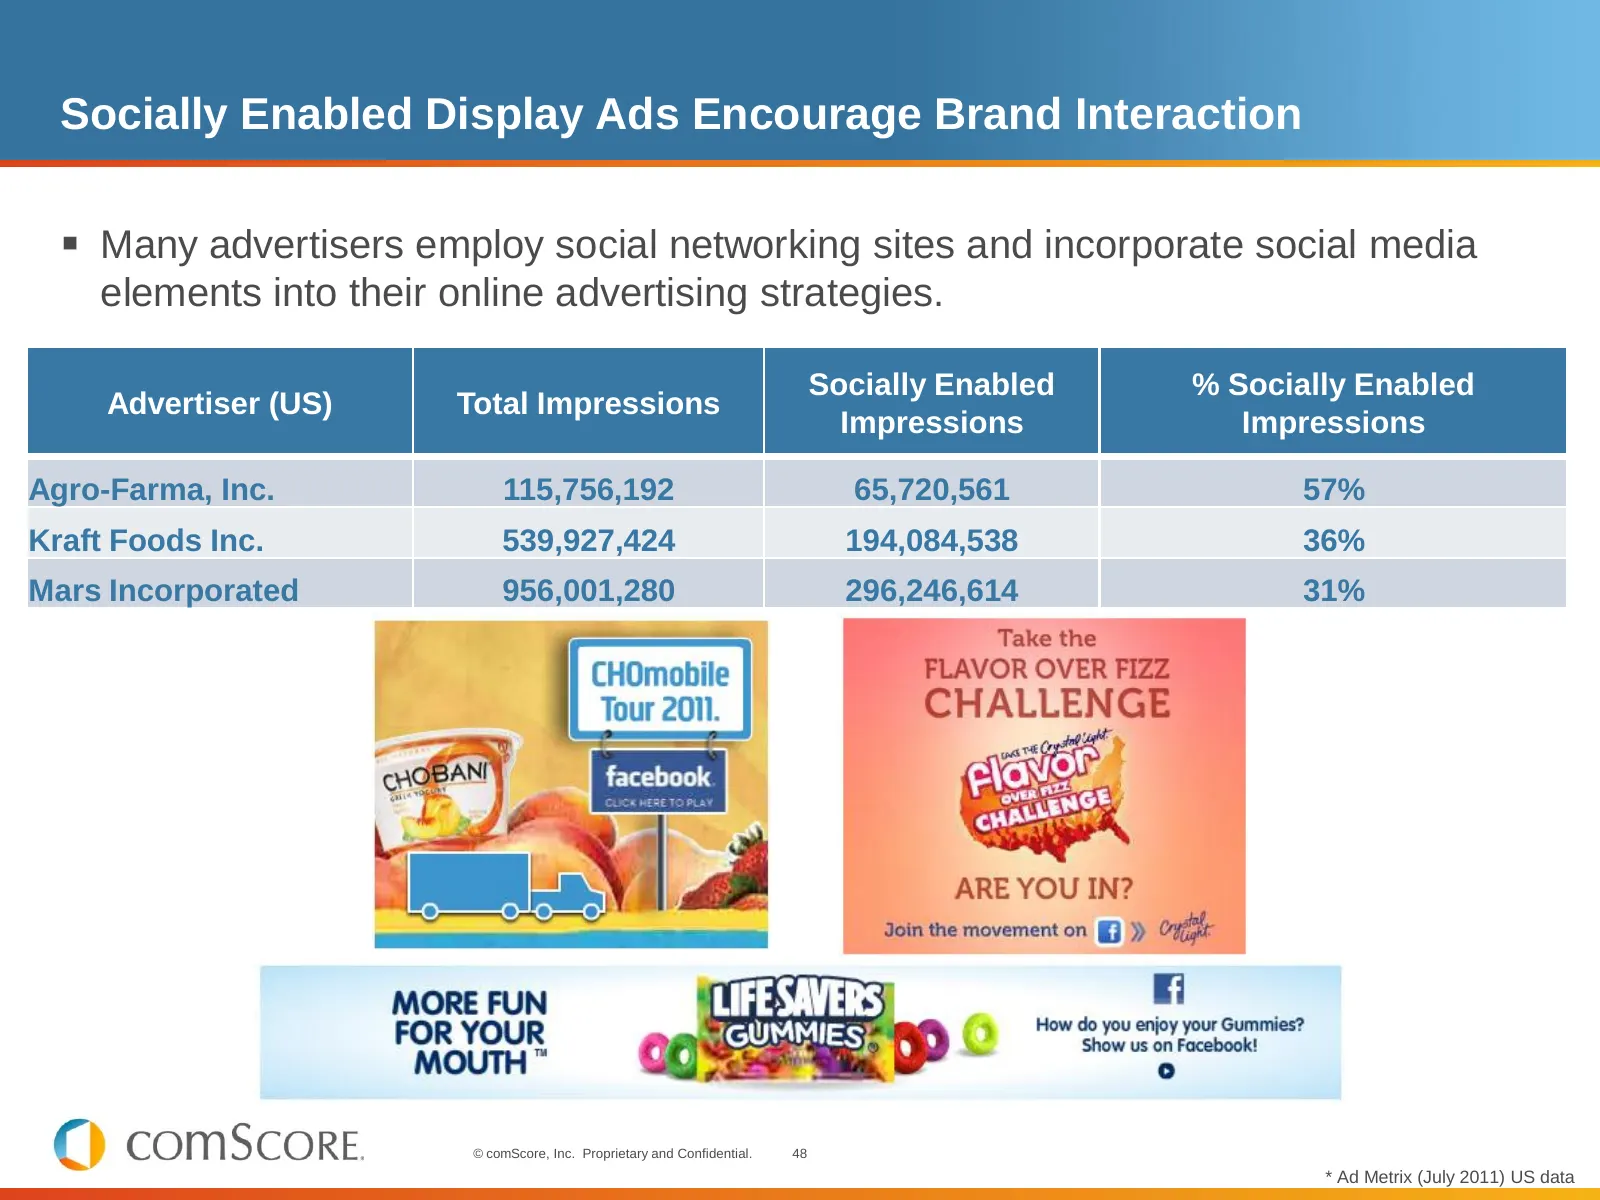
Slide 48: Socially Enabled Display Ads Encourage Brand Interaction
Socially Enabled Display Ads Encourage Brand Interaction Many advertisers employ social networking sites and incorporate social media elements into their online advertising strategies. Socially Enabled % Socially Enabled Advertiser (US) Total Impressions Impressions Impressions Agro-Farma, Inc. 11

Slide 49: Thank you!
Thank you! Bryan Goski Director, comScore Marketing Solutions bgoski@comscore.com
Source: Internet Archive copy of comscore.com
More decks from comScore, Inc.
 Q3 2026 Earnings Presentation17 slides · Nov 3, 2026
 Q2 2026 Earnings Presentation20 slides · Aug 12, 2026
 Investor Presentation (June 2026)27 slides · Jun 10, 2026
 Q4 2025 Earnings Presentation13 slides · Mar 17, 2026
 Q3 2025 Earnings Presentation15 slides · Nov 4, 2025
 Q2 2025 Earnings Presentation11 slides · Aug 5, 2025