Alexander & Baldwin Holdings Inc
Alexander & Baldwin — Investor Day (November 2016)
115 slides from Alexander & Baldwin's investor day presentation, Nov 2, 2016
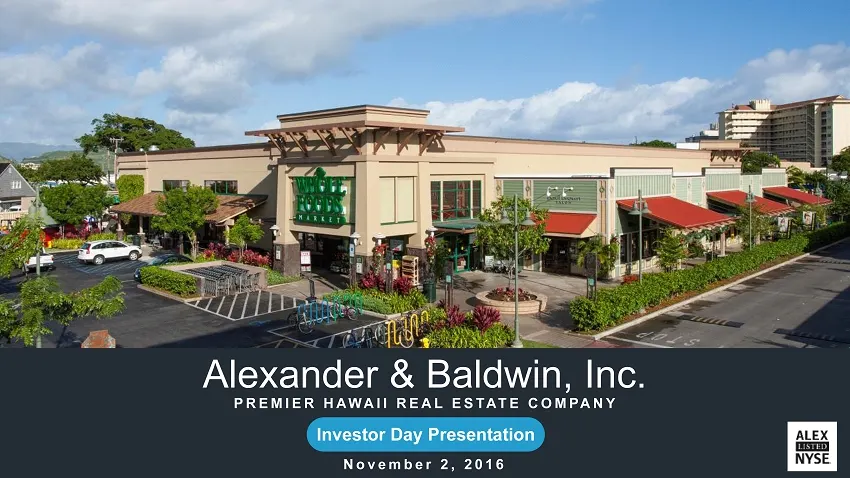
Slide 1: Investor Day Presentation November 2, 2016
1 Alexander & Baldwin, Inc. PREMIER HAWAII REAL ESTATE COMPANY Investor Day Presentation November 2, 2016
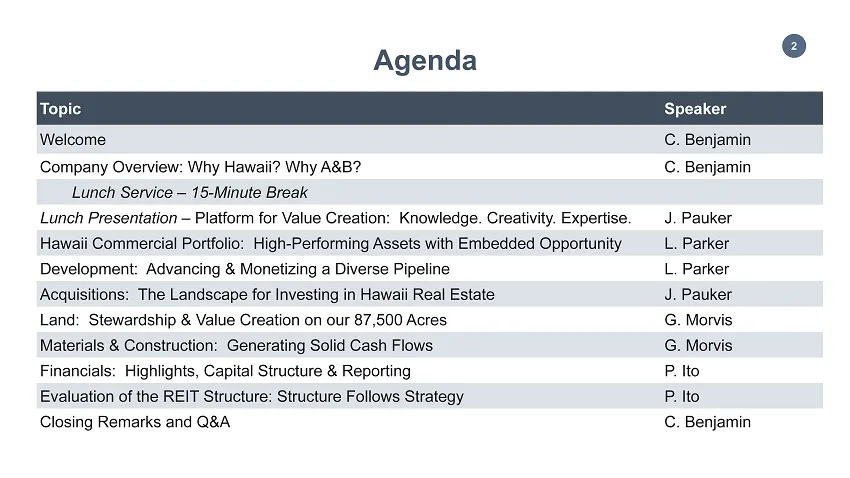
Slide 2: Agenda
2 Topic Speaker Welcome C. Benjamin Company Overview: Why Hawaii? Why A&B? C. Benjamin Lunch Service – 15 - Minute Break Lunch Presentation – Platform for Value Creation: Knowledge . Creativity. Expertise. J. Pauker Hawaii Commercial Portfolio: High - Performing Assets with Embedded Opportunity L. P
Slide 3: Disclosure
3 Statements in this call and presentation that are not historical facts, including potential benefits, consequences and impact of a potential REIT conversion, are "forward - looking statements" within the meaning of the Private Securities Litigation Reform Act of 1995 , that involve a number of ris
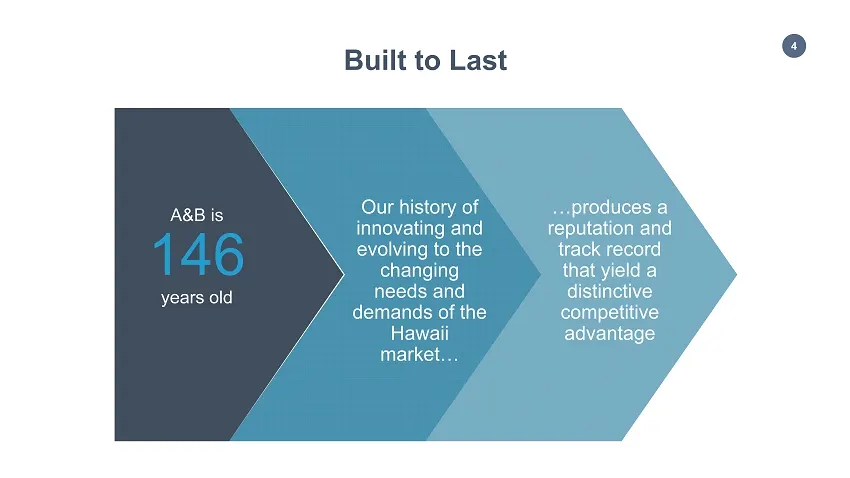
Slide 4: Built to Last
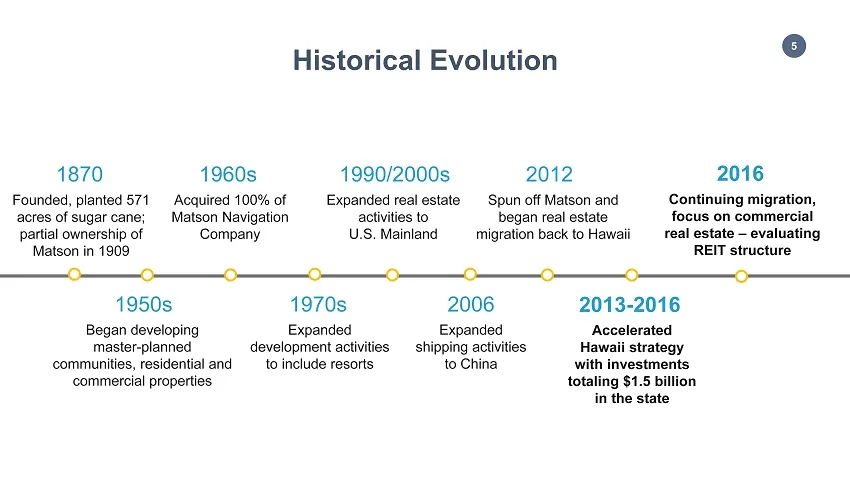
4 Built to Last A&B is 146 years old Our history of innovating and evolving to the changing needs and demands of the Hawaii market… …produces a reputation and track record that yield a distinctive competitive advantage
Slide 5: Historical Evolution
5 Began developing master - planned communities, residential and commercial properties 1950s Acquired 100% of Matson Navigation Company 1960s Expanded real estate activities to U.S . Mainland 1990/2000s Spun off Matson and began real estate migration back to Hawaii 2012 Historical Evolution Continui
Slide 6: Strategic Priorities Post Separation
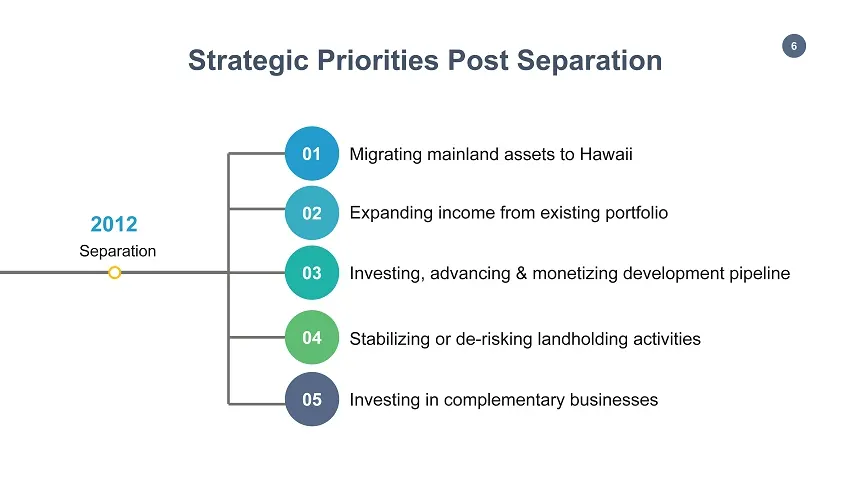
6 Separation 2012 Migrating mainland assets to Hawaii Expanding income from existing portfolio Investing, advancing & monetizing development pipeline Stabilizing or de - risking landholding activities Investing in complementary businesses Strategic Priorities Post Separation 01 02 03 04 05
Slide 7: Portfolio at Separation
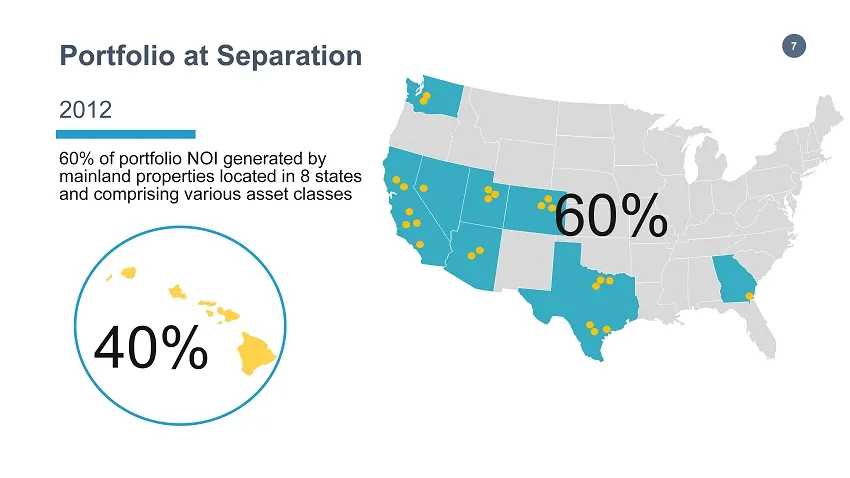
7 Portfolio at Separation 60% of portfolio NOI generated by mainland properties located in 8 states and comprising various asset classes 60% 40% 2012
Slide 8: Hawaii Focus
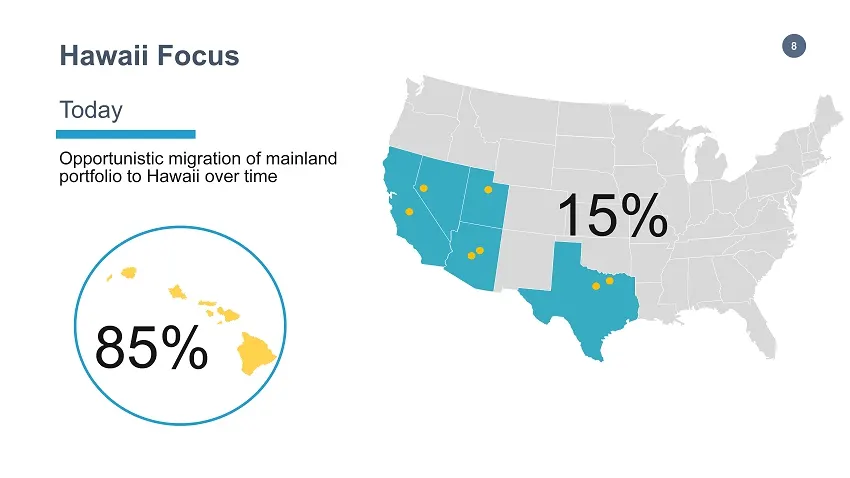
8 Hawaii Focus Opportunistic migration of mainland portfolio to Hawaii over time 15% 85% Today
Slide 9: Expand Commercial Portfolio
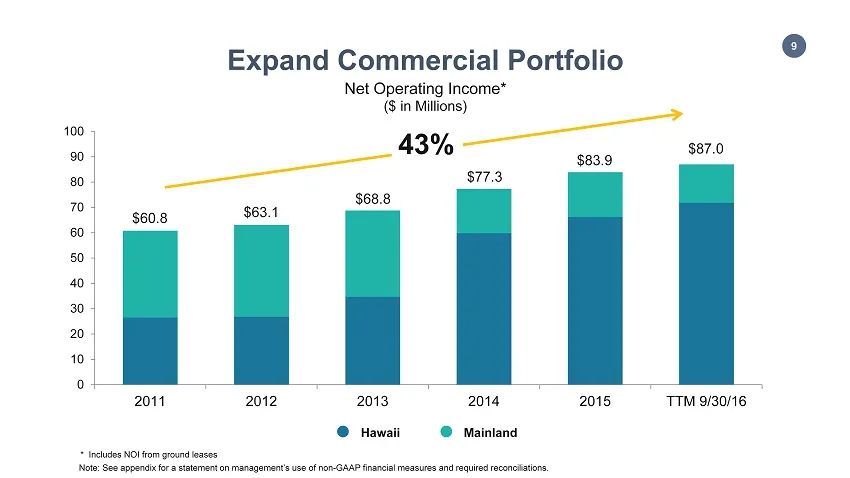
9 Expand Commercial Portfolio 0 10 20 30 40 50 60 70 80 90 100 2011 2012 2013 2014 2015 TTM 9/30/16 $87.0 $63.1 $68.8 $77.3 * Includes NOI from ground leases $83.9 Note: See appendix for a statement on management’s use of non - GAAP financial measures and required reconciliations. Net Operating Inco
Slide 10: REIT Considerations Today vs 2012
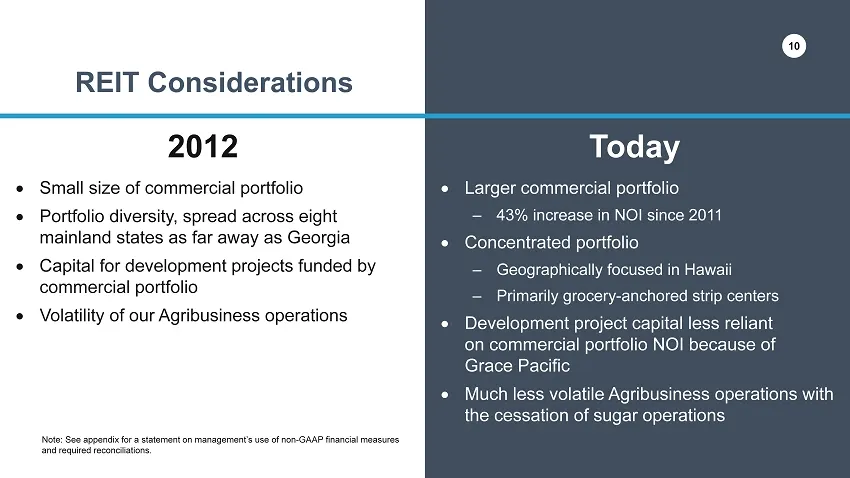
10 S mall size of commercial portfolio P ortfolio diversity, spread across eight mainland states as far away as Georgia Capital for development projects funded by commercial portfolio Volatility of our Agribusiness operations REIT Considerations Today 2012 Larger commercial portfolio – 43%
Slide 11: Why A&B?
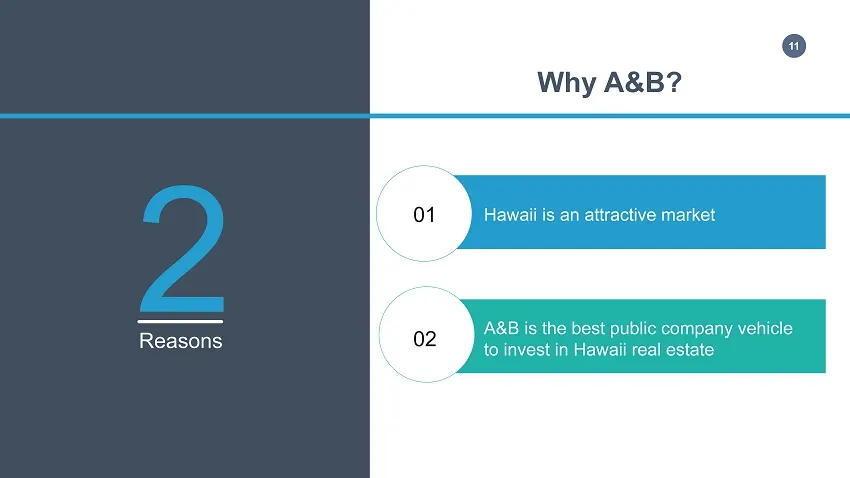
11 Why A&B? 2 Reasons 01 02 Hawaii is an attractive market A&B is the best public company vehicle to invest in Hawaii real estate
Slide 12: Hawaii is an Attractive Market
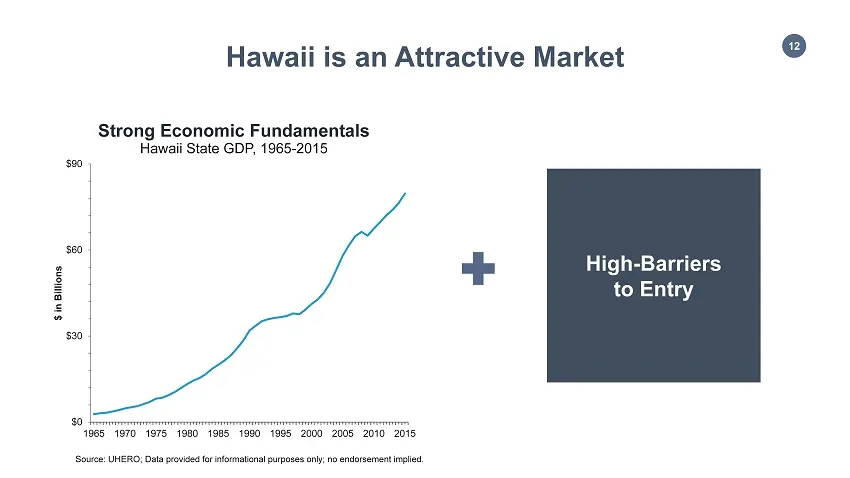
12 Hawaii is an Attractive Market High - Barriers to Entry Hawaii State GDP, 1965 - 2015 Strong Economic Fundamentals Source : UHERO ; Data provided for informational purposes only; no endorsement implied. $0 $30 $60 $90 1965 1970 1975 1980 1985 1990 1995 2000 2005 2010 2015 $ in Billions
Slide 13: Steady Government Spending
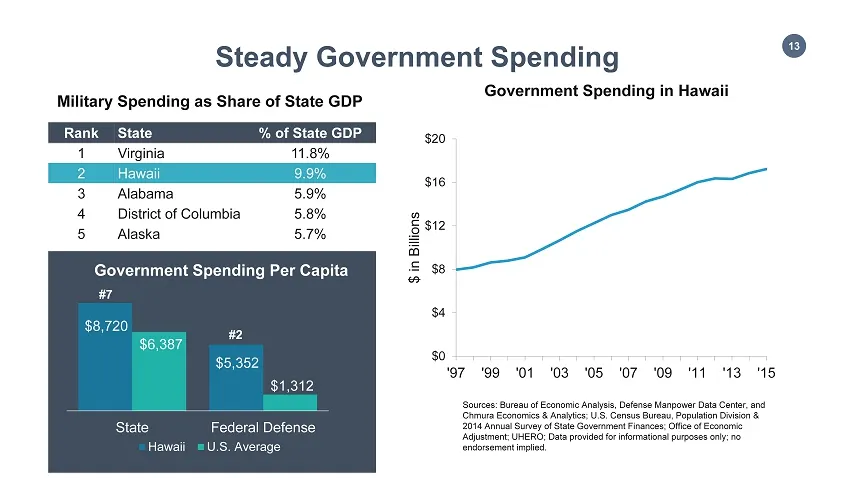
13 Sources: Bureau of Economic Analysis, Defense Manpower Data Center, and Chmura Economics & Analytics; U.S. Census Bureau, Population Division & 2014 Annual Survey of State Government Finances; Office of Economic Adjustment ; UHERO; Data provided for informational purposes only; no endorsement imp
Slide 14: Resilient Visitor Industry
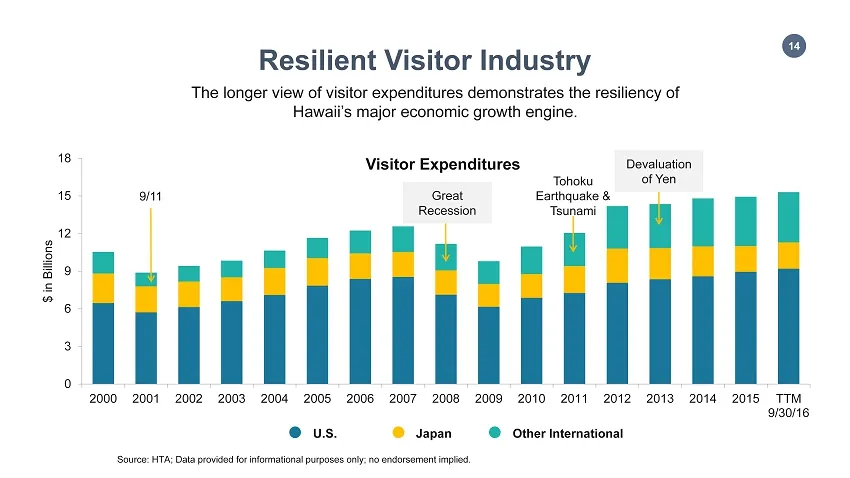
14 Japan Resilient Visitor Industry 0 3 6 9 12 15 18 2000 2001 2002 2003 2004 2005 2006 2007 2008 2009 2010 2011 2012 2013 2014 2015 TTM 9/30/16 $ in Billions Visitor Expenditures 9/11 Great Recession Devaluation of Yen U.S. The longer view of visitor expenditures demonstrates the resiliency of Hawa
Slide 15: Restricted Supply of Urban Land
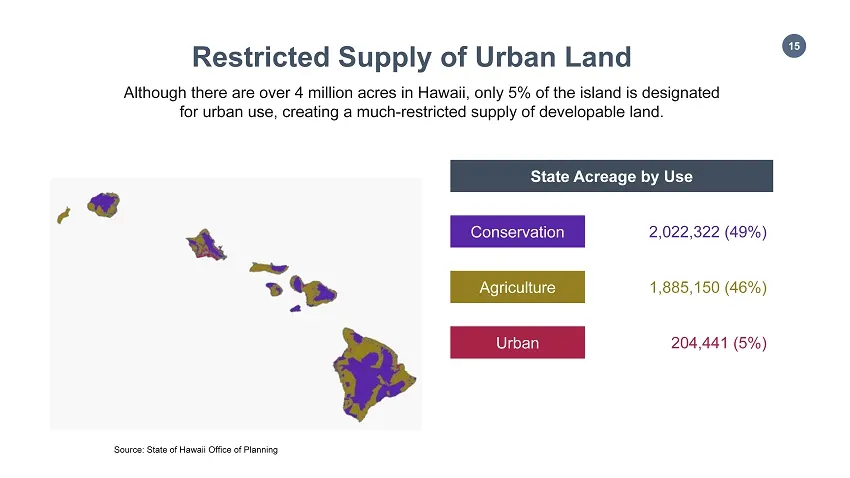
15 Source : State of Hawaii Office of Planning Although there are over 4 million acres in Hawaii, only 5% of the island is designated for urban use, creating a much - restricted supply of developable land. State Acreage by Use Agriculture Conservation Urban 1,885,150 (46%) 2,022,322 (49%) 204,441 (
Slide 16: A Structural Barrier to New Supply
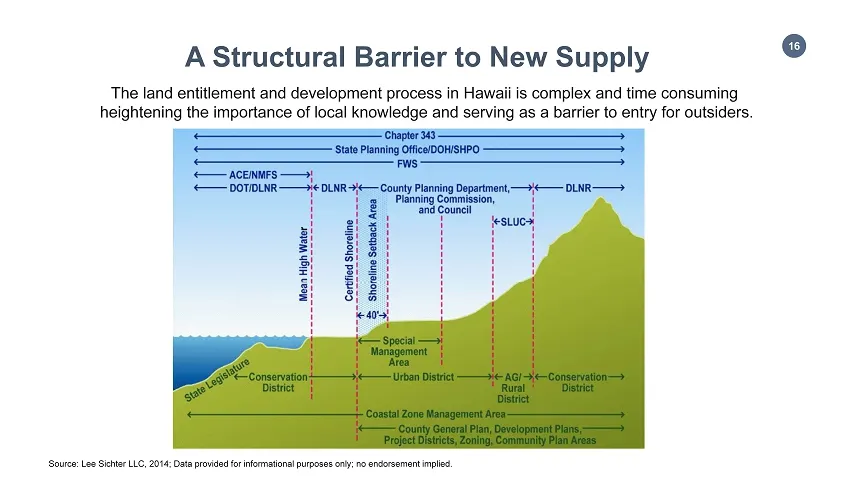
16 The land entitlement and development process in Hawaii is complex and time consuming heightening the importance of local knowledge and serving as a barrier to entry for outsiders. A Structural Barrier to New Supply Source : Lee Sichter LLC, 2014; Data provided for informational purposes only; no
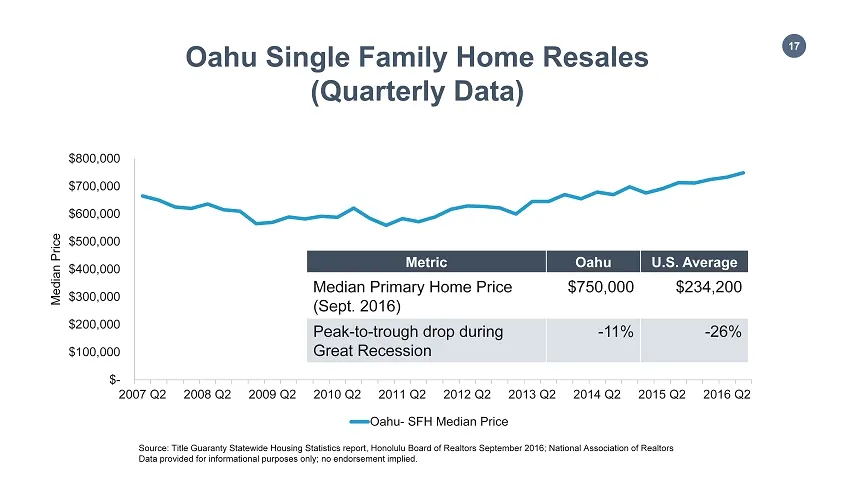
Slide 17: Oahu Single Family Home Resales
17 Source: Title Guaranty Statewide Housing Statistics report , Honolulu Board of Realtors September 2016; National Association of Realtors Data provided for informational purposes only; no endorsement implied. $- $100,000 $200,000 $300,000 $400,000 $500,000 $600,000 $700,000 $800,000 2007 Q2 2008 Q
Slide 18: Why Hawaii?
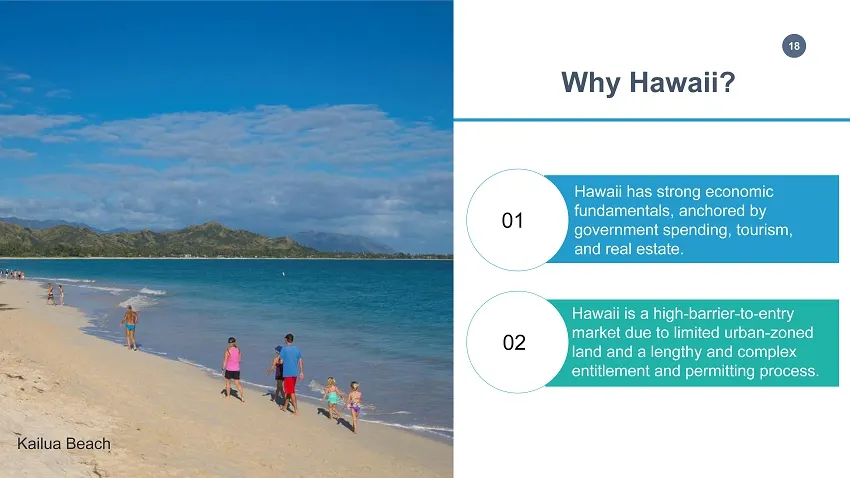
18 Why Hawaii? 01 02 Hawaii has strong economic fundamentals, anchored by government spending, tourism, and real estate. Hawaii is a high - barrier - to - entry market due to limited urban - zoned land and a lengthy and complex entitlement and permitting process. Kailua Beach
Slide 19: Why A&B?
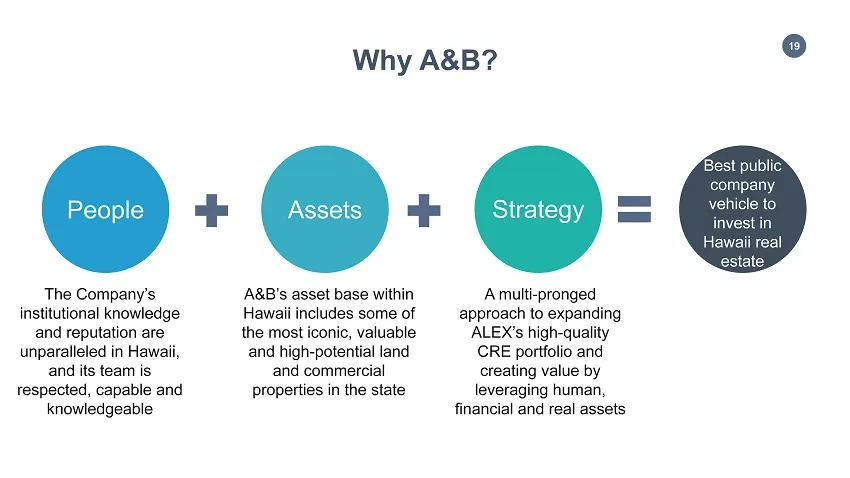
19 Why A&B? People Assets Best public company vehicle to invest in Hawaii real estate Strategy A&B’s asset base within Hawaii includes some of the most iconic, valuable and high - potential land and commercial properties in the state A multi - pronged approach to expanding ALEX’s high - quality CRE
Slide 20: Platform for Value Creation
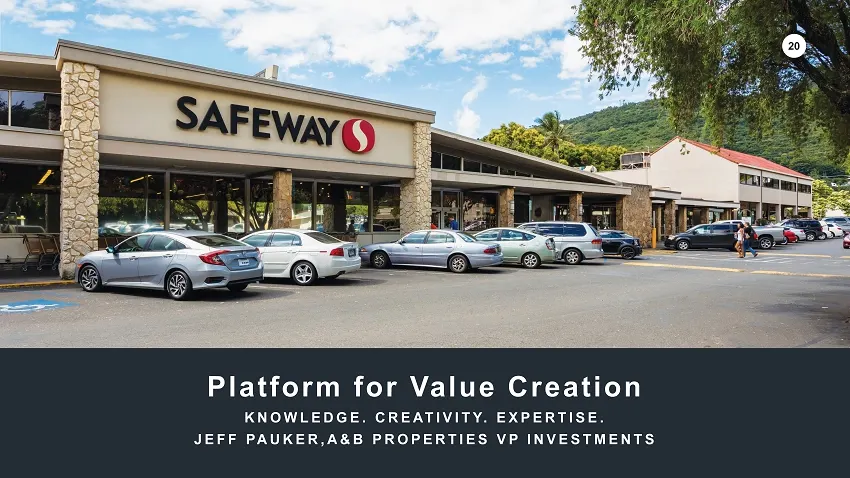
20 Platform for Value Creation KNOWLEDGE. CREATIVITY. EXPERTISE. JEFF PAUKER,A&B PROPERTIES VP INVESTMENTS 20
Slide 21: Knowledge, Creativity, Expertise
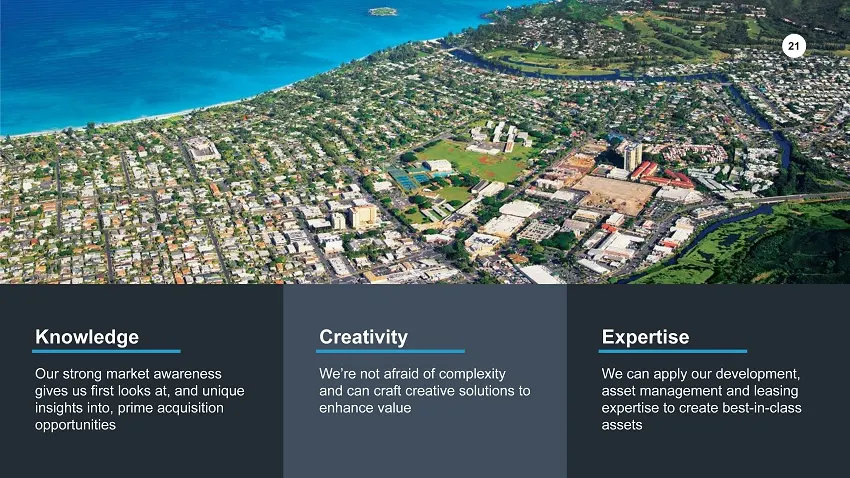
21 Our strong market awareness gives us first looks at, and unique insights into, prime acquisition opportunities Knowledge We’re not afraid of complexity and can craft creative solutions to enhance value Creativity We can apply our development, asset management and leasing expertise to create best
Slide 22: Knowledge = Deal Flow
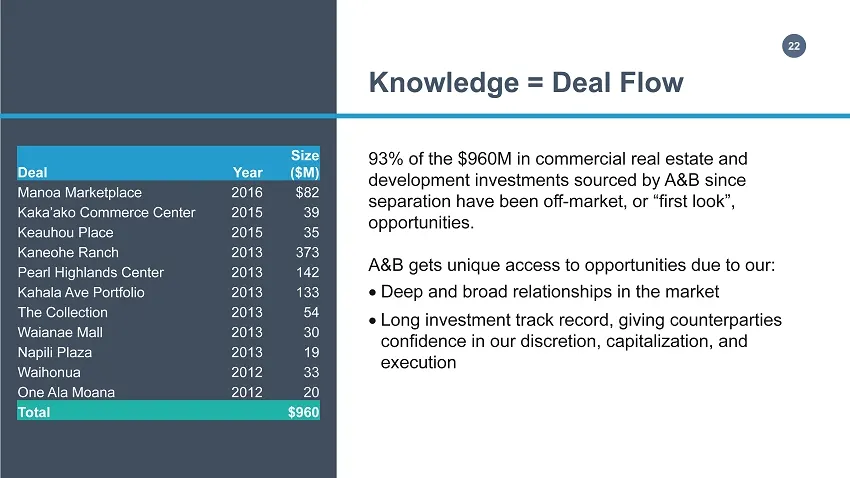
22 93% of the $960M in commercial real estate and development investments sourced by A&B since separation have been off - market, or “first look”, opportunities. A&B gets unique access to opportunities due to our: D eep and broad relationships in the market Long investment track record, giving c
Slide 23: Example: Kaneohe Ranch Portfolio
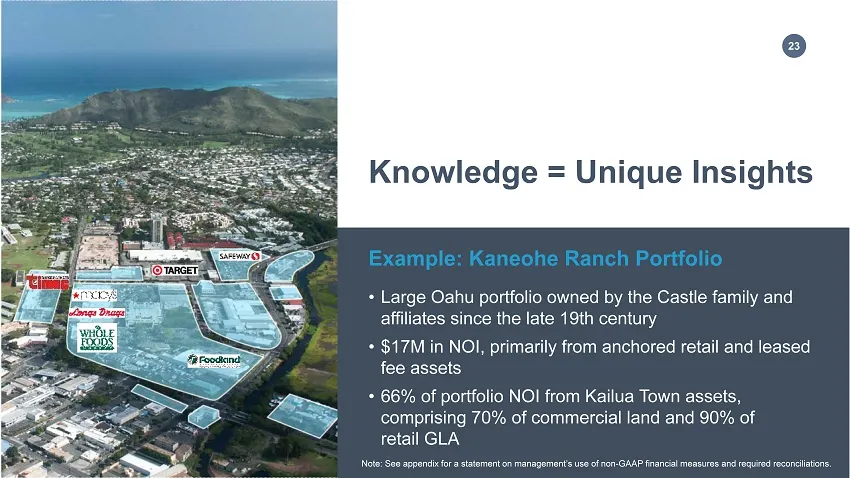
23 • Large Oahu portfolio owned by the Castle family and affiliates since the late 19th century • $17M in NOI, primarily from anchored retail and leased fee assets • 66 % of portfolio NOI from Kailua Town assets, comprising 70% of commercial land and 90% of retail GLA Example: Kaneohe Ranch Portfoli
Slide 24: Kailua Town Demographics
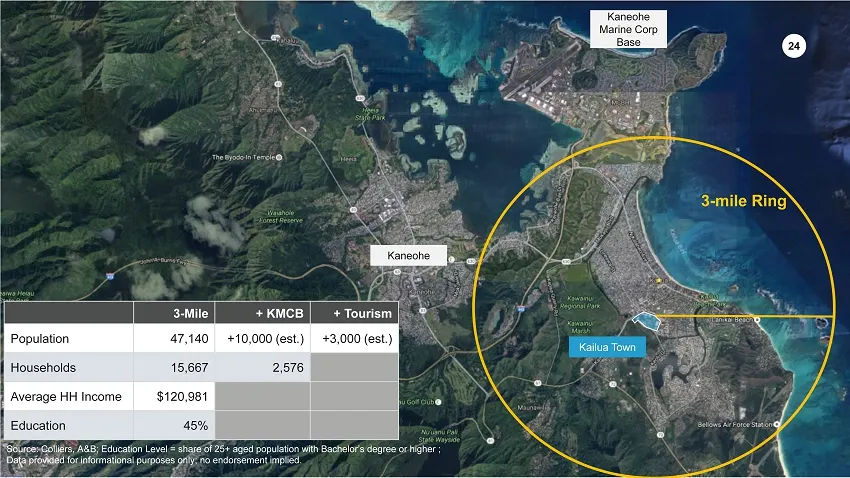
24 Kailua Town Kaneohe 3 - Mile + KMCB + Tourism Population 47,140 +10,000 (est.) +3,000 (est.) Households 15,667 2,576 Average HH Income $120,981 Education 45% Kaneohe Marine Corp Base 3 - mile Ring Source: Colliers, A&B; Education Level = share of 25+ aged population with Bachelor’s degree or high
Slide 25: Undersupplied Submarket
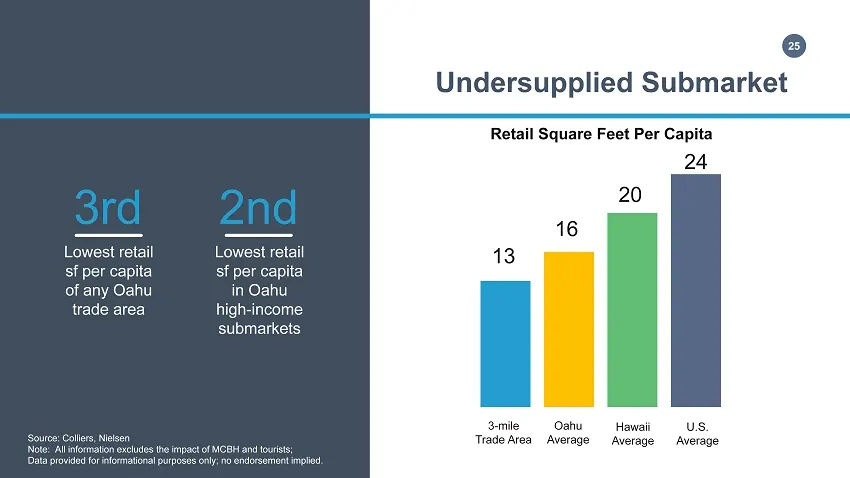
25 Retail Square Feet Per Capita Undersupplied Submarket 13 16 20 24 3 - mile Trade A rea Oahu Average Hawaii Average U.S. Average 3rd Lowest retail sf per capita of any Oahu trade area 2nd Lowest retail sf per capita in Oahu high - income submarkets Source: Colliers, Nielsen Note: All information e
Slide 26: Strong Retailer Sales
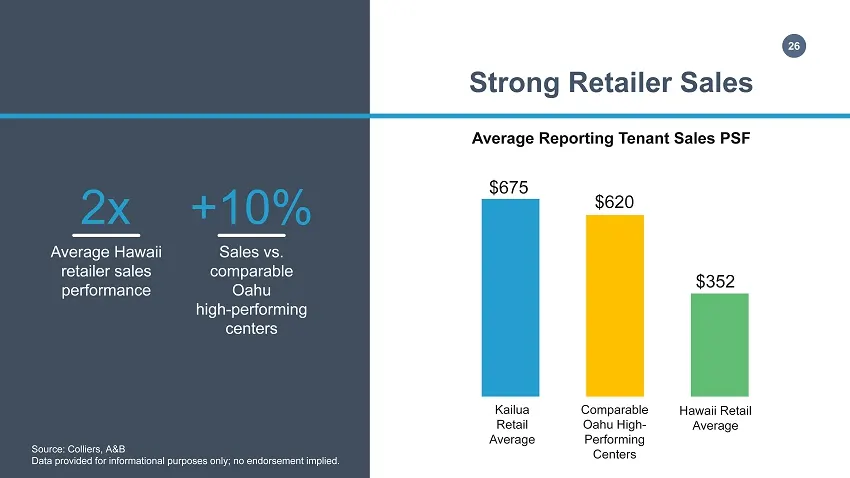
26 Strong Retailer Sales Source: Colliers, A&B Data provided for informational purposes only; no endorsement implied. $675 $352 Kailua Retail Average Hawaii Retail Average Comparable Oahu High - Performing Centers Average Reporting Tenant Sales PSF $620 2x +10% Average Hawaii retailer s ales p erfor
Slide 27: Lower Rents, Higher Sales
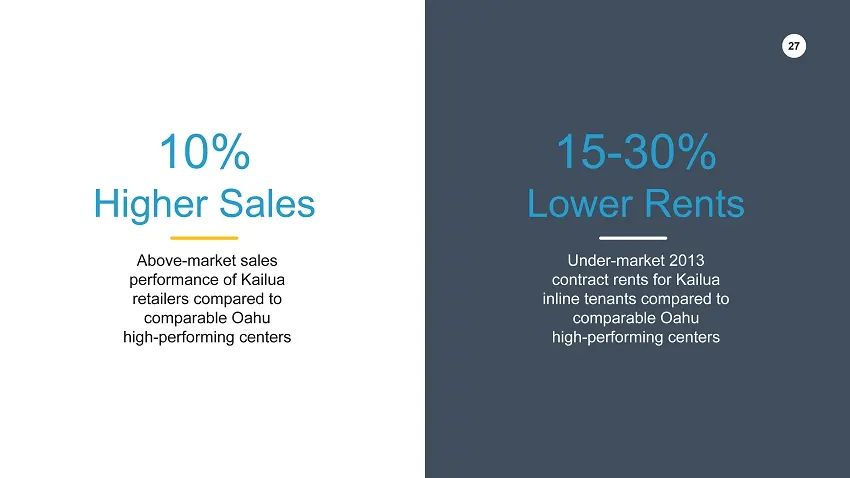
27 15 - 30% Lower Rents Under - market 2013 contract rents for Kailua inline tenants compared to comparable Oahu high - performing centers 10% Higher Sales Above - market sales performance of Kailua retailers compared to comparable Oahu high - performing centers 27
Slide 28: Kailua Performance Since Acquisition
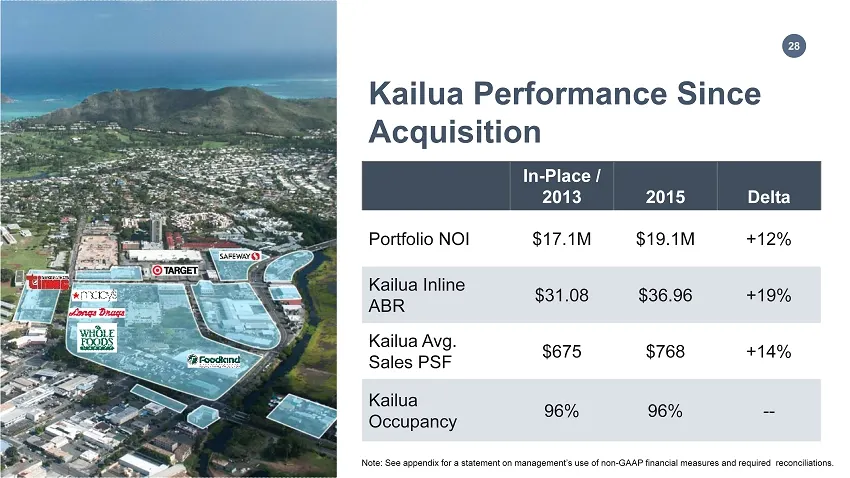
28 In - Place / 2013 2015 Delta Portfolio NOI $17.1M $19.1M +12% Kailua Inline ABR $31.08 $36.96 +19% Kailua Avg. Sales PSF $675 $768 +14% Kailua Occupancy 96% 96% -- Kailua Performance Since Acquisition Note: See appendix for a statement on management’s use of non - GAAP financial measures and requ
Slide 29: Creativity: Manoa Marketplace
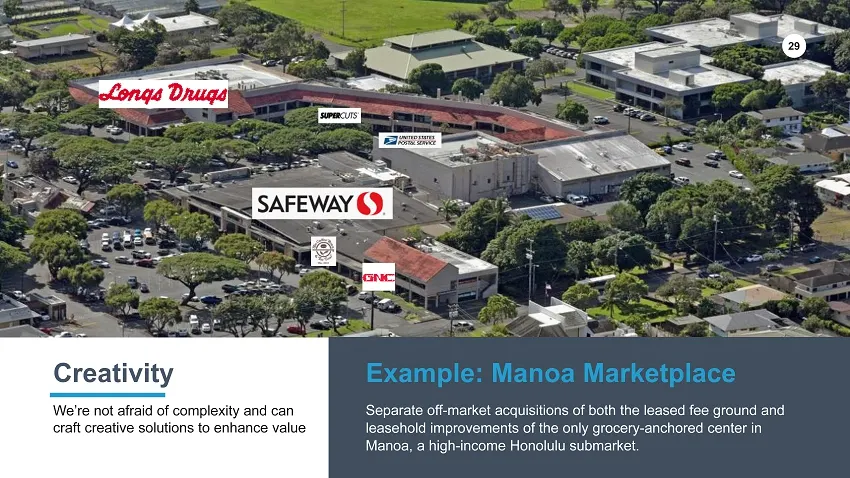
29 Creativity We’re not afraid of complexity and can craft creative solutions to enhance value Example: Manoa Marketplace Separate off - market acquisitions of both the leased fee ground and leasehold improvements of the only grocery - anchored center in Manoa, a high - income Honolulu submarket. 29
Slide 30: Manoa Marketplace Demographics
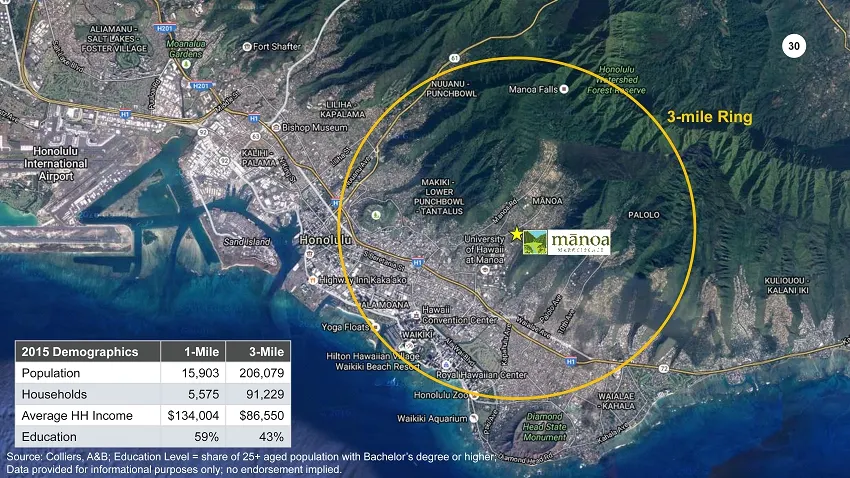
30 3 - mile Ring 2015 Demographics 1 - Mile 3 - Mile Population 15,903 206,079 Households 5,575 91,229 Average HH Income $134,004 $86,550 Education 59% 43% Source: Colliers, A&B; Education Level = share of 25+ aged population with Bachelor’s degree or higher; Data provided for informational purposes
Slide 31: Leasehold Ownership Puts Asset in Limbo
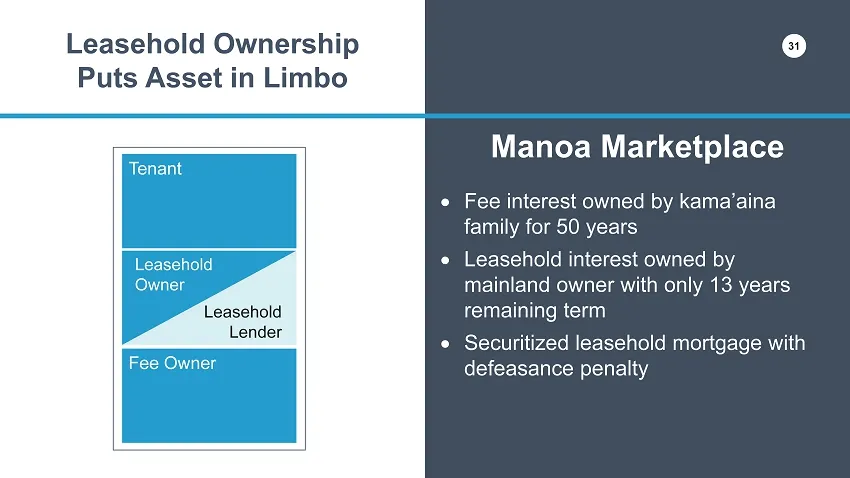
31 Leasehold Owner Tenant Fee Owner Leasehold Lender Fee interest owned by kama’aina family for 50 years Leasehold interest owned by mainland owner with only 13 years remaining term Securitized leasehold mortgage with defeasance penalty Leasehold Ownership Puts Asset in Limbo Manoa Marketplace
Slide 32: Creativity = Unlocking Opportunities
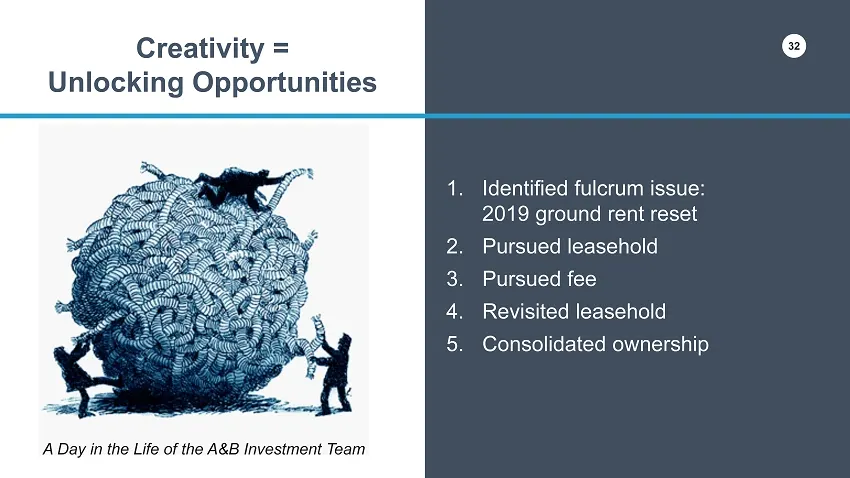
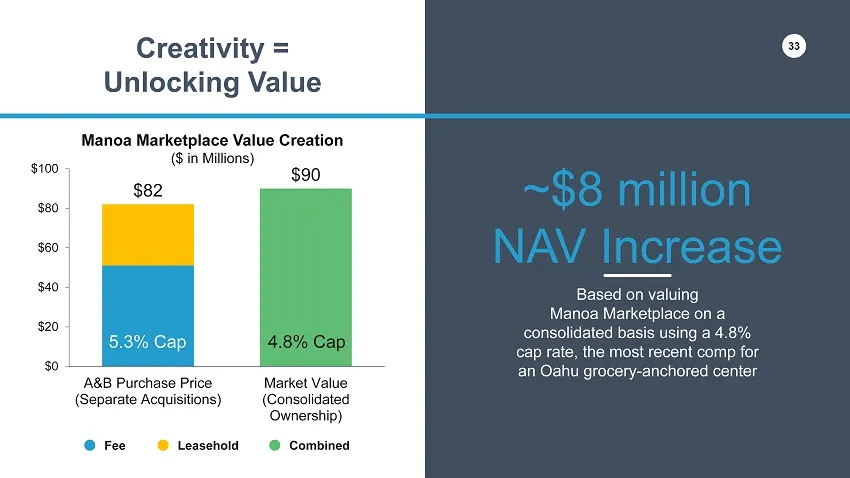
32 1. Identified fulcrum issue: 2019 ground rent reset 2. Pursued leasehold 3. Pursued fee 4. Revisited leasehold 5. Consolidated ownership Creativity = Unlocking Opportunities A Day in the Life of the A&B Investment Team 32
Slide 33: Manoa Marketplace Value Creation
33 $82 $90 $0 $20 $40 $60 $80 $100 A&B Purchase Price (Separate Acquisitions) Market Value (Consolidated Ownership) ~$8 million NAV Increase Based on valuing Manoa Marketplace on a consolidated basis using a 4.8% cap rate, the most recent comp for an Oahu grocery - anchored center Fee Leasehold Mano
Slide 34: Expertise: The Shops at Kukui'ula
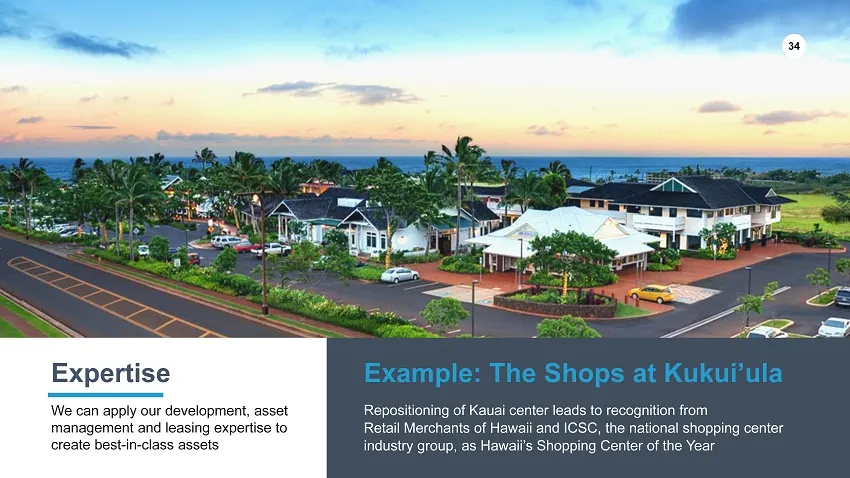
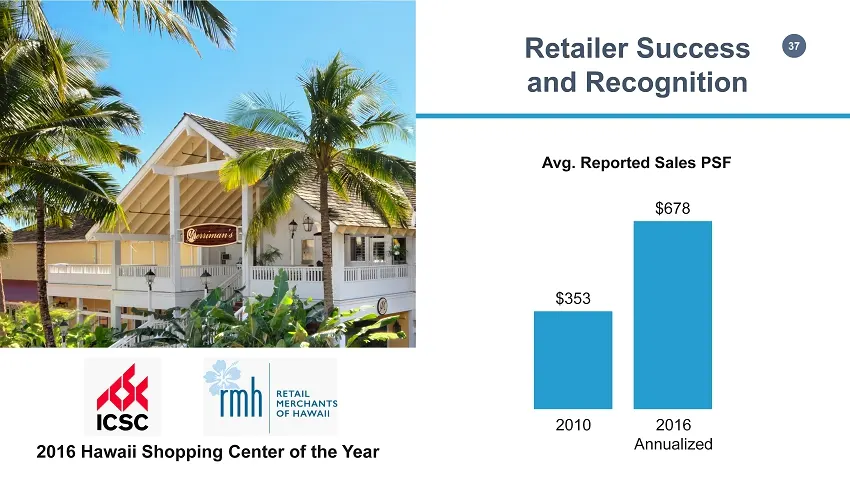
34 Expertise We can apply our development, asset management and leasing expertise to create best - in - class assets Example: The Shops at Kukui’ula Repositioning of Kauai center leads to recognition from Retail Merchants of Hawaii and ICSC, the national shopping center industry group, as Hawaii’s S
Slide 35: Kukui'ula Timeline
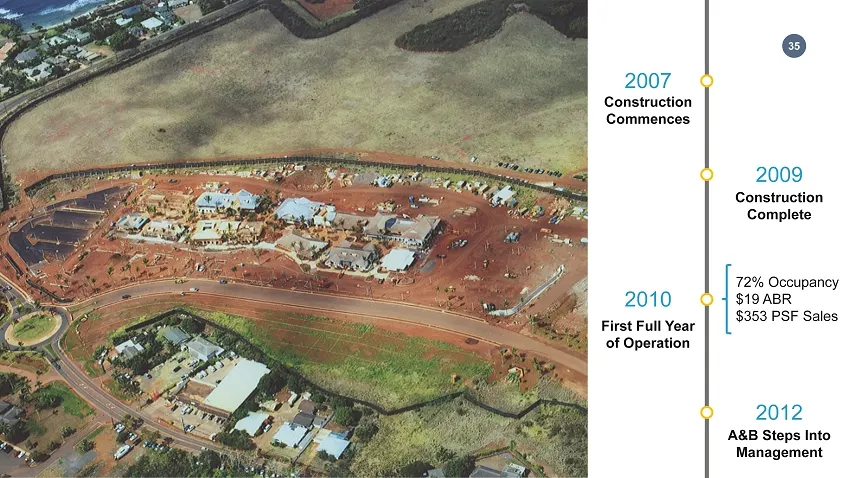
35 Construction Commences 2007 Construction Complete 2009 First Full Year of Operation 2010 A&B Steps Into Management 2012 72% Occupancy $19 ABR $353 PSF Sales
Slide 36: A&B Asset Management Strategy
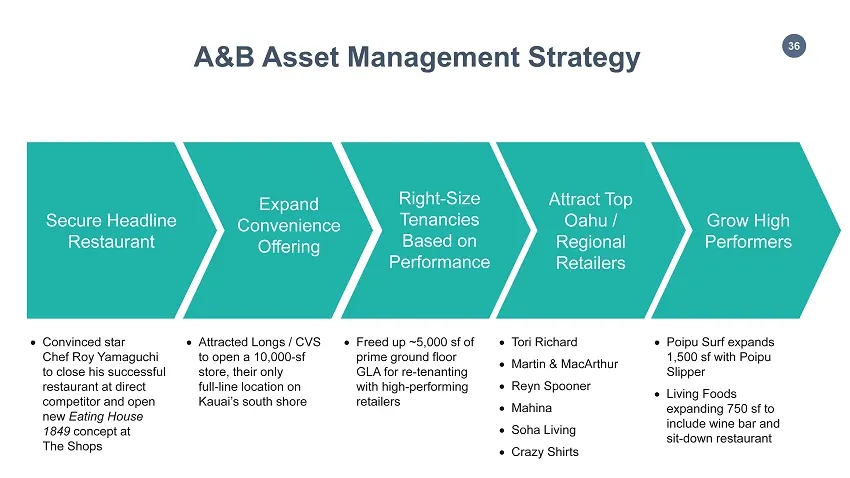
36 Secure Headline Restaurant Convinced star Chef Roy Yamaguchi to close his successful restaurant at direct competitor and open new Eating House 1849 concept at The Shops Attract Top Oahu / Regional Retailers Tori Richard Martin & MacArthur Reyn Spooner Mahina Soha Living Crazy Shirts
Slide 37: Retailer Success and Recognition
37 Retailer Success and Recognition 2016 Hawaii Shopping Center of the Year $353 $678 Avg. Reported Sales PSF 2010 2016 Annualized
Slide 38: Financial Results
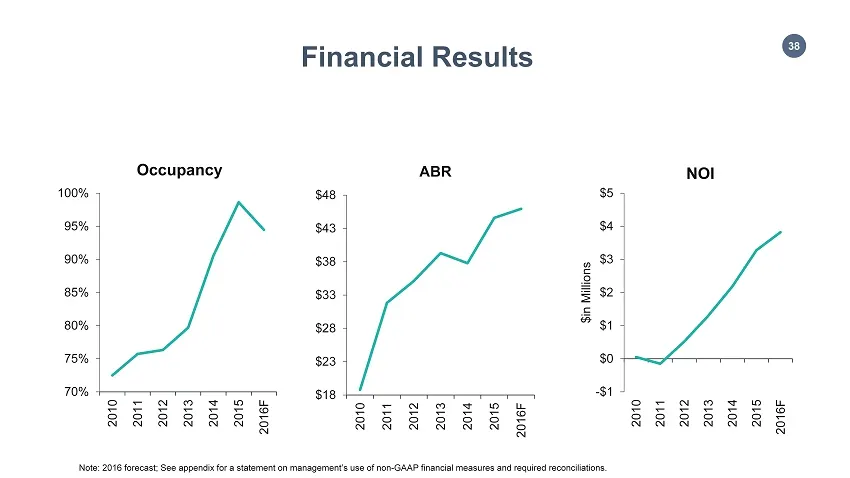
38 70% 75% 80% 85% 90% 95% 100% 2010 2011 2012 2013 2014 2015 2016F Occupancy $18 $23 $28 $33 $38 $43 $48 2010 2011 2012 2013 2014 2015 2016F ABR -$1 $0 $1 $2 $3 $4 $5 2010 2011 2012 2013 2014 2015 2016F $in Millions NOI Financial Results Note: 2016 forecast; See appendix for a statement on manageme
Slide 39: Hawaii Commercial Portfolio
39 Hawaii Commercial Portfolio HIGH - PERFORMING ASSETS WITH EMBEDDED OPPORTUNITY LANCE PARKER,A&B PROPERTIES PRESIDENT 39
Slide 40: Hawaii Portfolio
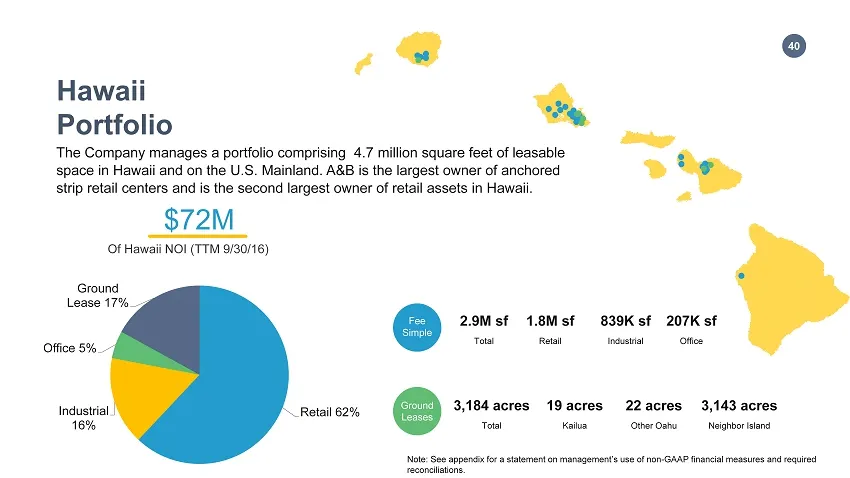
40 Hawaii Portfolio The Company manages a portfolio comprising 4.7 million square feet of leasable space in Hawaii and on the U.S. Mainland. A&B is the largest owner of anchored strip retail centers and is the second largest owner of retail assets in Hawaii. 2.9M sf Total 1.8M sf Retail 839K sf Indu
Slide 41: Largest Owner of Strip Retail in Hawaii
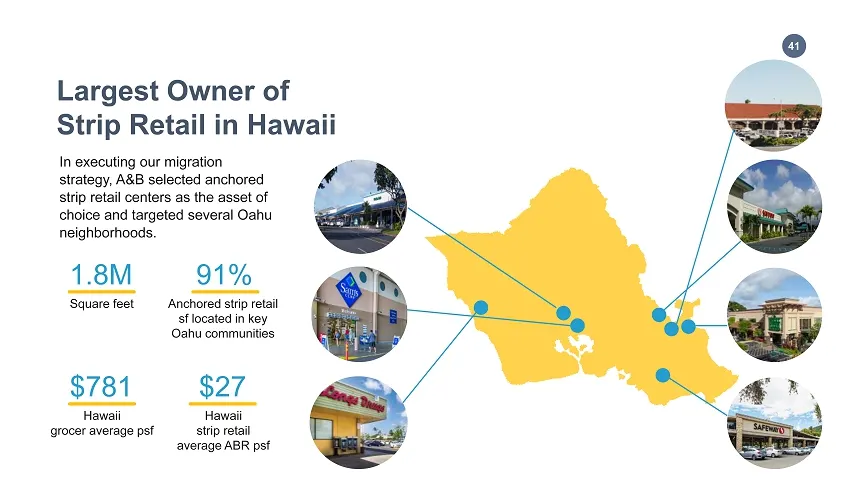
41 Largest Owner of Strip Retail in Hawaii In executing our migration strategy, A&B selected anchored strip retail centers as the asset of choice and targeted several Oahu neighborhoods. 1.8M Square feet 91% Anchored strip retail sf located in key Oahu communities $781 Hawaii grocer average psf $27
Slide 42: Why Hawaii Strip Retail?
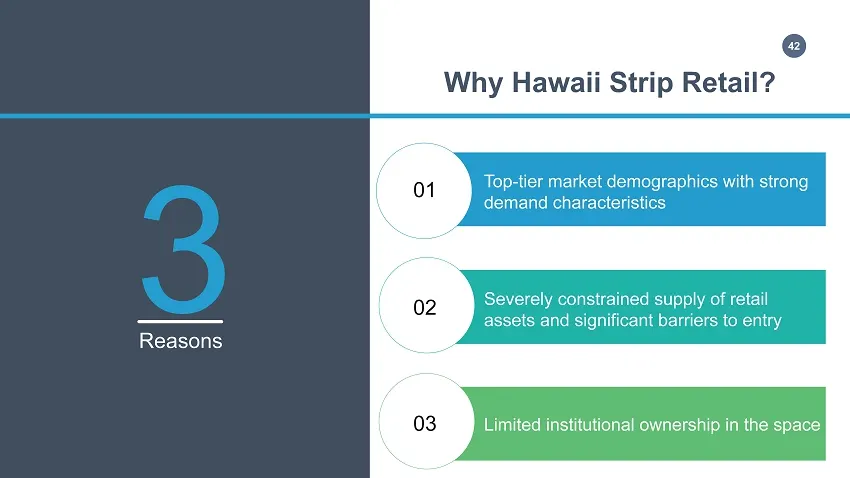
42 Why Hawaii Strip Retail? 01 02 Top - tier market demographics with strong demand characteristics Severely constrained supply of retail assets and significant barriers to entry 03 Limited institutional ownership in the space 3 Reasons
Slide 43: Hawaii is a Top Tier Market
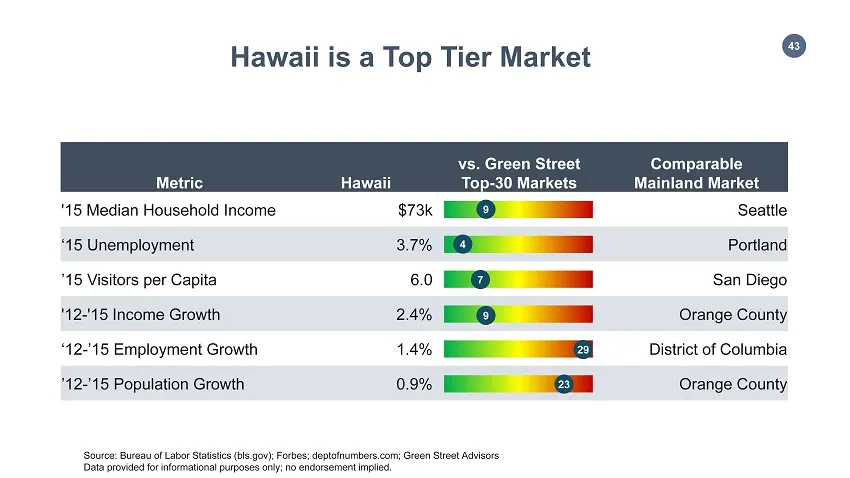
43 Metric Hawaii vs. Green Street Top - 30 Markets Comparable Mainland Market '15 Median Household Income $ 73k Seattle ‘15 Unemployment 3.7% Portland ’15 Visitors per Capita 6.0 San Diego '12 - '15 Income Growth 2.4% Orange County ‘12 - ’15 Employment Growth 1.4% District of Columbia ’12 - ’15 Popu
Slide 44: Hawaii is a High Income Market
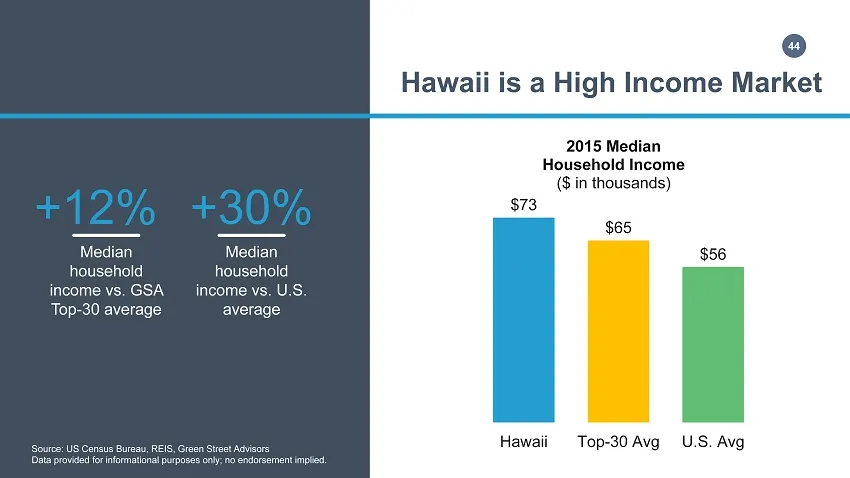
44 Hawaii is a High Income Market Source: US Census Bureau, REIS, Green Street Advisors Data provided for informational purposes only; no endorsement implied . +12% +30% Median household i ncome vs. GSA Top - 30 average Median household i ncome vs. U.S. average $73 $65 $56 Hawaii Top-30 Avg U.S. Avg
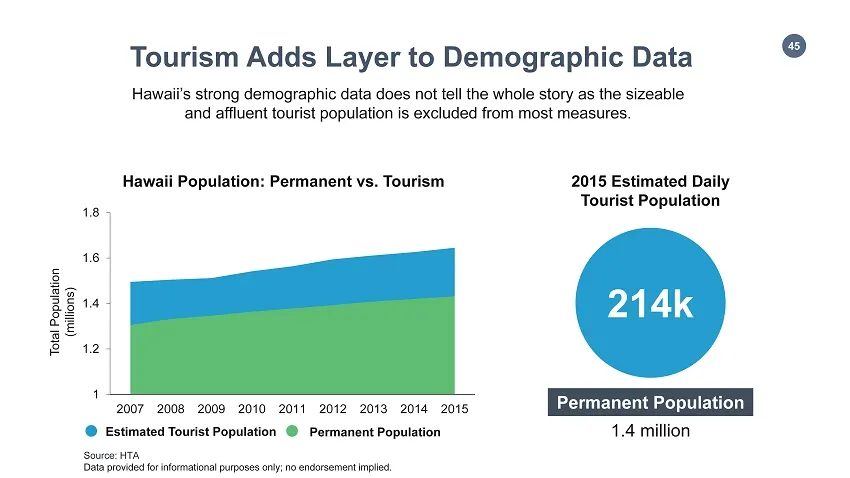
Slide 45: Tourism Adds Layer to Demographic Data
45 Estimated Tourist Population Permanent Population 214k 2015 Estimated Daily Tourist Population 1 1.2 1.4 1.6 1.8 2007 2008 2009 2010 2011 2012 2013 2014 2015 Hawaii Population: Permanent vs. Tourism Total Population (millions) Permanent Population 1.4 million Hawaii’s strong demographic data does
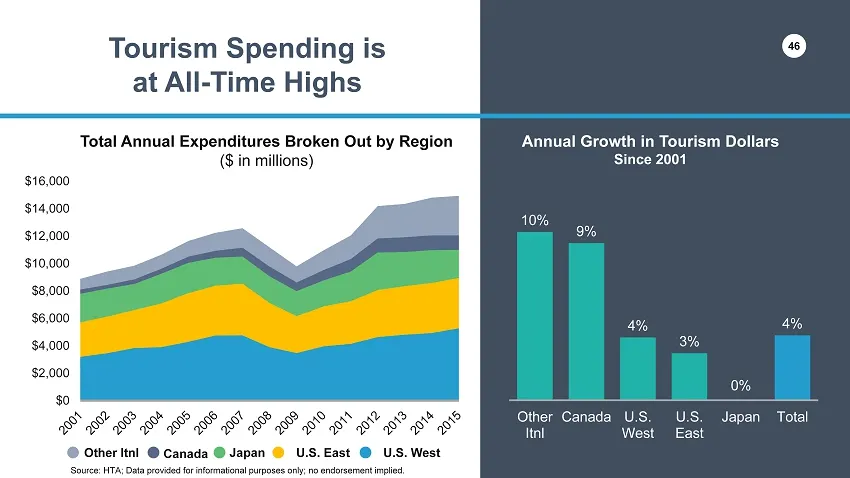
Slide 46: Total Tourism Spending at All-Time Highs
46 Source: HTA; Data provided for informational purposes only; no endorsement implied . $0 $2,000 $4,000 $6,000 $8,000 $10,000 $12,000 $14,000 $16,000 Annual Growth in Tourism Dollars Since 2001 10% 9% 4% 3% 0% 4% Other Itnl Canada U.S. West U.S. East Japan Total Tourism Spending is at All - Time Hi
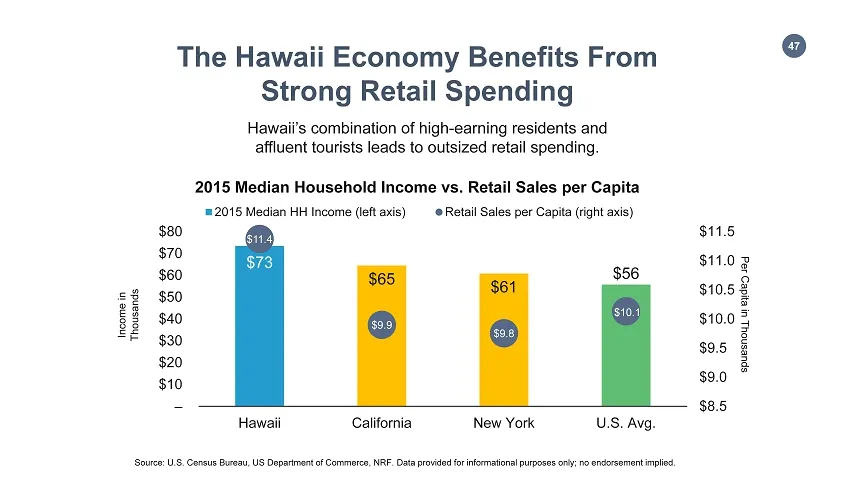
Slide 47: Strong Retail Spending
47 Source: U.S. Census Bureau, US Department of Commerce, NRF. Data provided for informational purposes only; no endorsement implied . $73 $65 $61 $56 $11.4 $9.9 $9.8 $10.1 $8.5 $9.0 $9.5 $10.0 $10.5 $11.0 $11.5 – $10 $20 $30 $40 $50 $60 $70 $80 Hawaii California New York U.S. Avg. 2015 Median House
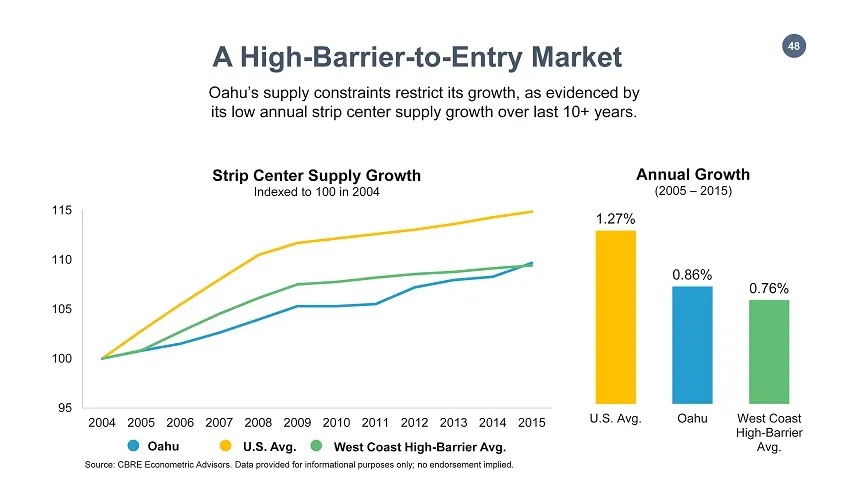
Slide 48: A High-Barrier-to-Entry Market
48 Oahu’s supply constraints restrict its growth, as evidenced by its low annual strip center supply growth over last 10+ years. 95 100 105 110 115 2004 2005 2006 2007 2008 2009 2010 2011 2012 2013 2014 2015 Strip Center Supply Growth Indexed to 100 in 2004 Source : CBRE Econometric Advisors. Data p
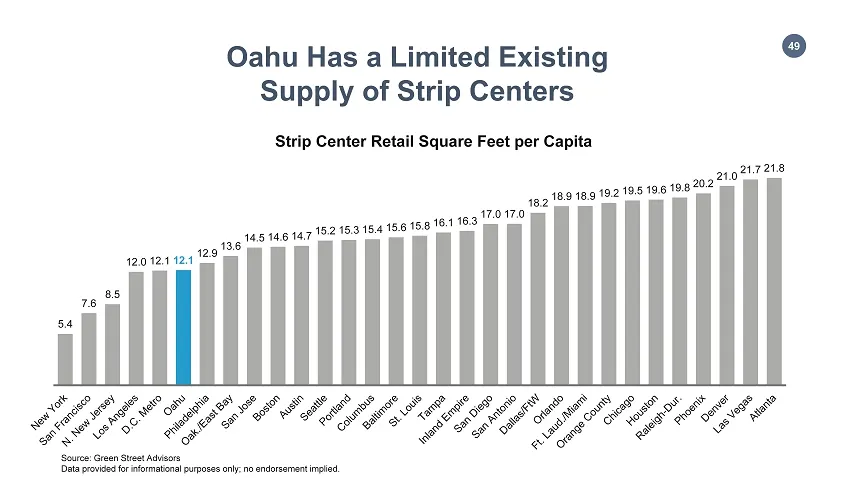
Slide 49: Limited Existing Supply of Strip Centers
49 5.4 7.6 8.5 12.0 12.1 12.1 12.9 13.6 14.5 14.6 14.7 15.2 15.3 15.4 15.6 15.8 16.1 16.3 17.0 17.0 18.2 18.9 18.9 19.2 19.5 19.6 19.8 20.2 21.0 21.7 21.8 Strip Center Retail Square Feet per Capita Oahu Has a Limited Existing Supply of Strip Centers Source : Green Street Advisors Data provided for i
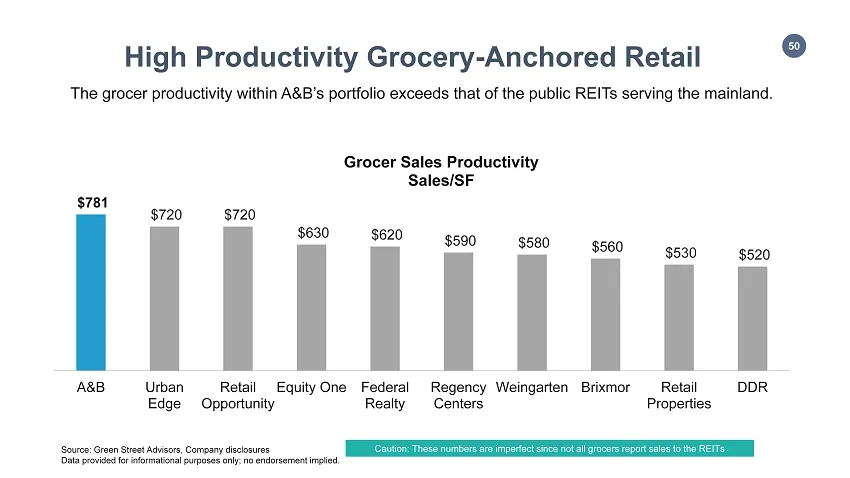
Slide 50: High Productivity Grocery-Anchored Retail
50 Source : Green Street Advisors, Company disclosures Data provided for informational purposes only; no endorsement implied. The grocer productivity within A&B’s portfolio exceeds that of the public REITs serving the mainland. $781 $720 $720 $630 $620 $590 $580 $560 $530 $520 A&B Urban Edge Retail
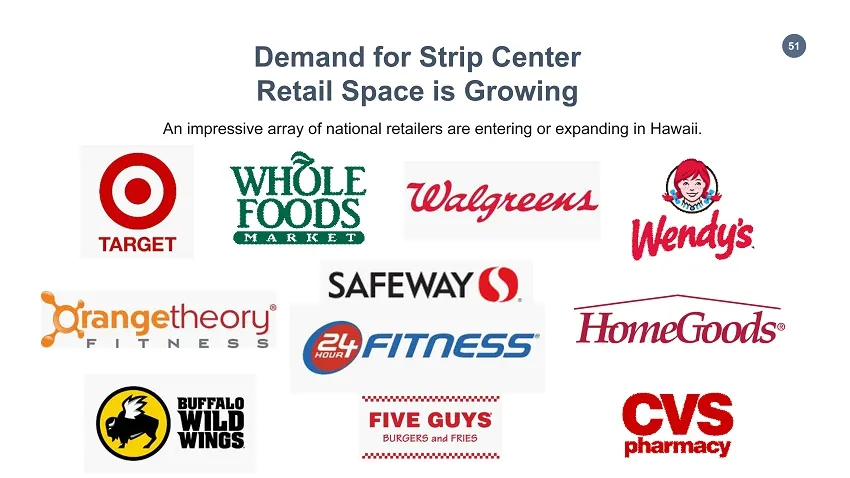
Slide 51: Demand for Strip Center Retail Space is Growing
51 An impressive array of national retailers are entering or expanding in Hawaii. Demand for Strip Center Retail Space is Growing
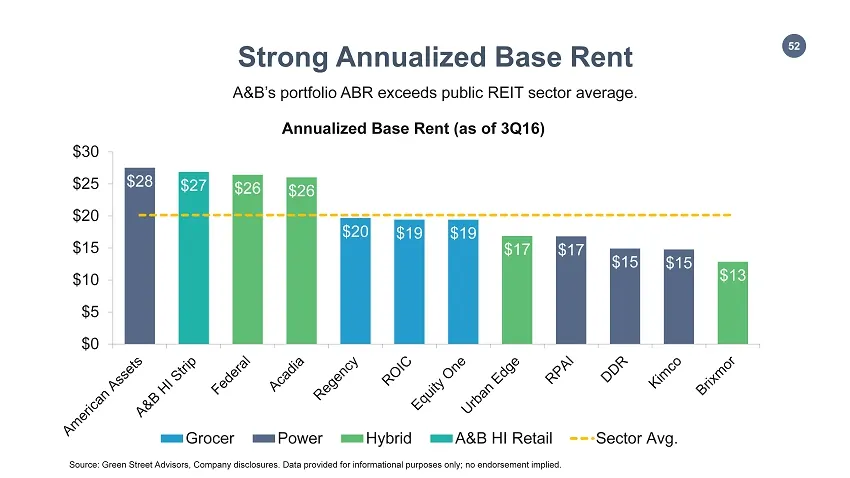
Slide 52: Strong Annualized Base Rent
52 Strong Annualized Base Rent A&B’s portfolio ABR exceeds public REIT sector average. $20 $19 $19 $28 $17 $15 $15 $26 $26 $17 $13 $27 $0 $5 $10 $15 $20 $25 $30 Annualized Base Rent (as of 3Q16) Grocer Power Hybrid A&B HI Retail Sector Avg. Source : Green Street Advisors, Company disclosures. Data p
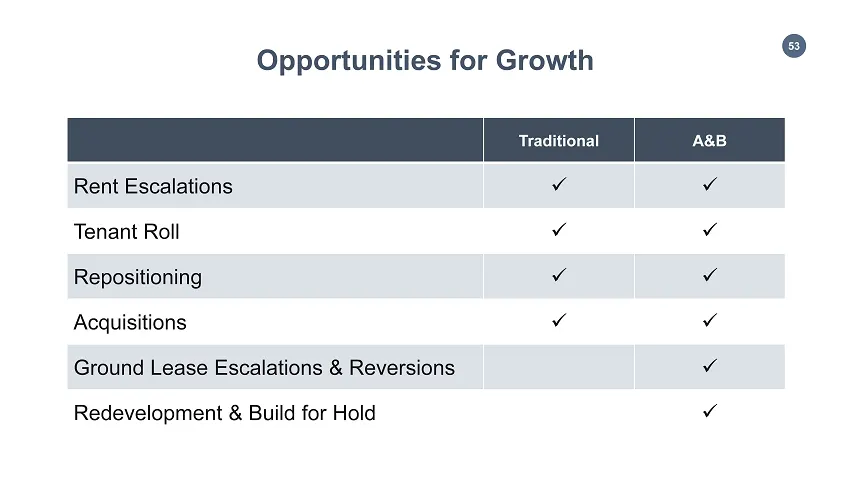
Slide 53: Opportunities for Growth
53 Opportunities for Growth Traditional A&B Rent Escalations x x Tenant Roll x x Repositioning x x Acquisitions x x Ground Lease Escalations & Reversions x Redevelopment & Build for Hold x
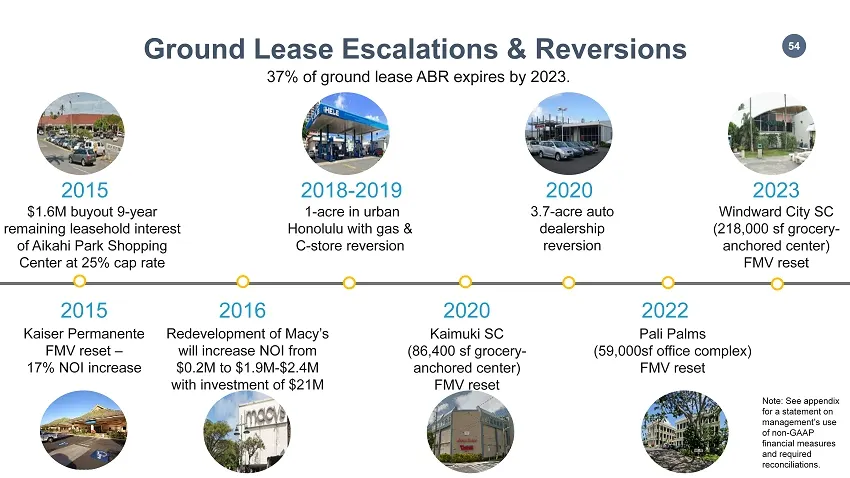
Slide 54: Ground Lease Escalations & Reversions
54 Redevelopment of Macy’s will increase NOI from $0.2M to $1.9M - $2.4M with investment of $21M 2016 1 - acre in urban Honolulu with gas & C - store reversion 2018 - 2019 Ground Lease Escalations & Reversions Windward City SC (218,000 sf grocery - anchored center) FMV reset 2023 Pali Palms ( 59,000
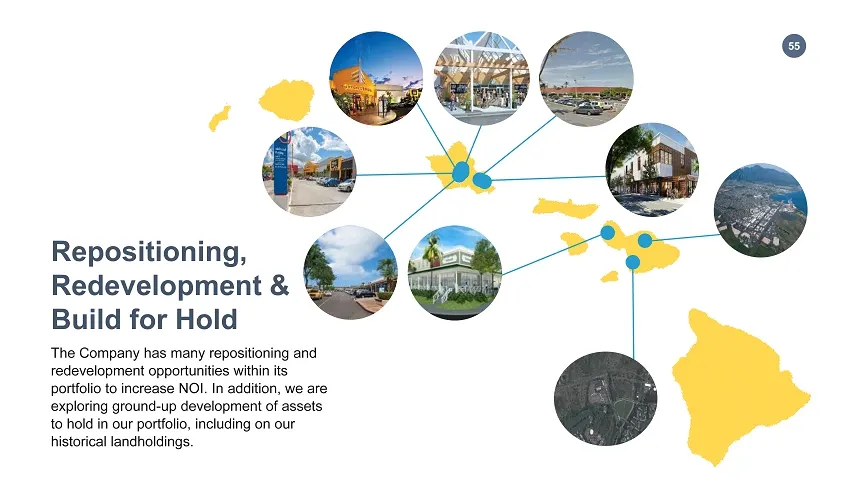
Slide 55: Repositioning, Redevelopment & Build for Hold
55 Repositioning, Redevelopment & Build for Hold The Company has many repositioning and redevelopment opportunities within its portfolio to increase NOI. In addition, we are exploring ground - up development of assets to hold in our portfolio, including on our historical landholdings.
Slide 56: Development
56 Development ADVANCING & MONETIZING A DIVERSE PIPELINE LANCE PARKER,A&B PROPERTIES PRESIDENT 56
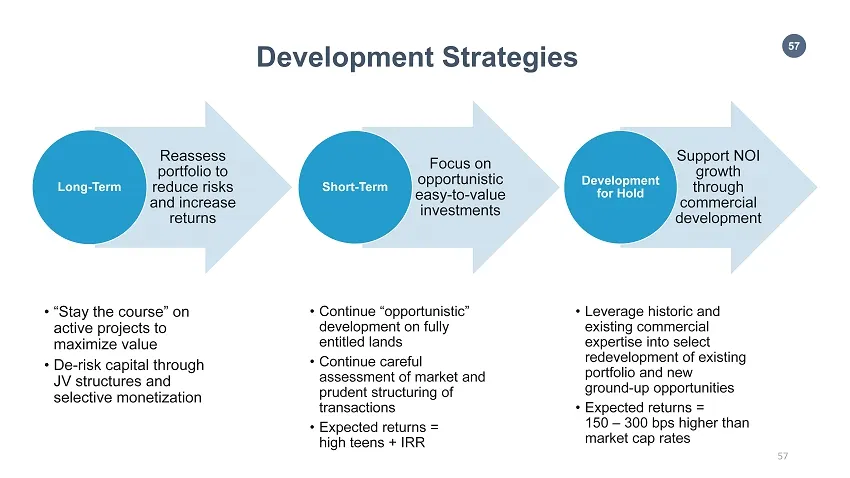
Slide 57: Development Strategies
57 • “Stay the course” on active projects to maximize value • De - risk capital through JV structures and selective monetization 57 Reassess portfolio to reduce risks and increase returns Long - Term Focus on opportunistic easy - to - value investments Short - Term Support NOI growth through commerc
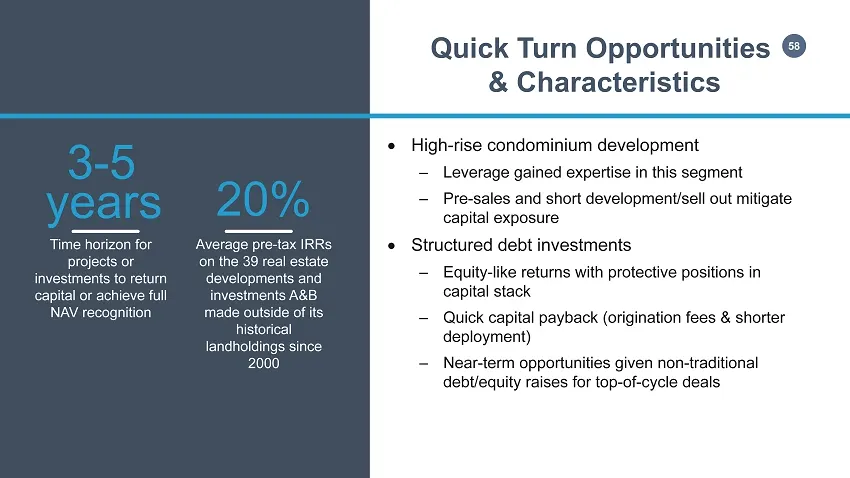
Slide 58: Quick Turn Opportunities & Characteristics
58 Quick Turn Opportunities & Characteristics years 20% High - rise condominium development – Leverage gained expertise in this segment – Pre - sales and short development/sell out mitigate capital exposure Structured debt investments – Equity - like returns with protective positions in capital
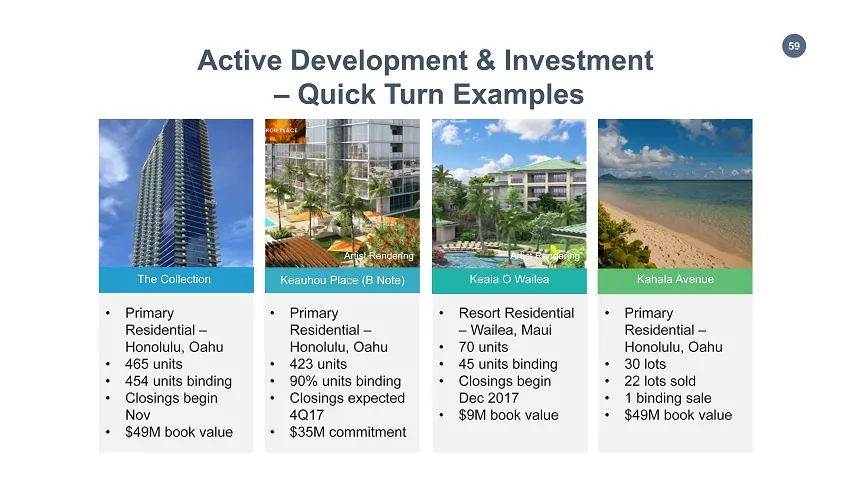
Slide 59: Active Development & Investment – Quick Turn Examples
59 The Collection Keauhou Place (B Note) Keala O Wailea Kahala Avenue Active Development & Investment – Quick Turn Examples Artist Rendering • Primary Residential – Honolulu, Oahu • 465 units • 454 units binding • Closings begin Nov • $49M book value • Resort Residential – Wailea, Maui • 70 units •
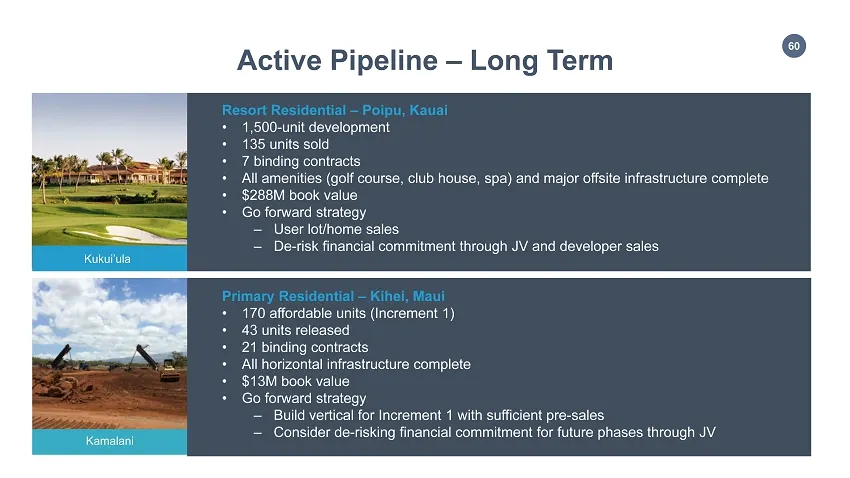
Slide 60: Active Pipeline – Long Term: Kukui'ula, Kamalani
60 Kukui’ula Kamalani Active Pipeline – Long Term Resort Residential – Poipu, Kauai • 1,500 - unit development • 135 units sold • 7 binding contracts • All amenities (golf course, club house, spa) and major offsite infrastructure complete • $288M book value • Go forward strategy – User lot/home sale
Slide 61: Active Pipeline – Long Term: Wailea, Maui Business Park
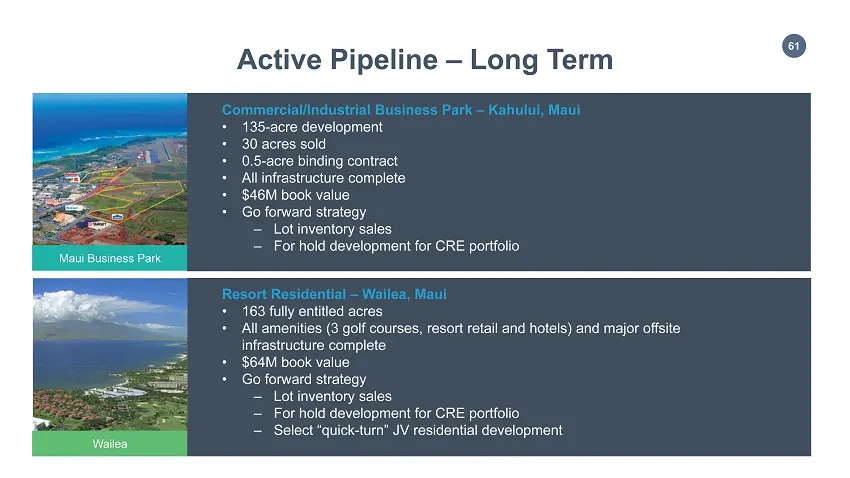
61 Maui Business Park Wailea Active Pipeline – Long Term Resort Residential – Wailea, Maui • 163 fully entitled acres • All amenities (3 golf courses, resort retail and hotels) and major offsite infrastructure complete • $64M book value • Go forward strategy – Lot inventory sales – For hold developm
Slide 62: Acquisitions
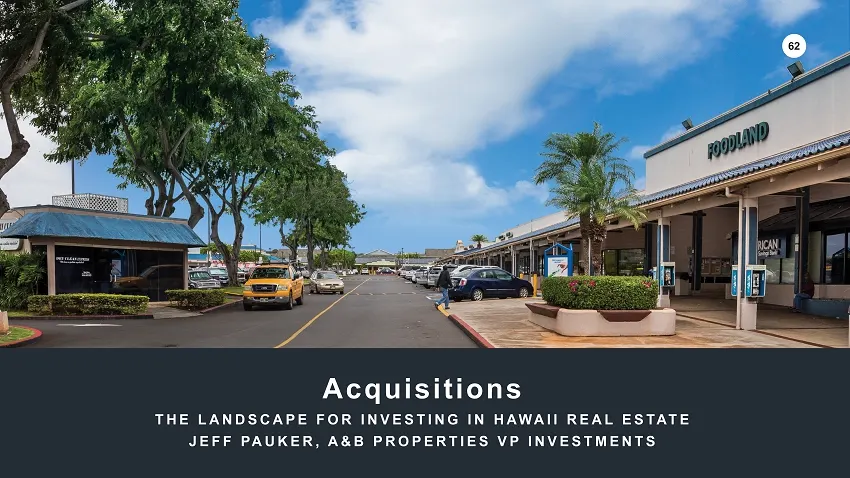
62 Acquisitions THE LANDSCAPE FOR INVESTING IN HAWAII REAL ESTATE JEFF PAUKER, A&B PROPERTIES VP INVESTMENTS 62
Slide 63: Commercial Portfolio Trajectory
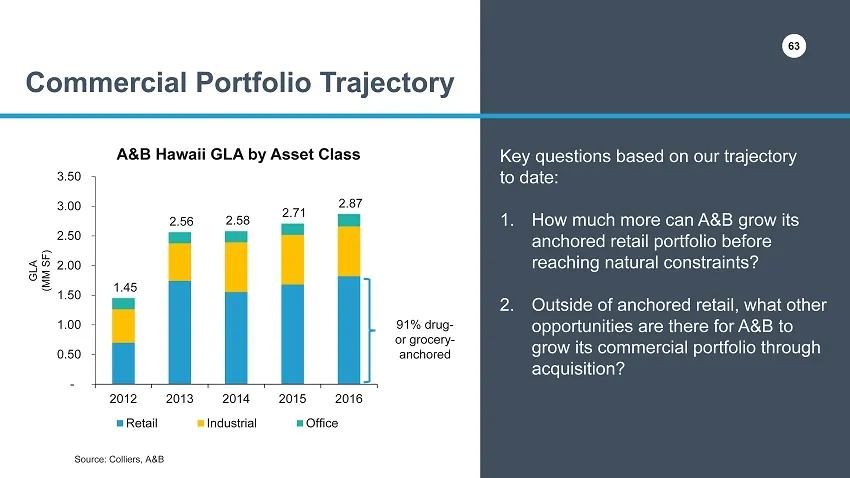
63 1.45 2.56 2.58 2.71 2.87 - 0.50 1.00 1.50 2.00 2.50 3.00 3.50 2012 2013 2014 2015 2016 A&B Hawaii GLA by Asset Class Retail Industrial Office GLA (MM SF) Source: Colliers, A&B 91% drug - or grocery - anchored Commercial Portfolio Trajectory Key questions based on our trajectory to date: 1. How mu
Slide 64: Hawaii Anchored Retail: Plenty of Headroom
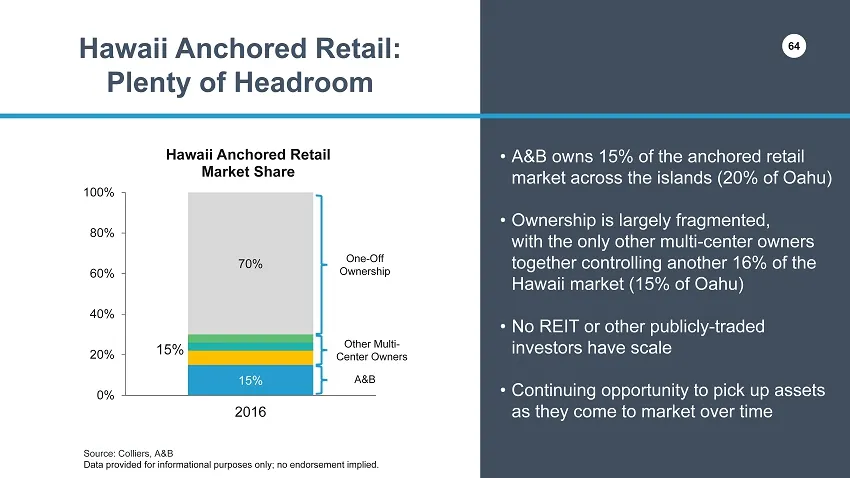
64 Source: Colliers, A&B Data provided for informational purposes only; no endorsement implied . Hawaii Anchored Retail: Plenty of Headroom • A&B owns 15% of the anchored retail market across the islands (20% of Oahu) • Ownership is largely fragmented, with the only other multi - center owners toget
Slide 65: Commercial Investment Potential
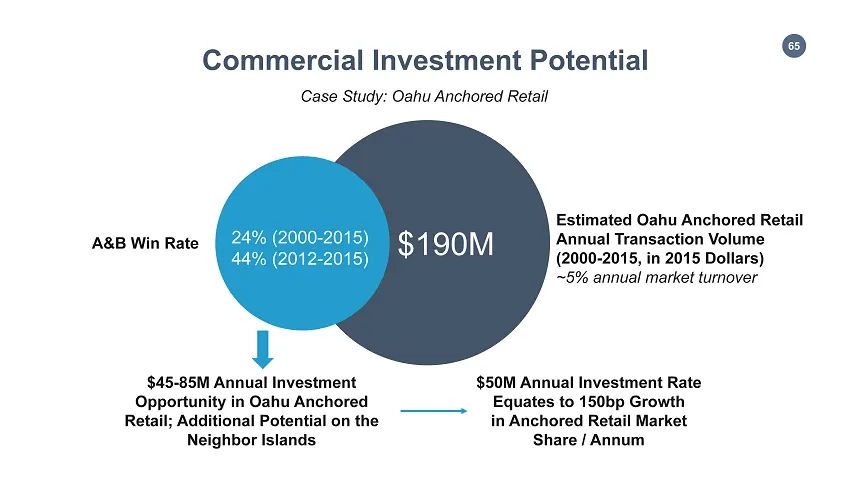
65 Estimated Oahu Anchored Retail Annual Transaction Volume (2000 - 2015, in 2015 Dollars) ~5% annual market turnover $190M 24% (2000 - 2015) 44% (2012 - 2015) A&B Win Rate $45 - 85M Annual Investment Opportunity in Oahu Anchored Retail; Additional Potential on the Neighbor Islands Commercial Invest
Slide 66: Other CRE Portfolio Expansion Opportunities
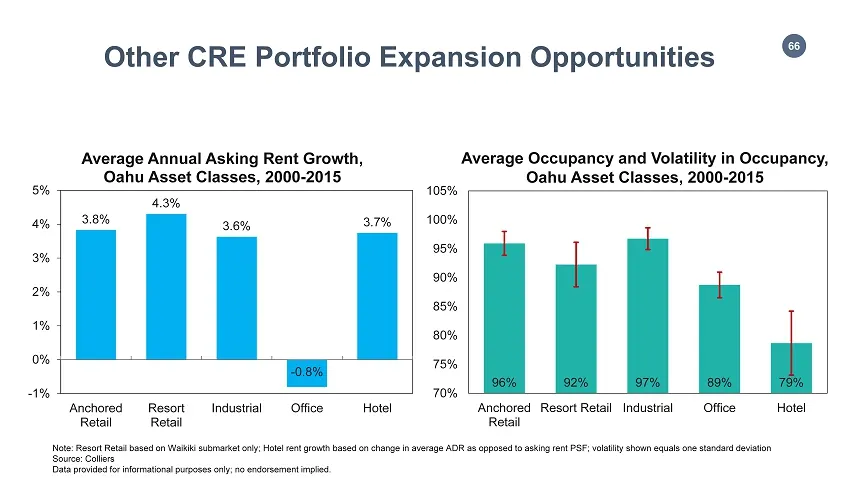
66 3.8% 4.3% 3.6% - 0.8% 3.7% -1% 0% 1% 2% 3% 4% 5% Anchored Retail Resort Retail Industrial Office Hotel Average Annual Asking Rent Growth, Oahu Asset Classes, 2000 - 2015 96% 92% 97% 89% 79% 70% 75% 80% 85% 90% 95% 100% 105% Anchored Retail Resort Retail Industrial Office Hotel Other CRE Portfolio
Slide 67: Industrial Outlier
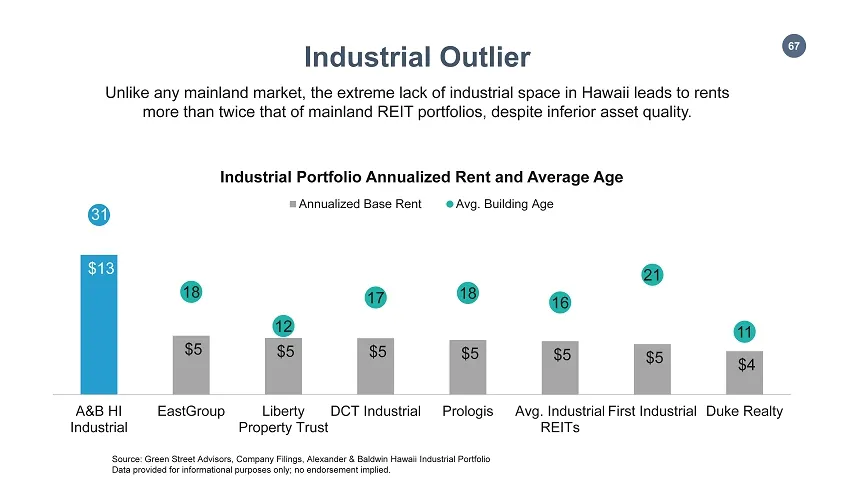
67 Source : Green Street Advisors, Company Filings, Alexander & Baldwin Hawaii Industrial Portfolio Data provided for informational purposes only; no endorsement implied . Unlike any mainland market, the extreme lack of industrial space in Hawaii leads to rents more than twice that of mainland REIT
Slide 68: Low Industrial Supply Growth
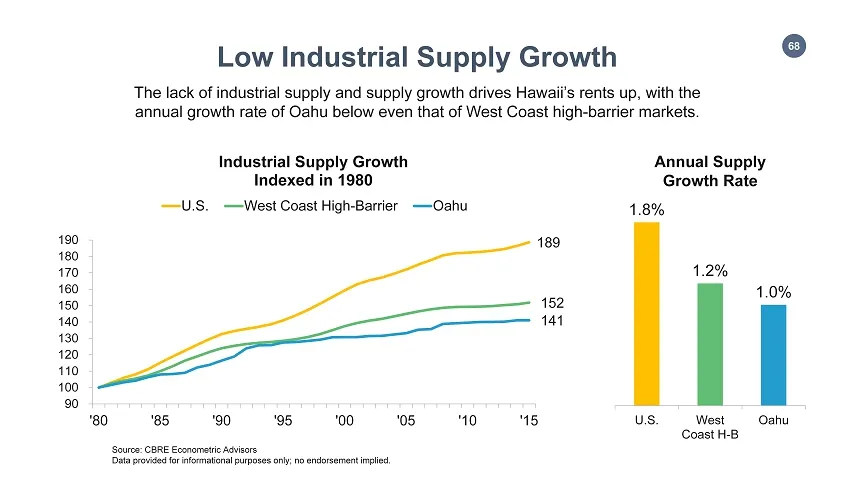
68 Source : CBRE Econometric Advisors Data provided for informational purposes only; no endorsement implied . The lack of industrial supply and supply growth drives Hawaii’s rents up, with the annual growth rate of Oahu below even that of West Coast high - barrier markets. Low Industrial Supply Grow
Slide 69: Opportunistic Approach Will Continue
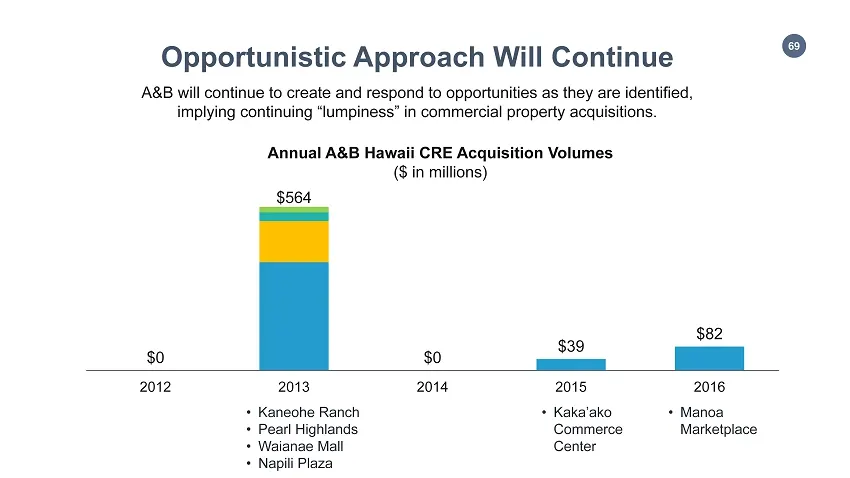
69 $0 $564 $0 $39 $82 2012 2013 2014 2015 2016 • Kaneohe Ranch • Pearl Highlands • Waianae Mall • Napili Plaza • Kaka’ako Commerce Center • Manoa Marketplace A&B will continue to create and respond to opportunities as they are identified, implying continuing “lumpiness” in commercial property acquis
Slide 70: Short-Cycle Developments
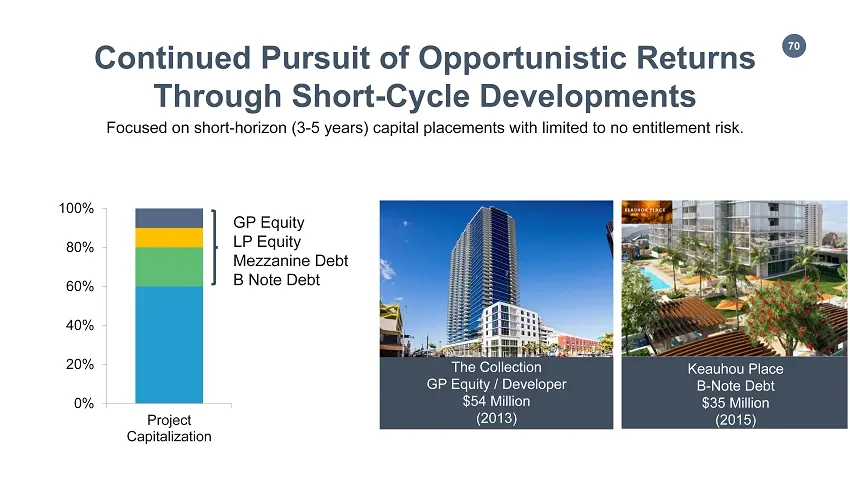
70 Continued Pursuit of Opportunistic Returns Through Short - Cycle Developments Focused on short - horizon (3 - 5 years) capital placements with limited to no entitlement risk. 0% 20% 40% 60% 80% 100% Project Capitalization GP Equity LP Equity Mezzanine Debt B Note Debt The Collection GP Equity / D
Slide 71: Land
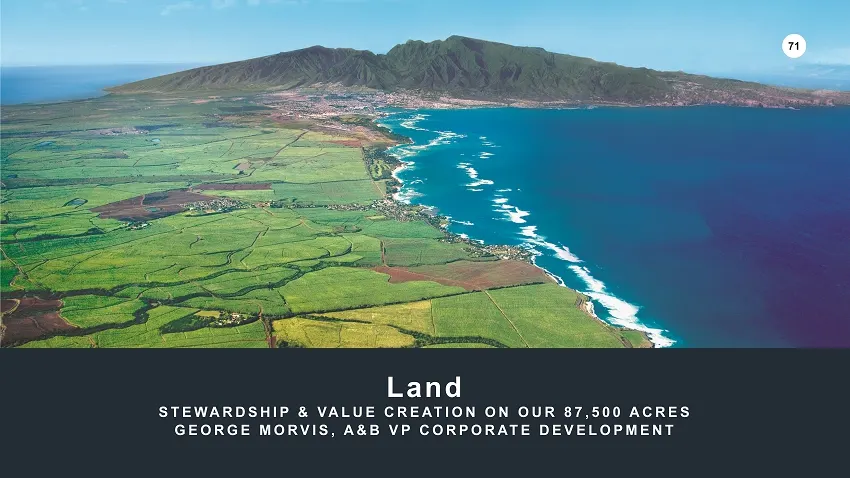
71 Land STEWARDSHIP & VALUE CREATION ON OUR 87,500 ACRES GEORGE MORVIS, A&B VP CORPORATE DEVELOPMENT 71
Slide 72: Unlocking Value From Our 87,500 Acres
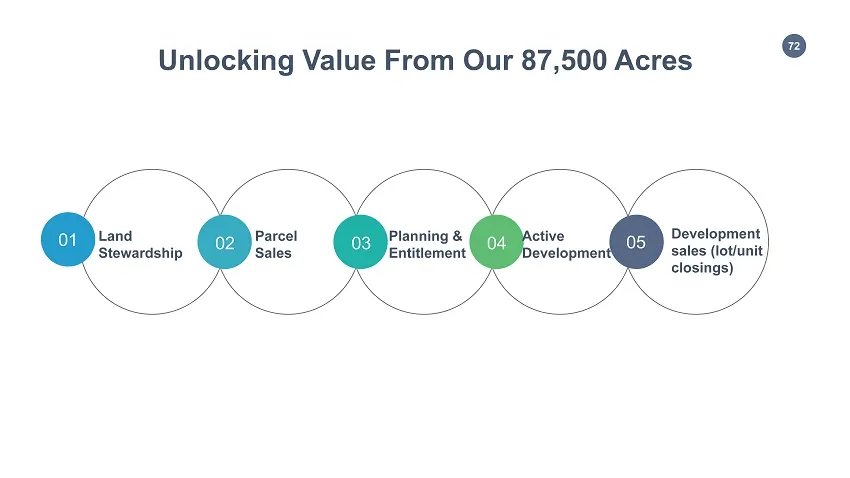
72 Unlocking Value From Our 87,500 Acres 02 03 04 05 Land Stewardship Parcel Sales Planning & Entitlement Active Development Development sales (lot/unit closings) 01
Slide 73: Increasing Focus on Land Management
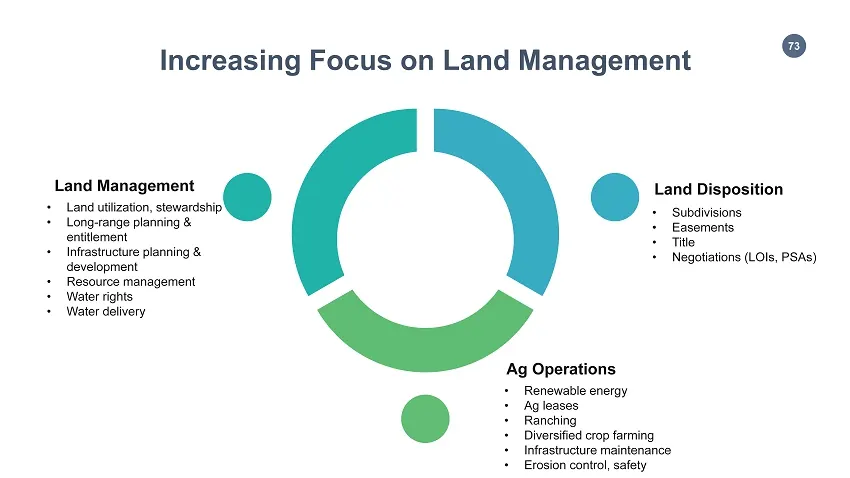
73 Increasing Focus on Land Management Land Management • Land utilization, stewardship • Long - range planning & entitlement • Infrastructure planning & development • Resource management • Water rights • Water delivery Land Disposition • Subdivisions • Easements • Title • Negotiations (LOIs, PSAs) A
Slide 74: Land Management Philosophy
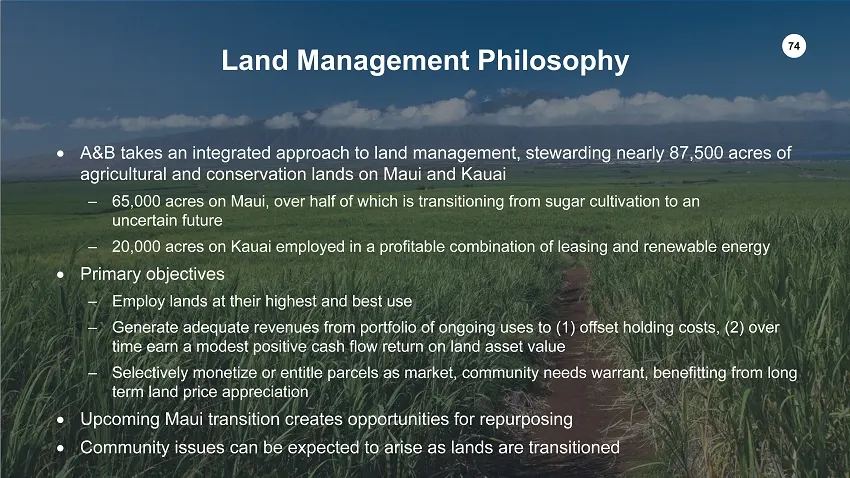
74 Land Management Philosophy A&B takes an integrated approach to land management, stewarding nearly 87,500 acres of agricultural and conservation lands on Maui and Kauai – 65,000 acres on Maui, over half of which is transitioning from sugar cultivation to an uncertain future – 20,000 acres on Kau
Slide 75: Land Management Strategies & Tactics
75 Land Management Strategies & Tactics Manage on an integrated basis for long - term value creation – Ongoing planning & dialogue with key stakeholders to ensure appropriate uses, adjacencies, access, etc. across various time horizons – Preservation of resources and infrastructure will preserve a
Slide 76: Long Range Planning & Entitlement
76 Long Range Planning & Entitlement Focus on identifying ag lands suitable for future growth and moving them through Hawaii’s complicated and lengthy entitlement process – Length of process makes it essential to focus on long - term demand – Success not measured solely by speed through process ▪
Slide 77: Land Monetization
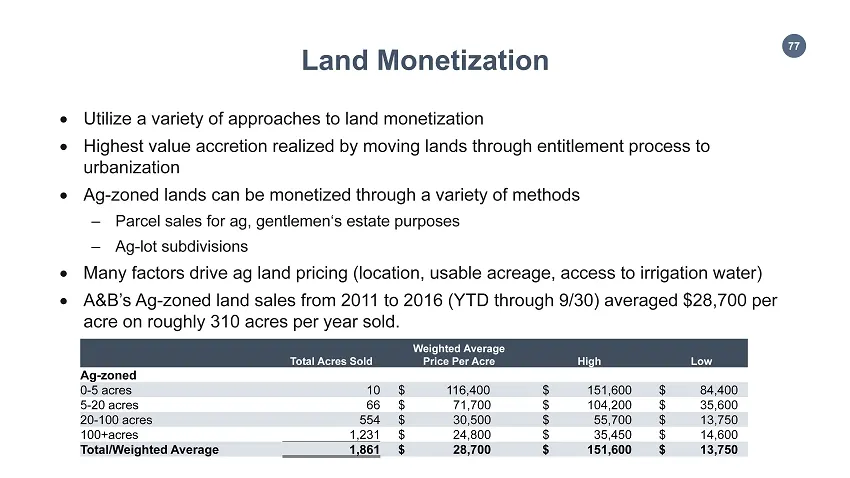
77 Land Monetization Utilize a variety of approaches to land monetization Highest value accretion realized by moving lands through entitlement process to urbanization Ag - zoned lands can be monetized through a variety of methods – Parcel sales for ag, gentlemen‘s estate purposes – Ag - lot su
Slide 78: Ag Operations Strategies & Tactics
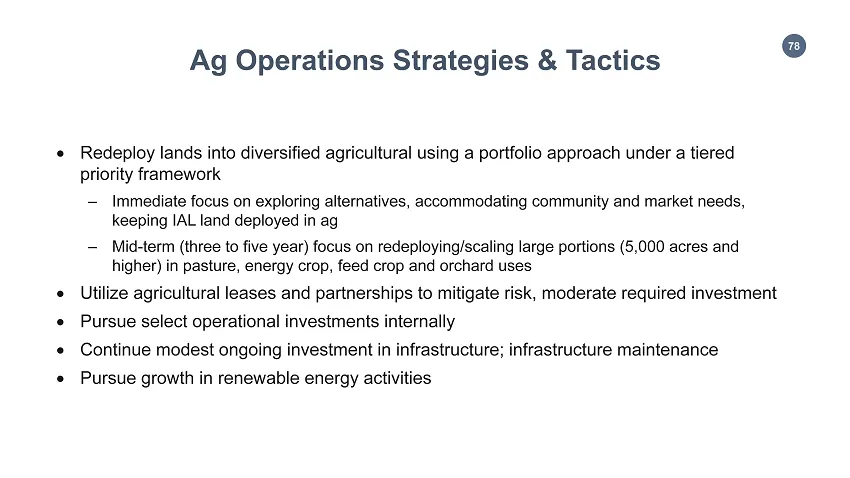
78 Ag Operations Strategies & Tactics Redeploy lands into diversified agricultural using a portfolio approach under a tiered priority framework – Immediate focus on exploring alternatives, accommodating community and market needs, keeping IAL land deployed in ag – Mid - term (three to five year) f
Slide 79: A Portfolio Approach: The McBryde Example
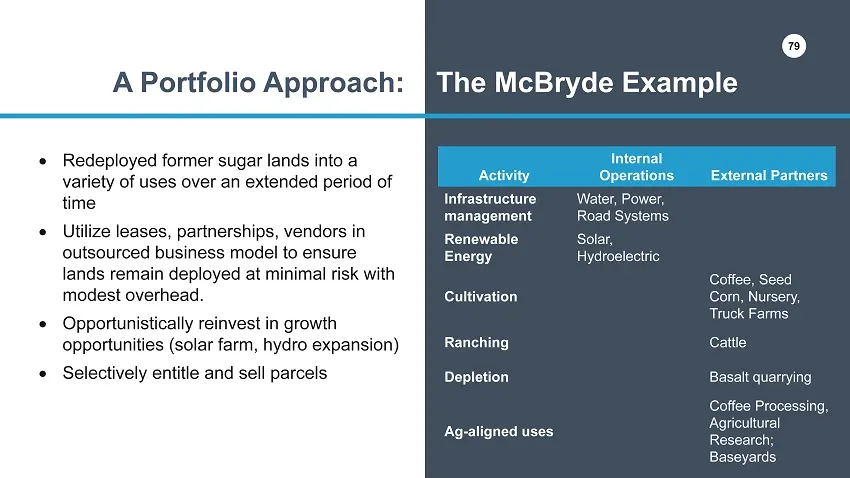
79 A Portfolio Approach: The McBryde Example Activity Internal Operations External Partners Infrastructure management Water, Power, Road Systems Renewable Energy Solar, Hydroelectric Cultivation Coffee, Seed Corn, Nursery, Truck Farms Ranching Cattle Depletion Basalt quarrying Ag - aligned uses Coff
Slide 80: Materials & Construction
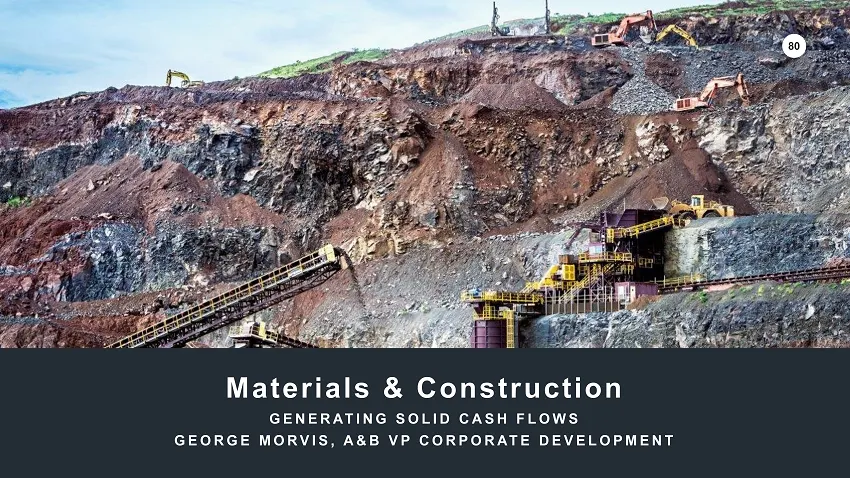
80 Materials & Construction GENERATING SOLID CASH FLOWS GEORGE MORVIS, A&B VP CORPORATE DEVELOPMENT 80
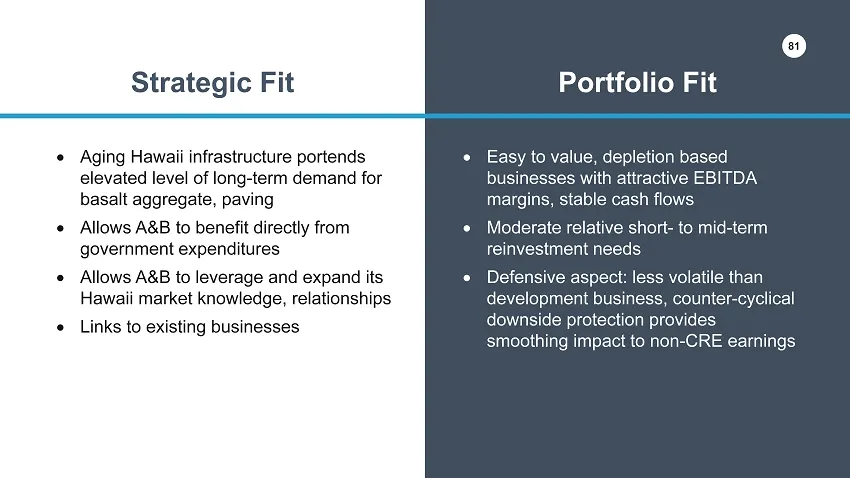
Slide 81: Strategic Fit
81 Strategic Fit Portfolio Fit Aging Hawaii infrastructure portends elevated level of long - term demand for basalt aggregate, paving Allows A&B to benefit directly from government expenditures Allows A&B to leverage and expand its Hawaii market knowledge, relationships Links to existing bus
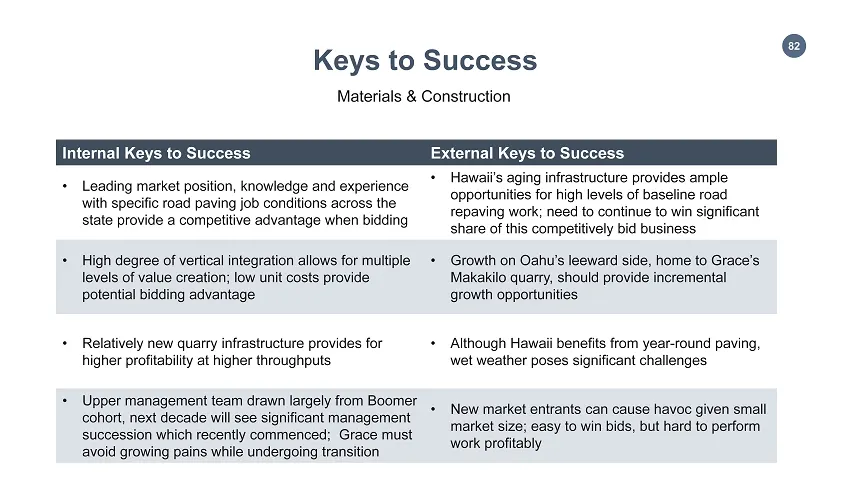
Slide 82: Internal and External Keys to Success
82 Internal Keys to Success External Keys to Success • Leading market position, knowledge and experience with specific road paving job conditions across the state provide a competitive advantage when bidding • Hawaii’s aging infrastructure provides ample opportunities for high levels of baseline roa
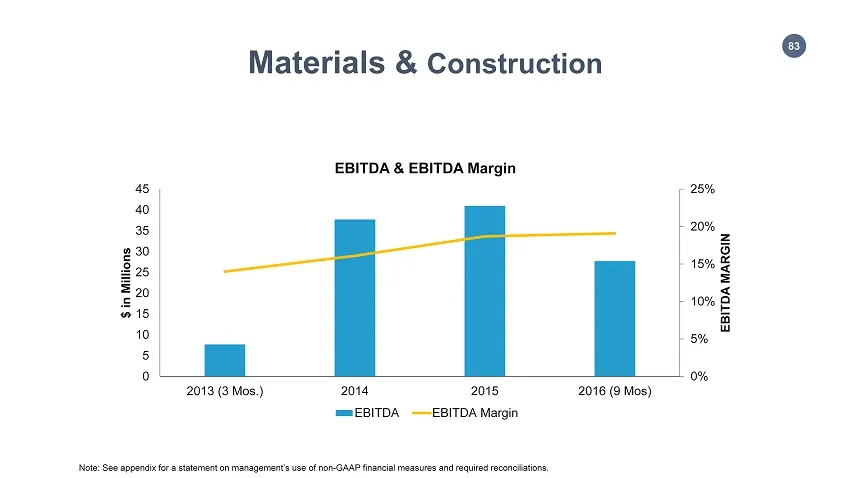
Slide 83: EBITDA & EBITDA Margin
83 Materials & Construction 0% 5% 10% 15% 20% 25% 0 5 10 15 20 25 30 35 40 45 2013 (3 Mos.) 2014 2015 2016 (9 Mos) EBITDA MARGIN $ in Millions EBITDA & EBITDA Margin EBITDA EBITDA Margin Note: See appendix for a statement on management’s use of non - GAAP financial measures and required reconciliati
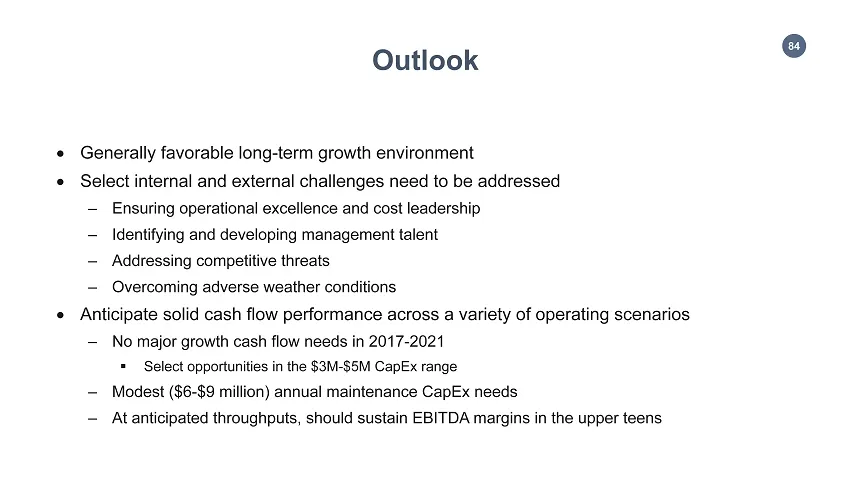
Slide 84: Outlook
84 Outlook Generally favorable long - term growth environment Select internal and external challenges need to be addressed – Ensuring operational excellence and cost leadership – Identifying and developing management talent – Addressing competitive threats – Overcoming adverse weather conditions
Slide 85: Financials
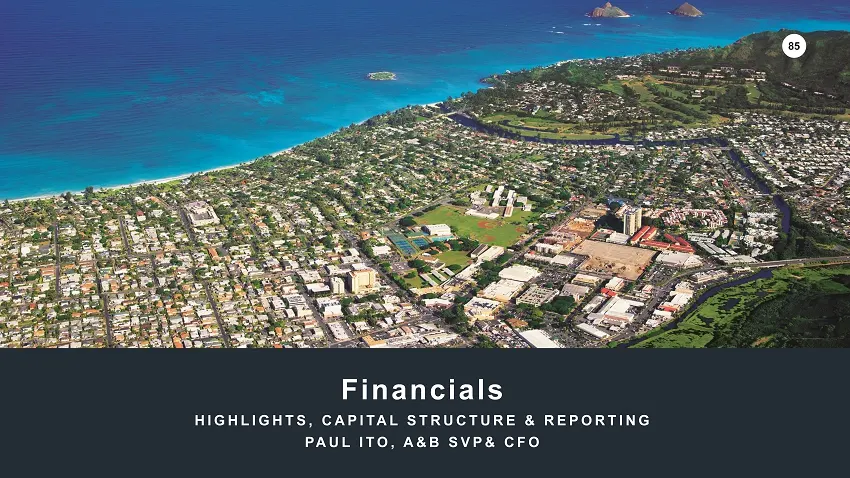
85 Financials HIGHLIGHTS, CAPITAL STRUCTURE & REPORTING PAUL ITO, A&B SVP& CFO 85
Slide 86: Financial Profile (TTM 9/30/16)
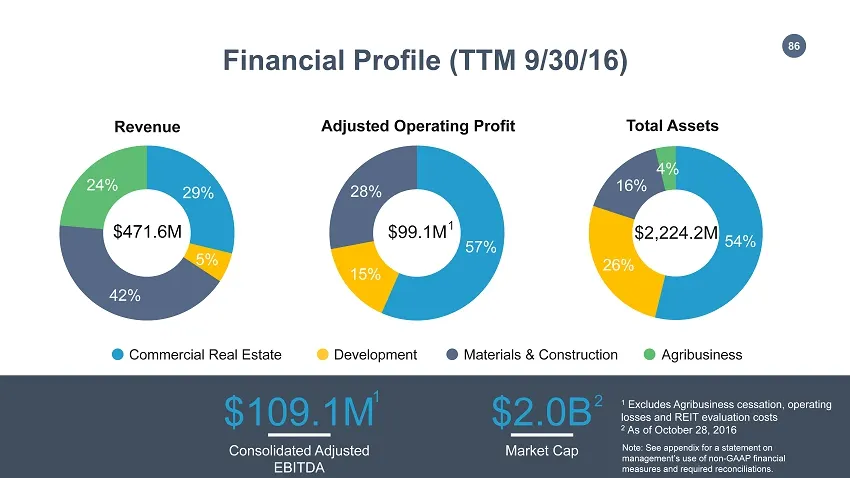
86 Financial Profile (TTM 9/30/16) 29% 5% 42% 24% Revenue $471.6M 57% 15% 28% Adjusted Operating Profit 54% 26% 16% 4% Total Assets Commercial Real Estate Development Materials & Construction Agribusiness $99.1M Consolidated Adjusted EBITDA $109.1M Market Cap $2.0B $2,224.2M 1 1 Excludes Agribusines
Slide 87: Balance Sheet Philosophy
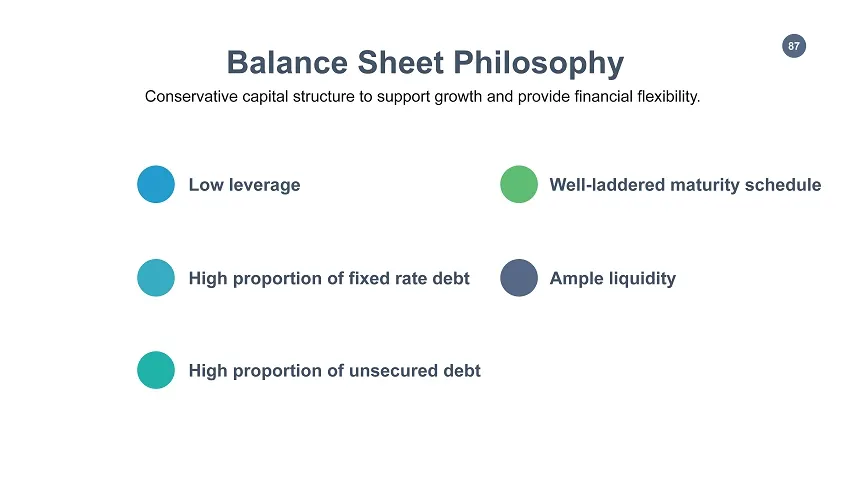
87 Low leverage Well - laddered maturity schedule High proportion of fixed rate debt Ample liquidity High proportion of unsecured debt Balance Sheet Philosophy Conservative capital structure to support growth and provide financial flexibility.
Slide 88: Liquidity & Debt Metrics
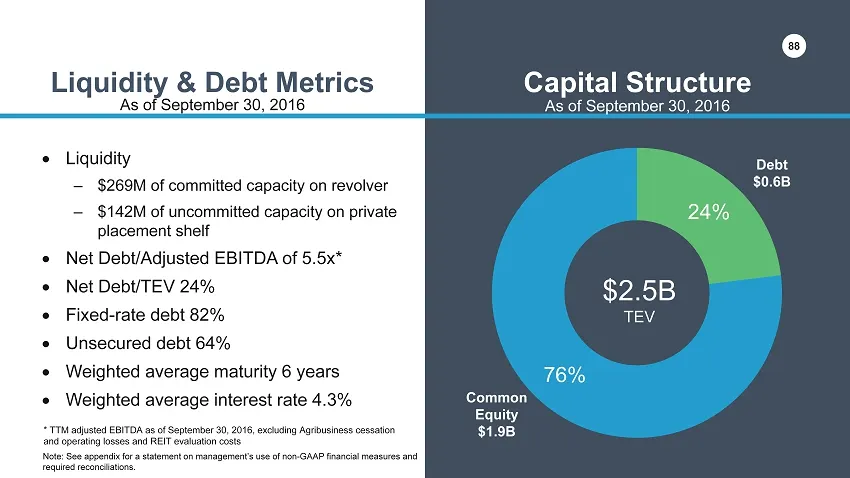
88 24% 76% Liquidity & Debt Metrics Capital Structure Liquidity – $269M of committed capacity on revolver – $142M of uncommitted capacity on private placement shelf Net Debt/Adjusted EBITDA of 5.5x* Net Debt/TEV 24% Fixed - rate debt 82% Unsecured debt 64% Weighted average maturity 6 yea
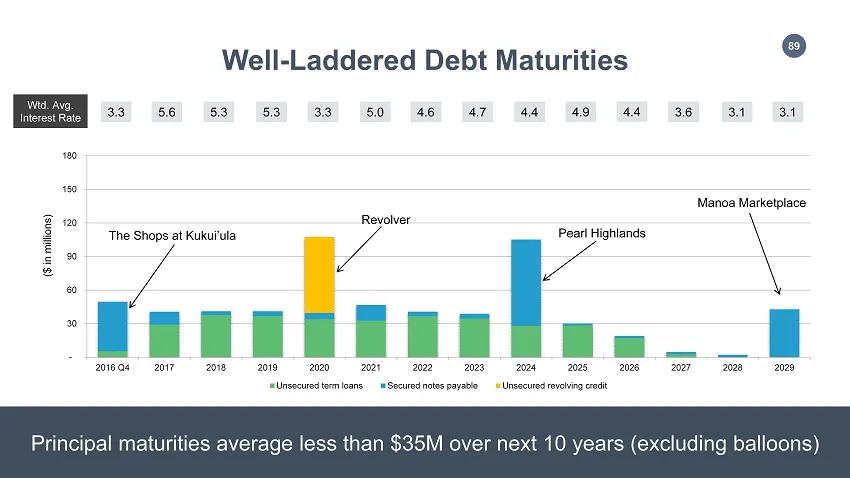
Slide 89: Well-Laddered Debt Maturities
89 - 30 60 90 120 150 180 2016 Q4 2017 2018 2019 2020 2021 2022 2023 2024 2025 2026 2027 2028 2029 Unsecured term loans Secured notes payable Unsecured revolving credit Well - Laddered Debt Maturities The Shops at Kukui’ula Revolver ($ in millions) 3.3 Wtd. Avg. Interest Rate 5.6 5.3 5.3 3.3 5.0 4.6
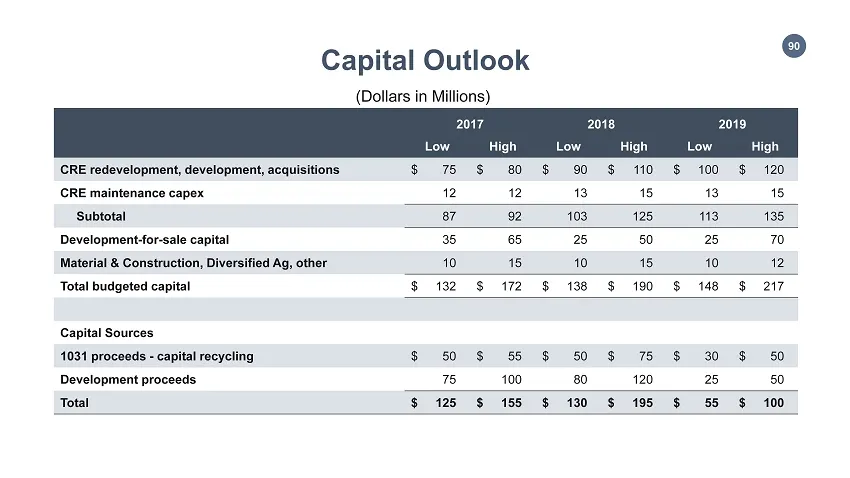
Slide 90: Capital Outlook
90 Capital Outlook 2017 2018 2019 Low High Low High Low High CRE redevelopment, development, acquisitions $ 75 $ 80 $ 90 $ 110 $ 100 $ 120 CRE maintenance capex 12 12 13 15 13 15 Subtotal 87 92 103 125 113 135 Development - for - sale capital 35 65 25 50 25 70 Material & Construction, Diversified Ag
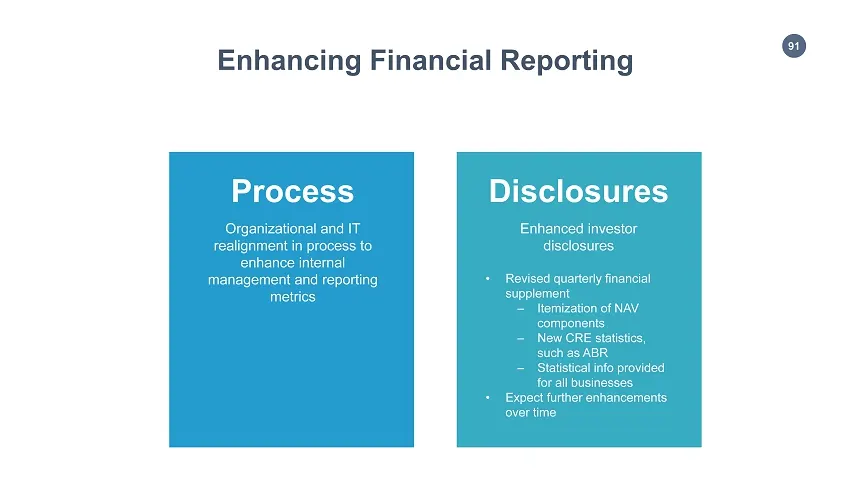
Slide 91: Enhancing Financial Reporting
91 Process Organizational and IT realignment in process to enhance internal management and reporting metrics Disclosures Enhanced investor disclosures • Revised quarterly financial supplement – Itemization of NAV components – New CRE statistics, such as ABR – Statistical info provided for all busine
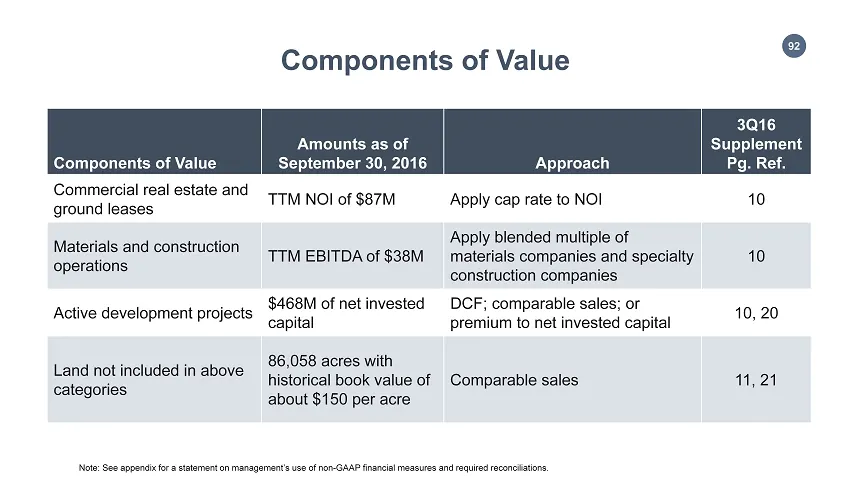
Slide 92: Components of Value
92 Components of Value Components of Value Amounts as of September 30, 2016 Approach 3Q16 Supplement Pg. Ref. Commercial real estate and ground leases TTM NOI of $87M Apply cap rate to NOI 10 Materials and construction operations TTM EBITDA of $38M Apply blended multiple of materials companies and s
Slide 93: Components of Value: Income Producing Assets
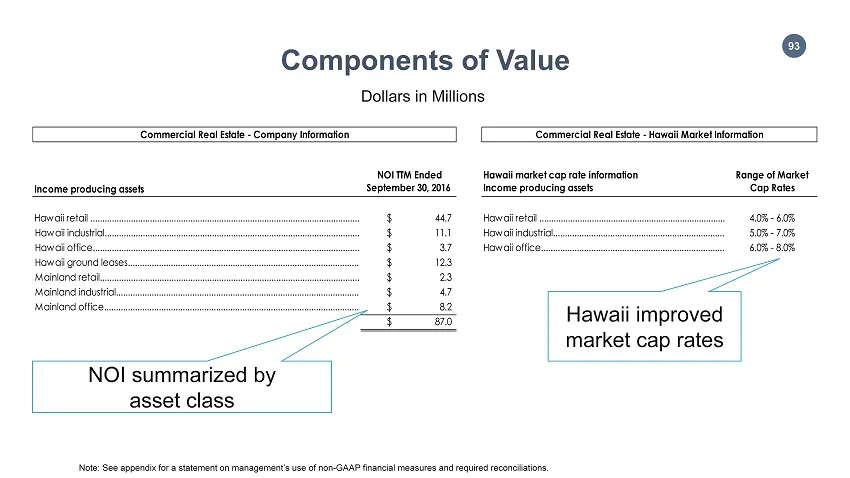
93 Income producing assets NOI TTM Ended September 30, 2016 Hawaii market cap rate information Income producing assets Range of Market Cap Rates 44.7$ Hawaii retail .............................................................................. 4.0% - 6.0% 11.1$ Hawaii industrial.....................
Slide 94: Components of Value: Development and Materials
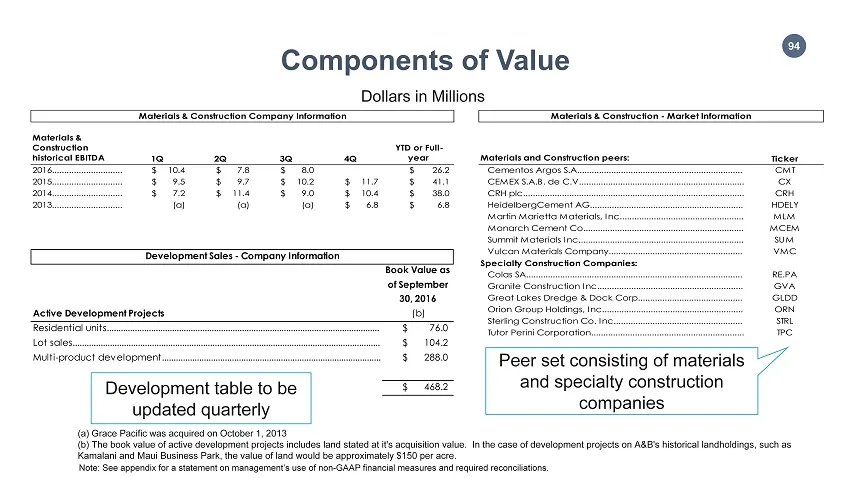
94 Components of Value Peer set consisting of materials and specialty construction companies Development table to be updated quarterly Book Value as of September 30, 2016 Active Development Projects (b) 76.0$ 104.2$ 288.0$ 468.2$ Residential units.....................................................
Slide 95: Components of Value: Landholdings
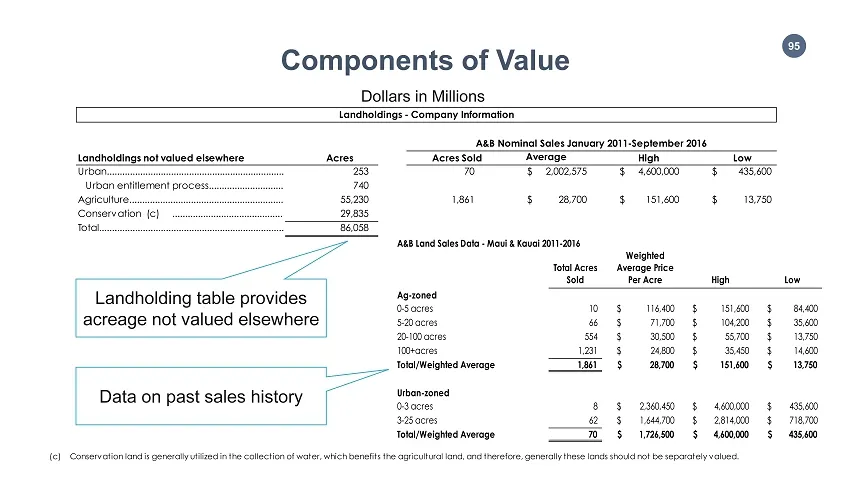
95 Components of Value Landholding table provides acreage not valued elsewhere Data on past sales history (c) Conservation land is generally utilized in the collection of water, which benefits the agricultural land, and therefore, generally these lands should not be separately valued. Acres Sold Ave
Slide 96: Evaluation of the REIT Structure
96 Evaluation of the REIT Structure STRUCTURE FOLLOWS STRATEGY PAUL ITO, A&B SVP & CFO 96
Slide 97: Why Convert to a REIT?
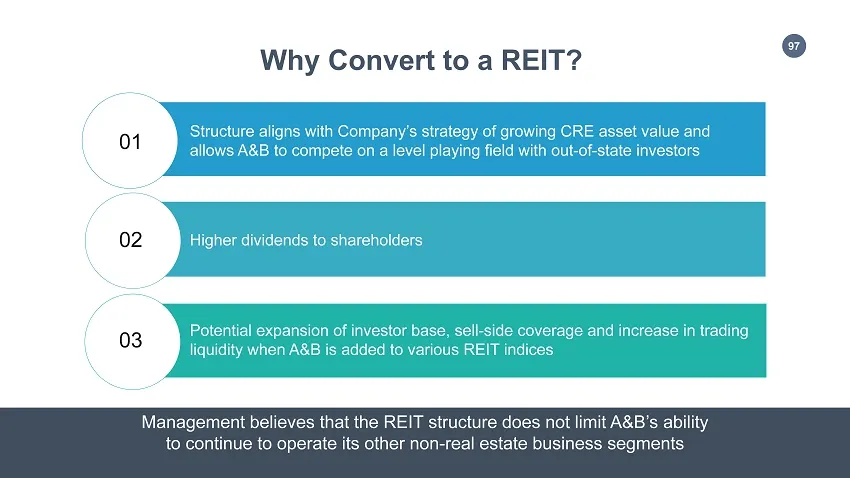
97 Why Convert to a REIT? 01 02 03 Structure aligns with Company’s strategy of growing CRE asset value and allows A&B to compete on a level playing field with out - of - state investors Higher dividends to shareholders Potential expansion of investor base, sell - side coverage and increase in tradin
Slide 98: Current C-Corp vs Potential REIT Structure
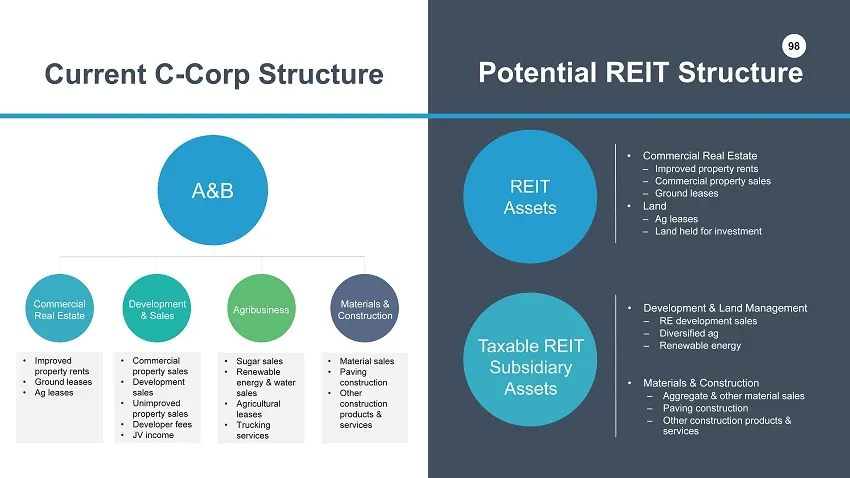
98 Current C - Corp Structure • Improved property rents • Ground leases • Ag leases A&B Commercial Real Estate Development & Sales Agribusiness Materials & Construction • Commercial property sales • Development sales • Unimproved property sales • Developer fees • JV income • Material sales • Paving
Slide 99: Evaluating a REIT Conversion: Where Are We?
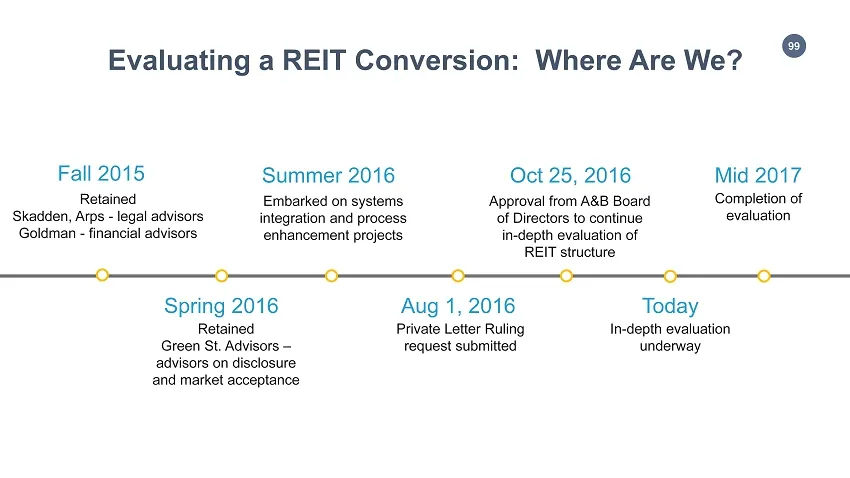
99 Spring 2016 Private Letter Ruling request submitted Aug 1, 2016 Approval from A&B Board of Directors to continue in - depth evaluation of REIT structure Oct 25, 2016 Retained Skadden, Arps - legal advisors Goldman - financial advisors Fall 2015 Today Evaluating a REIT C onversion: Where Are W e ?
Slide 100: Required Steps
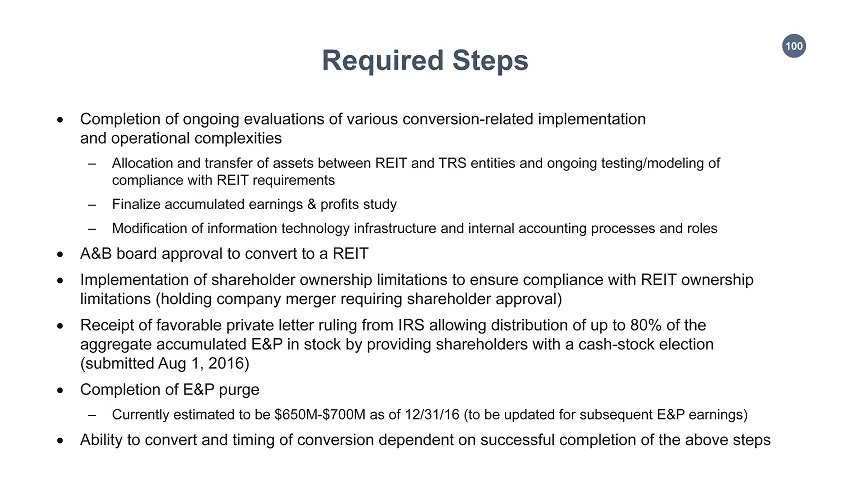
100 Required S teps Completion of ongoing evaluations of various conversion - related implementation and operational complexities – Allocation and transfer of assets between REIT and TRS entities and ongoing testing/modeling of compliance with REIT requirements – Finalize accumulated earnings & pr
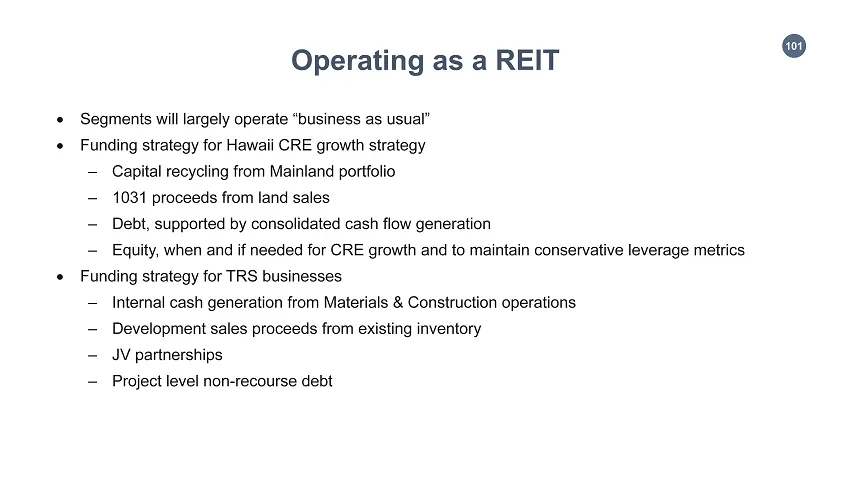
Slide 101: Operating as a REIT
101 Operating as a REIT Segments will largely operate “business as usual” Funding strategy for Hawaii CRE growth strategy – Capital recycling from Mainland portfolio – 1031 proceeds from land sales – Debt, supported by consolidated cash flow generation – Equity, when and if needed for CRE growth
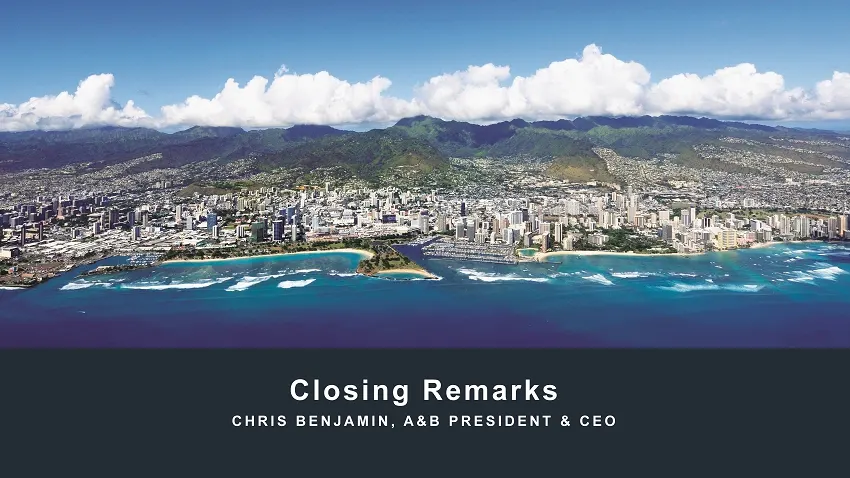
Slide 102: Closing Remarks
102 Closing Remarks CHRIS BENJAMIN, A&B PRESIDENT & CEO
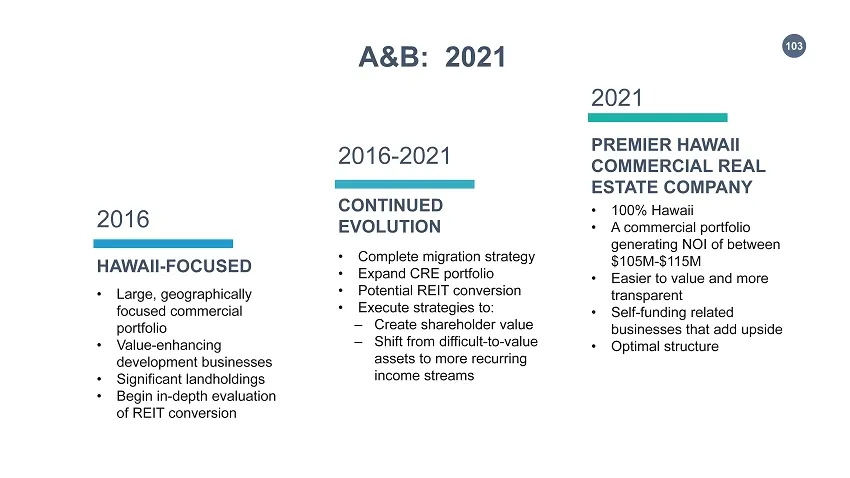
Slide 103: A&B: 2021 Hawaii-Focused
103 A&B: 2021 HAWAII - FOCUSED 2016 • Large, geographically focused commercial portfolio • Value - enhancing development businesses • Significant landholdings • Begin in - depth evaluation of REIT conversion CONTINUED EVOLUTION 2016 - 2021 • Complete migration strategy • Expand CRE portfolio • Poten
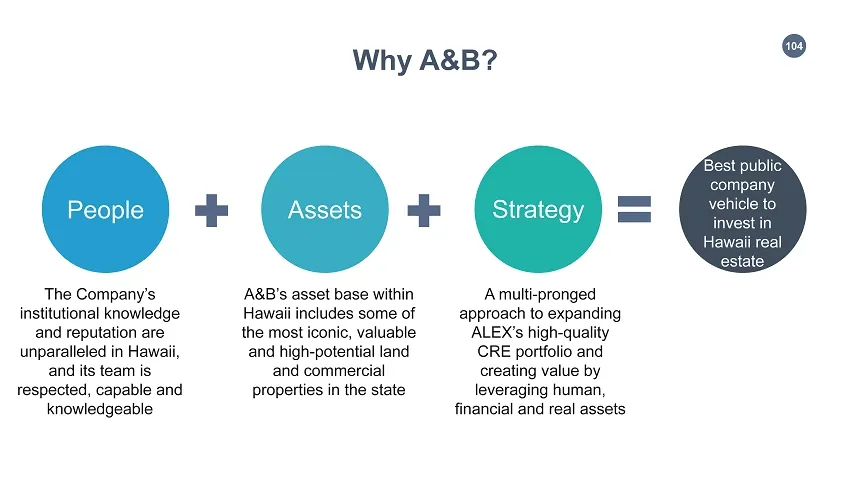
Slide 104: Why A&B?
104 Why A&B? People Assets Best public company vehicle to invest in Hawaii real estate Strategy A&B’s asset base within Hawaii includes some of the most iconic, valuable and high - potential land and commercial properties in the state A multi - pronged approach to expanding ALEX’s high - quality CRE
Slide 105: Q&A
105 Q&A
Slide 106: Appendix
106 Appendix
Slide 107: Use of Non-GAAP Financial Measures
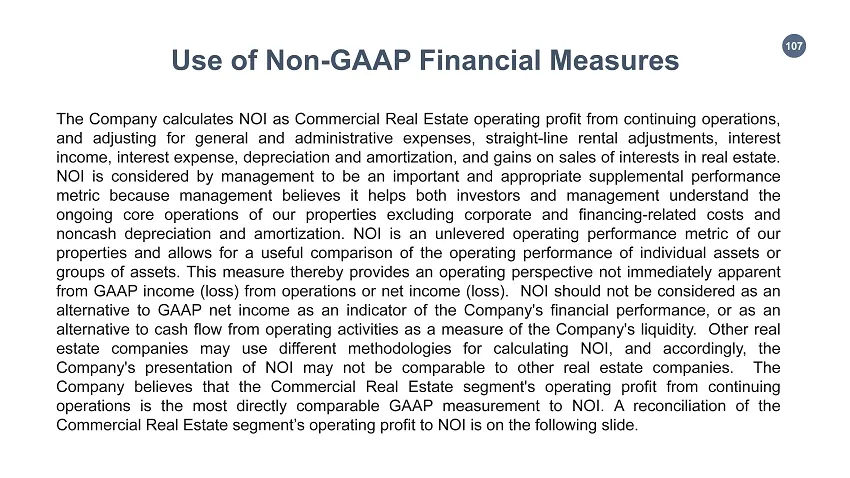
107 Use of Non - GAAP Financial Measures The Company calculates NOI as Commercial Real Estate operating profit from continuing operations, and adjusting for general and administrative expenses, straight - line rental adjustments, interest income, interest expense, depreciation and amortization, and
Slide 108: Reconciliation of GAAP to Non-GAAP Measures
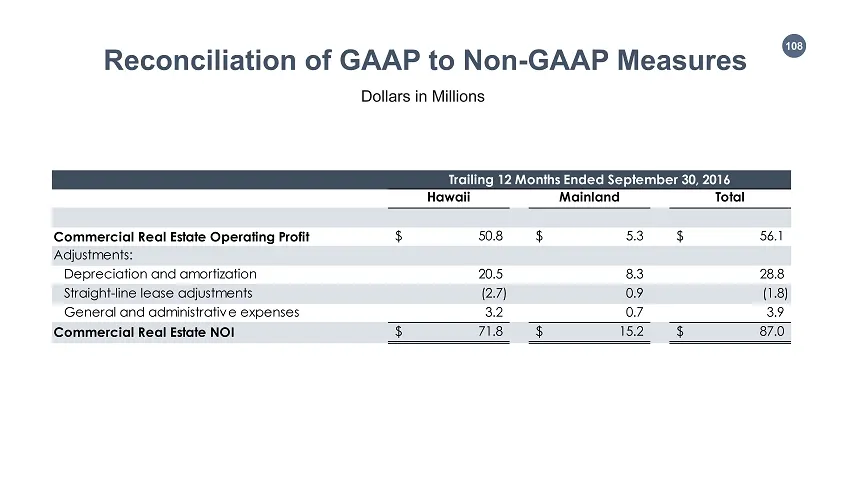
108 Reconciliation of GAAP t o Non - GAAP Measures Dollars in Millions Hawaii Mainland Total Commercial Real Estate Operating Profit 50.8$ 5.3$ 56.1$ Adjustments: Depreciation and amortization 20.5 8.3 28.8 Straight-line lease adjustments (2.7) 0.9 (1.8) General and administrative expenses 3.2 0.7 3
Slide 109: Use of Non-GAAP Financial Measures
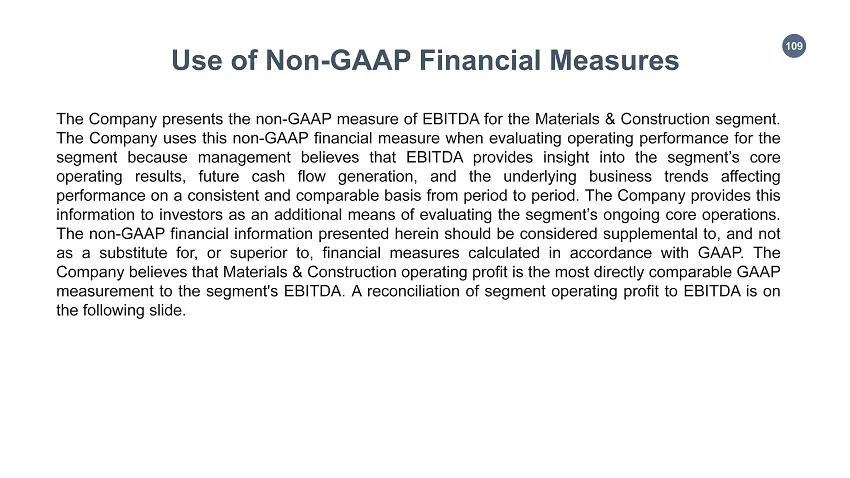
109 Use of Non - GAAP Financial Measures The Company presents the non - GAAP measure of EBITDA for the Materials & Construction segment . The Company uses this non - GAAP financial measure when evaluating operating performance for the segment because management believes that EBITDA provides insight
Slide 110: Reconciliation of GAAP to Non-GAAP Measures
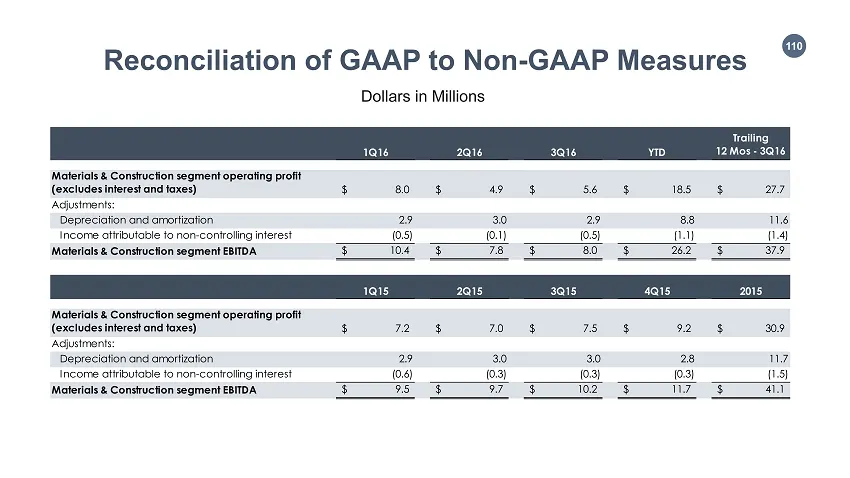
110 1Q16 2Q16 3Q16 YTD Trailing 12 Mos - 3Q16 Materials & Construction segment operating profit (excludes interest and taxes) 8.0$ 4.9$ 5.6$ 18.5$ 27.7$ Adjustments: Depreciation and amortization 2.9 3.0 2.9 8.8 11.6 Income attributable to non-controlling interest (0.5) (0.1) (0.5) (1.1) (1.4) Mater
Slide 111: Reconciliation of GAAP to Non-GAAP Measures
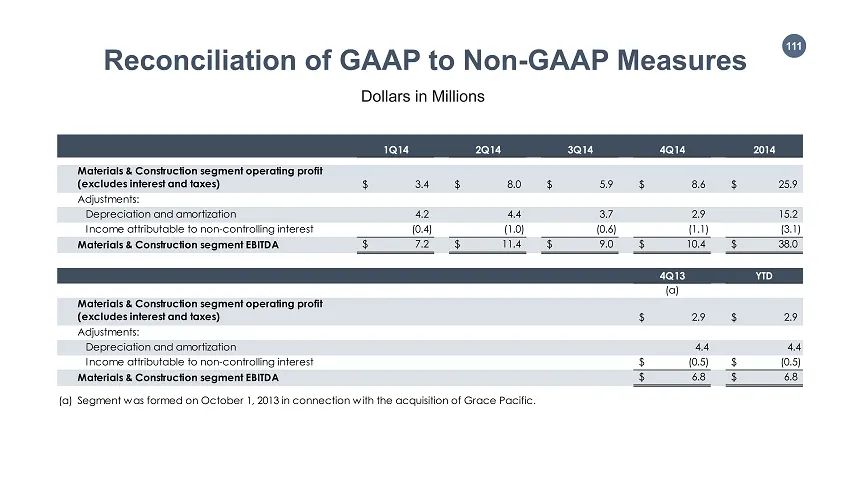
111 1Q14 2Q14 3Q14 4Q14 2014 Materials & Construction segment operating profit (excludes interest and taxes) 3.4$ 8.0$ 5.9$ 8.6$ 25.9$ Adjustments: Depreciation and amortization 4.2 4.4 3.7 2.9 15.2 Income attributable to non-controlling interest (0.4) (1.0) (0.6) (1.1) (3.1) Materials & Constructio
Slide 112: Use of Non-GAAP Financial Measures
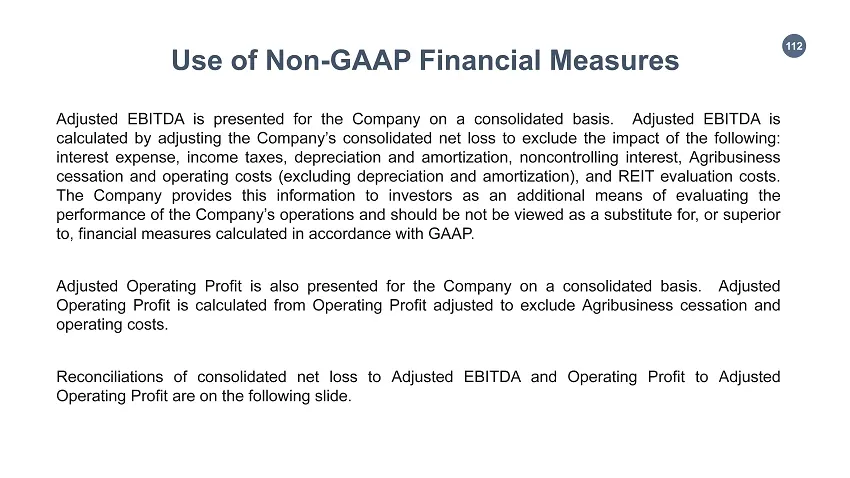
112 Use of Non - GAAP Financial Measures Adjusted EBITDA is presented for the Company on a consolidated basis . Adjusted EBITDA is calculated by adjusting the Company’s consolidated net loss to exclude the impact of the following : interest expense, income taxes, depreciation and amortization, nonco
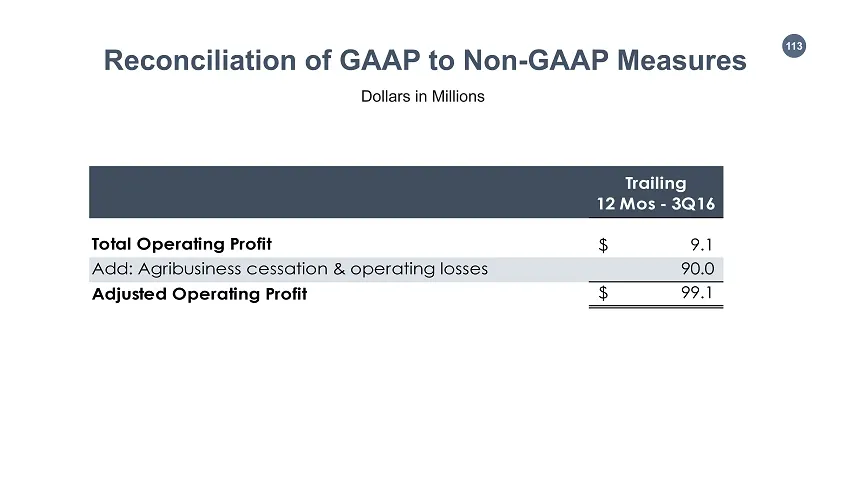
Slide 113: Reconciliation of GAAP to Non-GAAP Measures
113 Trailing 12 Mos - 3Q16 Total Operating Profit 9.1$ Add: Agribusiness cessation & operating losses 90.0 Adjusted Operating Profit 99.1$ Reconciliation of GAAP t o Non - GAAP Measures Dollars in Millions
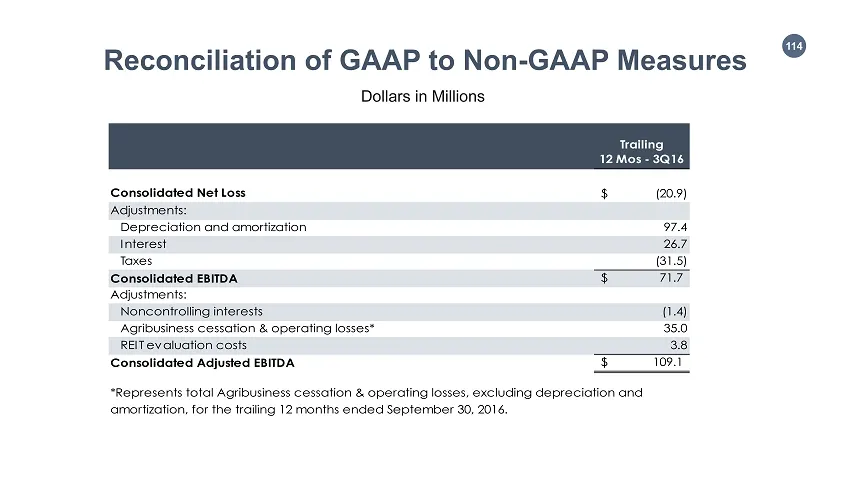
Slide 114: Reconciliation of GAAP to Non-GAAP Measures
114 Trailing 12 Mos - 3Q16 Consolidated Net Loss (20.9)$ Adjustments: Depreciation and amortization 97.4 Interest 26.7 Taxes (31.5) Consolidated EBITDA 71.7$ Adjustments: Noncontrolling interests (1.4) Agribusiness cessation & operating losses* 35.0 REIT evaluation costs 3.8 Consolidated Adjusted EB
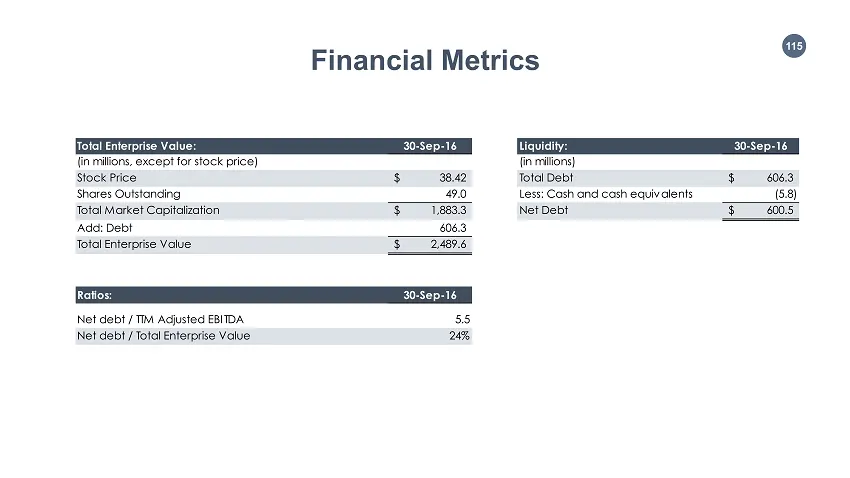
Slide 115: Total Enterprise Value and Liquidity
115 Total Enterprise Value: 30-Sep-16 Liquidity: 30-Sep-16 (in millions, except for stock price) (in millions) Stock Price 38.42$ Total Debt 606.3$ Shares Outstanding 49.0 Less: Cash and cash equivalents (5.8) Total Market Capitalization 1,883.3$ Net Debt 600.5$ Add: Debt 606.3 Total Enterprise Valu
Source: SEC EDGAR · 8-K filed Nov 2, 2016
More decks from Alexander & Baldwin Holdings Inc
 Q2 2025 Earnings Presentation21 slides · Jul 24, 2025
 Q4 2023 Earnings Presentation27 slides · Feb 28, 2024
 Investor Presentation (September 2022)33 slides · Sep 9, 2022
 Investor Presentation (January 2022)39 slides · Jan 10, 2022
 Investor Presentation (December 2021)39 slides · Dec 15, 2021
 Q4 2017 Earnings Presentation33 slides · Mar 1, 2018