International Coal — Davenport Metals & Mining Symposium 2008
35 slides from International Coal's conference presentation, Sep 16, 2008
Slide 1: Building A Strong Future
1 Building A Strong Future Davenport Metals & Mining Symposium Bennett K. Hatfield President and CEO September 16, 2008 Exhibit 99.1

Slide 2: Forward-looking statements
2 • Statements that are not historical fact are forward-looking statements and may involve a number of risks and uncertainties. We have used the words “anticipate” “believe,” “could,” “estimate,” “expect,” “intend,” “may,” “plan,” “predict,” “project” and similar terms and phrases, including referen

Slide 3: Coal Market Update
3 Coal Market Update
Slide 4: Market Overview
4 Market Overview • Strong world demand has reshaped US coal outlook: Remarkable growth in Asian demand coupled with broad supply shortages Traditional international coal trading patterns are changing: – Substantial infrastructure constraints among key exporters – Other countries limiting exports to
Slide 5: Recent Market Developments
5 Recent Market Developments • Appalachian thermal coal prices have recently softened to mid-May levels (at around $100-$120/ton) for 2009 rail tons • Trading volatility seems to stem from several factors: Global economic concerns Declining oil and natural gas prices Summer trading lull in Europe Th
Slide 6: US Export / Import Trends
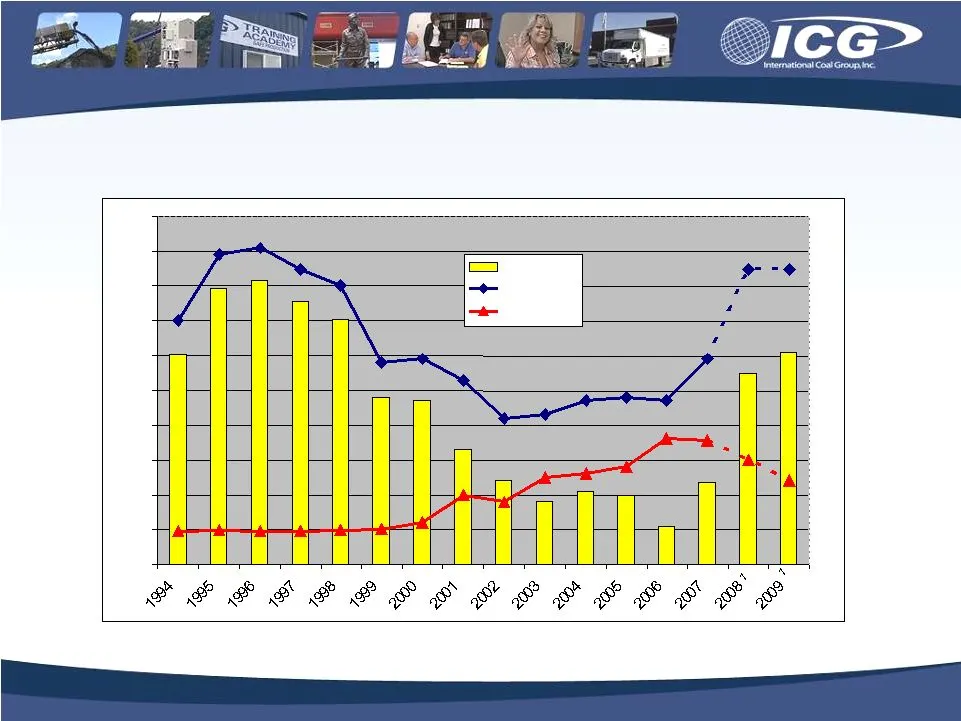
6 US Export / Import Trends (tons in 000’s) Represents management’s estimate as of Aug. 31, 2008 0.0 10.0 20.0 30.0 40.0 50.0 60.0 70.0 80.0 90.0 100.0 Net Exports US Exports US Imports
Slide 7: Prompt Month Spot Price Trends
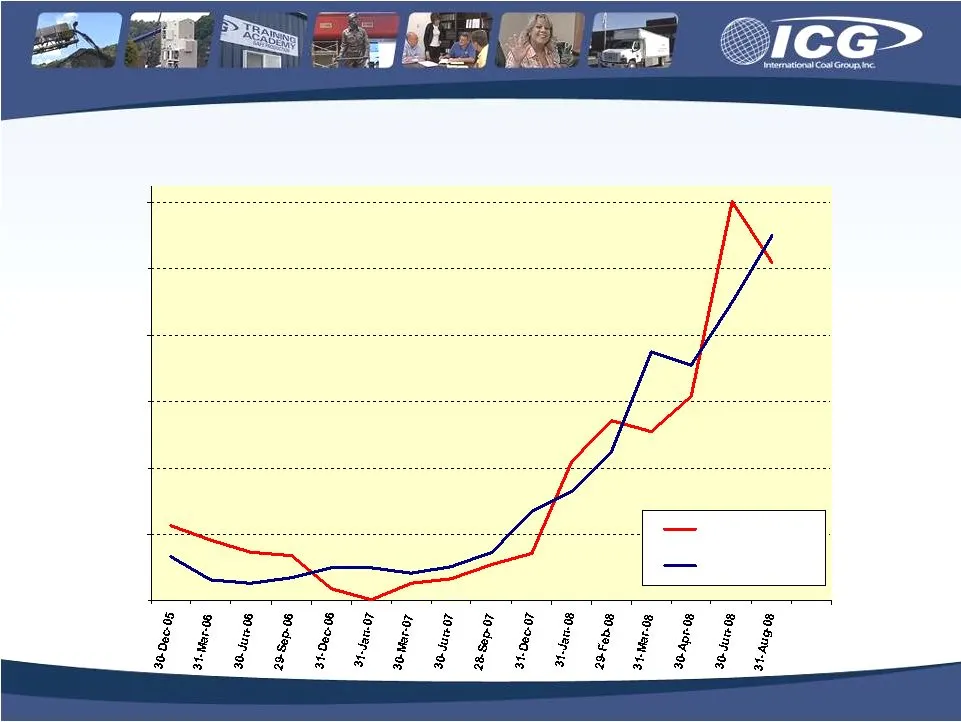
7 $35.00 $55.00 $75.00 $95.00 $115.00 $135.00 $155.00 CSX 12500 1.6# Pitt 8 13000 3.4# Prompt Month Spot Price Trends
Slide 8: Term Price Indications
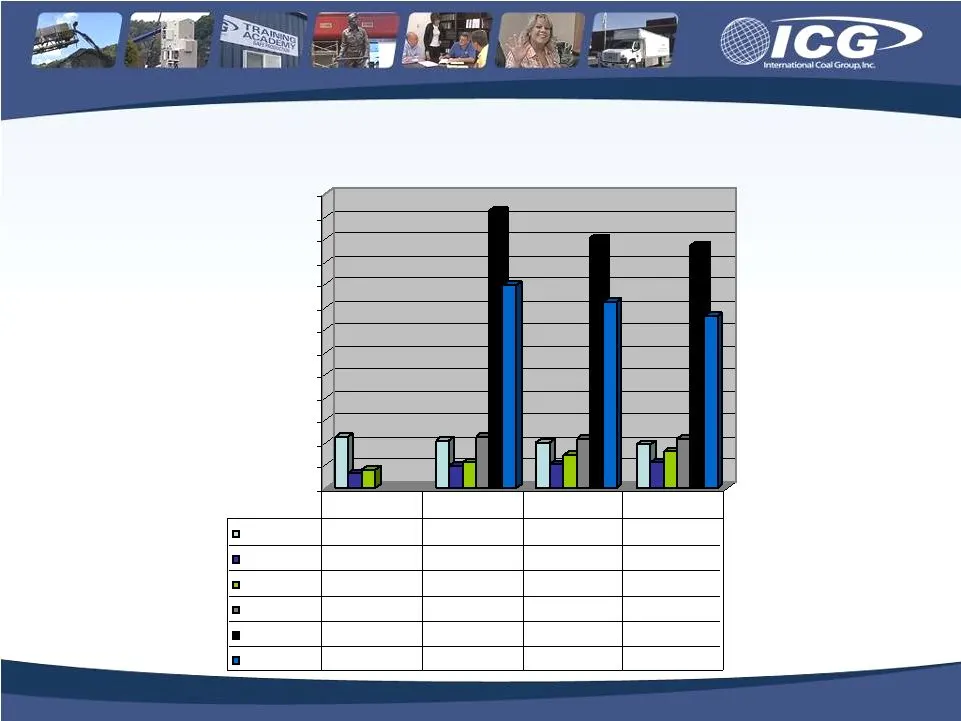
8 $35.00 $45.00 $55.00 $65.00 $75.00 $85.00 $95.00 $105.00 $115.00 $125.00 $135.00 $145.00 $155.00 $165.00 31-Jan-06 $57.50 $55.50 $54.75 $54.00 31-Dec-06 $41.25 $44.50 $45.50 $46.50 31-Jul-07 $43.25 $46.50 $49.35 $51.10 31-Dec-07 $57.50 $56.40 $56.40 30-Jun-08 $157.50 $146.00 $142.50 31-Aug-08 $125
Slide 9: Market Outlook
9 • Price volatility is expected to diminish over the balance of 2008 International and domestic buying activity is on the rise Major international coal exporters are expected to focus heavily on protecting their own resource needs – Anticipate restricted exports from China, Indonesia, and Vietnam –

Slide 10: Overview of International Coal Group
10 Overview of International Coal Group
Slide 11: Summary Statistics
11 Summary Statistics • Diversified operations participating in 3 of 4 largest US coal producing regions • Extensive reserve base supports internal growth opportunities • Growth initiatives targeted for high margin metallurgical and premium grade thermal markets • 100% union free workforce • Solid a
Slide 12: Current and Future Operations
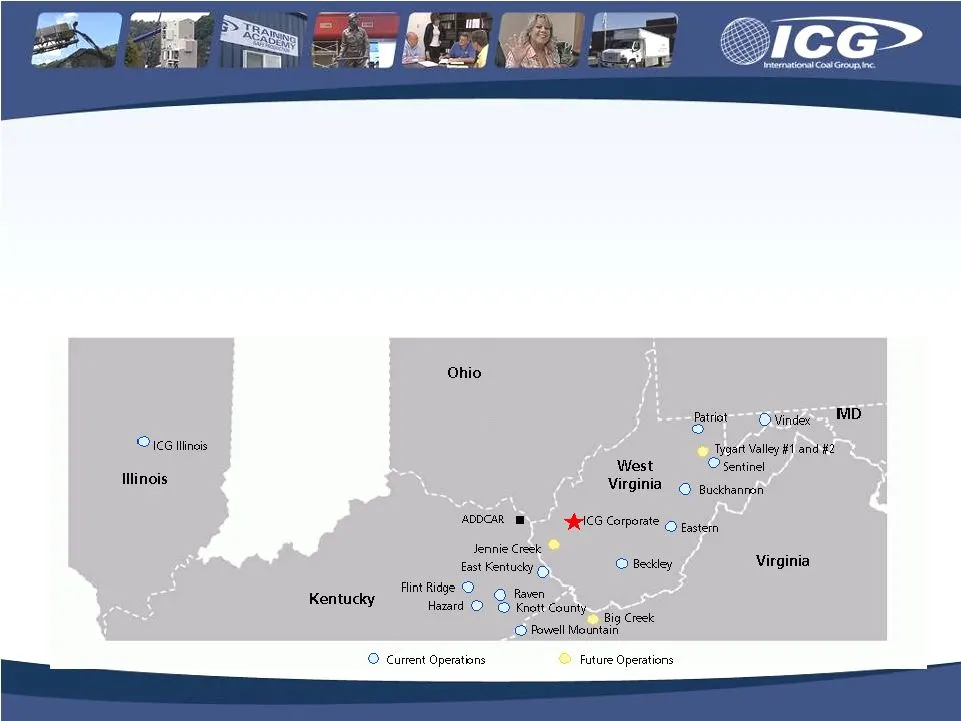
12 • 13 active mining complexes - 8 in Central Appalachia, 4 in Northern Appalachia, and 1 in Illinois Basin • 2 new mine complexes (Sentinel and Beckley) opened within last 19 months; Tygart #1 expected to open by late 2009 • Recently acquired Powell Mountain Energy began producing July 2008 Curren
Slide 13: High-Caliber Reserve Base
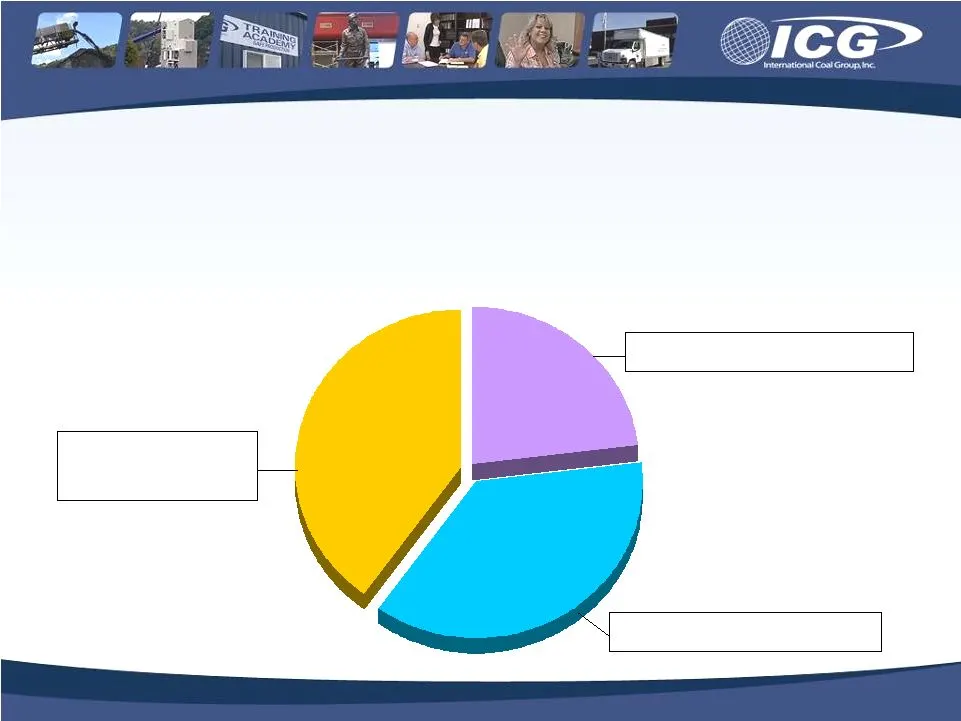
13 • ICG controls 1.0 billion tons of high-quality reserves that are primarily high BTU, low sulfur steam and metallurgical coal • CAPP/NAPP reserves of 611 million tons are 54% met quality High-Caliber Reserve Base CAPP, 247 million tons NAPP, 364 million tons Illinois Basin, 392 million tons 39% 2
Slide 14: Total Reserve Profile: Owned vs. Leased
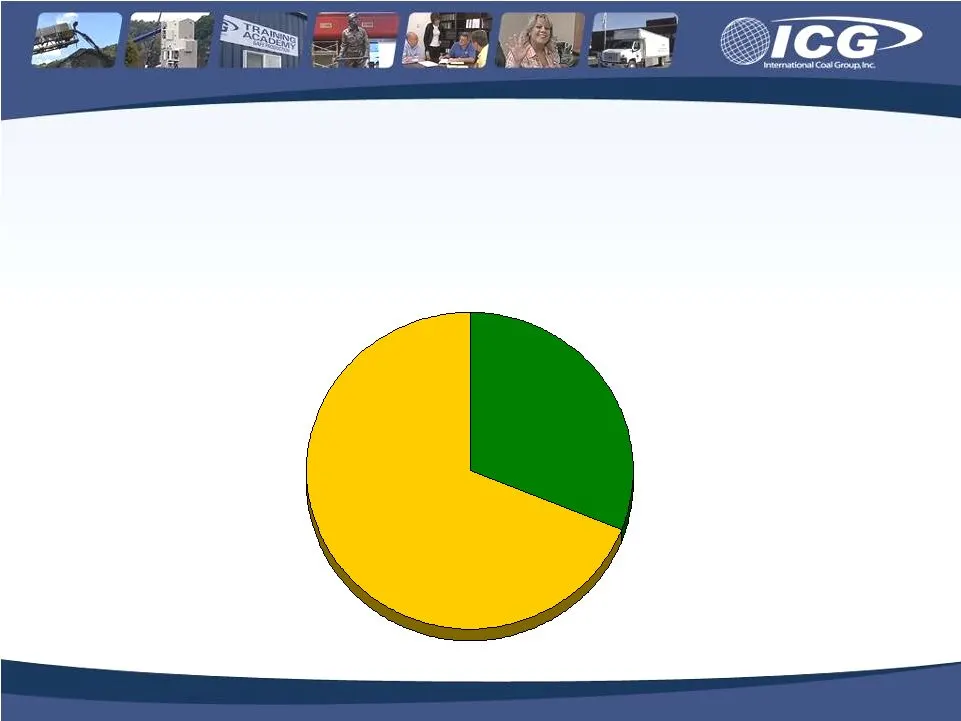
14 34% Total Reserve Profile: Owned vs. Leased ICG reserve ownership % is one of the largest among publicly traded peers 66% Leased 338 million tons Owned 665 million tons
Slide 15: Low Legacy Liabilities vs. Peer Group
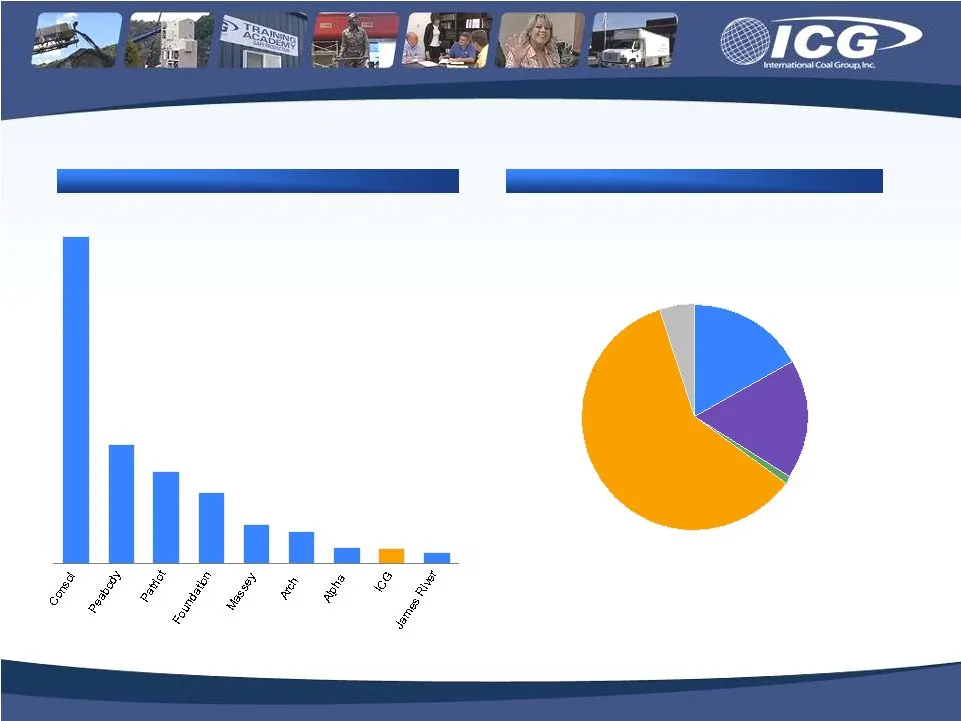
15 ICG Legacy Liabilities Total Legacy Liabilities Total: $144 million Source: company Annual Reports as of 12/31/07. Legacy liabilities include post retirement benefits, black lung liabilities, reclamation liabilities, workers compensation and Coal Act liabilities ($ in millions) Low Legacy Liabili
Slide 16: Production Plans Call For Selective Growth
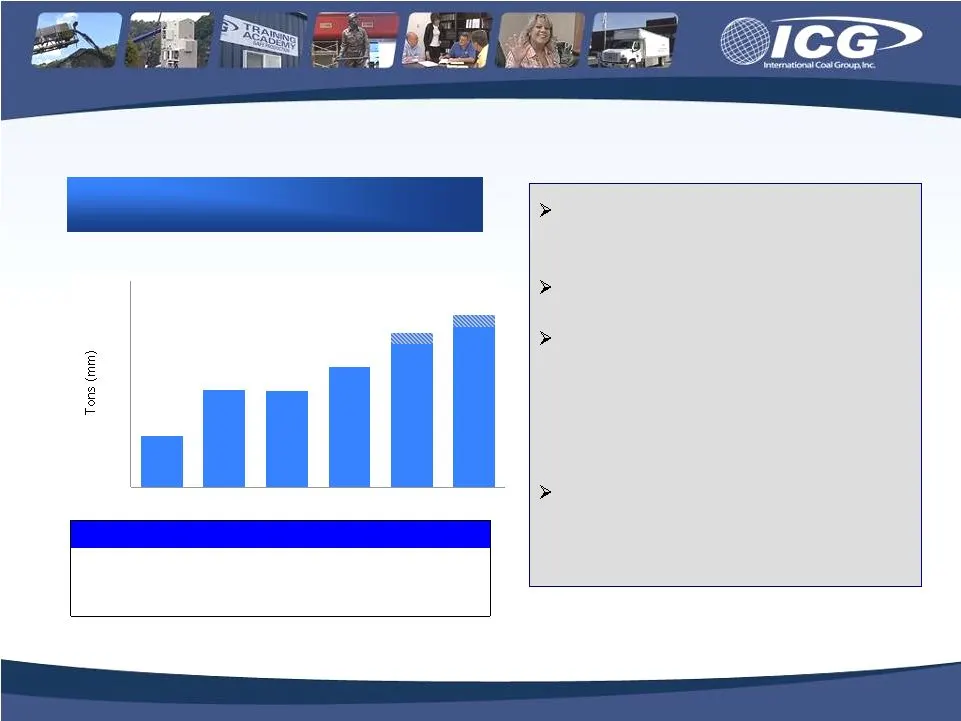
16 Projected Production 2008-2010 1 Production by Region Per management guidance as of 7/23/08 16.4 16.5 12.4 2005 2006 2007 2008 2009 2010 Target projects that create high margin production Key focus: increase met tons Sentinel, Beckley, and Powell Mountain complexes, all brought online within past
Slide 17: 2008 ICG Production Profile
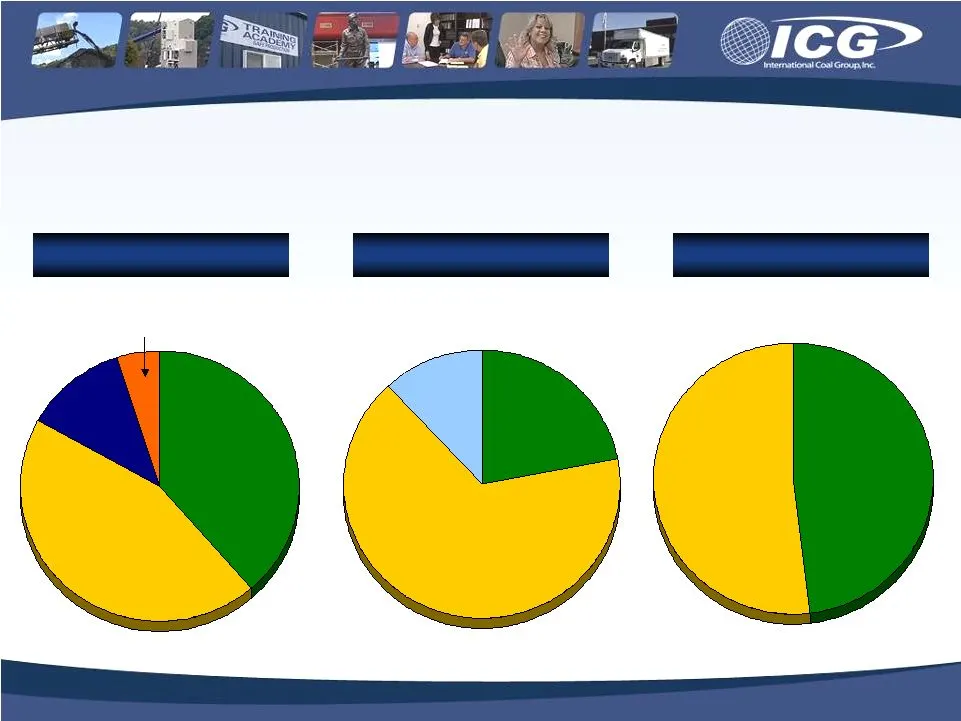
17 22% NAPP Production by State Production by Region Production by Method 48% Under- ground 38% WV 12% IL 2008 ICG Production Profile 66% CAPP 12% ILB 52% Surface 46% KY 4% MD Represents management’s estimate as of July 1, 2008
Slide 18: Favorable Sales Position
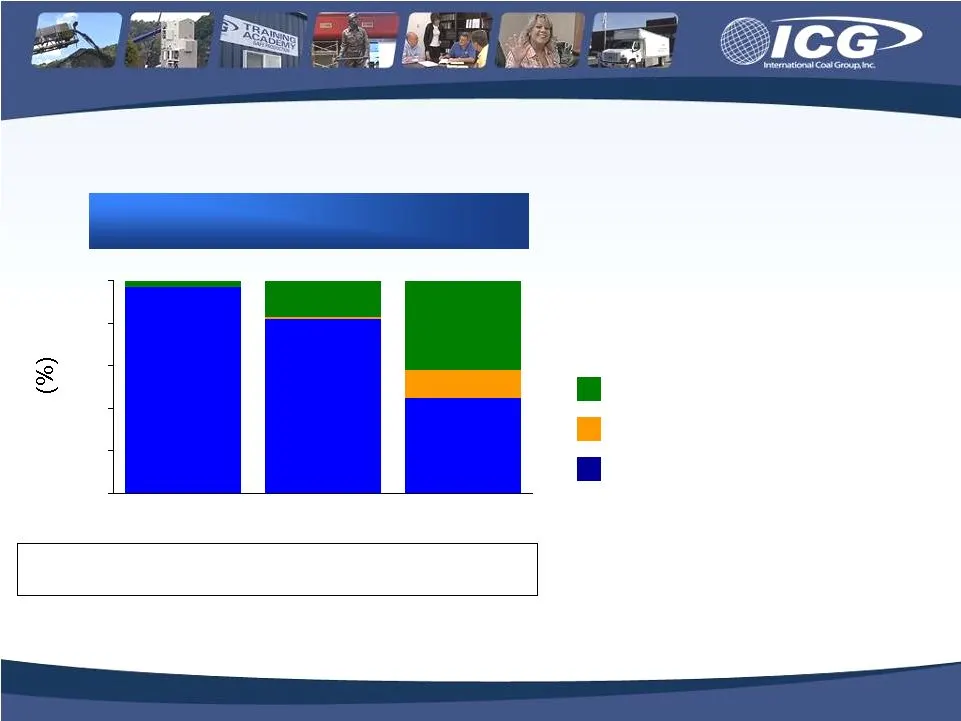
18 Committed Tonnage 97 82 45 1 13 17 42 3 1 Projected Sales 20.0 22.0 23.5 (mm tons) • Strong committed sales level for 2008-2009, yet substantial room to participate in market upside Committed tonnages and projected sales for 2008-2010 are estimated as of August 31, 2008 2008 2009 2010 Favorable S
Slide 19: Projected Metallurgical Coal Production
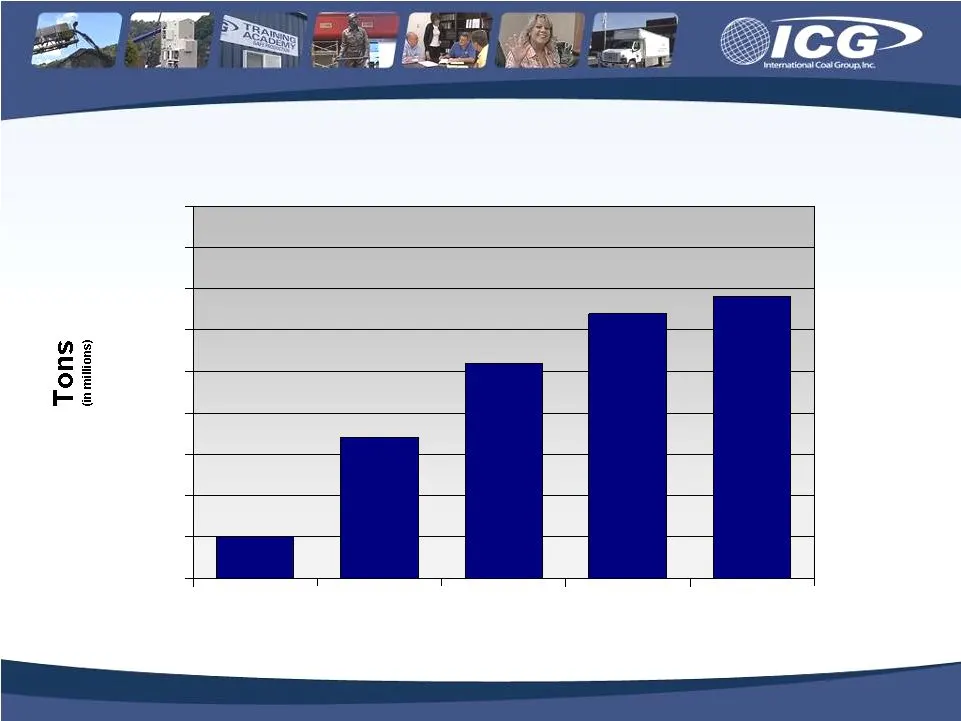
19 3.4 3.2 2.6 1.7 0.5 0.0 0.5 1.0 1.5 2.0 2.5 3.0 3.5 4.0 4.5 2007 2008 2009 2010 2011 Projected Metallurgical Coal Production Represents management’s estimate as of Aug. 31, 2008
Slide 20: Projected Met Sales Growth By Location
20 Projected Met Sales Growth By Location 2008 2009 2010 2011 Beckley (Low Vol) 0.6 1.3 1.4 1.4 Vindex (Low Vol) 0.2 0.3 0.3 0.3 Sentinel (High Vol) 0.5 0.55 0.7 0.7 Buckhannon-Powell Mtn. (High Vol) 0.4 0.45 0.45 0.4 Tygart #1 (High Vol) N/A N/A 0.35 0.6 Total 1.7 2.6 3.2 3.4
Slide 21: Other Potential Met Coal Projects Under Review
21 Other Potential Met Coal Projects Under Review • Bakerstown Deep Mine production expansion at Vindex Complex near Mount Storm, West Virginia Low volatile metallurgical quality Potential production of 400-500,000 annual tons • Big Creek Property near Richlands, Virginia Mid-volatile metallurgical
Slide 22: Disciplined Sales Strategy Has Served Us Well
22 Disciplined Sales Strategy Has Served Us Well • Declined renewal of nearly 2.8 million tons per year of CAPP contract renewals (in mid-$40’s range) during late 2007 • Continued to “layer in” new forward-contract prices as the market steadily improved; new commitments since Feb. 2008 include: 2009
Slide 23: Other Anticipated Sales Improvements
23 Other Anticipated Sales Improvements • Low-priced contracts are expiring and rolling off Central Appalachian region roll-offs include 0.5 million tons after 2009 and 2.3 million tons after 2010 Northern Appalachian region roll-offs include 1.2 million tons after 2009 • Legacy contracts totaling 1
Slide 24: Guidance
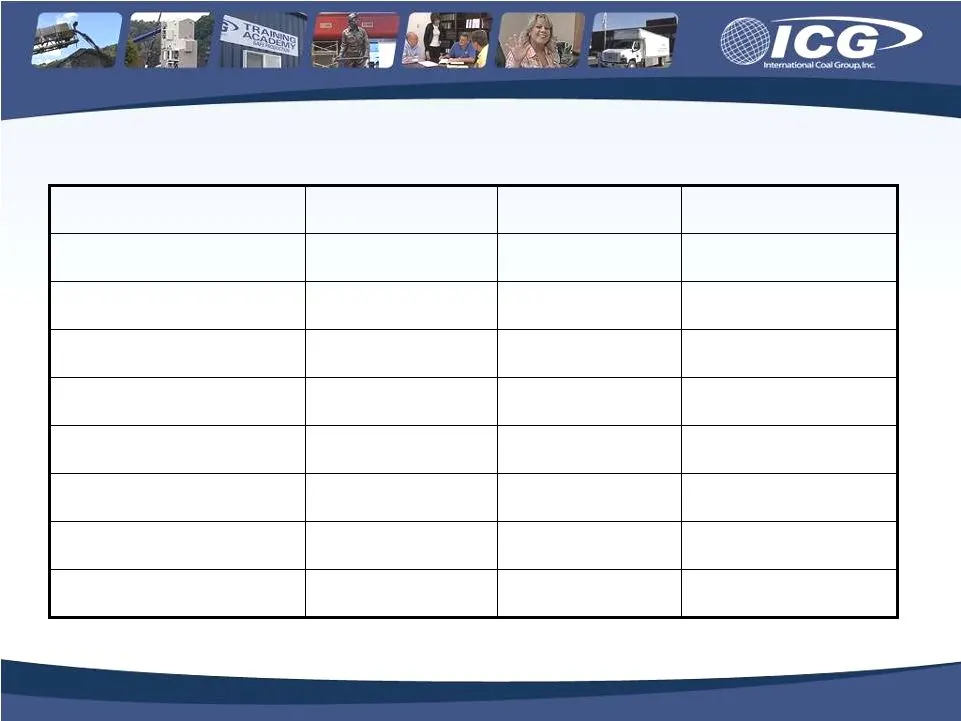
24 Guidance n/a $205 $179 CapEx n/a n/a $45.00 – $47.00 Average Cost Per Ton $35.00 – $37.00 $32.00 – $33.00 $30.50 – $31.00 ILB $95.00 – $105.00 $70.00 – $75.00 $58.00 – $59.00 NAPP $98.00 – $108.00 $80.00 – $85.00 $57.50 – $58.50 CAPP $92.00 – $102.00 $72.00 – $78.00 $54.00 – $55.00 Average Price

Slide 25: New Operations
25 New Operations
Slide 26: Sentinel Complex
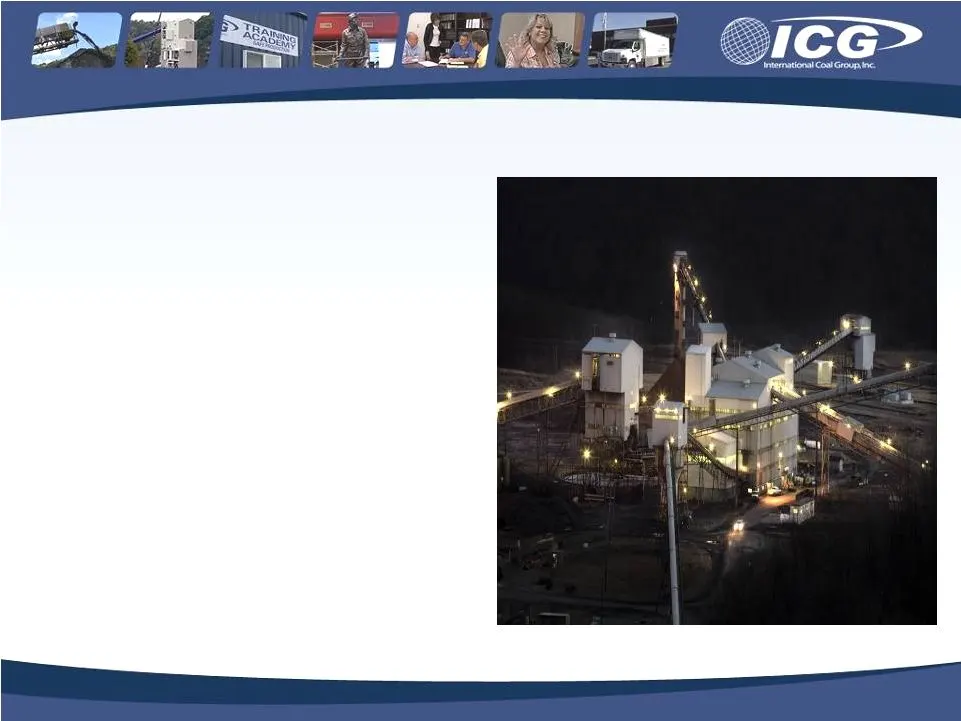
26 • Mine Type – underground shaft/slope • Customers – Mirant Energy, Xcoal, Essar Steel Algoma • Mining Method – room-and-pillar • Total Reserves – 52.7 million tons • 2007 Production – 0.7 million tons • Production Outlook – expected 1.5 million tons/year pace in late-2008 • Coal Quality – high-vo
Slide 27: Beckley Complex
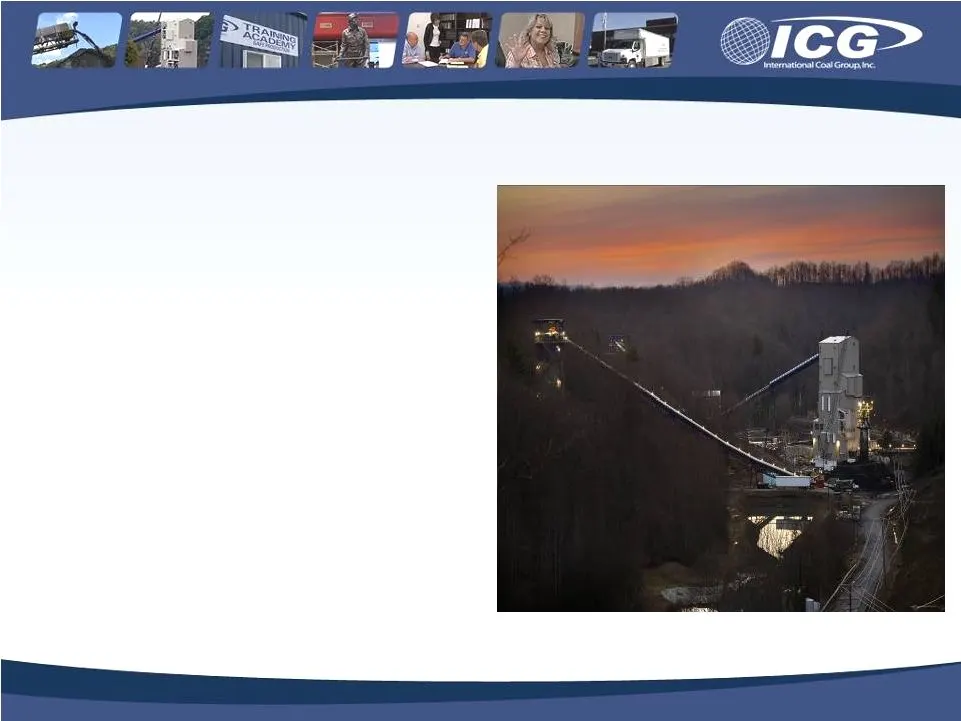
27 • Mine Type – underground shaft/slope • Customers – Sun Coke, Shenango, Xcoal, AK Steel, USS • Mining Method – room-and-pillar • Total Reserves – 32.3 million tons • 2007 Production – 0.04 million tons • Production Outlook – expected 1.4 million tons peak output • Coal Quality – premium low-vol m
Slide 28: Powell Mountain Complex
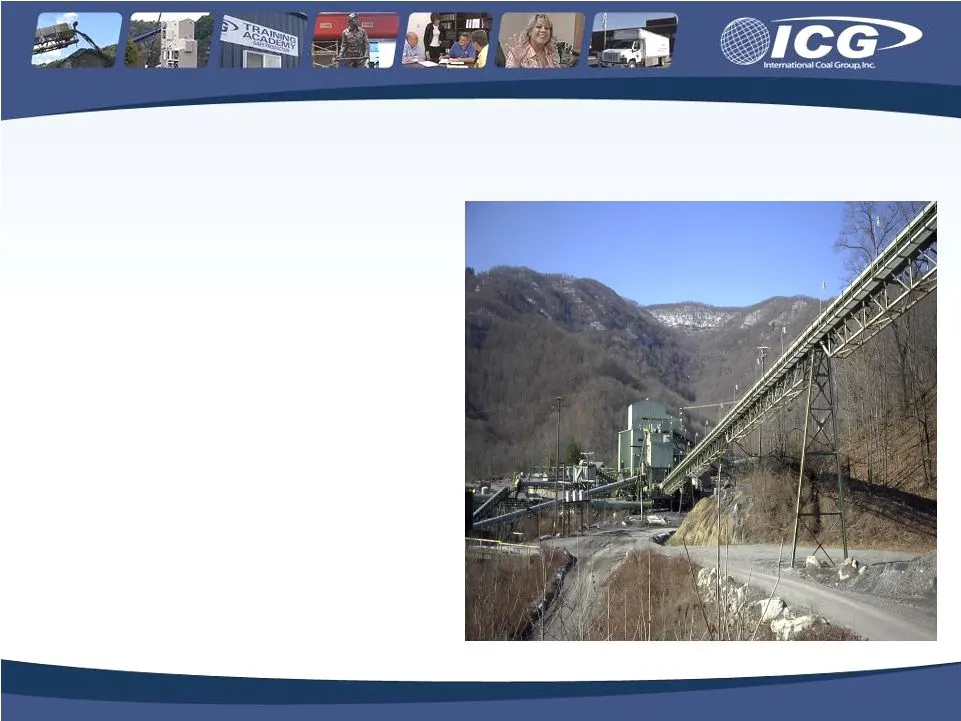
28 Powell Mountain Complex • Acquired May 27, 2008; production initiated mid-July, 2008 • Mine Type – underground • Customers – Traxys, Eastman Chemical, ABC Coke, Xcoal • Mining Method – room-and-pillar • Total Reserves – 27.0 million tons • Production – 1.0 million tons annually at full production
Slide 29: Tygart #1 Complex
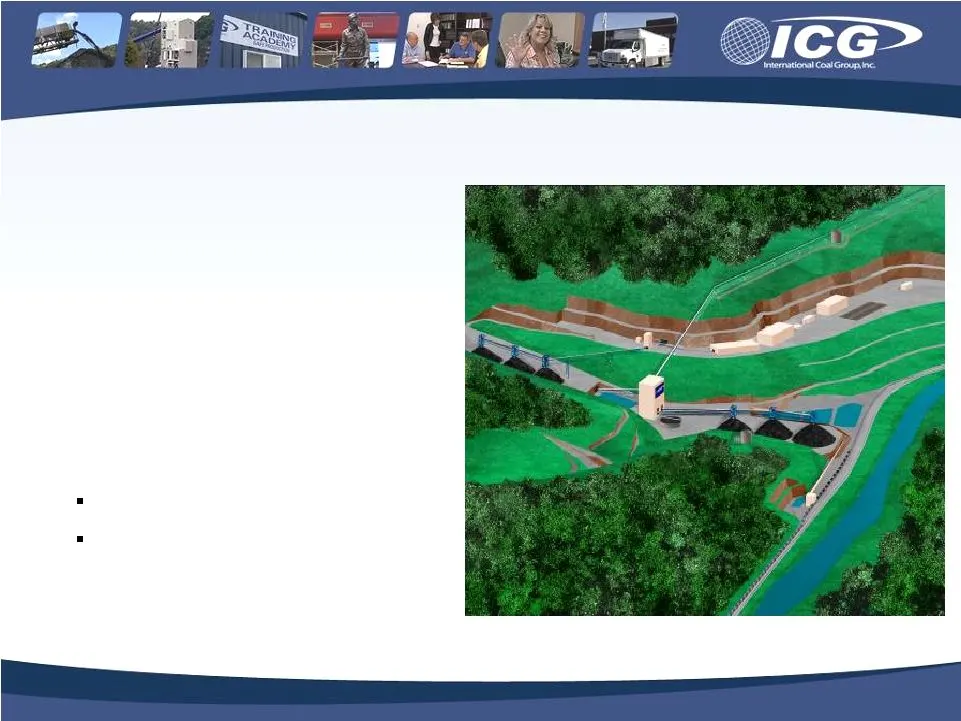
29 • Site development: 2007-2008 • Major construction of shafts and slope: 2008-2010 • Planned developmental production start-up in late 2009 • Projected output of 3.5 million tons/year at full capacity • Quality: High Rank HV Met (45%) Premium NAPP low sulfur Steam (55%) • Underground longwall mine

Slide 30: Summary
30 Summary
Slide 31: Industry Outlook
31 Industry Outlook • Coal markets: Volatility may be the rule for the near term Broad concerns about the economy Lower natural gas and oil prices • However, coal supply is expected to remain very tight due to: Scarcity of experienced labor Challenging regulatory environment, including delayed permi
Slide 32: ICG is well-positioned to benefit from new high-margin production
32 • ICG is well-positioned to benefit from new high-margin production that is expected to come online during 2008 - 2012 • We have maintained discipline in our marketing and growth strategy • Our capital spending is targeted on developing higher margin reserves, favoring met quality and owned prope

Slide 33: Thank You!
33 Thank You!

Slide 34: Appendix
34 Appendix
Slide 35: Summary of Active Mining Operations
35 Summary of Active Mining Operations 6/30/2008 Mine Mining Total Reserves Annual Capacity 2007 Production Coal Transportation Mine Site Type Method (tons in millions) (tons in millions) (tons in millions) Quality Method CAPP Kentucky East Kentucky S MTR, TSL 4.3 1.3 1.0 Utility Rail Flint Ridge UG
Source: SEC EDGAR · 8-K filed Sep 16, 2008
More decks from International Coal Group Inc
 Howard Weil Energy Conference 201035 slides · Mar 22, 2010
 Simmons & Company Energy Conference and UBS Energy/Utility Conference 201031 slides · Mar 2, 2010
 UBS Boston Coal Conference 200937 slides · Dec 1, 2009
 Raymond James Coal Investors Conference 200831 slides · Dec 4, 2008
 Howard Weil 36th Annual Energy Conference (April 2008)24 slides · Apr 7, 2008
 Bear Stearns Commodities & Capital Goods Conference (November 2007)29 slides · Nov 29, 2007