Billerud AB · OMXSTO:BILL
Billerud AB — Q4 2004 Earnings Presentation
26 slides from Billerud AB's earnings presentation, Jan 27, 2005
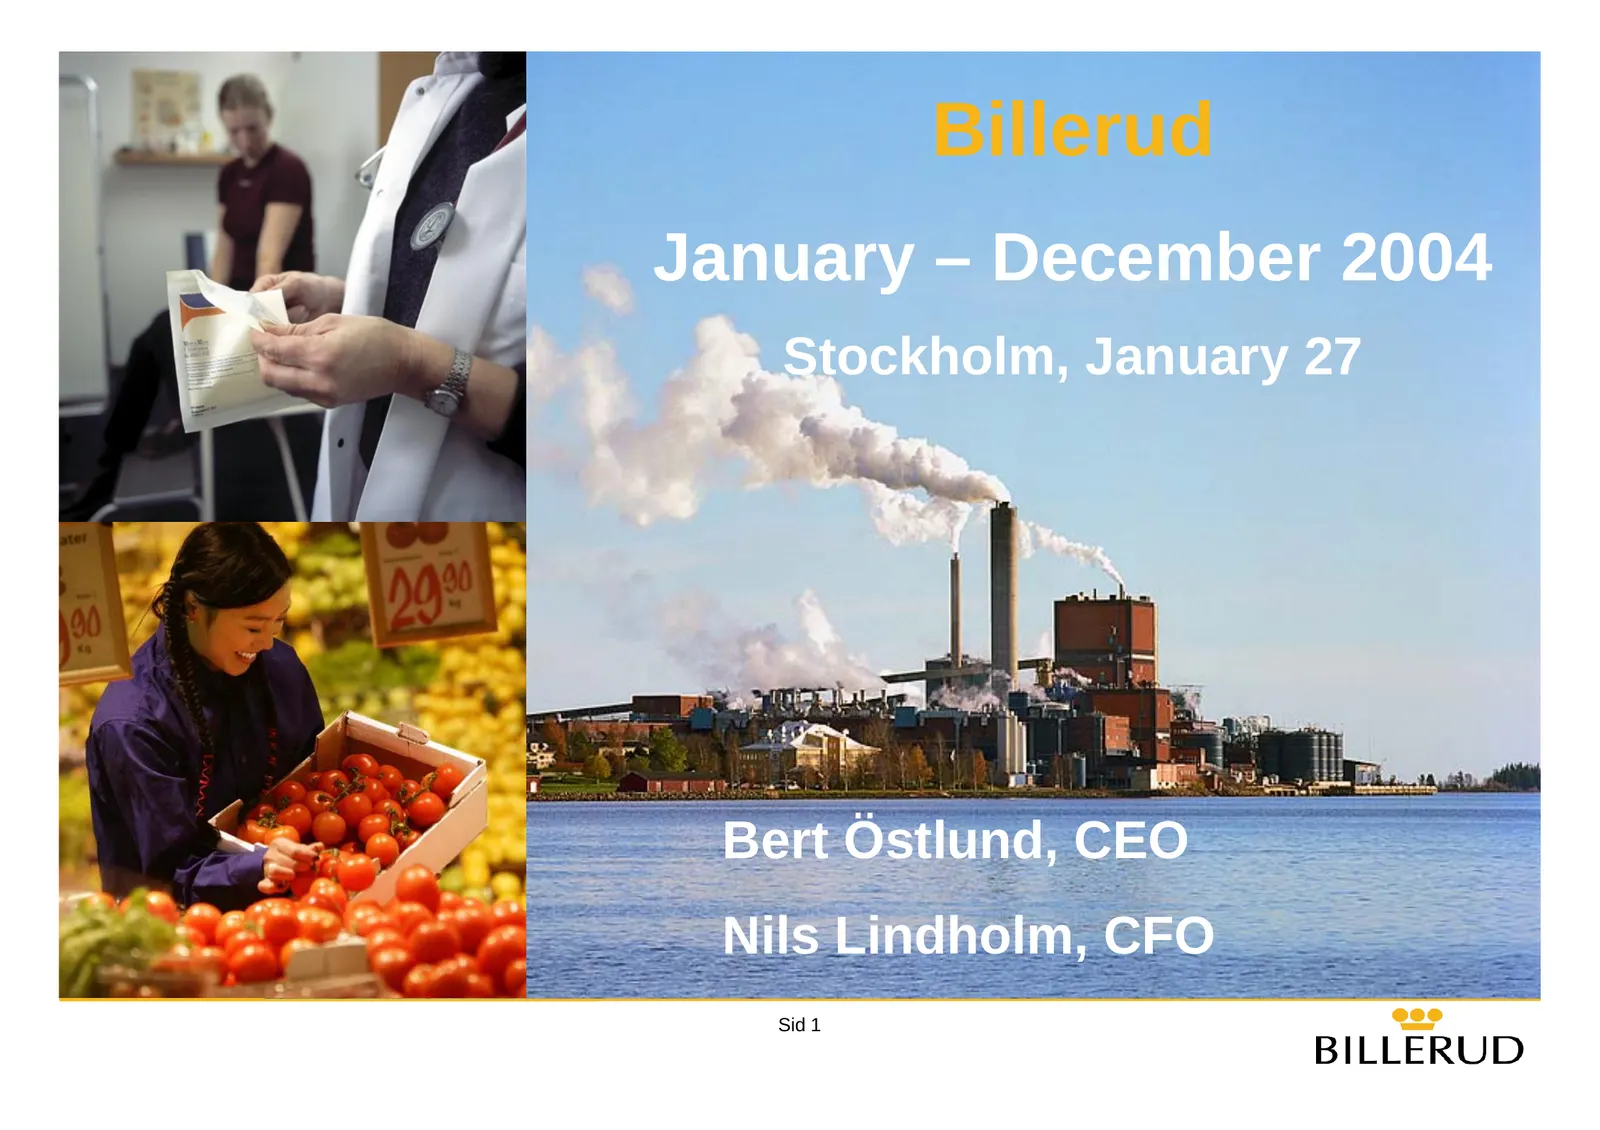
Slide 1: Billerud January – December 2004
Billerud January – December 2004 Stockholm, January 27 Bert Östlund, CEO Nils Lindholm, CFO Sid 1
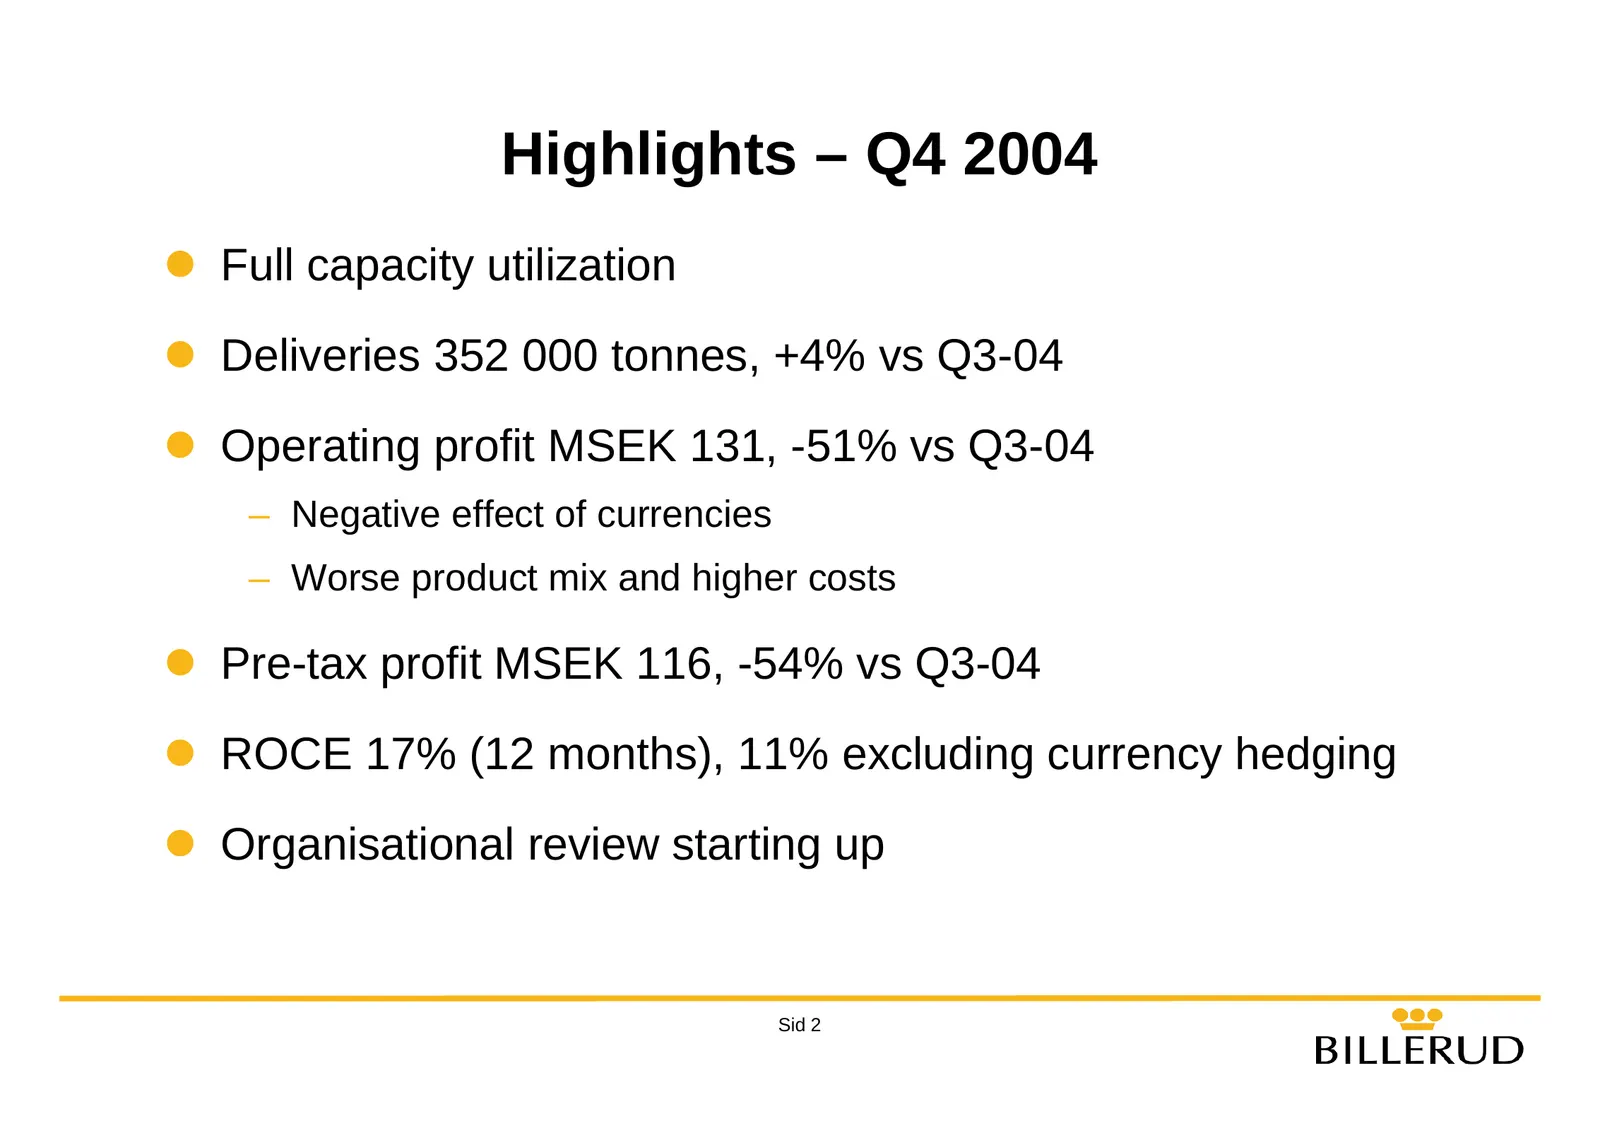
Slide 2: Highlights – Q4 2004
Highlights – Q4 2004 z Full capacity utilization z Deliveries 352 000 tonnes, +4% vs Q3-04 z Operating profit MSEK 131, -51% vs Q3-04 – Negative effect of currencies – Worse product mix and higher costs z Pre-tax profit MSEK 116, -54% vs Q3-04 z ROCE 17% (12 months), 11% excluding currency hedging z
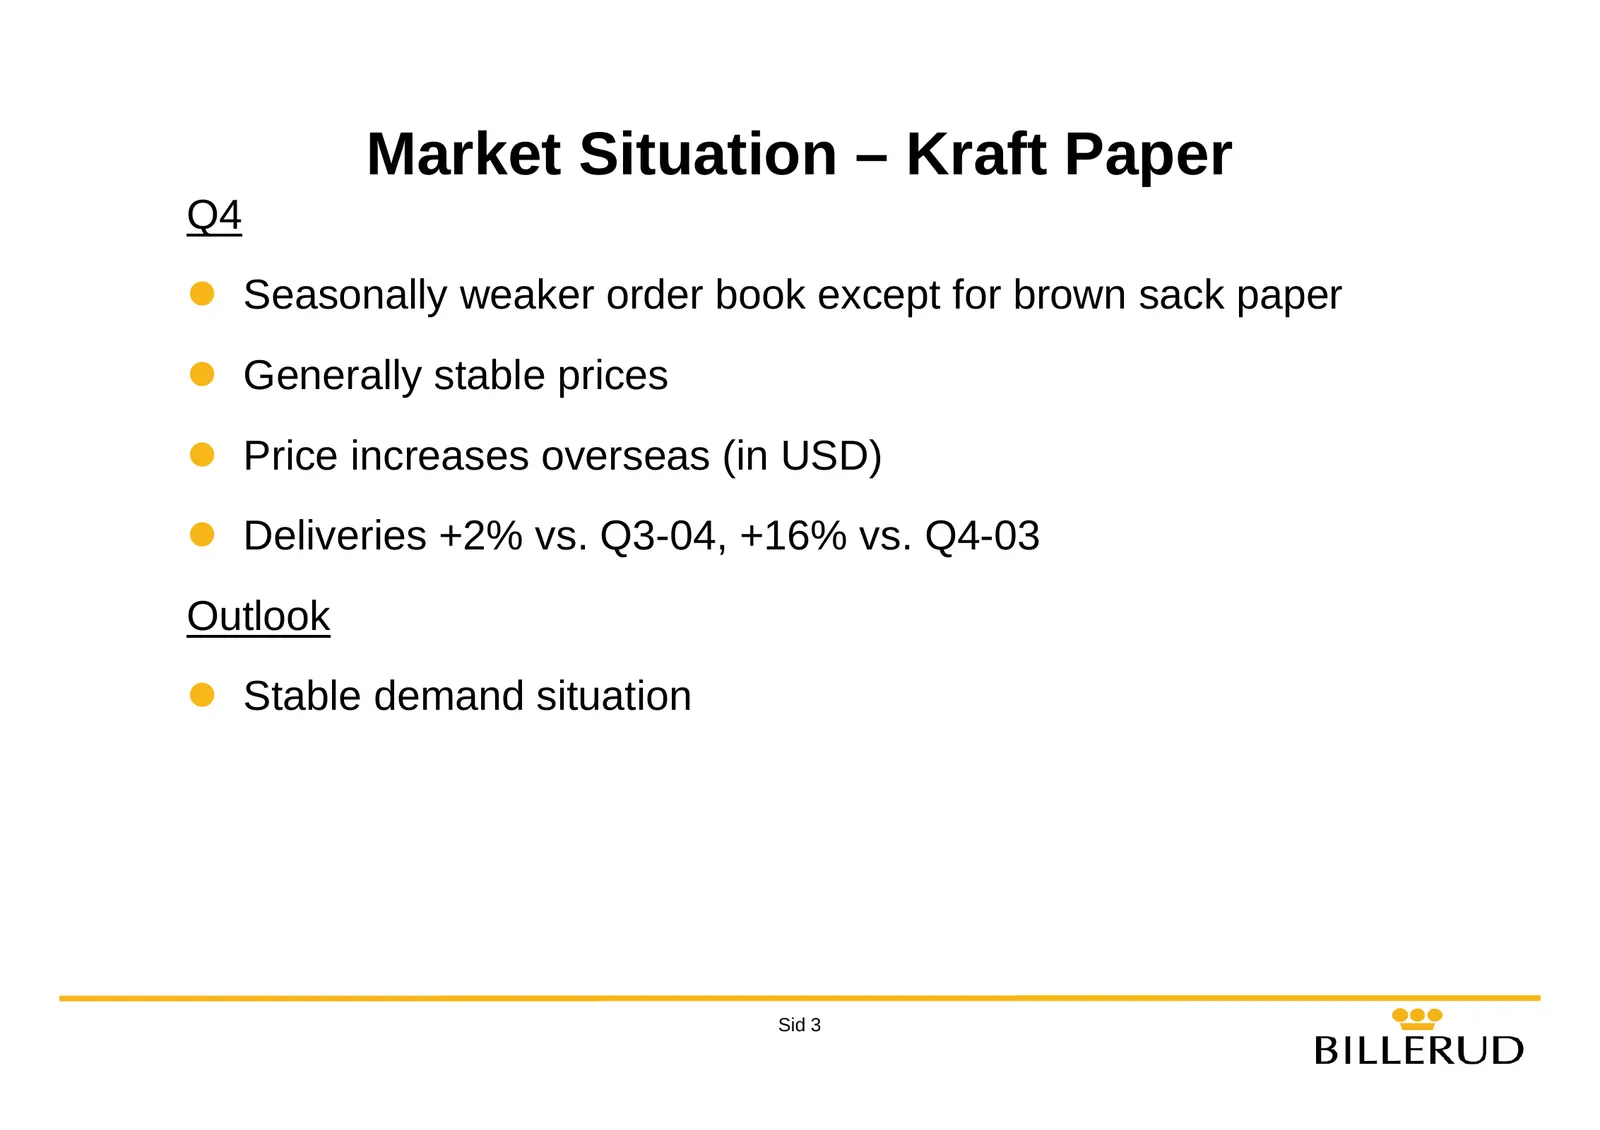
Slide 3: Market Situation – Kraft Paper
Market Situation – Kraft Paper Q4 z Seasonally weaker order book except for brown sack paper z Generally stable prices z Price increases overseas (in USD) z Deliveries +2% vs. Q3-04, +16% vs. Q4-03 Outlook z Stable demand situation Sid 3
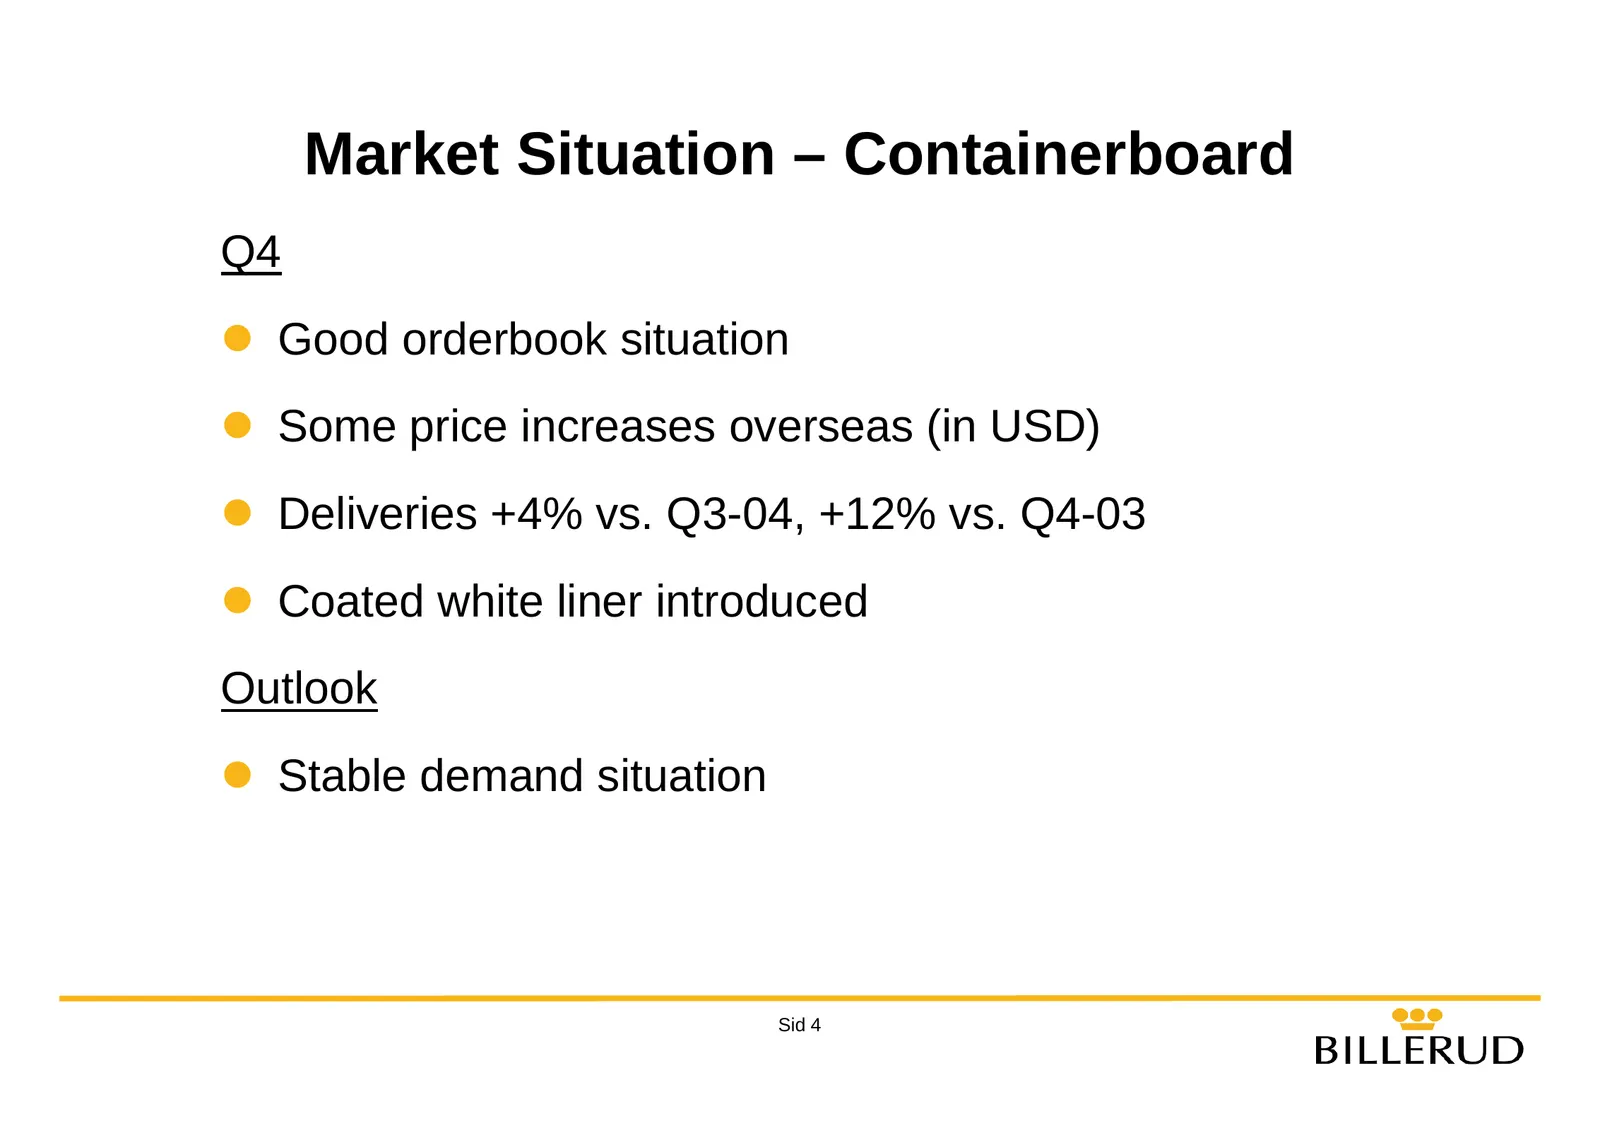
Slide 4: Market Situation – Containerboard
Market Situation – Containerboard Q4 z Good orderbook situation z Some price increases overseas (in USD) z Deliveries +4% vs. Q3-04, +12% vs. Q4-03 z Coated white liner introduced Outlook z Stable demand situation Sid 4
Slide 5: Market Situation – Market Pulp
Market Situation – Market Pulp Q4 z Market price for NBSK increased during the quarter from USD 590/tonne to USD 620/tonne z Billeruds average price (SEK) -14% compared to Q3-04 z External deliveries +7% vs. Q3-04, -9% vs. Q4-03 Outlook z Price increase to USD 660/tonne from Feb. Further price incre
Slide 6: Wood fibre situation in Sweden
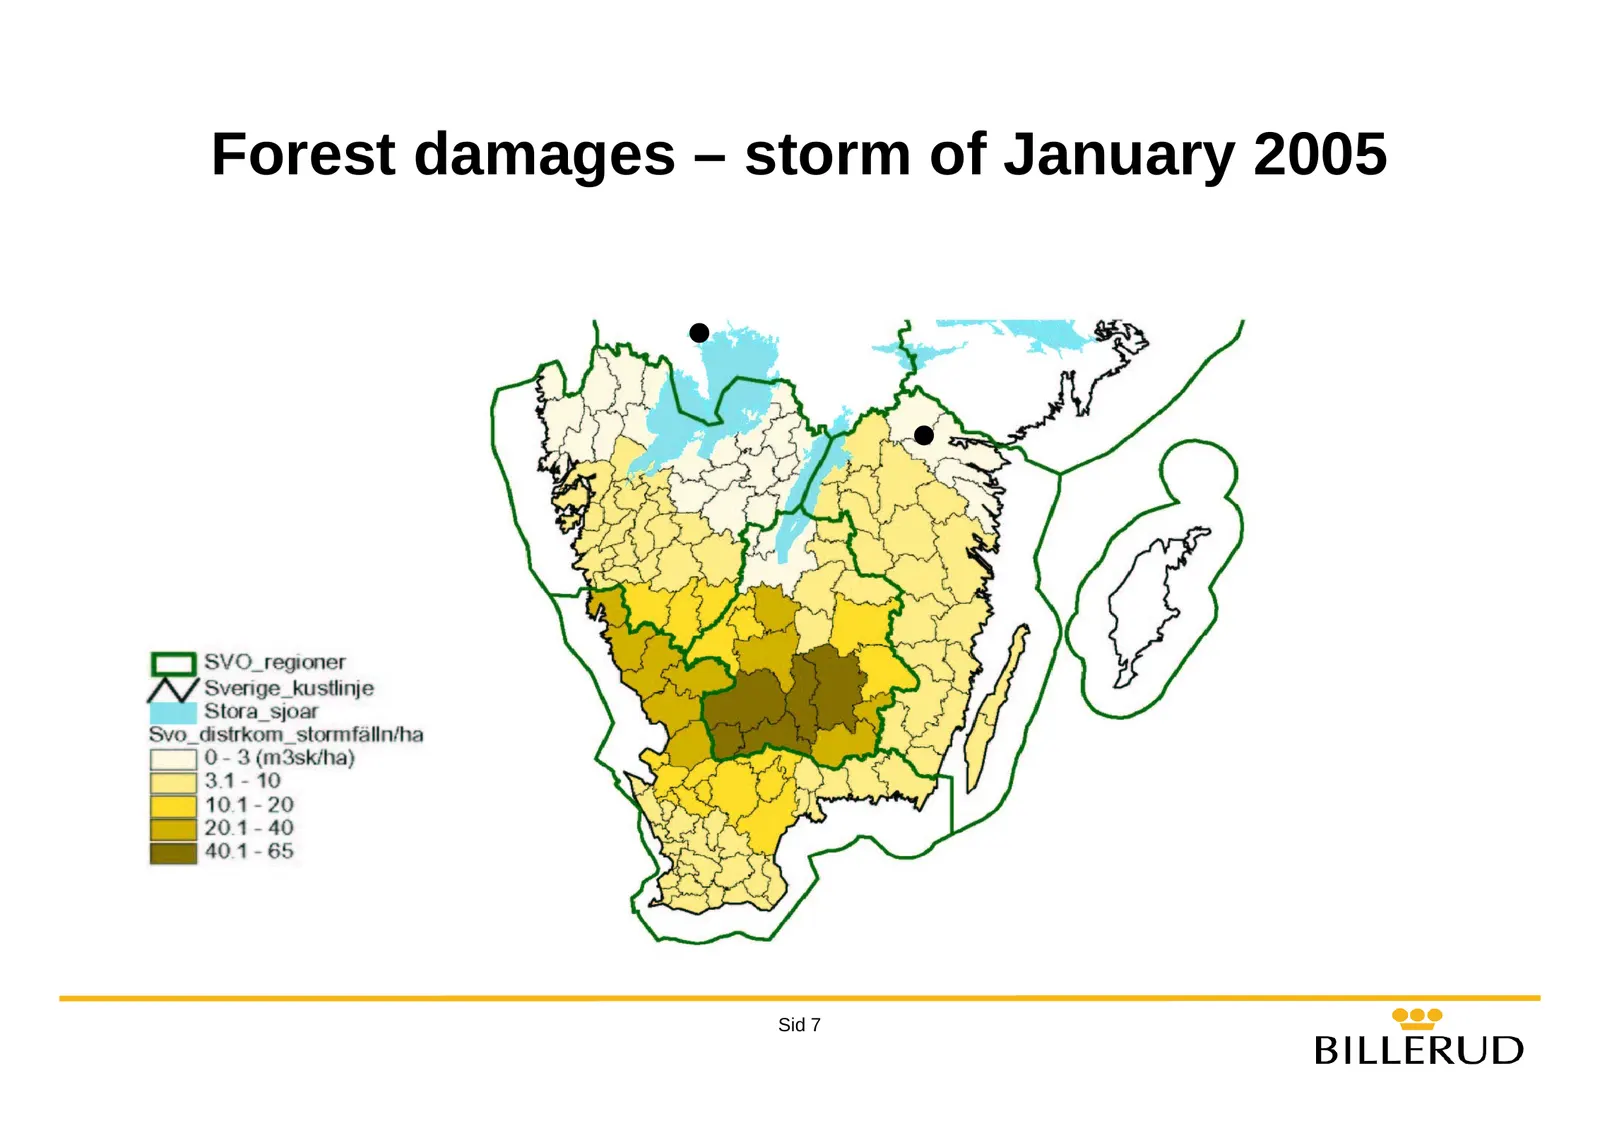
Wood fibre situation in Sweden z Wood fibre approx 30 percent of total cost for Billerud z Storm damages January 2005 estimated to 80 million m3; about one year’s normal cutting z Changes in wood fibre flows; in three phases – Reduced and distorted wood flows short term (winter -05) – Surplus of woo
Slide 7: Forest damages – storm of January 2005
Forest damages – storm of January 2005 z z Sid 7
Slide 8: Organizational Review - targets
Organizational Review - targets z Establish one Billerud with common world class way of working and ability to be an industry leader z Secure resources and competencies to achieve lasting higher profitability than industry peers z Achieve highest possible efficiency in all processes and procedures w
Slide 9: Financials
Financials BILLERUD Sid 9
Slide 10: Key Figures 2004
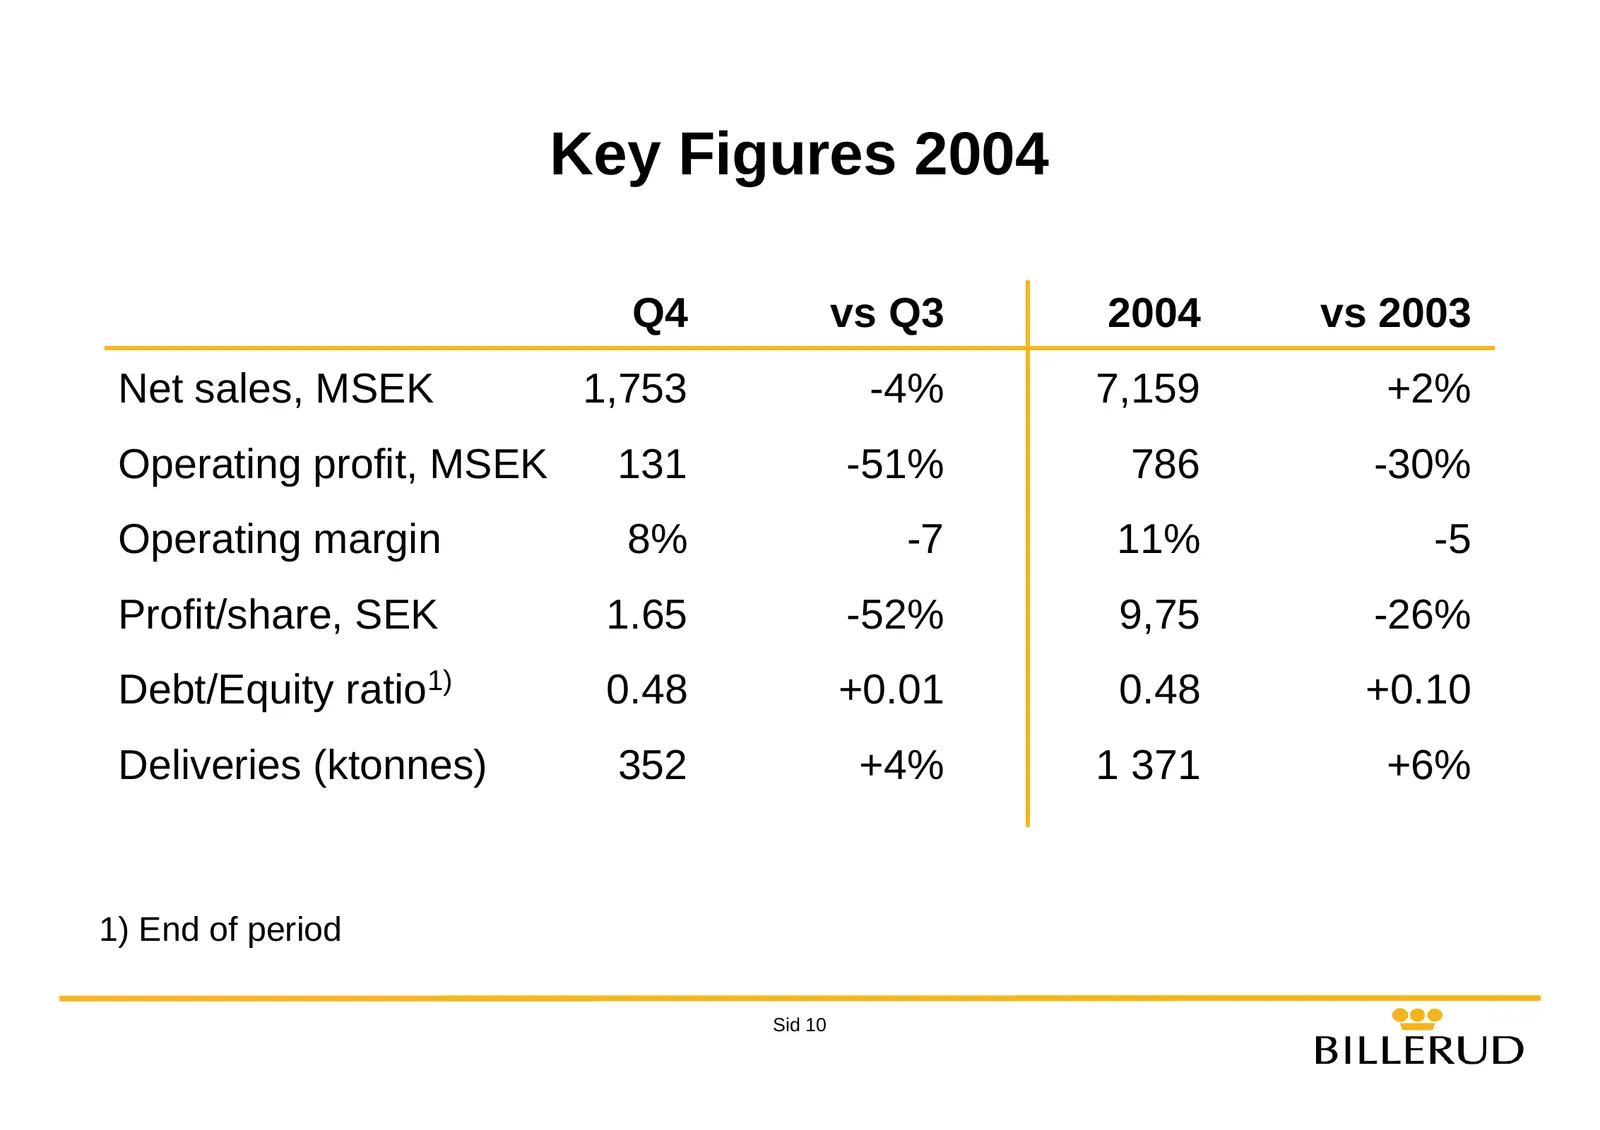
Key Figures 2004 Q4 vs Q3 2004 vs 2003 Net sales, MSEK 1,753 -4% 7,159 +2% Operating profit, MSEK 131 -51% 786 -30% Operating margin 8% -7 11% -5 Profit/share, SEK 1.65 -52% 9,75 -26% Debt/Equity ratio1) 0.48 +0.01 0.48 +0.10 Deliveries (ktonnes) 352 +4% 1 371 +6% 1) End of period Sid 10
Slide 11: Operating Margin Development
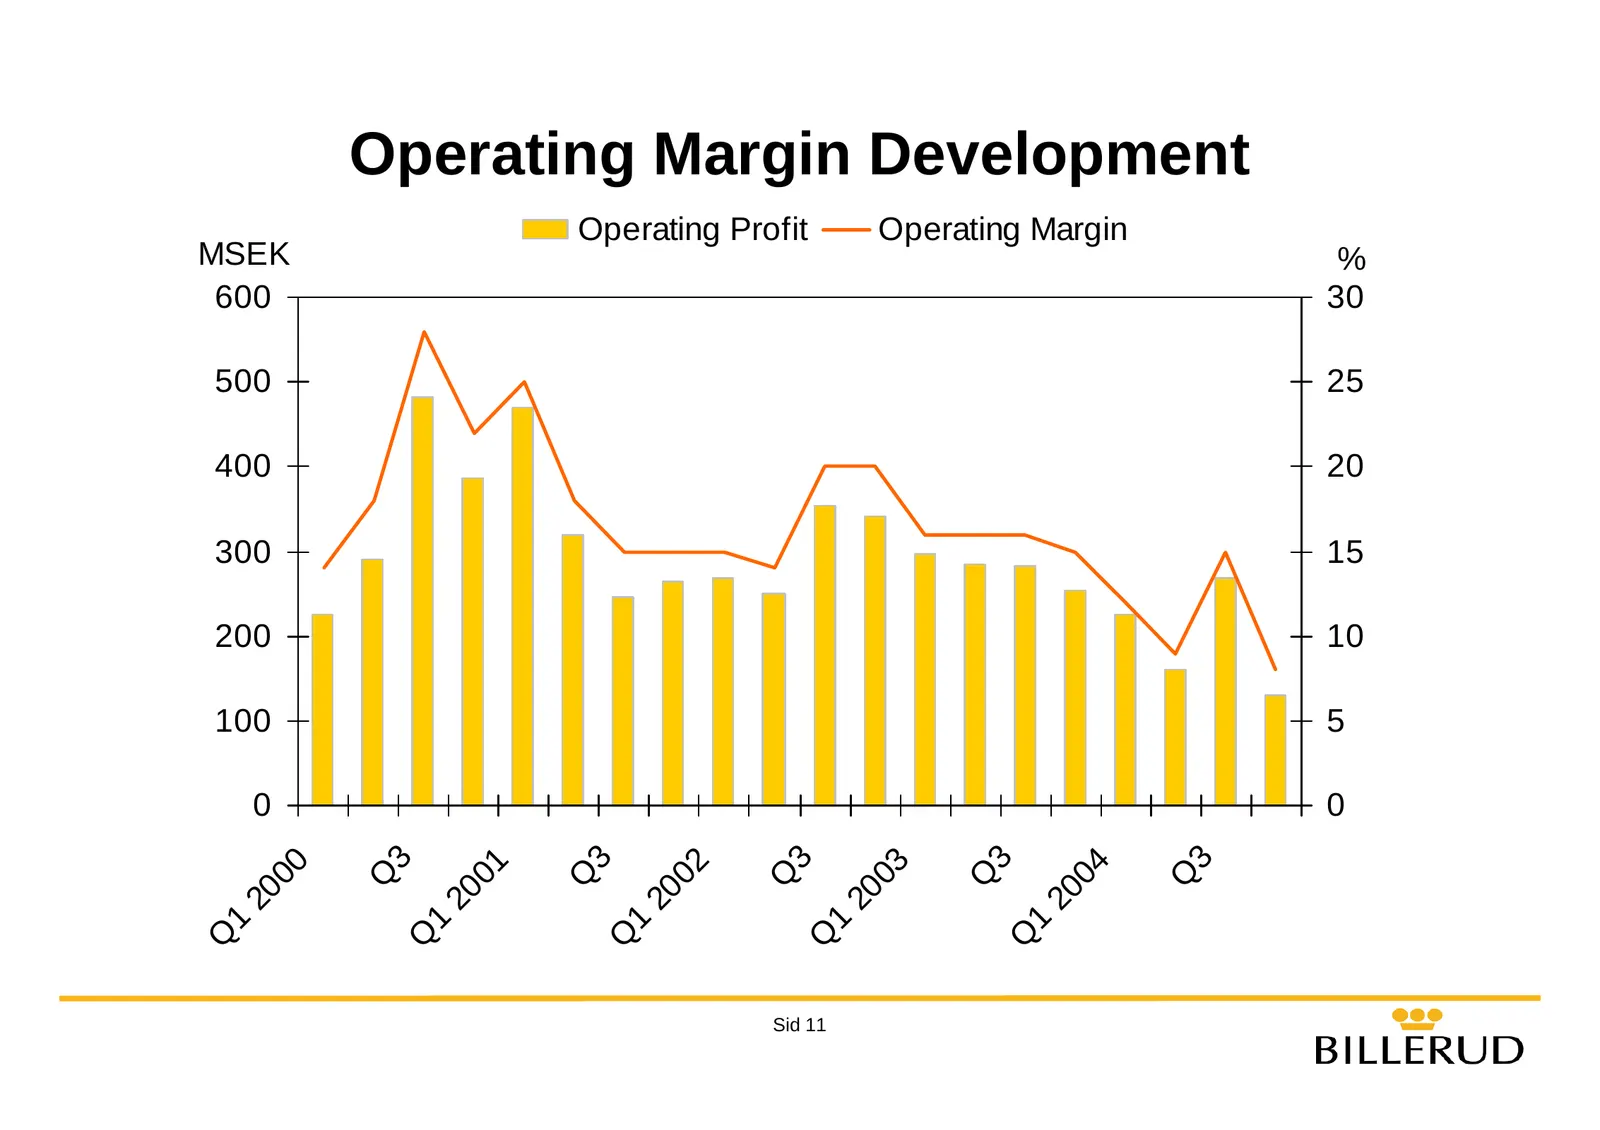
Operating Margin Development Operating Profit Operating Margin MSEK % 600 30 500 25 400 20 300 15 200 10 100 5 0 0 3 3 3 3 3 00 01 02 03 04 Q Q Q Q Q 20 20 20 20 20 1 1 1 1 1 Q Q Q Q Sid 11 Q
Slide 12: Cash Flow
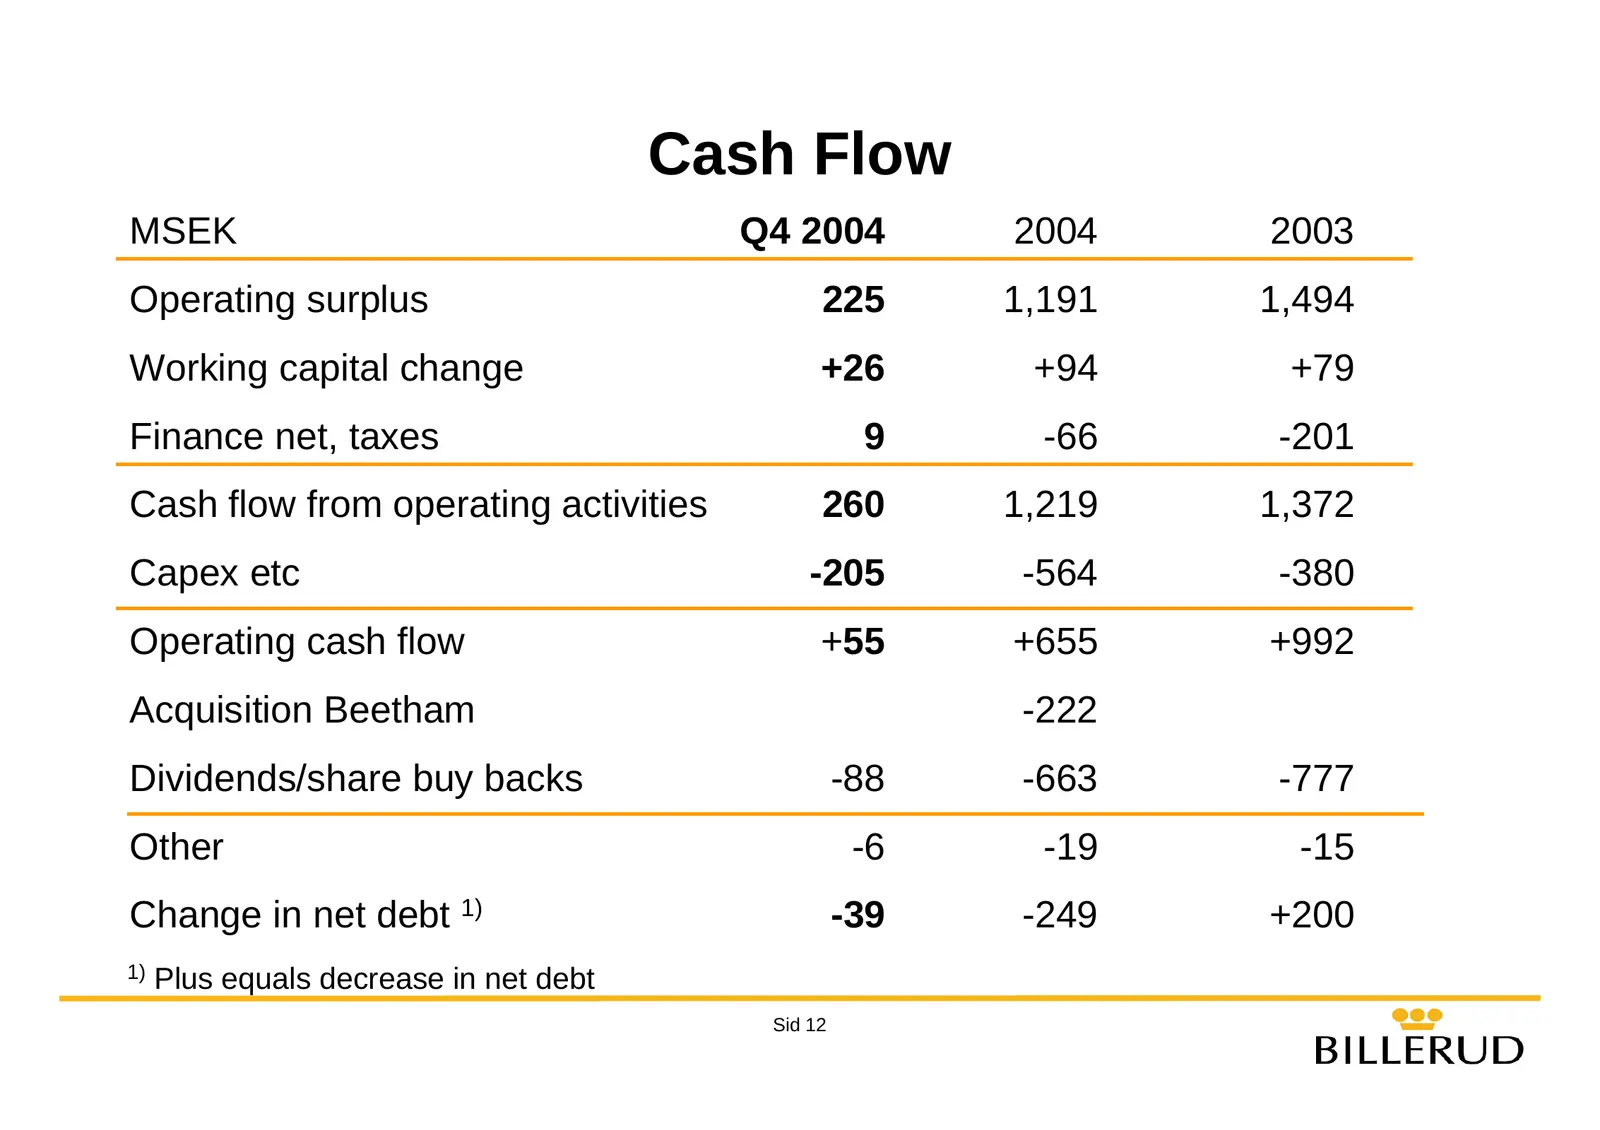
Cash Flow MSEK Q4 2004 2004 2003 Operating surplus 225 1,191 1,494 Working capital change +26 +94 +79 Finance net, taxes 9 -66 -201 Cash flow from operating activities 260 1,219 1,372 Capex etc -205 -564 -380 Operating cash flow +55 +655 +992 Acquisition Beetham -222 Dividends/share buy backs -88 -6
Slide 13: Currency Situation
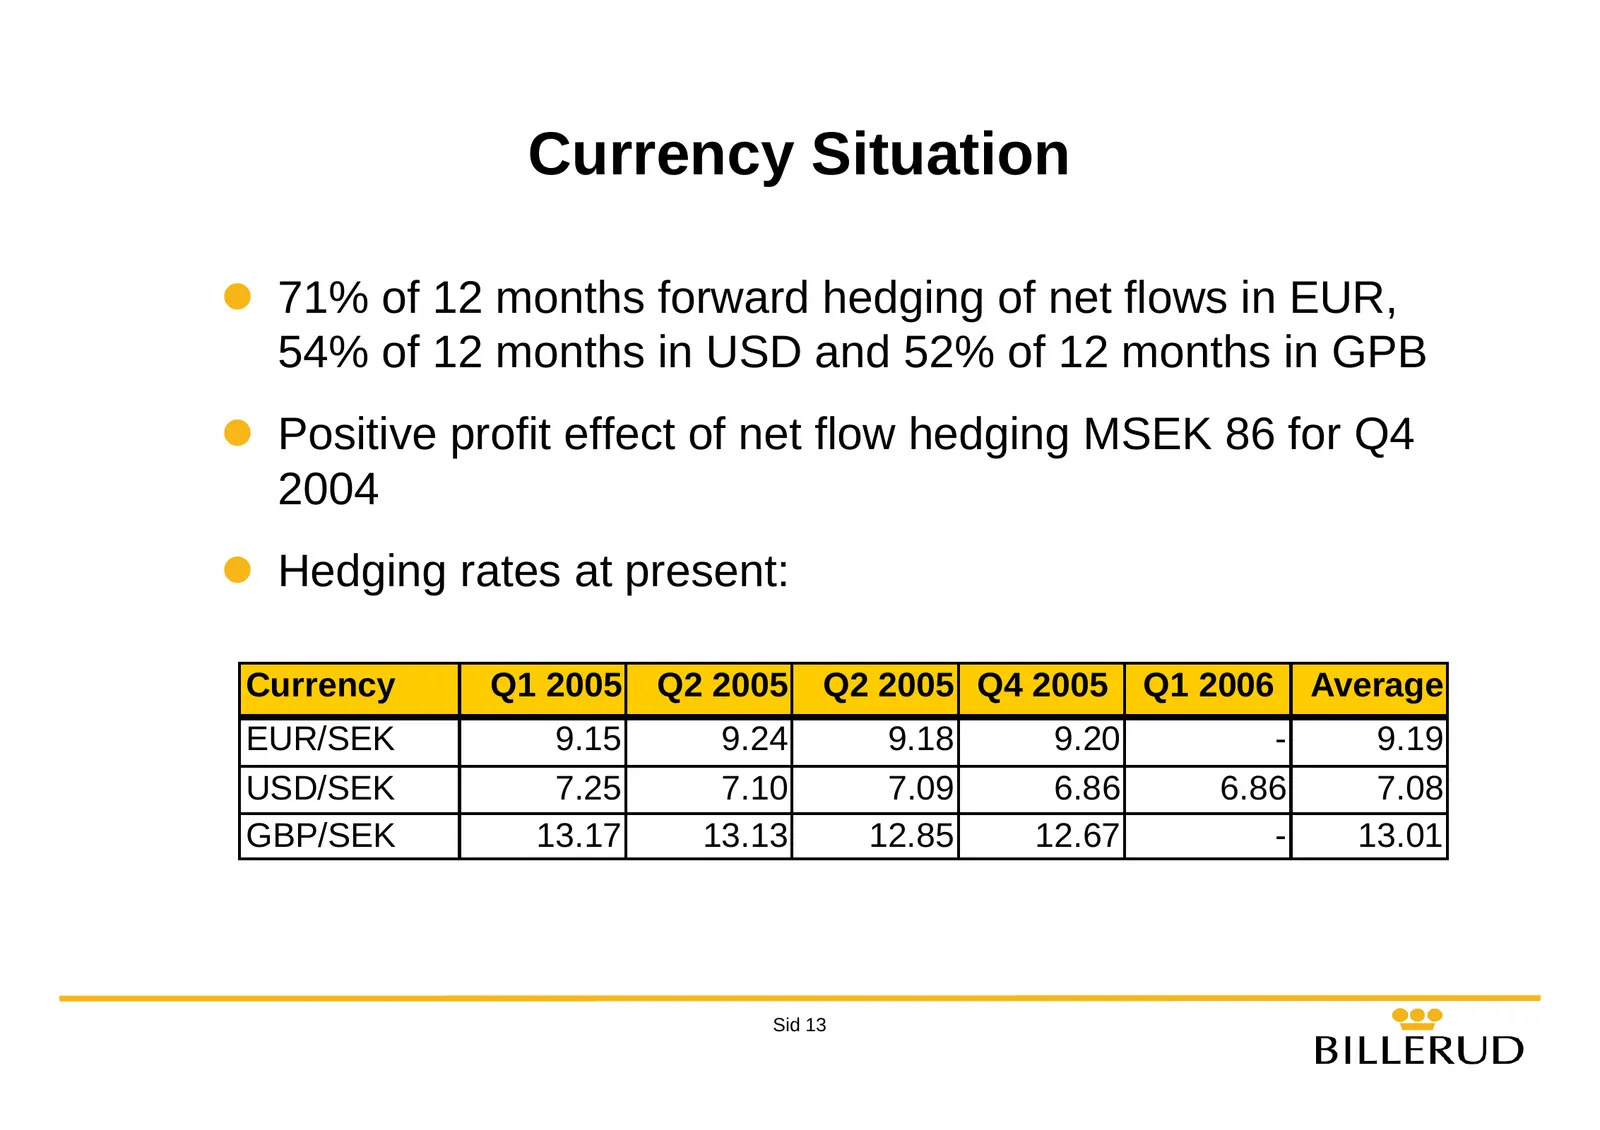
Currency Situation z 71% of 12 months forward hedging of net flows in EUR, 54% of 12 months in USD and 52% of 12 months in GPB z Positive profit effect of net flow hedging MSEK 86 for Q4 2004 z Hedging rates at present: Currency Q1 2005 Q2 2005 Q2 2005 Q4 2005 Q1 2006 Average EUR/SEK 9.15 9.24 9.18
Slide 14: Share Buy-Back Programme
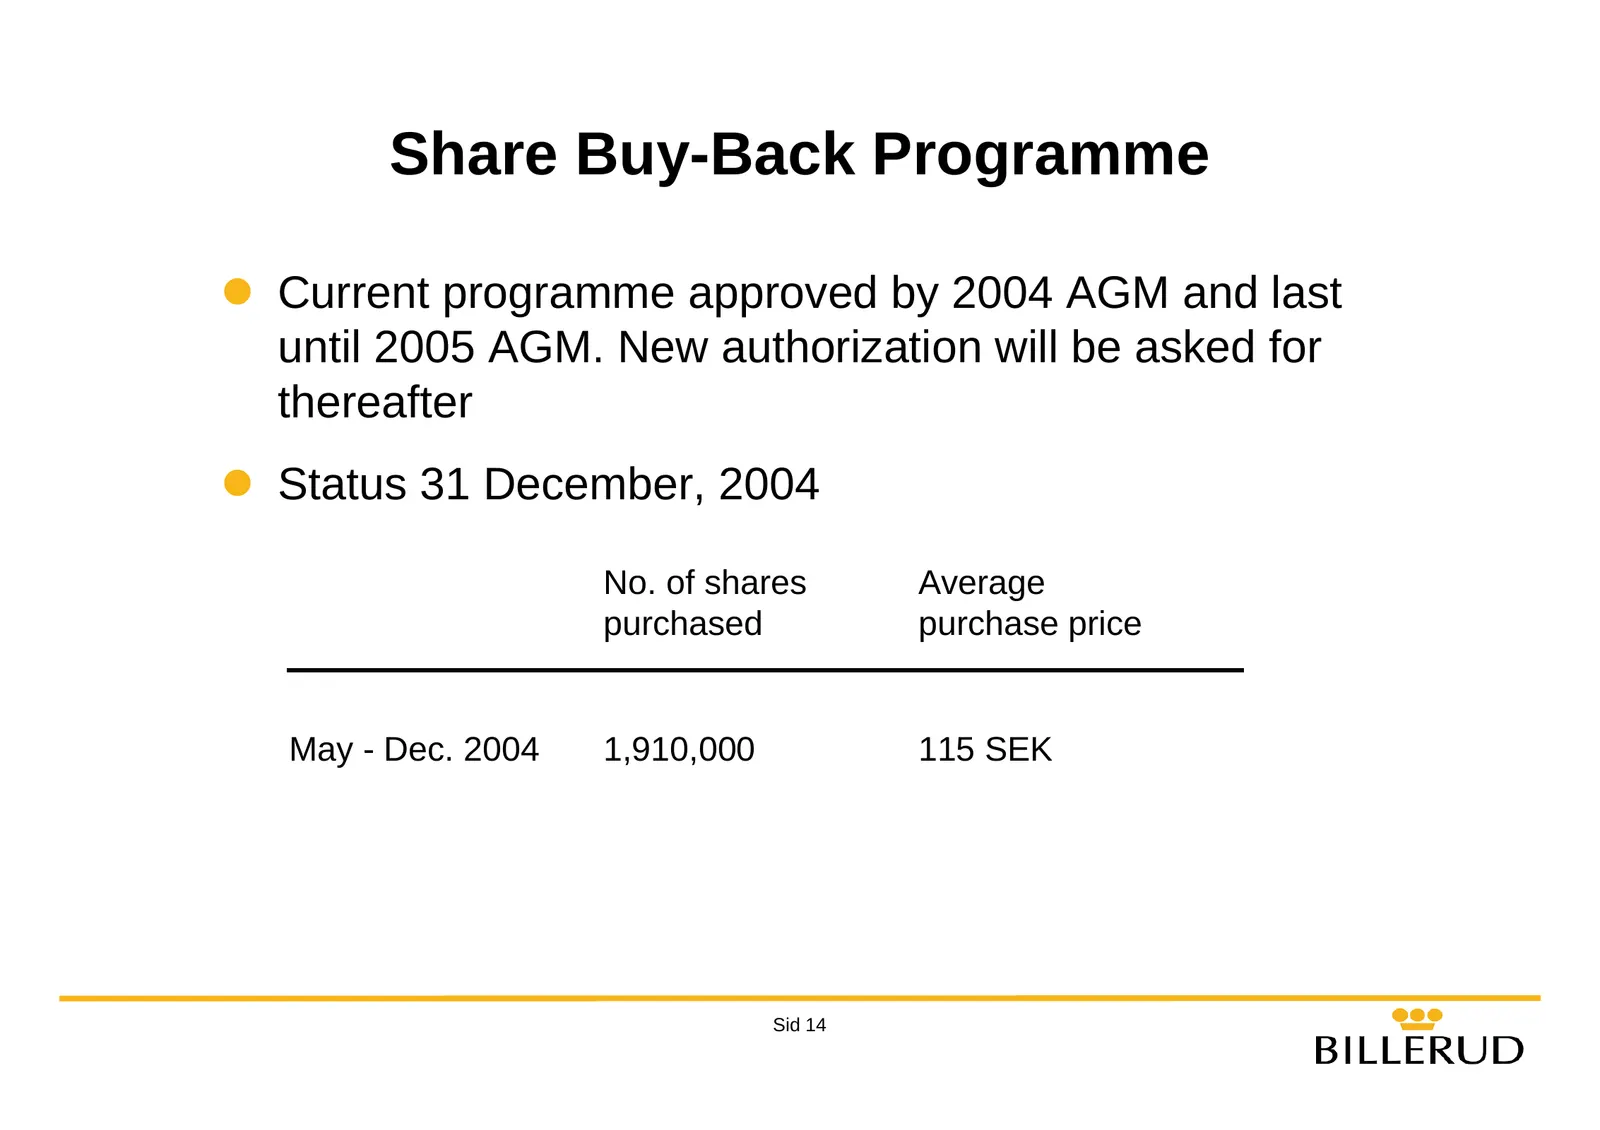
Share Buy-Back Programme z Current programme approved by 2004 AGM and last until 2005 AGM. New authorization will be asked for thereafter z Status 31 December, 2004 No. of shares Average purchased purchase price May - Dec. 2004 1,910,000 115 SEK Sid 14
Slide 15: Financial Objectives
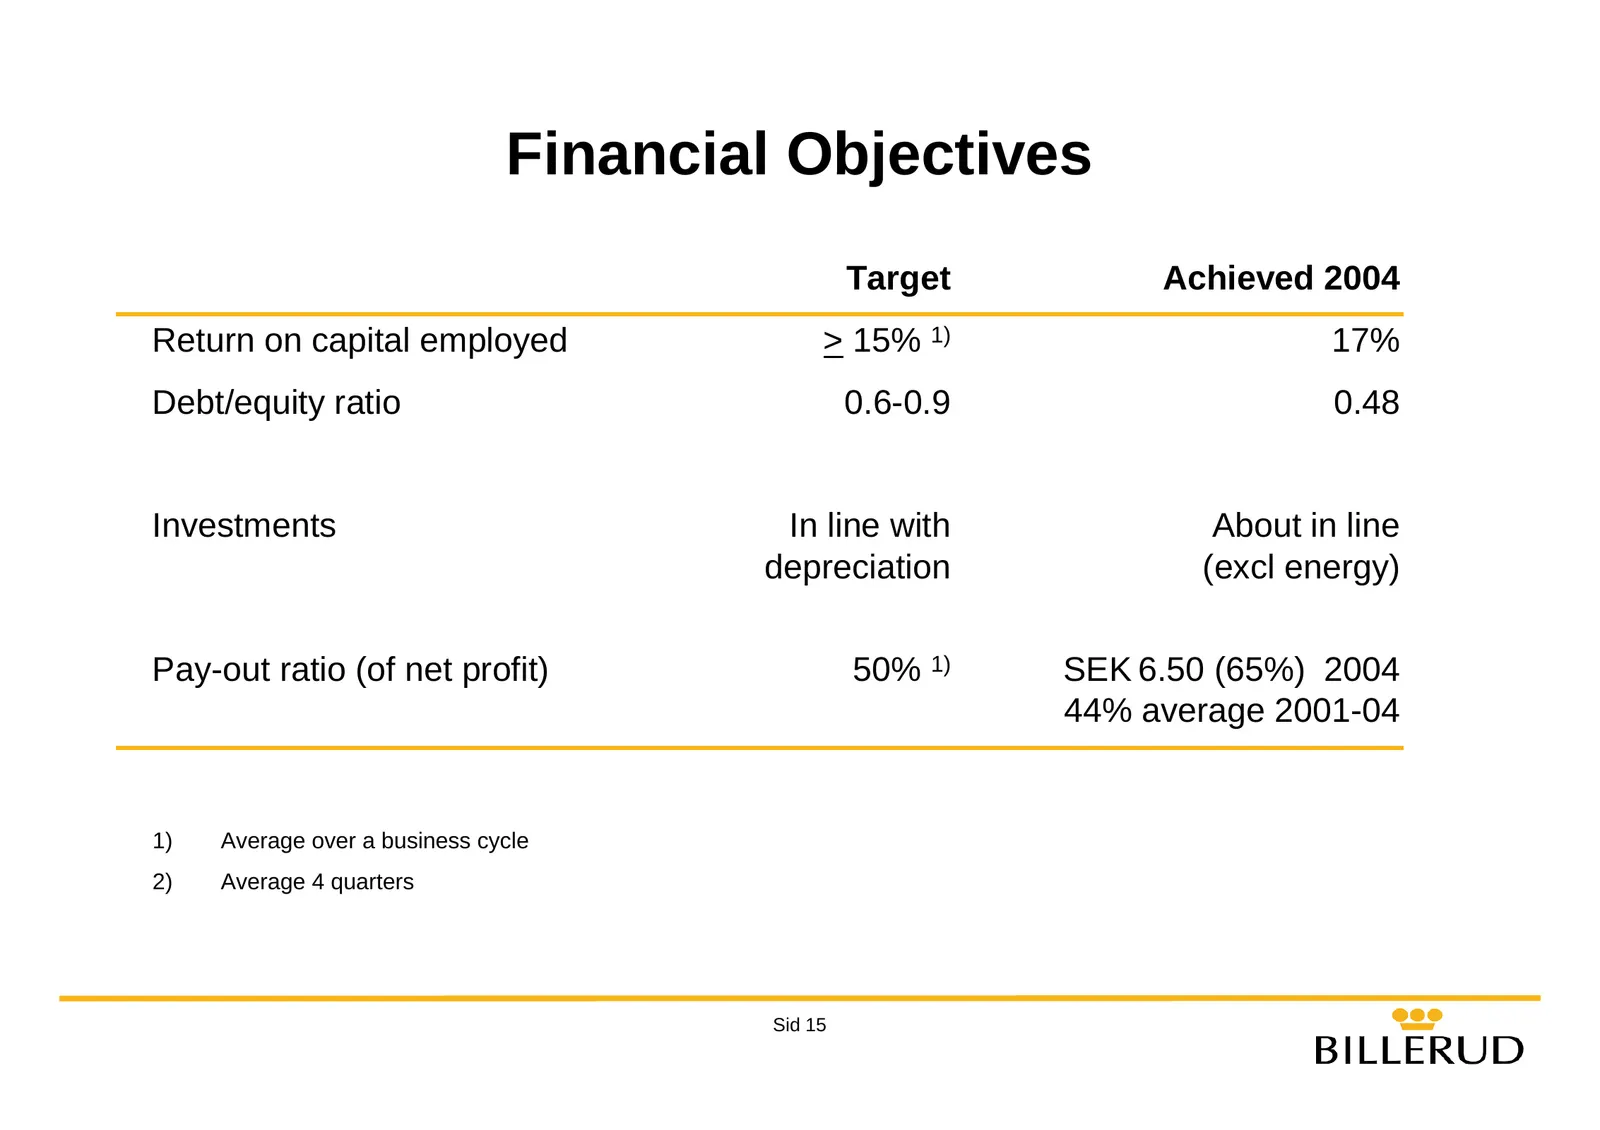
Financial Objectives Target Achieved 2004 Return on capital employed > 15% 1) 17% Debt/equity ratio 0.6-0.9 0.48 Investments In line with About in line depreciation (excl energy) Pay-out ratio (of net profit) 50% 1) SEK 6.50 (65%) 2004 44% average 2001-04 1) Average over a business cycle 2) Average
Slide 16: Outlook
Outlook Sid 16 ee BILLERUD
Slide 17: Outlook
Outlook . z Deliveries 2005 about same level as 2004 z Prices for NBSK expected to rise to USD 660 from Feb and continue to increase until at least mid-year z Pulp price increases normally have a positive effect on packaging papers z Today difficult to assess the January storm’s effect on Billerud’s
Slide 18: Billerud Key Strengths
Billerud Key Strengths z Strong market position in attractive segments – >50% of turnover in segments where Billerud is No. 1 or 2 in Europe – Markets with stable growth and low capacity additions – Few focused competitors z Competitive production – Well invested mills – Economies of scale – Integra
Slide 19: Billerud January – December 2004
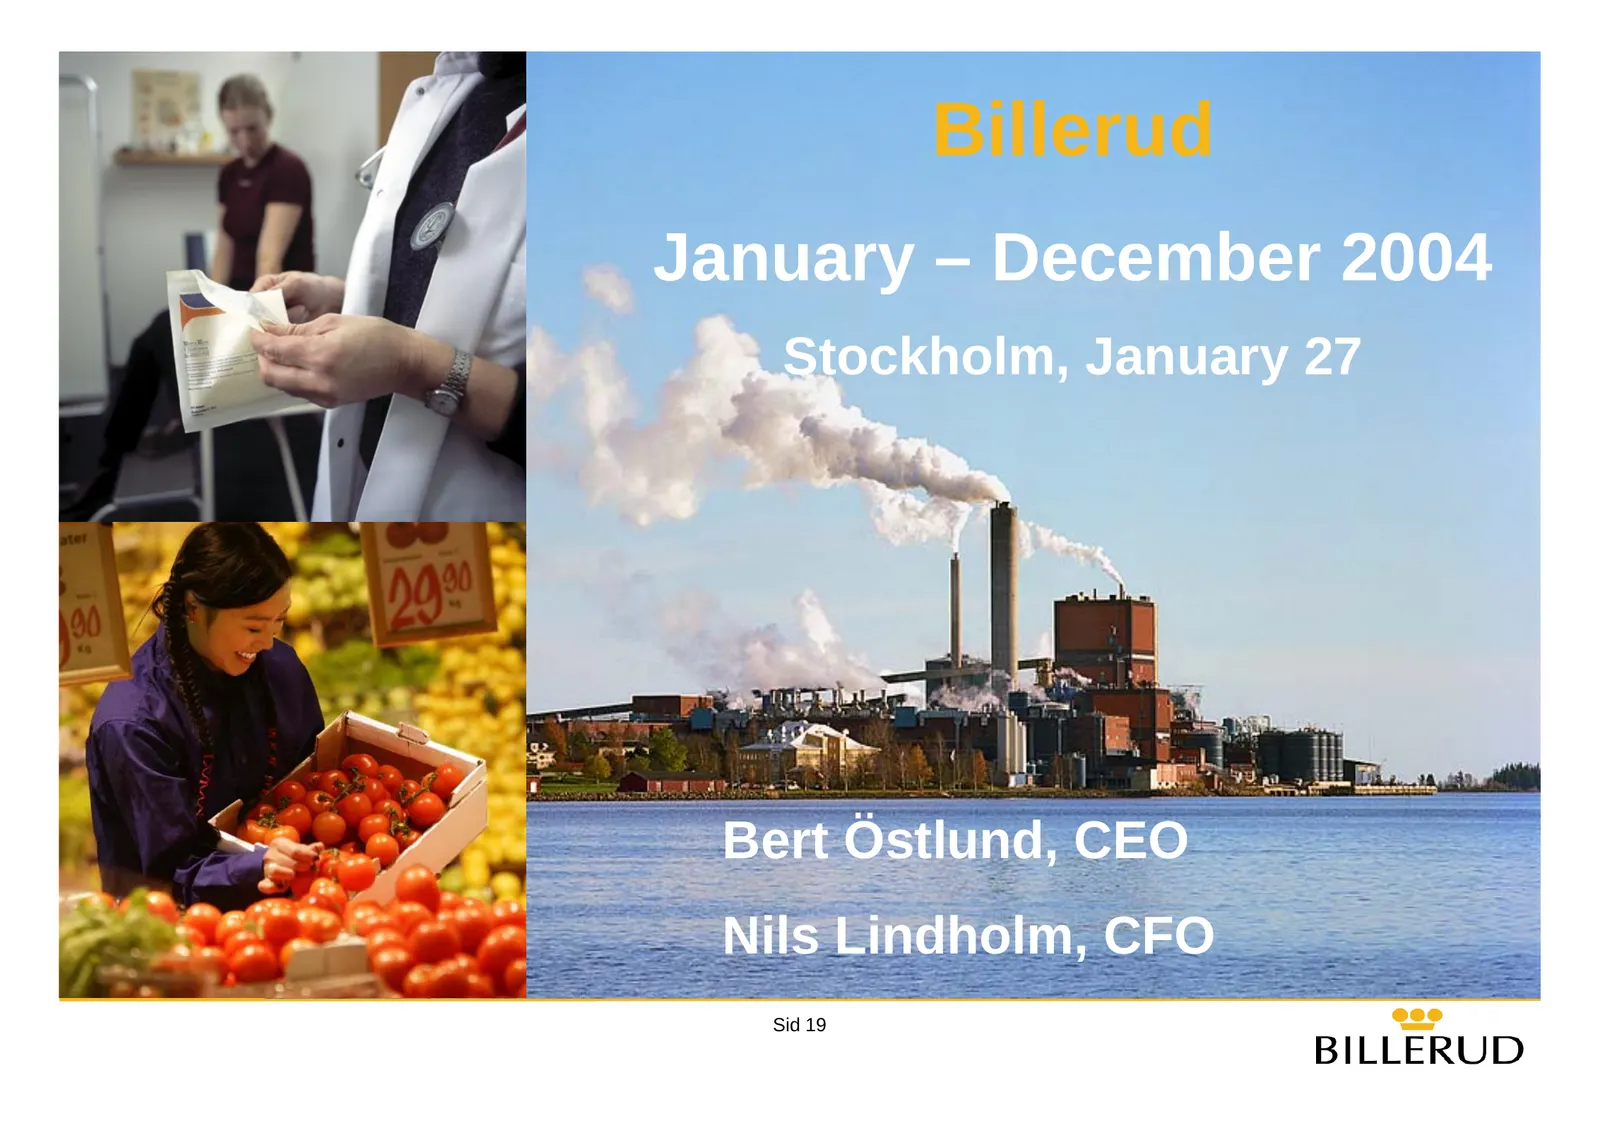
Billerud January – December 2004 Stockholm, January 27 Bert Östlund, CEO Nils Lindholm, CFO Sid 19
Slide 20: Appendix
- Appendix - BILLERUD Sid 20
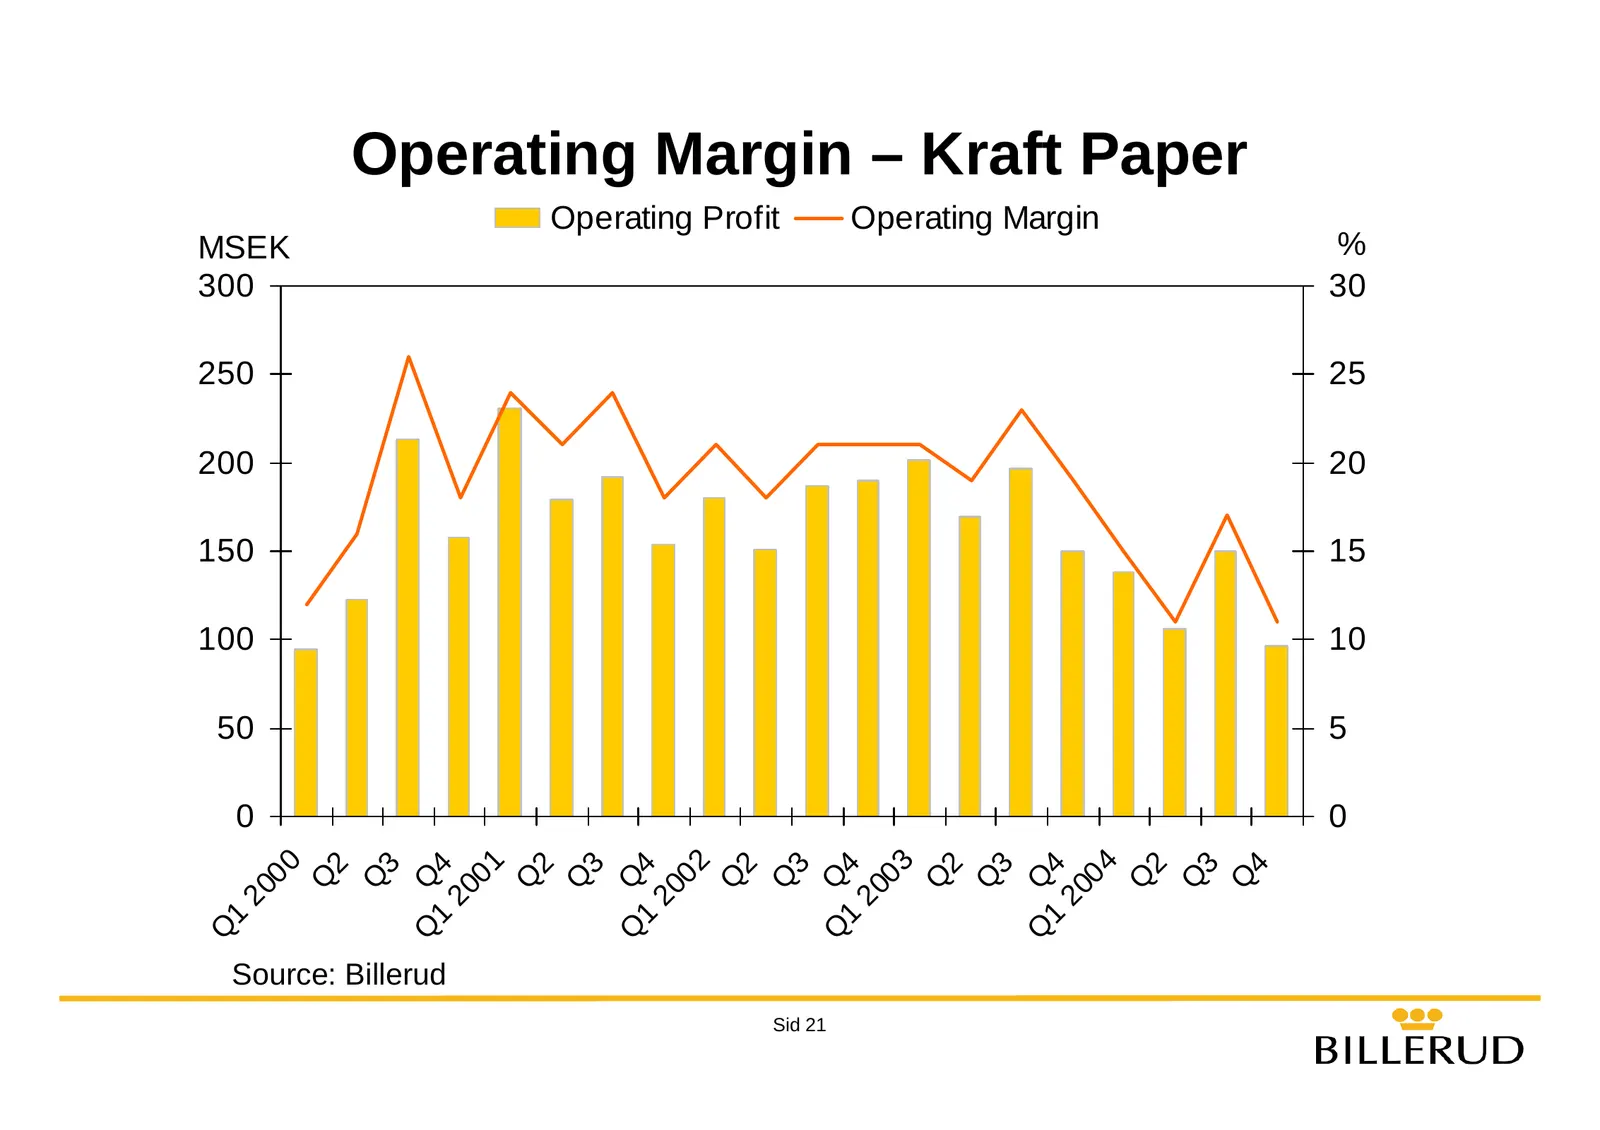
Slide 21: Operating Margin – Kraft Paper
Operating Margin – Kraft Paper Operating Profit Operating Margin MSEK % 300 30 250 25 200 20 150 15 100 10 50 5 0 0 00 01 02 03 04 2 3 1 4 2 3 Q Q4 2 3 Q Q4 2 3 1 4 2 3 4 Q Q Q Q Q Q Q Q Q Q Q Q Q Q Q 20 20 20 20 20 1 1 1 Q Source: Billerud Sid 21
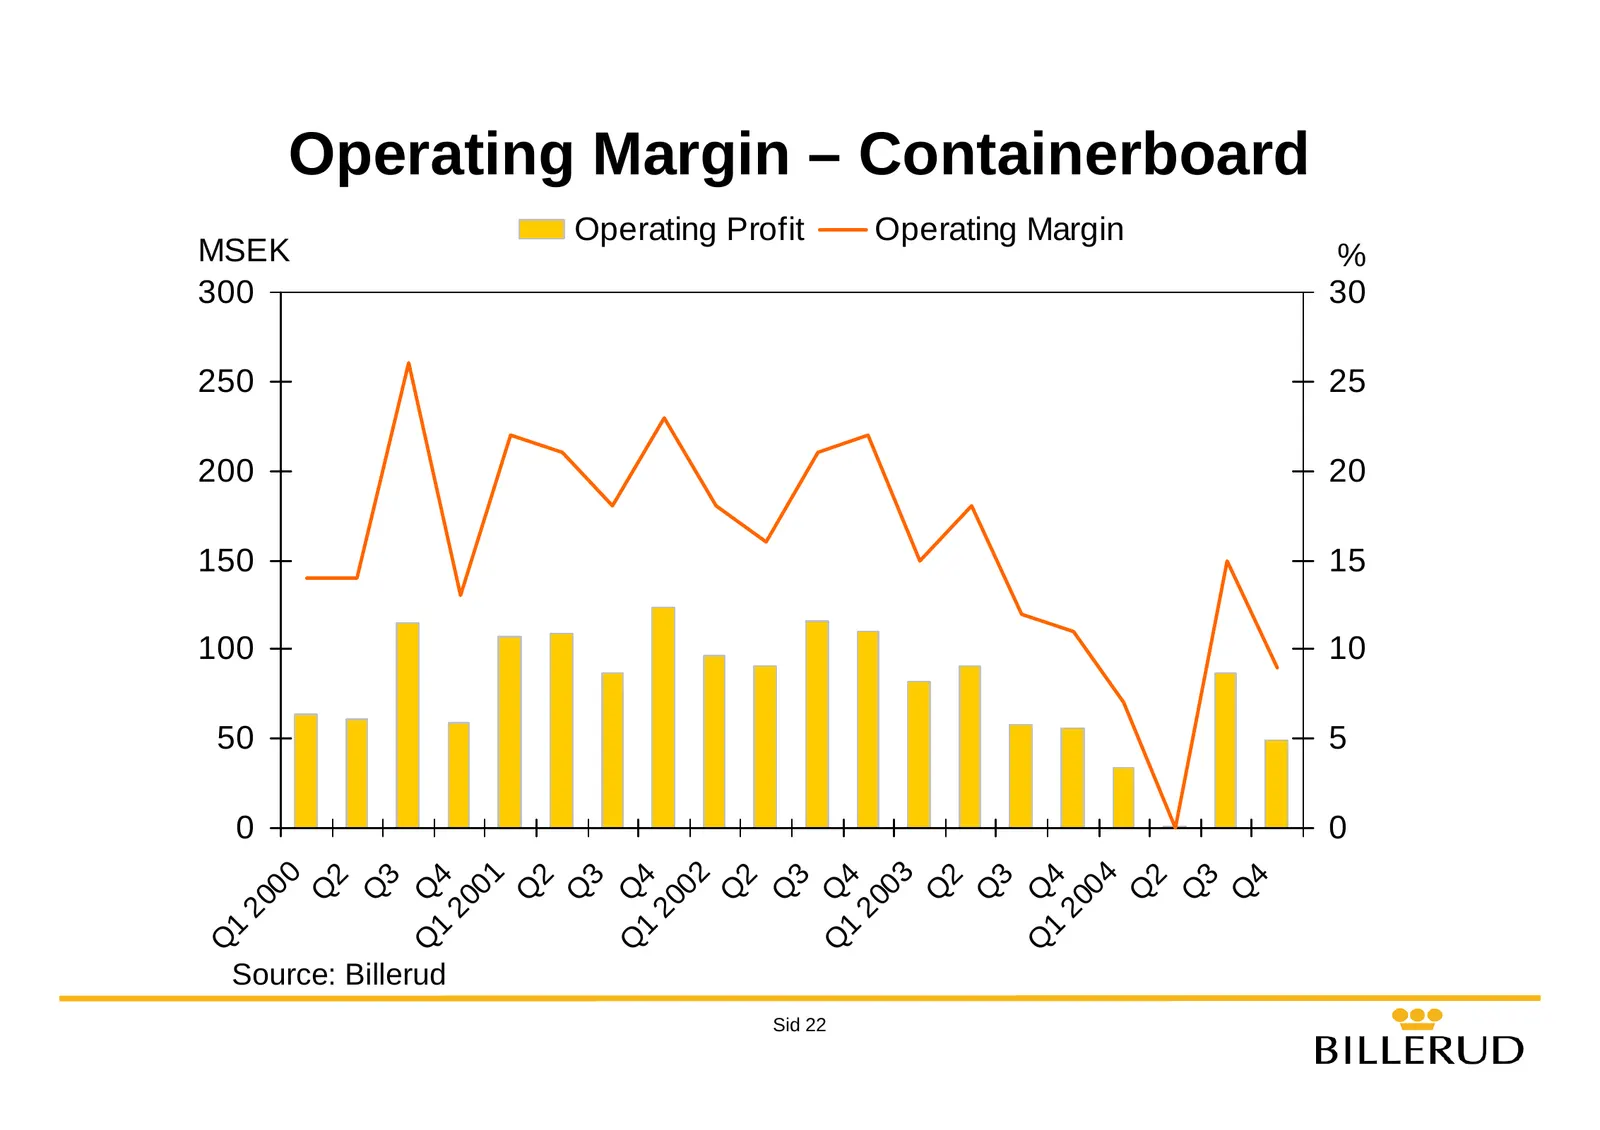
Slide 22: Operating Margin – Containerboard
Operating Margin – Containerboard Operating Profit Operating Margin MSEK % 300 30 250 25 200 20 150 15 100 10 50 5 0 0 00 01 02 03 04 2 3 1 4 2 3 Q Q4 2 3 Q Q4 2 3 1 4 2 3 4 Q Q Q Q Q Q Q Q Q Q Q Q Q Q Q 20 20 20 20 20 1 1 1 Q Source: Billerud Sid 22
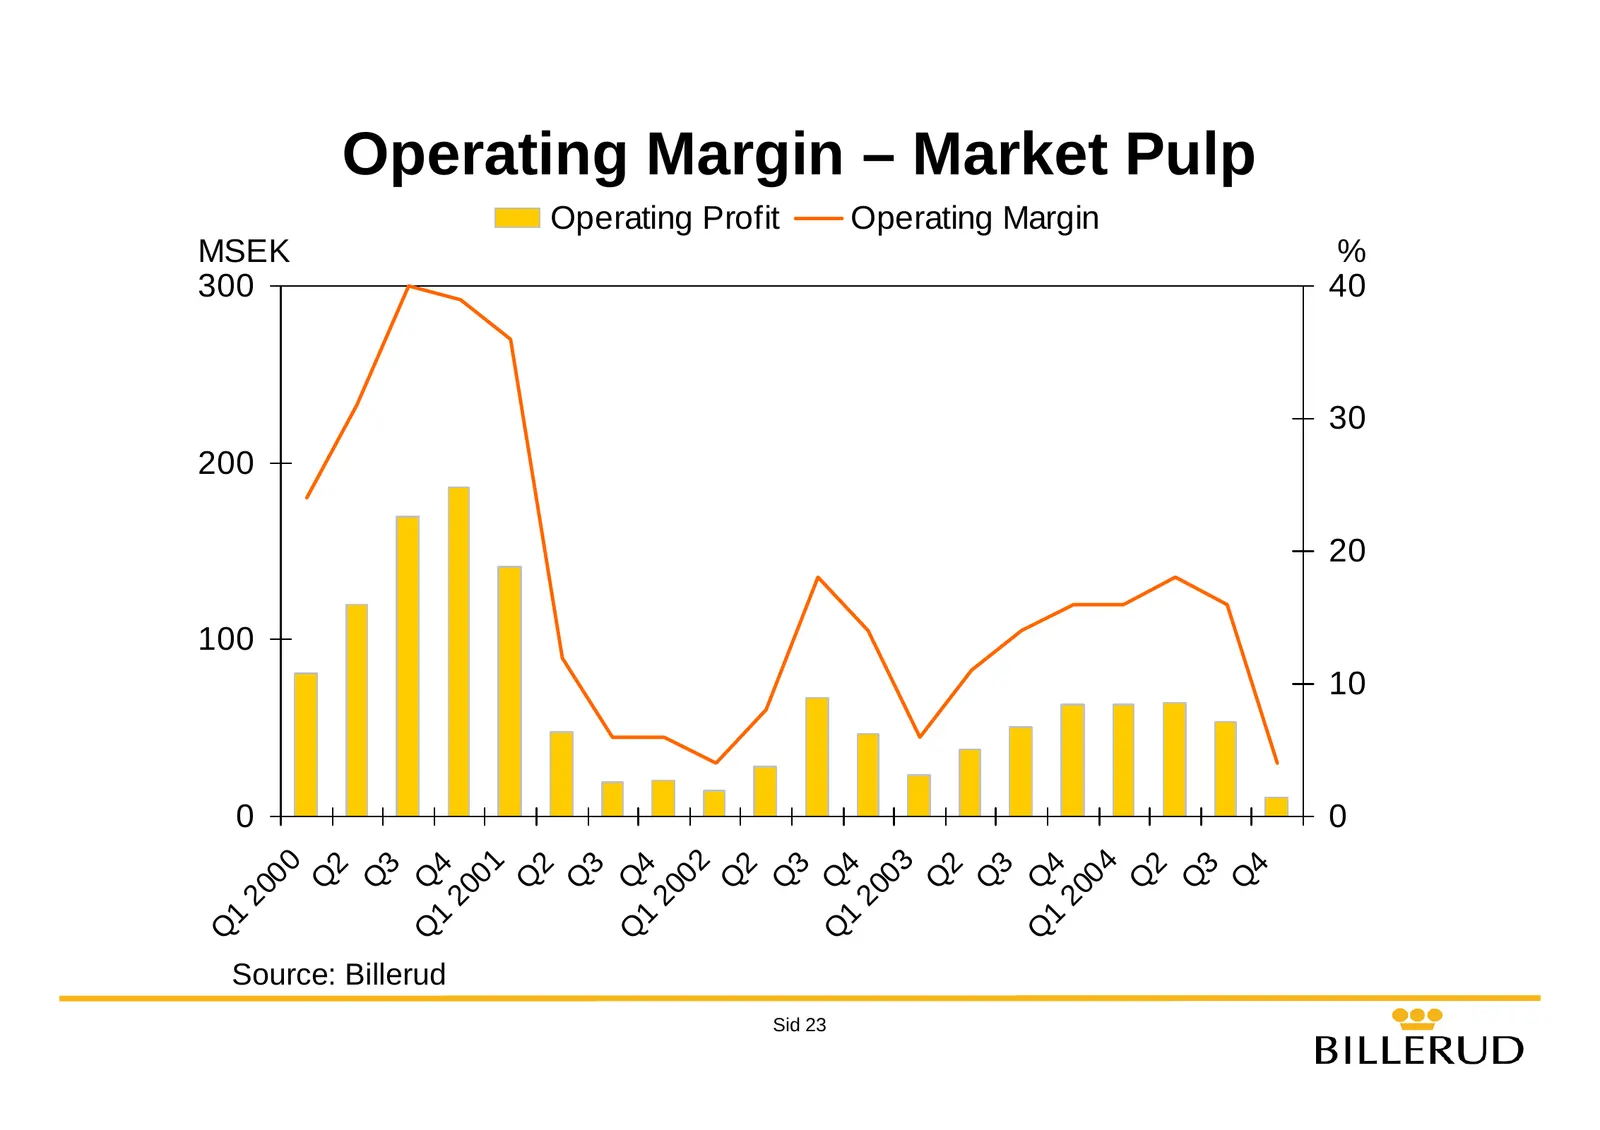
Slide 23: Operating Margin – Market Pulp
Operating Margin – Market Pulp Operating Profit Operating Margin MSEK % 300 40 30 200 20 100 10 0 0 00 01 02 03 04 2 3 1 4 2 3 Q Q4 2 3 Q Q4 2 3 1 4 2 3 4 Q Q Q Q Q Q Q Q Q Q Q Q Q Q Q 20 20 20 20 20 1 1 1 Q Source: Billerud Sid 23
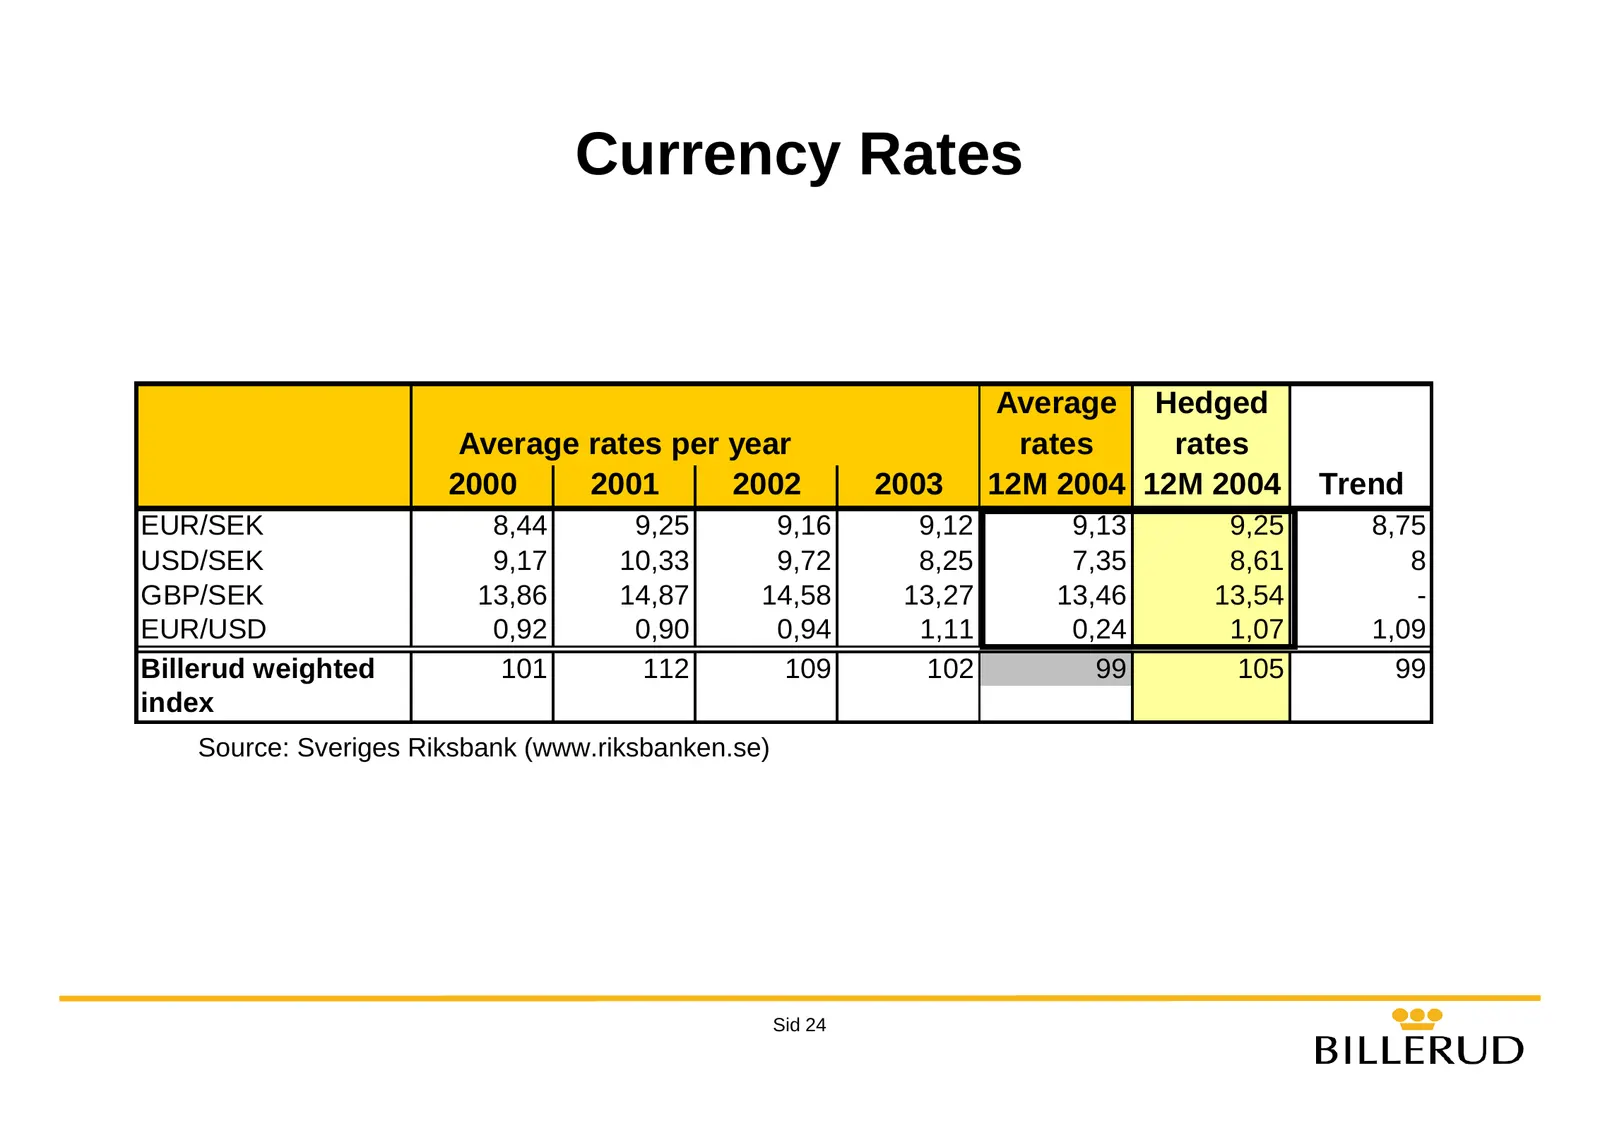
Slide 24: Currency Rates
Currency Rates Average Hedged Average rates per year rates rates 2000 2001 2002 2003 12M 2004 12M 2004 Trend EUR/SEK 8,44 9,25 9,16 9,12 9,13 9,25 8,75 USD/SEK 9,17 10,33 9,72 8,25 7,35 8,61 8 GBP/SEK 13,86 14,87 14,58 13,27 13,46 13,54 - EUR/USD 0,92 0,90 0,94 1,11 0,24 1,07 1,09 Billerud weighted
Slide 25: Delivered Volumes
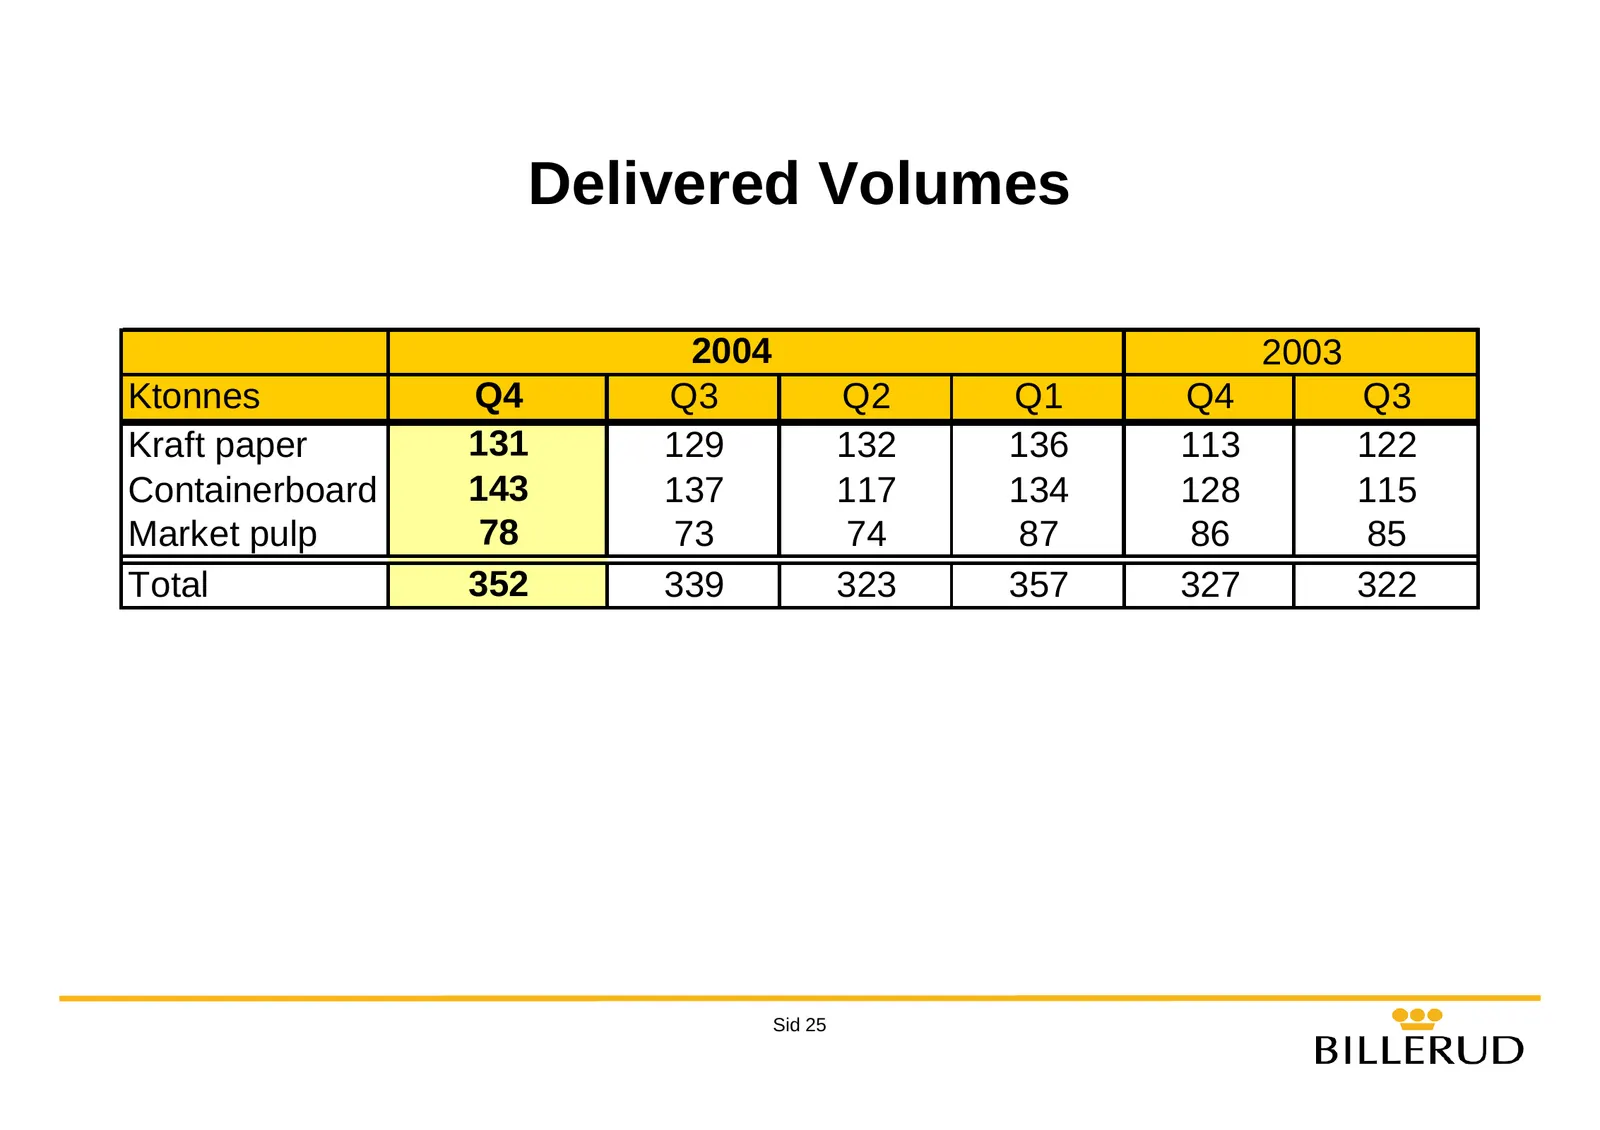
Delivered Volumes 2004 2003 Ktonnes Q4 Q3 Q2 Q1 Q4 Q3 Kraft paper 131 129 132 136 113 122 Containerboard 143 137 117 134 128 115 Market pulp 78 73 74 87 86 85 Total 352 339 323 357 327 322 Sid 25
Slide 26: Billerud vs. Forestry index
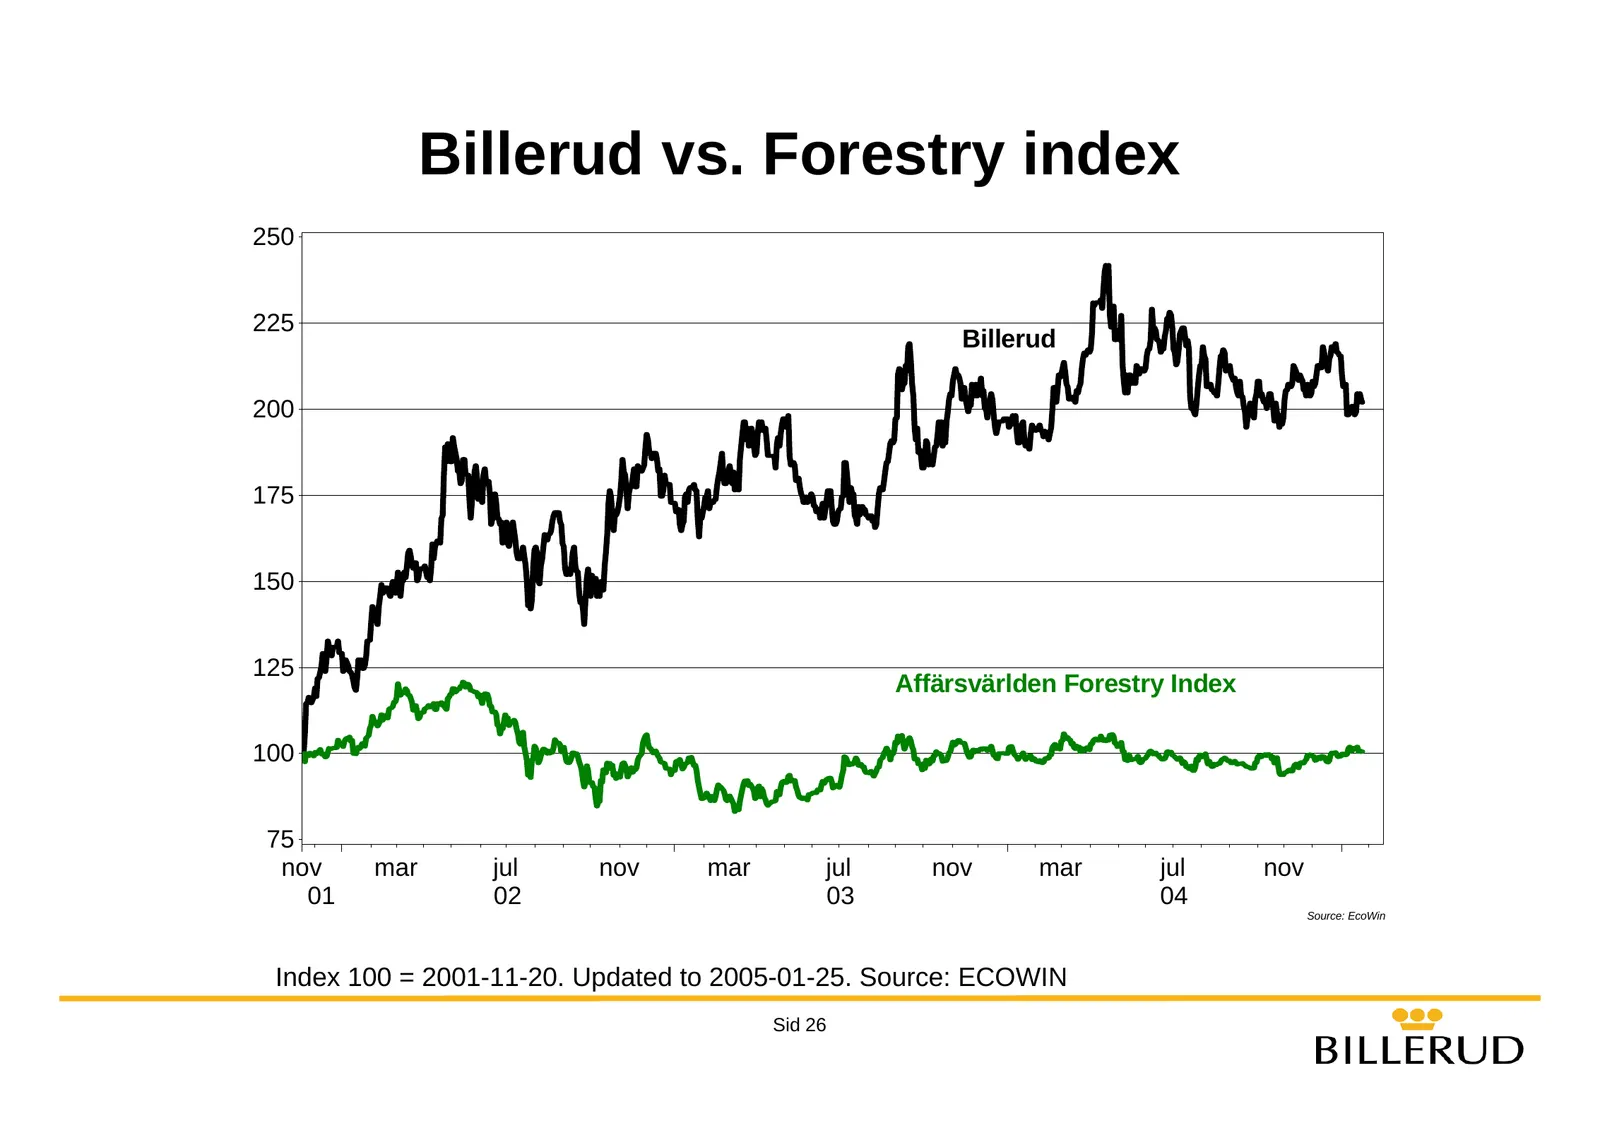
Billerud vs. Forestry index 250 225 Billerud 200 175 150 125 Affärsvärlden Forestry Index 100 75 nov mar jul nov mar jul nov mar jul nov 01 02 03 04 Source: EcoWin Index 100 = 2001-11-20. Updated to 2005-01-25. Source: ECOWIN Sid 26
Source: Internet Archive copy of billerud.se
More decks from Billerud AB
 Q3 2026 Earnings Presentation16 slides · Oct 22, 2026
 Q2 2026 Earnings Presentation17 slides · Jul 17, 2026
 Q1 2026 Earnings Presentation17 slides · Apr 28, 2026
 Q4 2025 Earnings Presentation21 slides · Jan 30, 2026
 DNB Carnegie Nordic Forest Conference 202515 slides · Nov 12, 2025
 Q3 2025 Earnings Presentation18 slides · Oct 23, 2025